
The Daily Shot: 04-Aug-22
• The United States
• The Eurozone
• Europe
• Asia – Pacific
• China
• Emerging Markets
• Cryptocurrency
• Energy
• Equities
• Rates
• Food for Thought
The United States
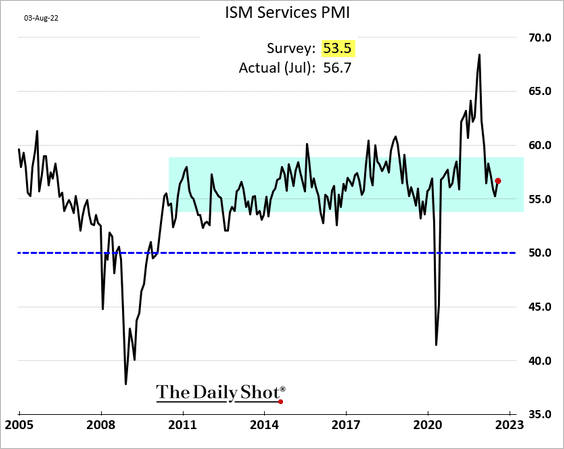
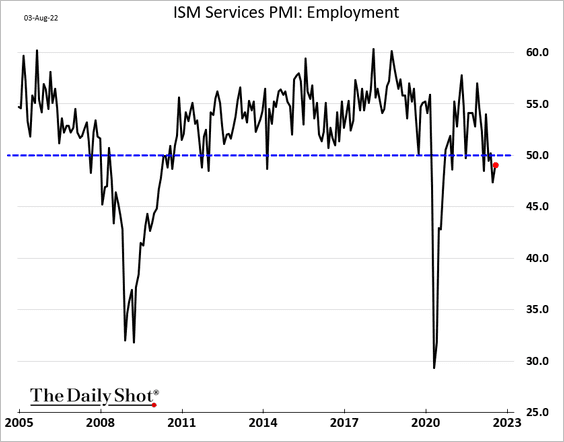
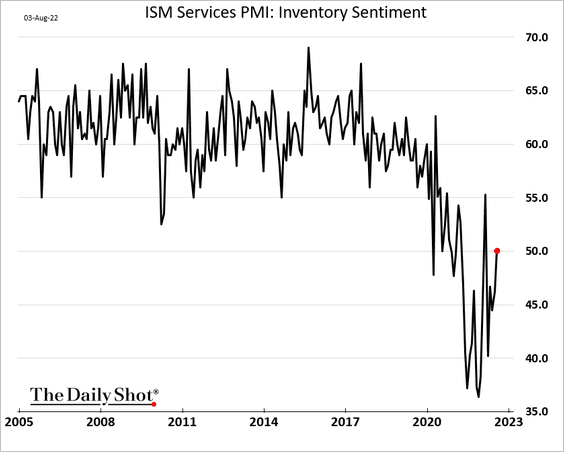
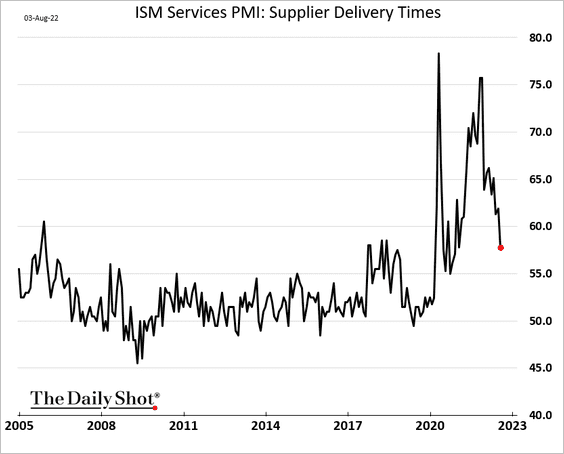
1. The July ISM Services PMI topped expectations. The report is not signaling a recession.
 Source: @TheTerminal, Bloomberg Finance L.P.
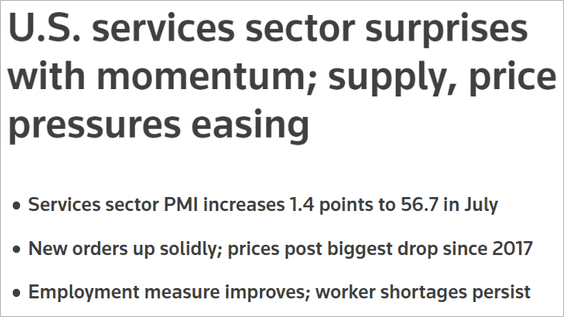 Source: Reuters Read full article
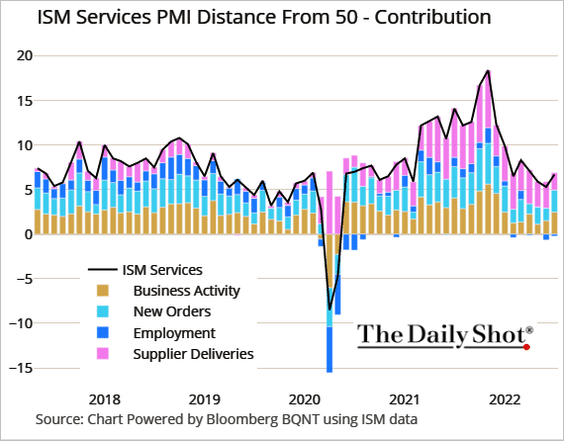
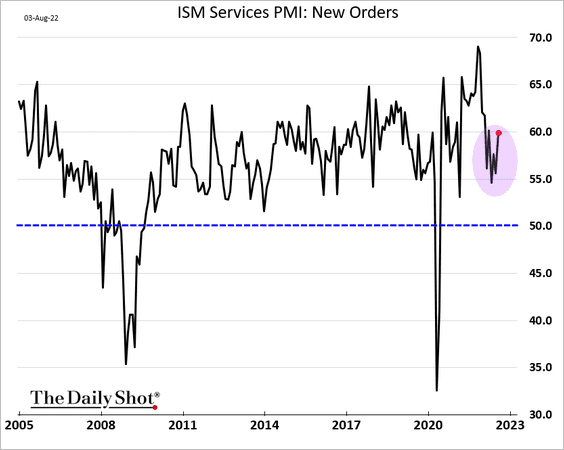
• New orders accelerated.
• Hiring is still depressed, in part due to worker shortages.
• Businesses are more comfortable with their inventory levels.
• Supply bottlenecks are easing.
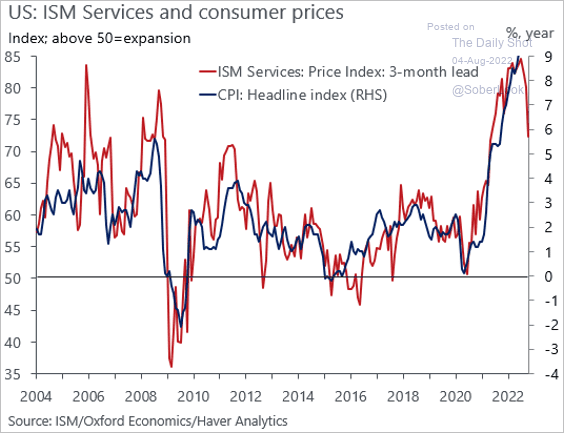
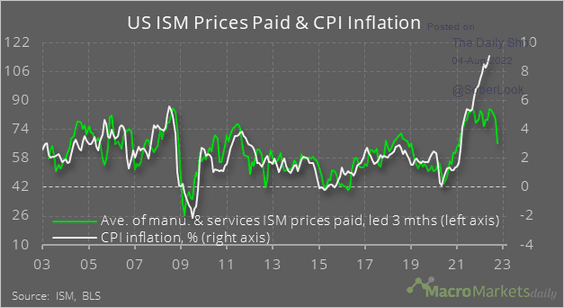
• Price pressures are starting to moderate …
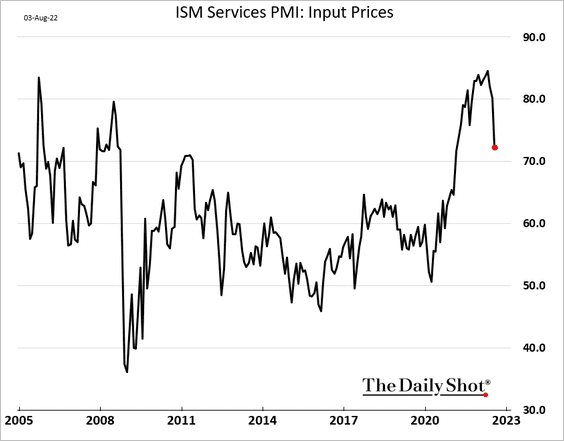
… which should help ease downstream inflation (2 charts).
 Source: @OrenKlachkin
 Source: @macro_daily
2. While the ISM report is signaling strength in the US services sector, a competing indicator from S&P Global (Markit) shows just the opposite.
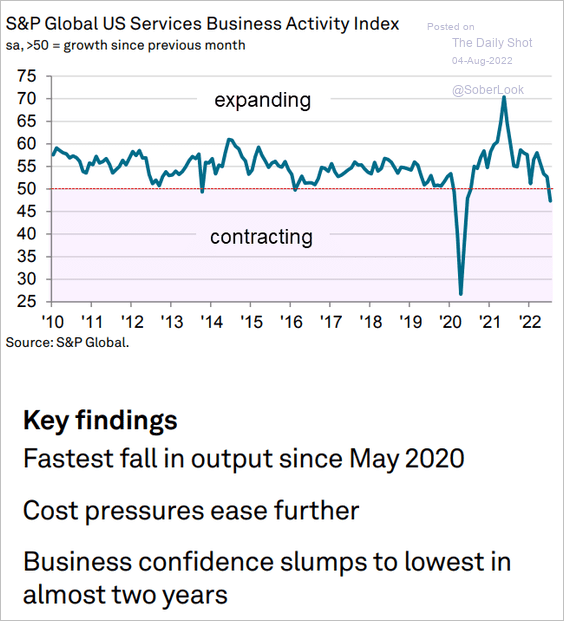 Source: S&P Global PMI
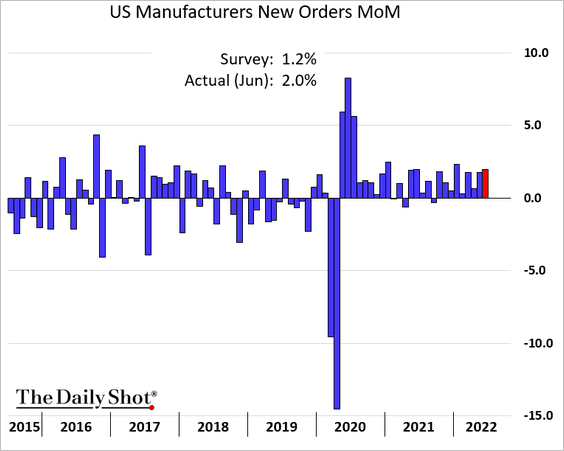
3. June factory orders surprised to the upside.
4. Switching to the housing market …
• Mortgage applications have reset lower but are not crashing.
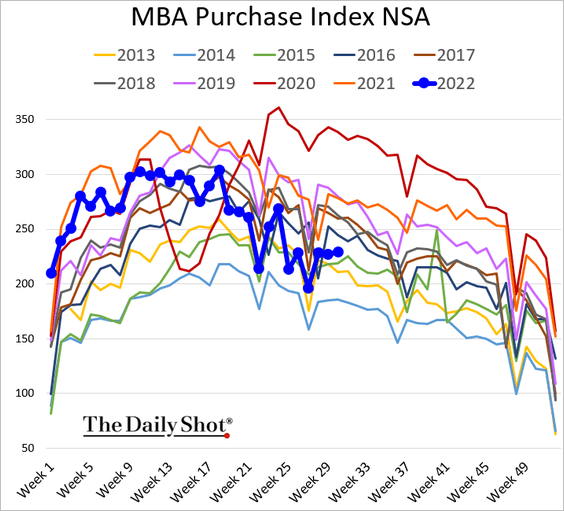
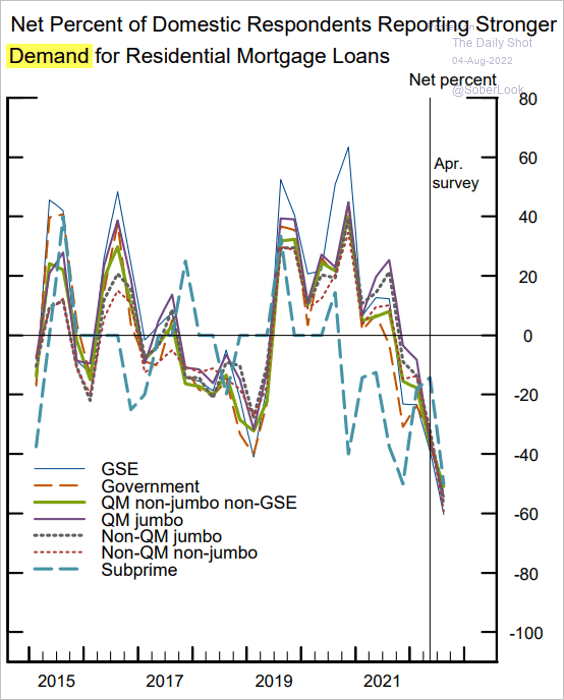
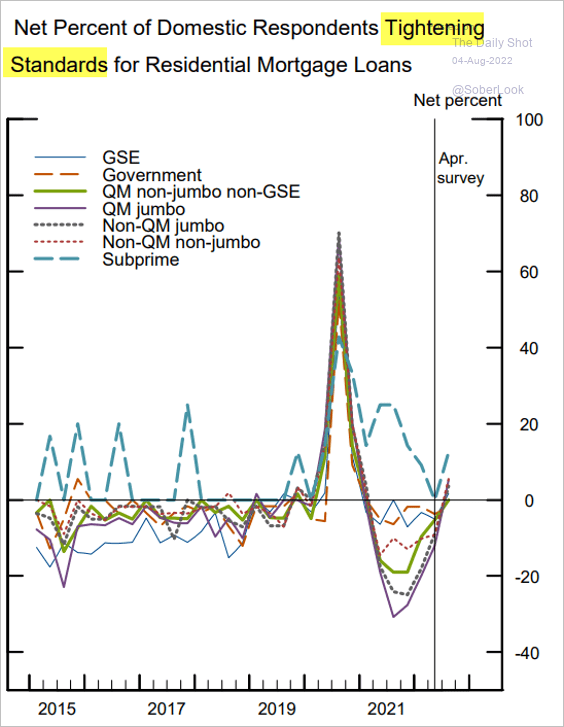
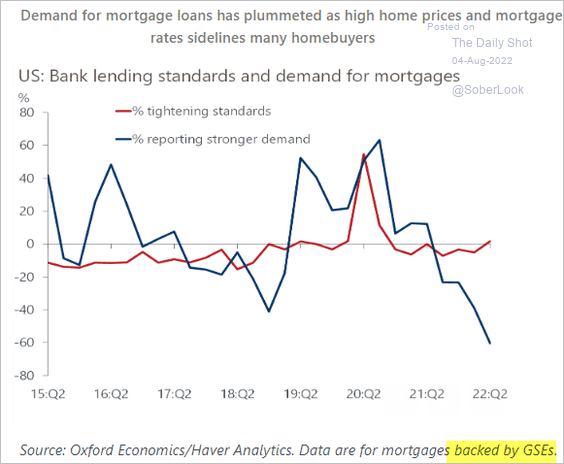
• Mortgage demand has been slowing, and banks have been tightening standards on housing loans (3 charts).
 Source: Board of Governors of The Federal Reserve System
 Source: Board of Governors of The Federal Reserve System
 Source: Oxford Economics
• Will mortgage rates dip below 5%?
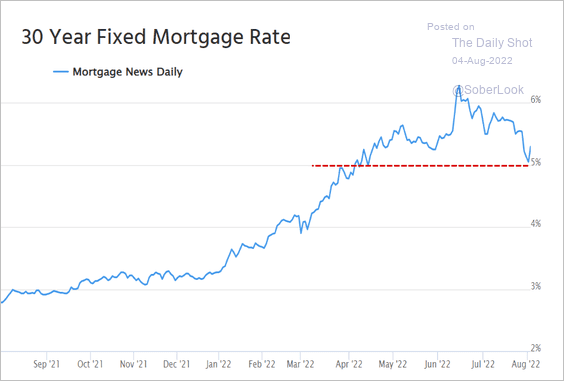 Source: Mortgage News Daily
• Next, we have mortgage originations by credit score and by price tier.
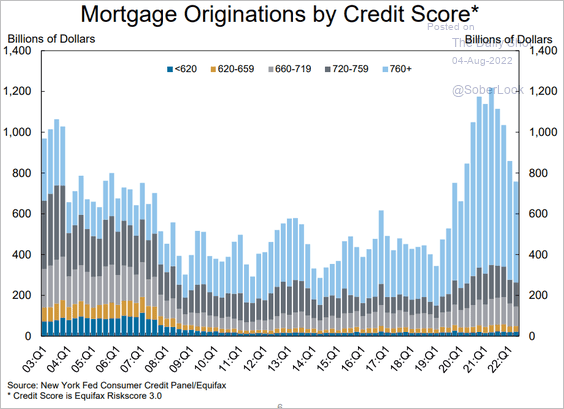 Source: Federal Reserve Bank of New York
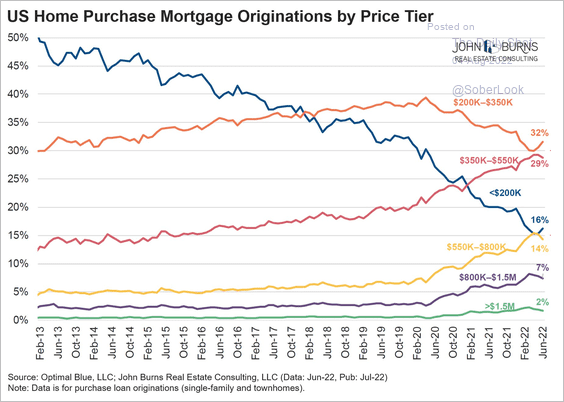 Source: @RickPalaciosJr
• Home sales are expected to ease further.
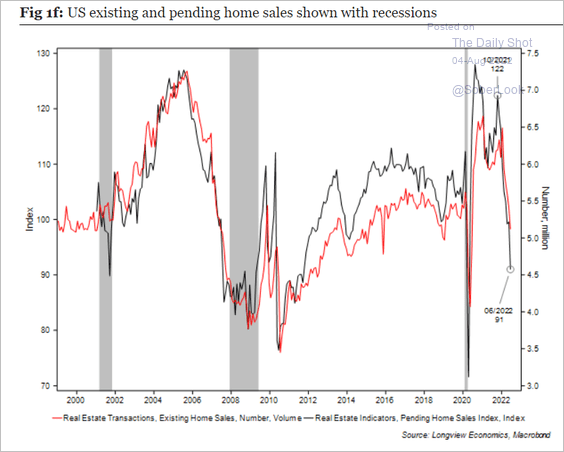 Source: Longview Economics
• Homebuilder sentiment continues to deteriorate, according to a survey from Evercore ISI.
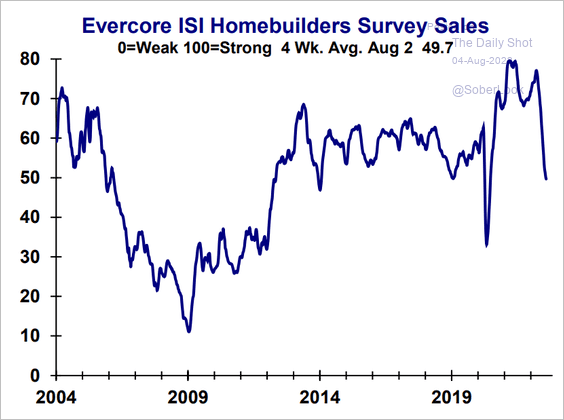 Source: Evercore ISI Research
• CoreLogic doesn’t see housing price declines at the national level – just slower gains.
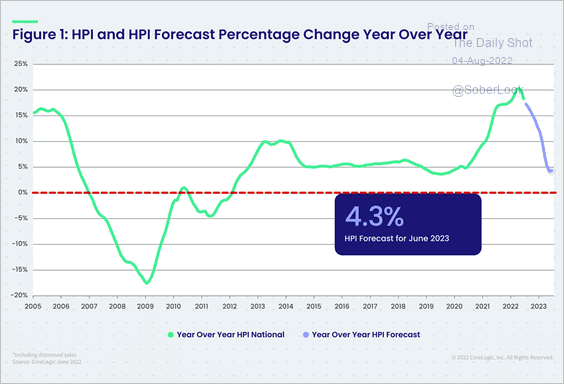 Source: CoreLogic
——————–
5. The Treasury curve has flattened/inverted sharply over the past few days as Fed officials signal more aggressive rate hikes ahead.
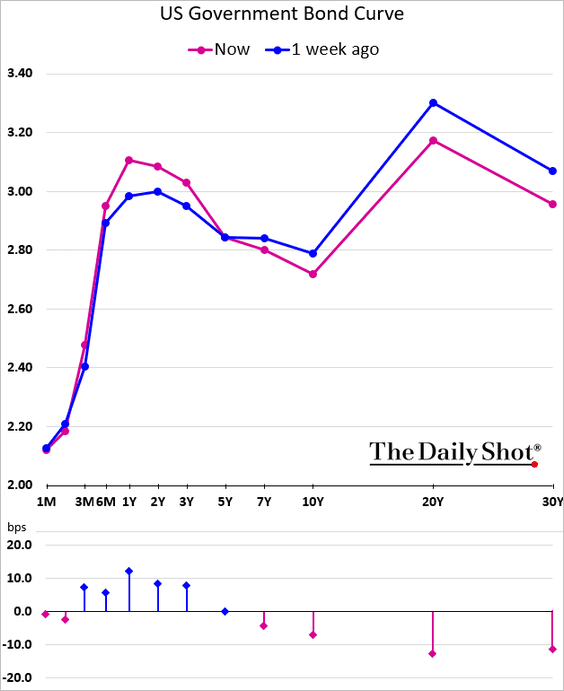
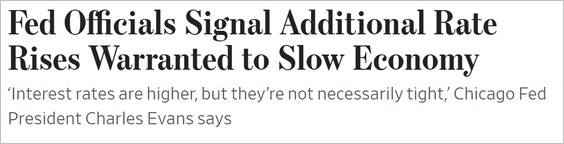 Source: @WSJ Read full article
Could the market be way off on rate hike projections? Here is a forecast from TS Lombard.
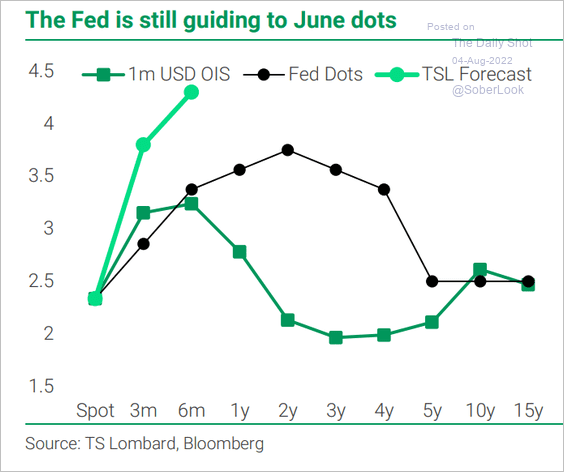 Source: TS Lombard
——————–
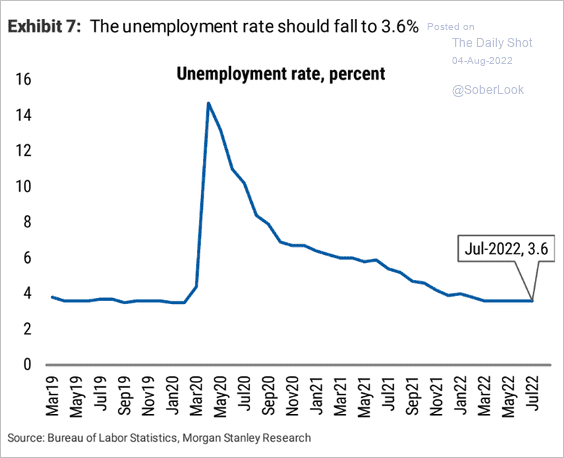
6. What should we expect from the July jobs report? Economists see a 250k gain in payrolls, with the unemployment rate holding at 3.6%.
• Oxford Economics:
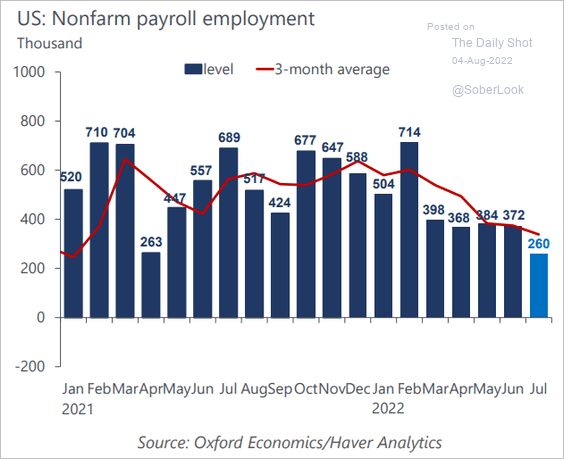 Source: Oxford Economics
• Morgan Stanley:
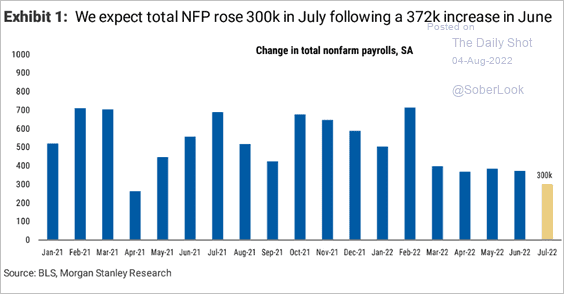 Source: Morgan Stanley Research
 Source: Morgan Stanley Research
Next, we have some additional data on the labor market.
• COVID continues to impact employment.
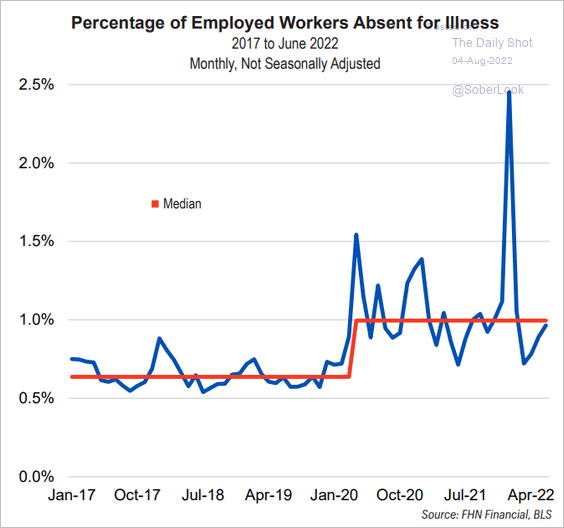 Source: FHN Financial
• Housing weakness could signal a softening in the labor market.
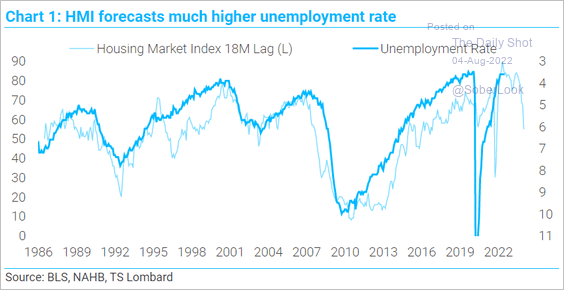 Source: TS Lombard
• Job hopping has been lucrative.
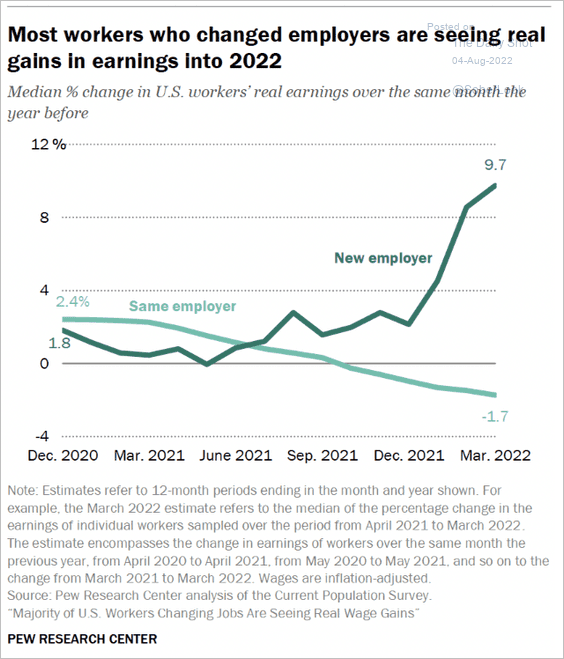 Source: Pew Research Center Read full article
• The pandemic-era manufacturing employment rebound has outperformed other cycles.
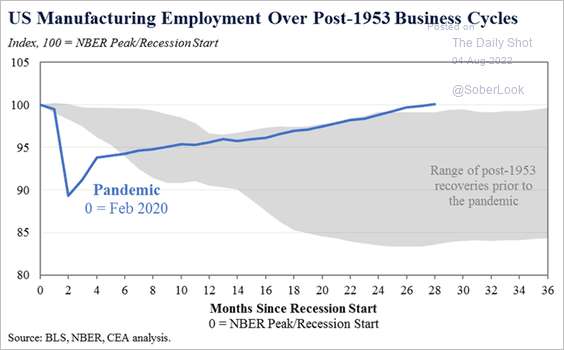 Source: @econjared46
——————–
7. Now, let’s take a look at some data on recession risks.
• We are not anywhere near a recession based on NBER’s indicators (2 charts).
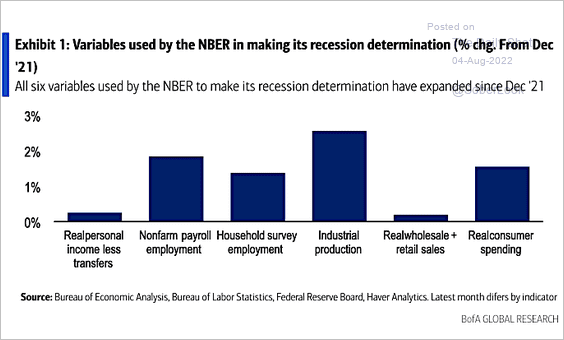 Source: BofA Global Research
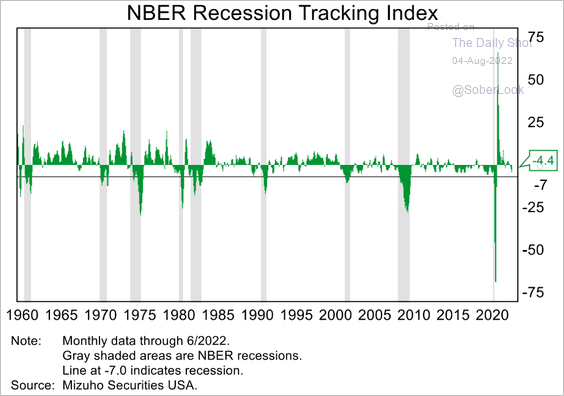 Source: Mizuho Securities USA
• The two charts below show recession announcement timing.
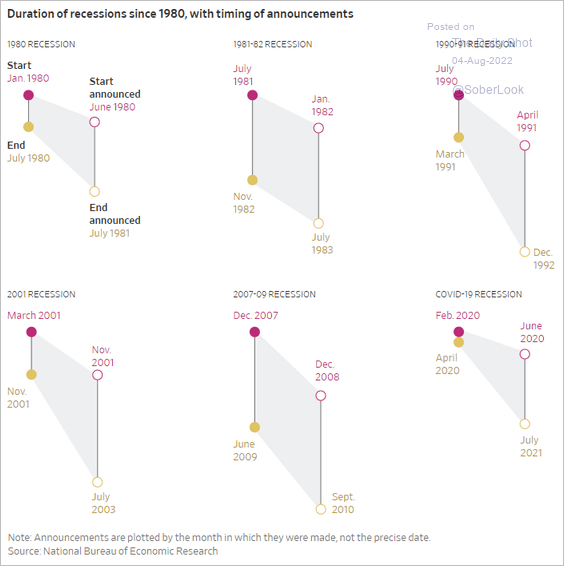 Source: @WSJ Read full article
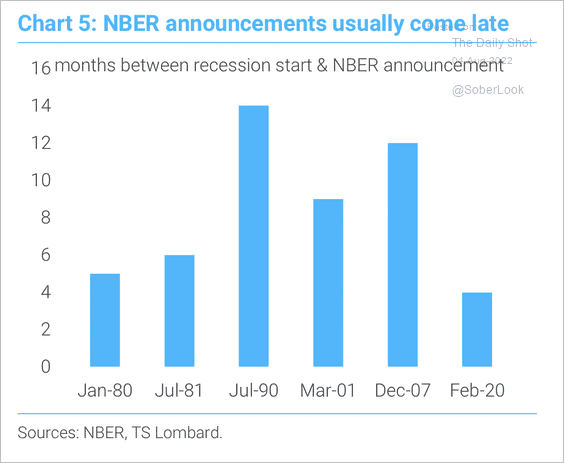 Source: TS Lombard
• This time, household leverage is not as extreme compared to the early 2000s.
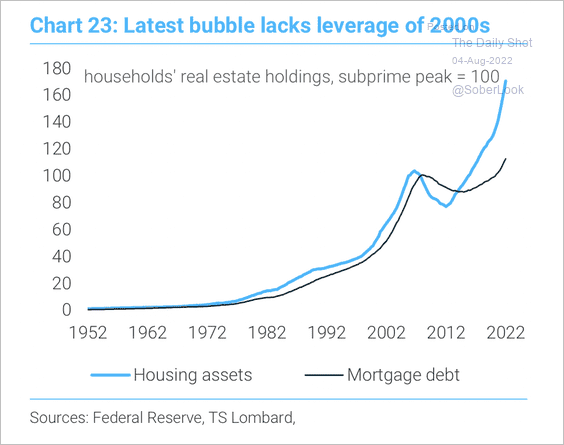 Source: TS Lombard
• Here is Alpine Macro’s recession probability indicator.
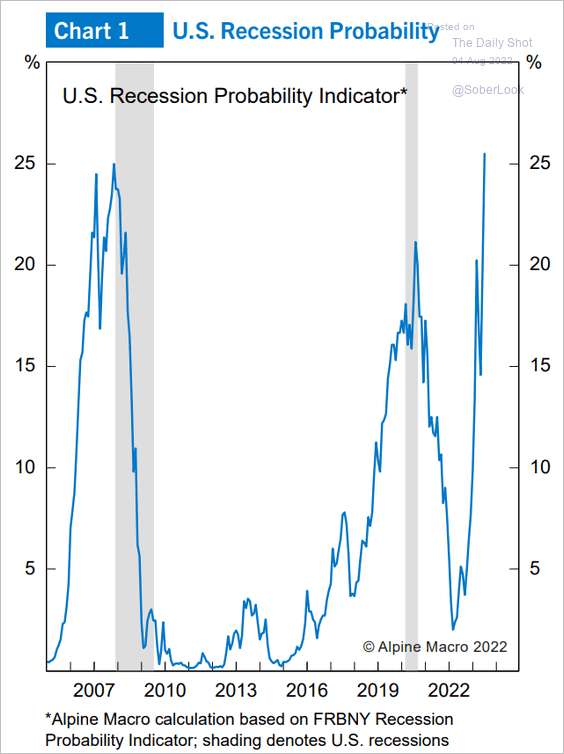 Source: Alpine Macro
And this chart shows two additional recession signaling models.
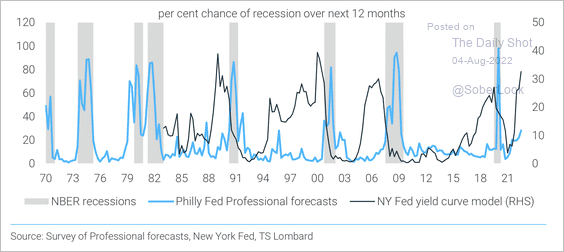 Source: TS Lombard
• The high-yield bond market suggests that the US will avoid a recession.
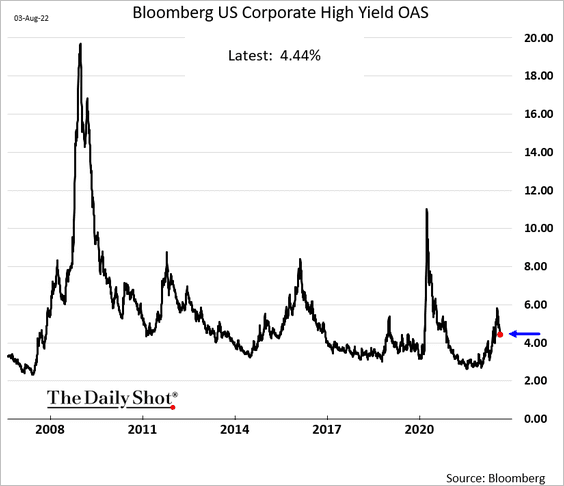
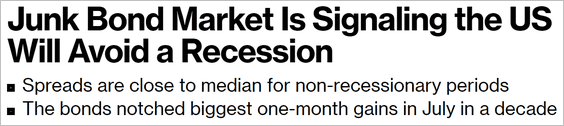 Source: @markets Read full article
• Financial recessions typically last the longest.
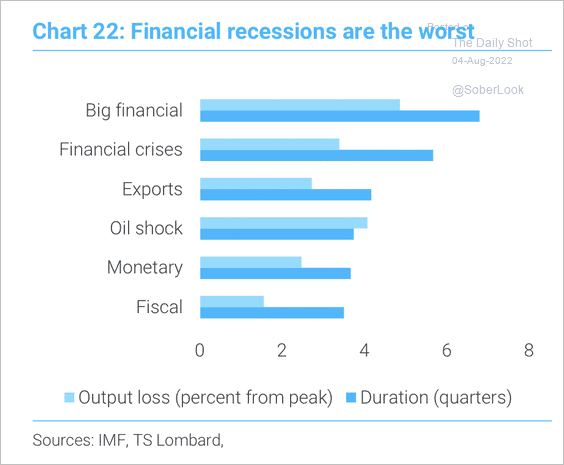 Source: TS Lombard
——————–
8. Consumer sentiment keeps trending lower.
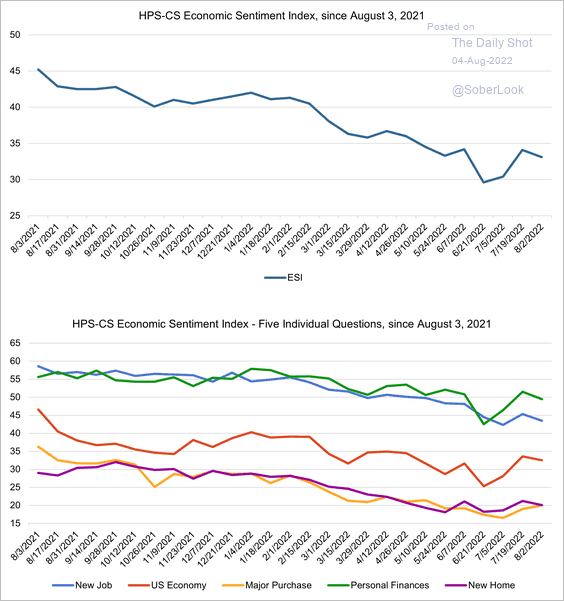 Source: @HPS_CS, @HPSInsight, @CivicScience
Back to Index
The Eurozone
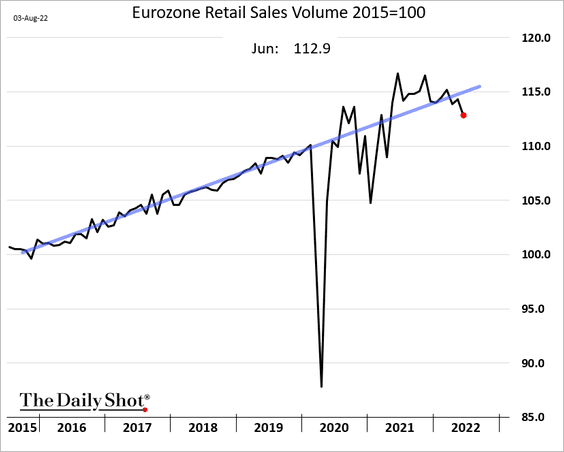
1. Retail sales dipped below the pre-COVID trend.
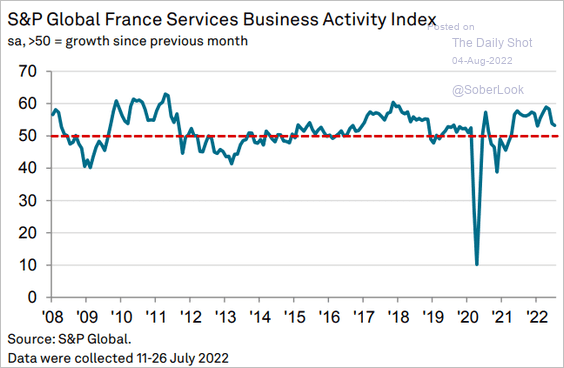
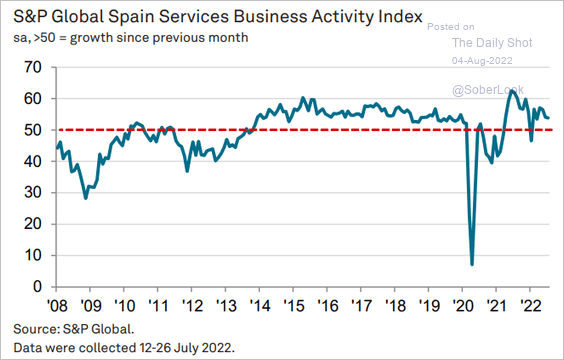
2. July service-sector PMI reports have been mixed.
• France and Spain continue to see growth.
 Source: S&P Global PMI
 Source: S&P Global PMI
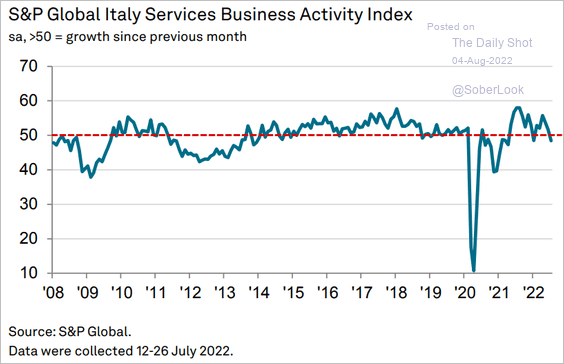
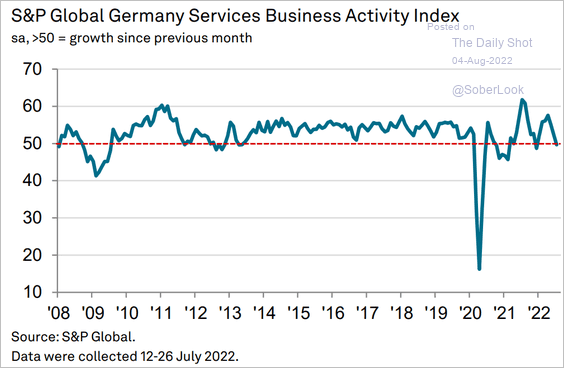
• Italy and Germany are in contraction.
 Source: S&P Global PMI
 Source: S&P Global PMI
——————–
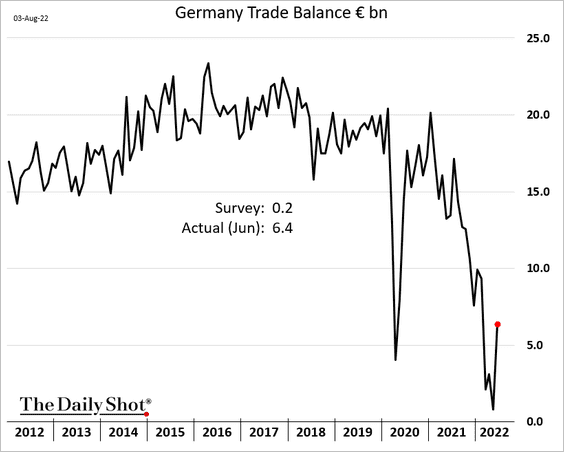
3. Germany’s trade balance rebounded in June (and the May figure was revised higher).
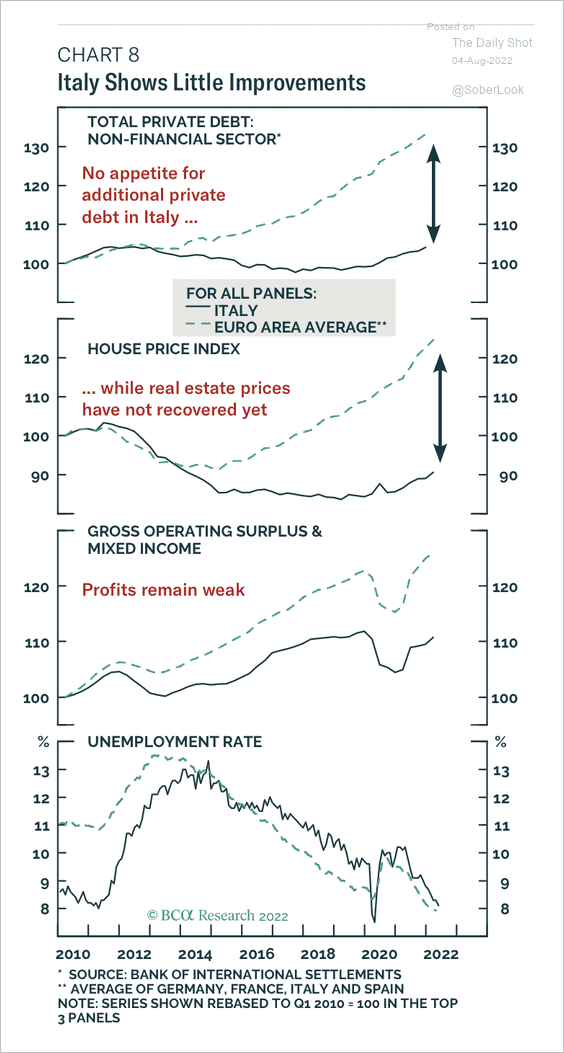
4. Italian private credit, house prices, and profits have lagged far behind the European average.
 Source: BCA Research
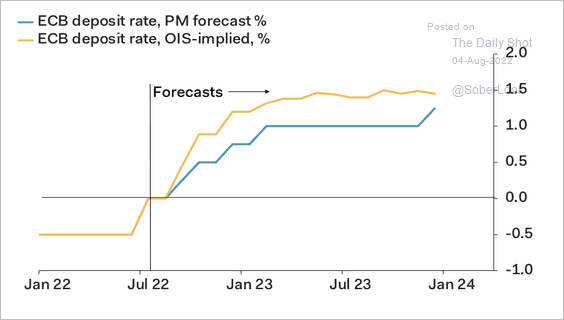
5. Pantheon Macroeconomics is less hawkish than markets about future ECB rate hikes.
 Source: Pantheon Macroeconomics
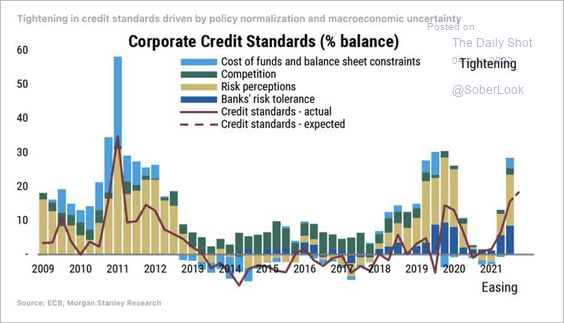
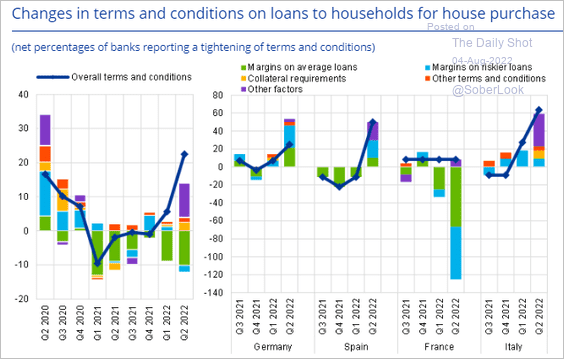
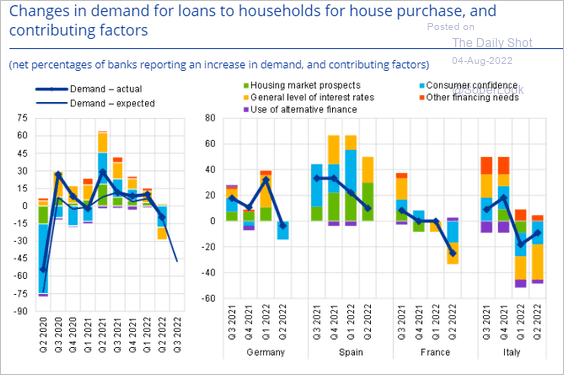
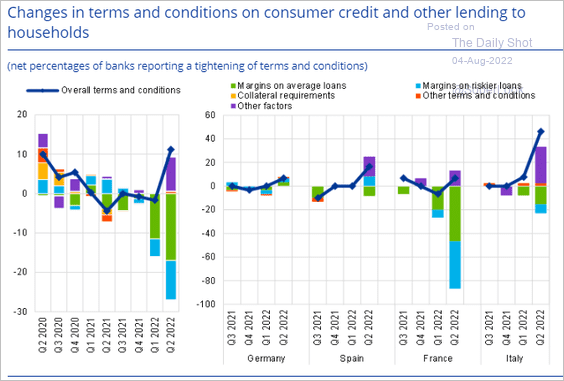
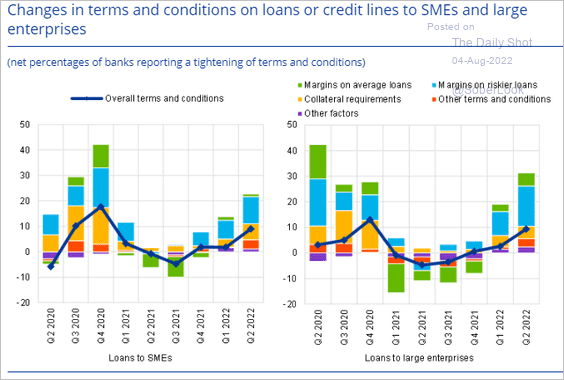
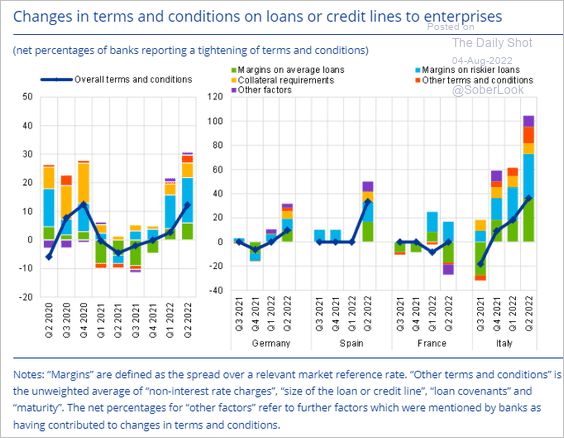
6. Banks tightened credit standards last quarter.
 Source: @acemaxx, @MorganStanley
• Mortgages:
 Source: ECB
Lenders see slower demand for mortgages.
 Source: ECB
• Consumer credit:
 Source: ECB
• Businesses:
 Source: ECB
 Source: ECB
Back to Index
Europe
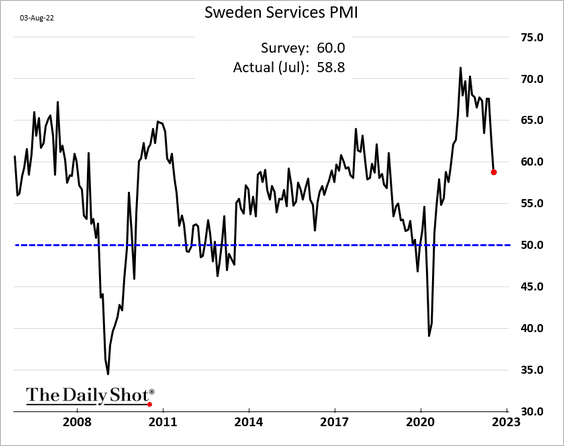
1. Sweden’s service sector growth has slowed but remains robust.
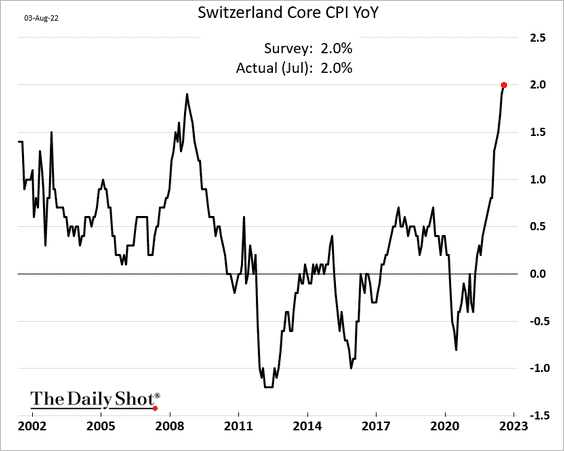
2. The Swiss core CPI hit 2% for the first time in recent decades.
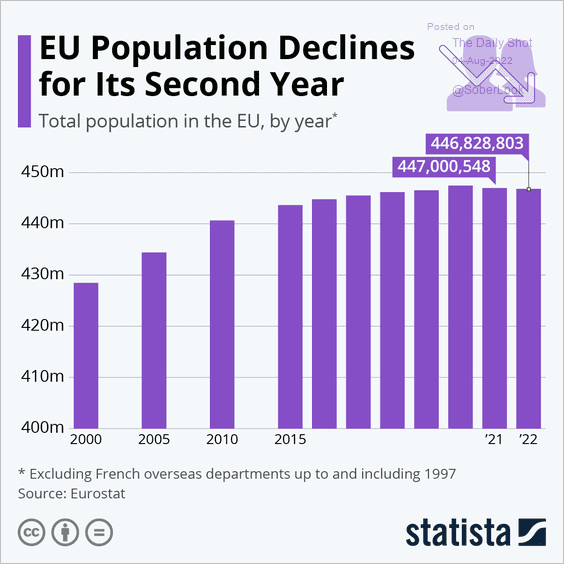
3. Next, we have some data on population changes in the EU.
• Slowing growth:
 Source: Statista
• Components of growth:
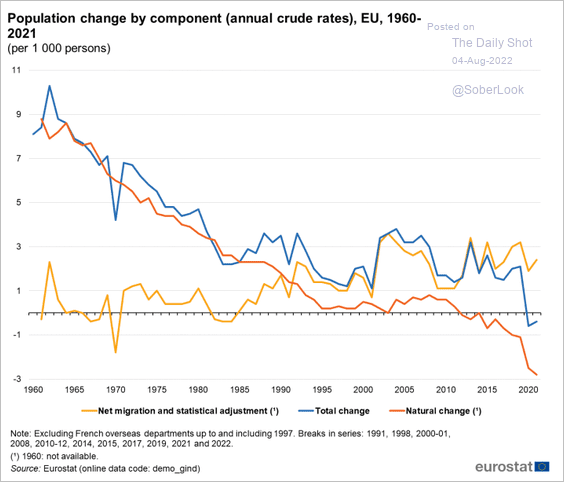 Source: Eurostat Read full article
Back to Index
Asia – Pacific
1. Here is a look at Japan’s sources of electricity over time.
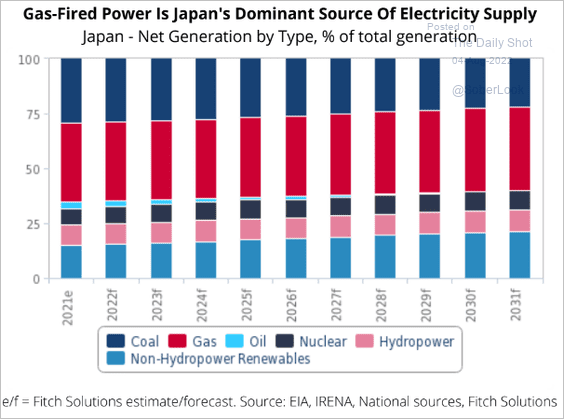 Source: Fitch Solutions Macro Research
2. Australia’s trade surplus hit a record high.
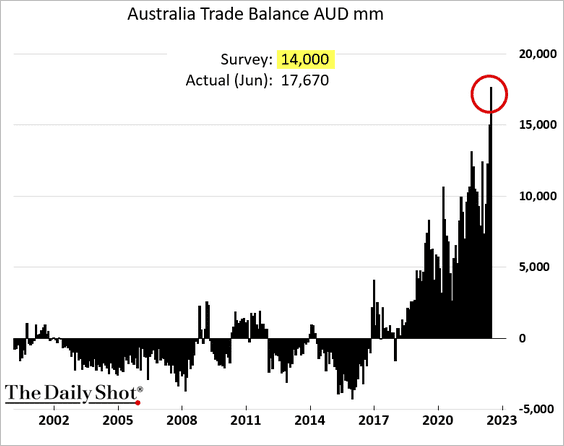
 Source: Bloomberg Read full article
Back to Index
China
1. Services PMI shows robust growth in July.
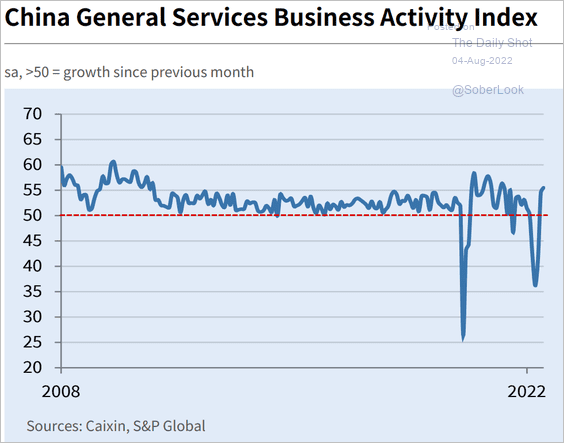 Source: S&P Global PMI
However, services employment has been shrinking.
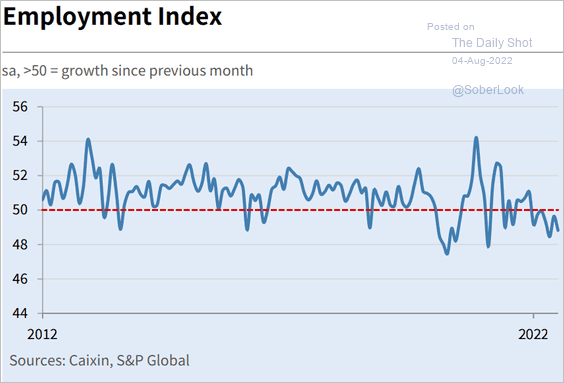 Source: S&P Global PMI
——————–
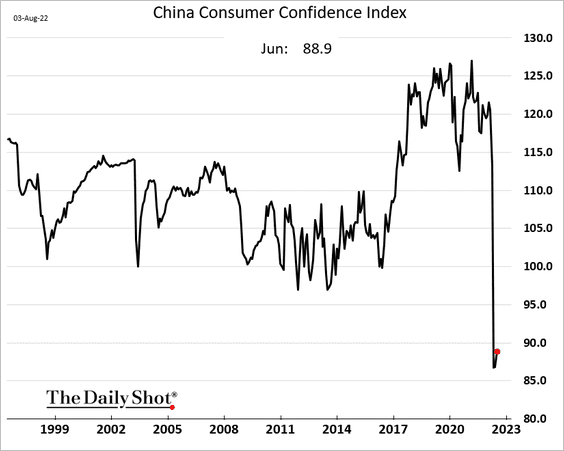
2. Not much of a reopening rebound in consumer confidence …
3. Shares of developers are near multi-year lows.
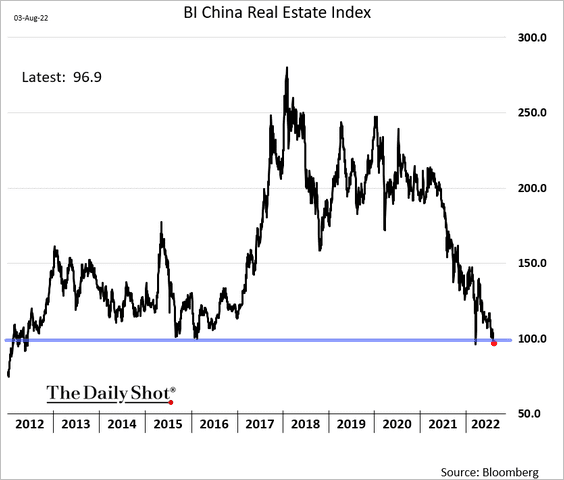 h/t @johnchenghc
Housing construction and developers’ funding remains weak, although there has been some improvement lately.
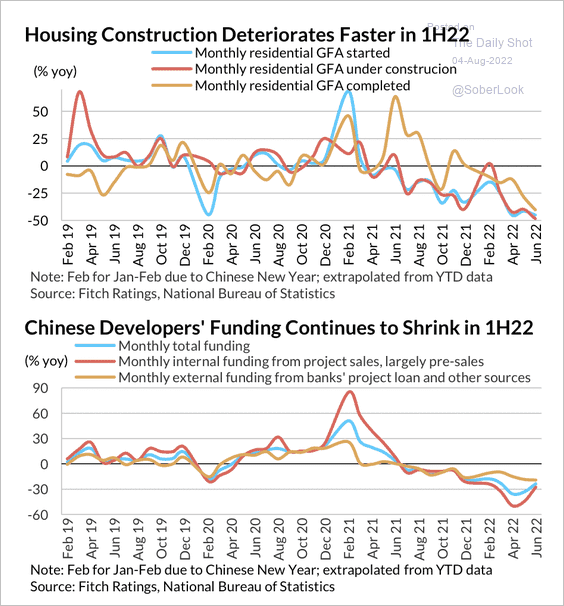 Source: Fitch Ratings
——————–
4. China continues to see capital outflows.
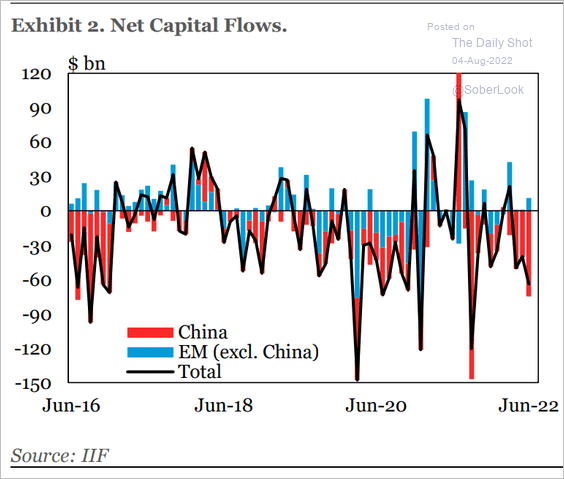 Source: IIF
5. China’s STEM PhDs prefer to stay in academia.
 Source: MacroPolo Read full article
Back to Index
Emerging Markets
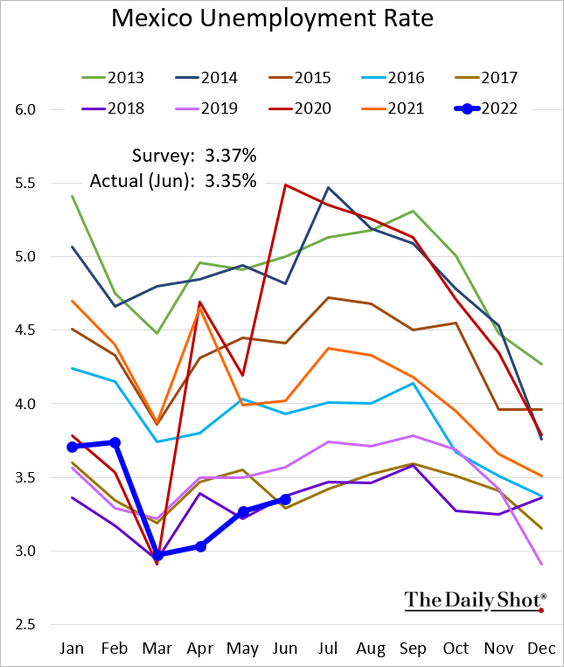
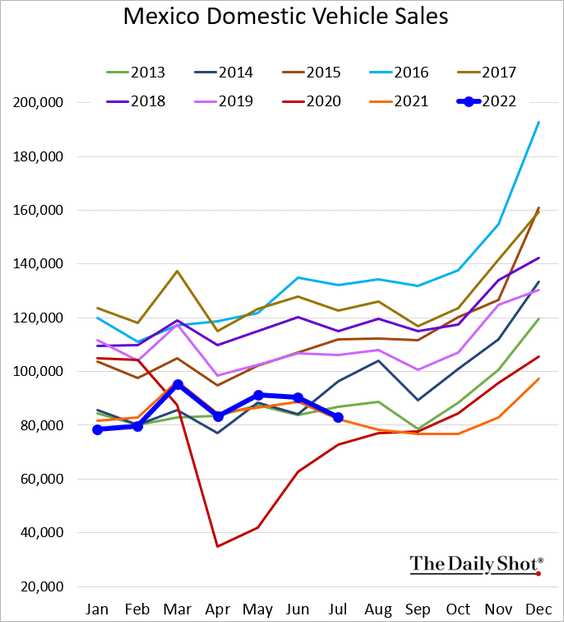
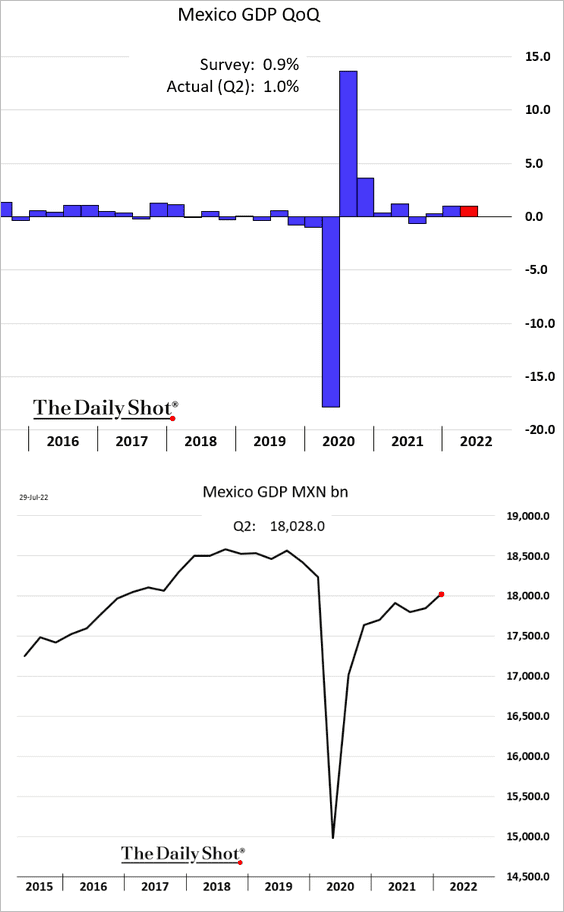
1. Let’s begin with Mexico.
• The unemployment rate (still very low):
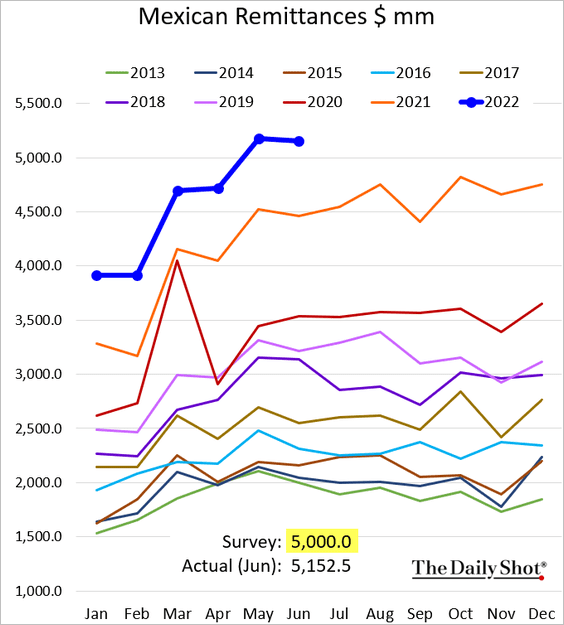
• Remittances (higher than expected):
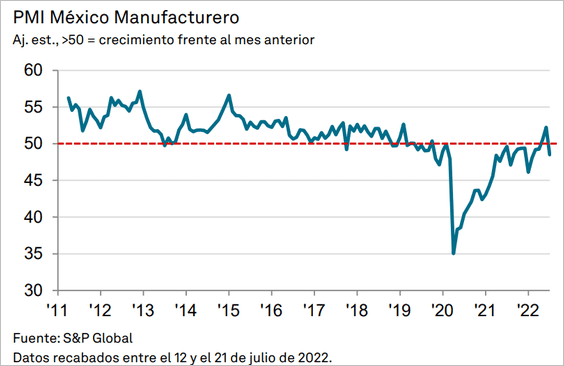
• Manufacturing PMI (back in contraction territory):
• Domestic car sales (following last year’s trend):
• GDP growth (stable):
——————–
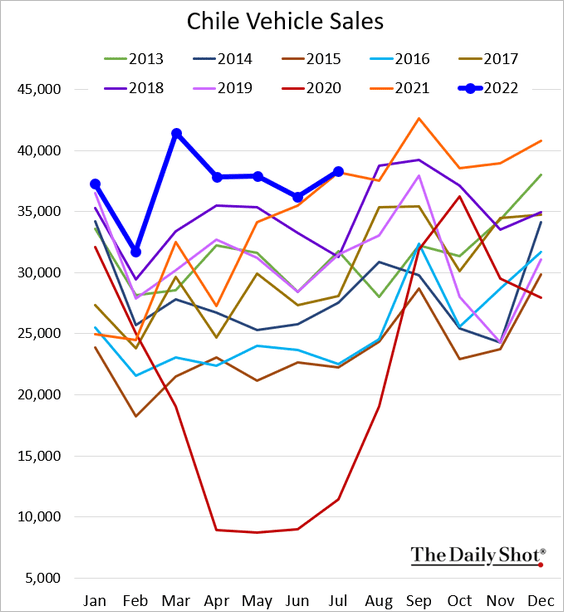
2. Chile’s vehicle sales remain robust but are no longer above last year’s levels.
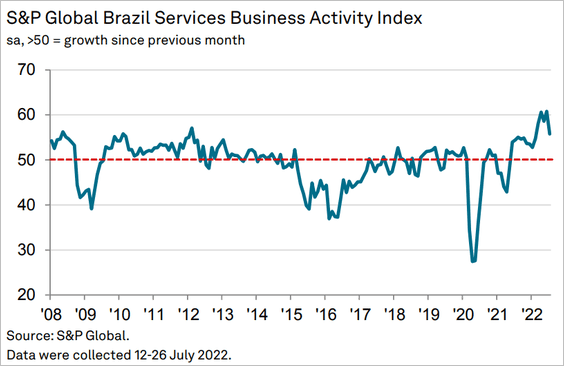
3. Brazil’s central bank hiked rates again.
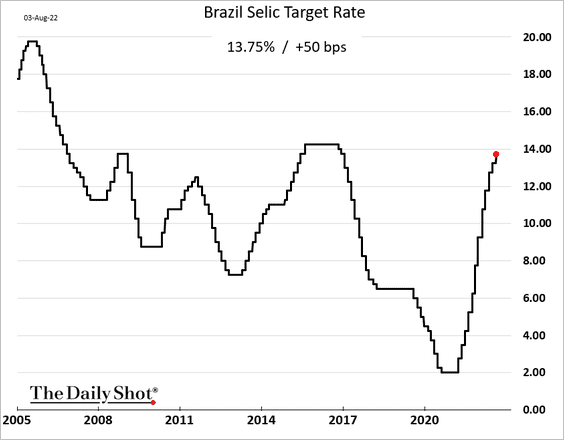
 Source: MarketWatch Read full article
Brazil’s services growth remains strong.
——————–
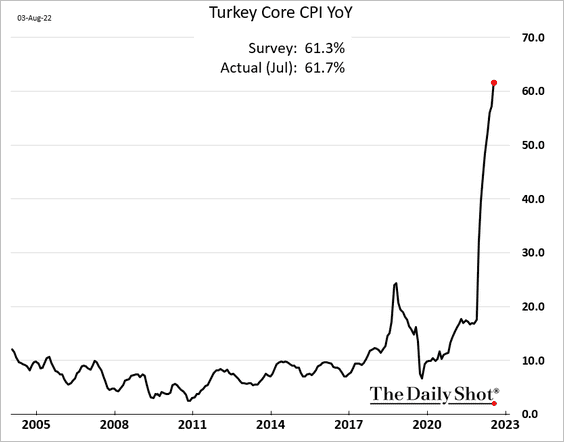
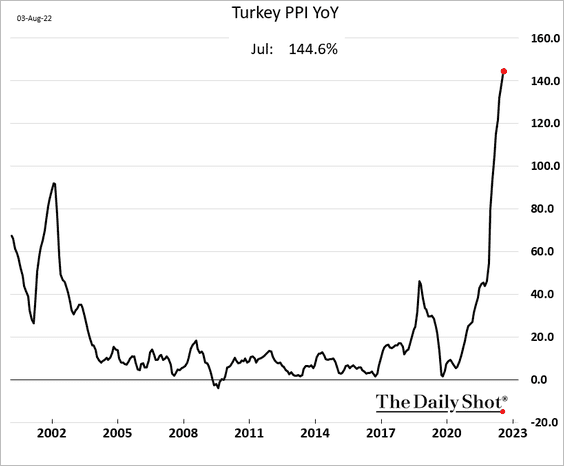
4. Turkey’s core CPI hit another record high (it’s not a typo – the core CPI is 61.7%). The central bank has lost its independence and credibility.
Producer prices are up almost 145% from a year ago.
——————–
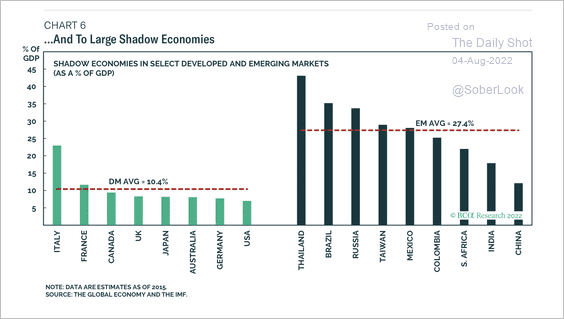
5. The average shadow banking economy is about 27% of GDP in developing economies.
 Source: BCA Research
6. Carry trades vs. the euro have been lucrative.
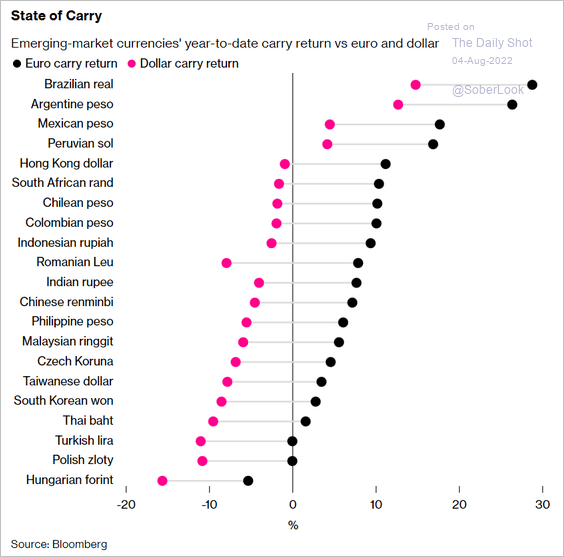 Source: Bloomberg Read full article
Back to Index
Cryptocurrency
More central banks believe that central bank digital currencies (CBDC) issuance is likely before the end of the decade, according to a survey by BIS.
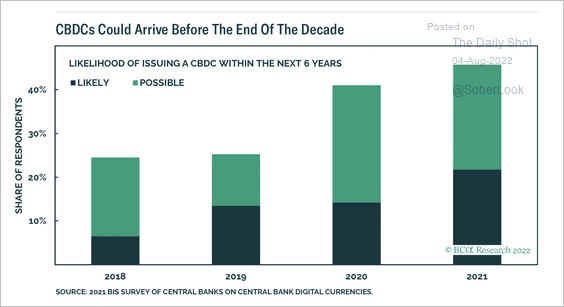 Source: BCA Research
Central banks intend to use CBDCs for efficient payments and financial inclusion.
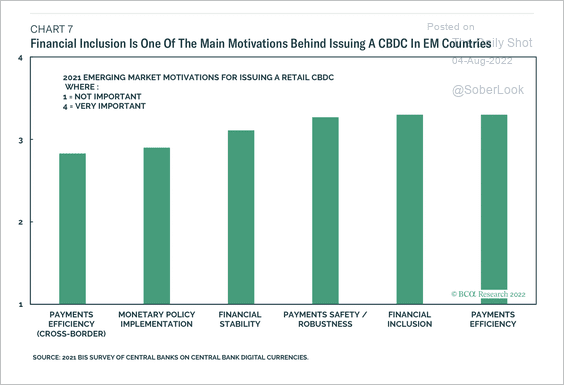 Source: BCA Research
Back to Index
Energy
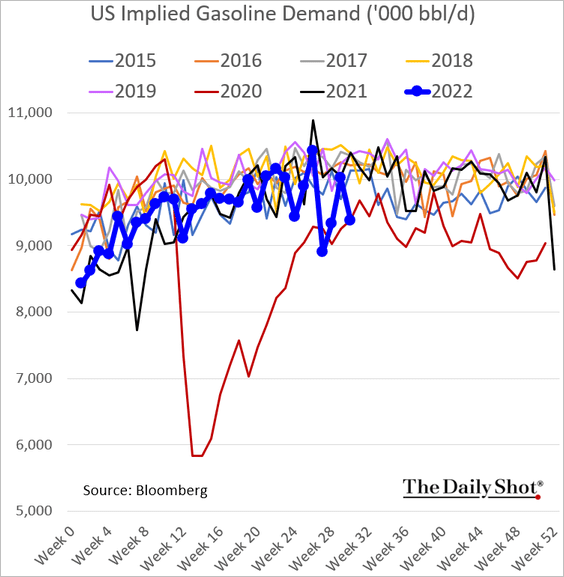
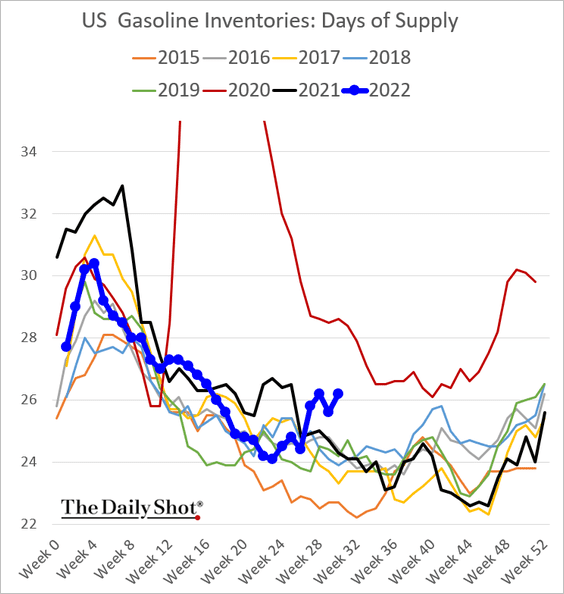
1. US gasoline demand tumbled last week.
Gasoline inventories remain elevated for this time of the year.
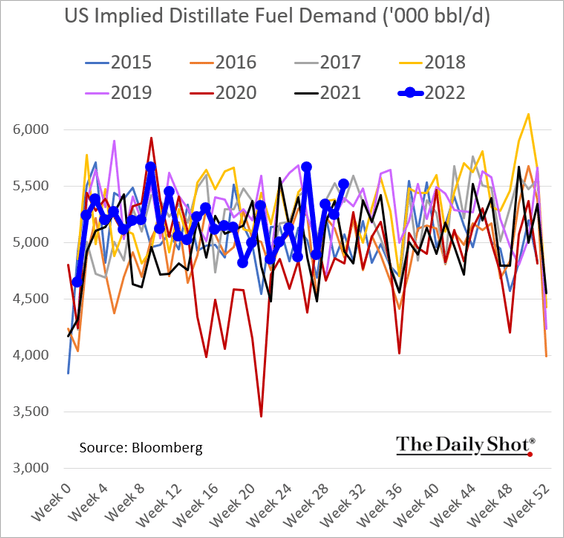
On the other hand, distillates demand (diesel, fuel oils) has been strong.
And distillates inventories are very low.
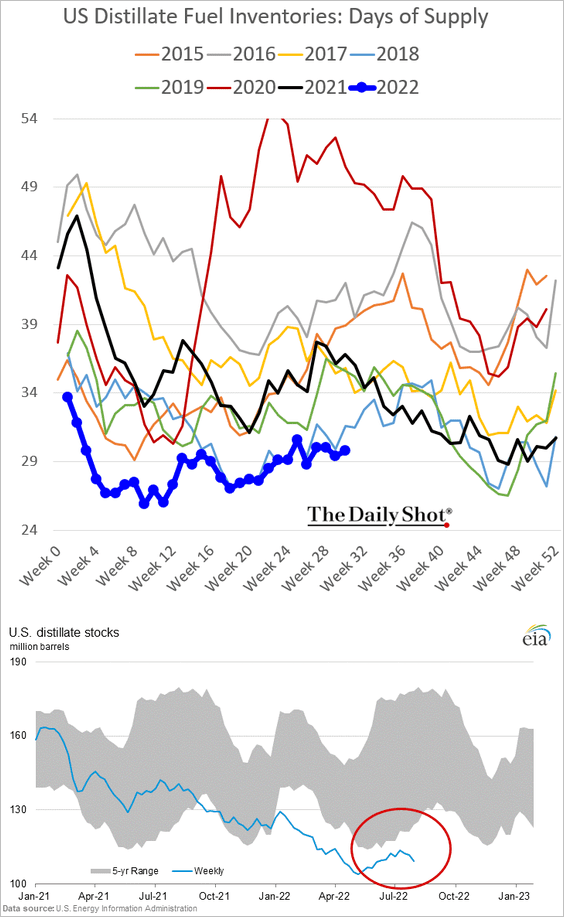
The gap between gasoline and distillates demand could be an indication of the divergence between consumer and business sentiment.
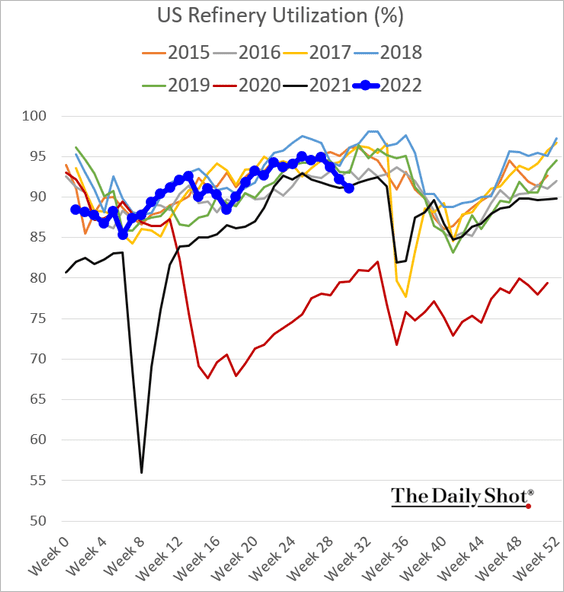
2. Refinery runs continue to fall.
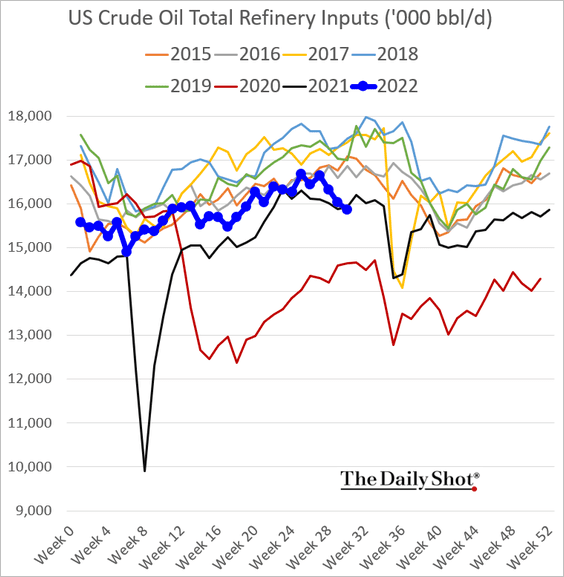
Here is the US refinery utilization.
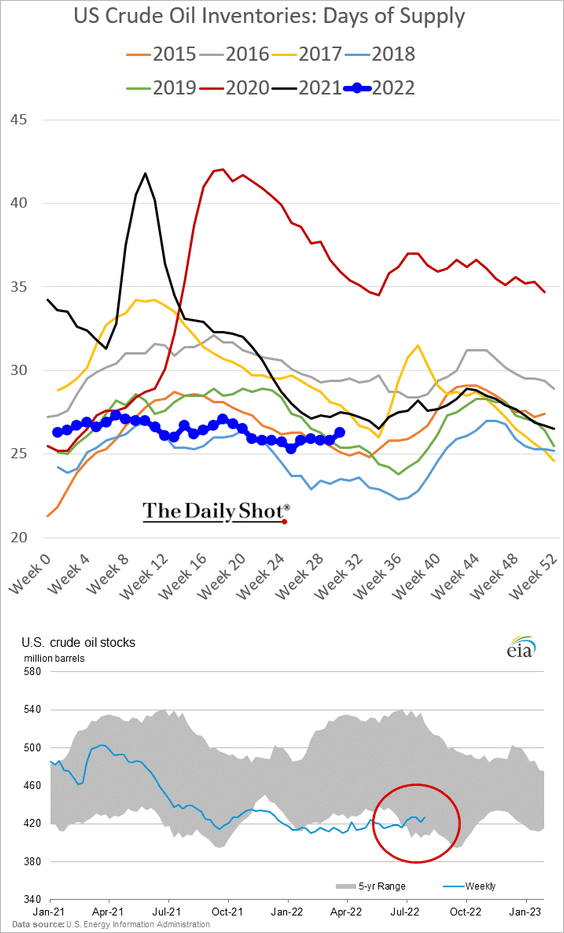
3. US crude oil inventories climbed last week and are now well inside the 5-year range.
——————–
4. US natural gas prices surged on Wednesday on the announcement of Freeport resuming partial operations in October.
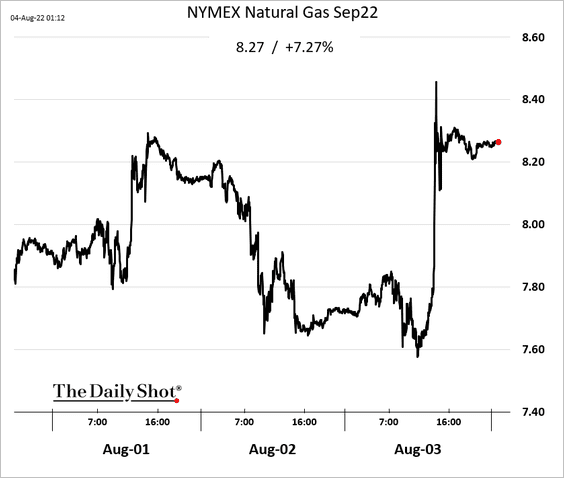
 Source: Reuters Read full article
The Freeport announcement is good news for Europe, as Nordstream flows drop to 20% of capacity and could go to zero.
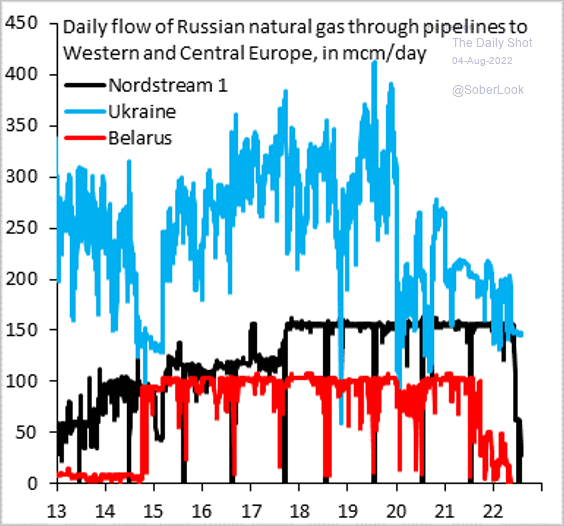 Source: @RobinBrooksIIF
——————–
5. What are the drivers of real oil price changes?
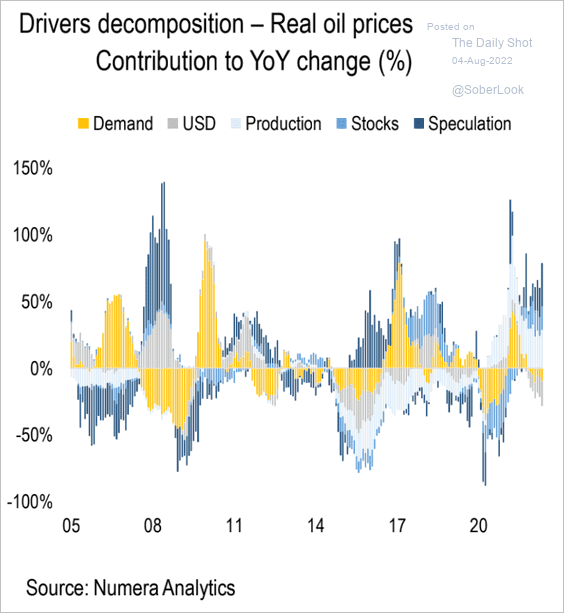 Source: Numera Analytics
6. Energy firms have been “cash machines” this year (2 charts).
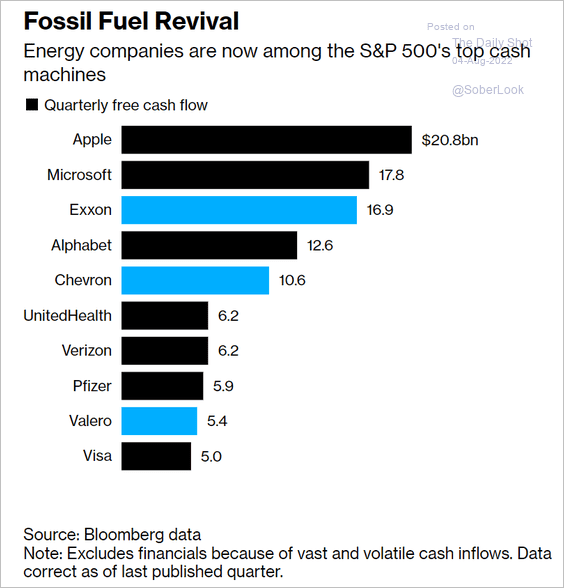 Source: @CrowleyKev, @business Read full article
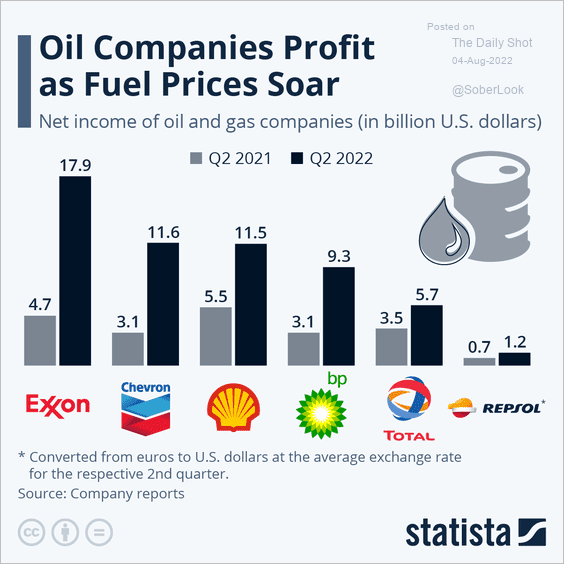 Source: Statista
Back to Index
Equities
1. A majority of stocks are above their 50-day moving average, which typically leads to further market gains.
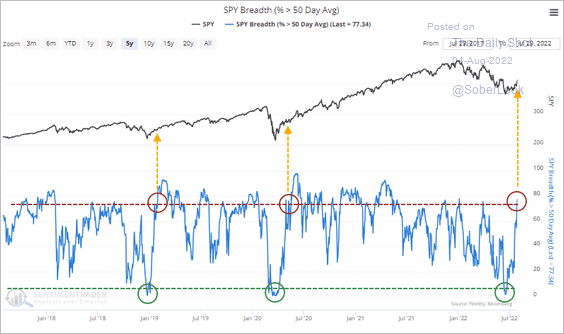 Source: SentimenTrader
2. New lows exceeded new highs again last week.
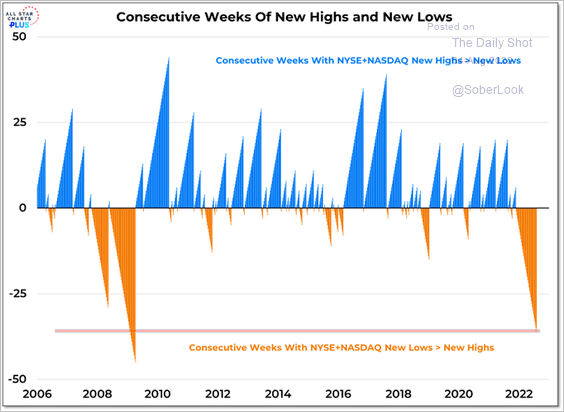 Source: @WillieDelwiche
3. The S&P 500 forward P/E ratio (valuation) is near the 10-year average.
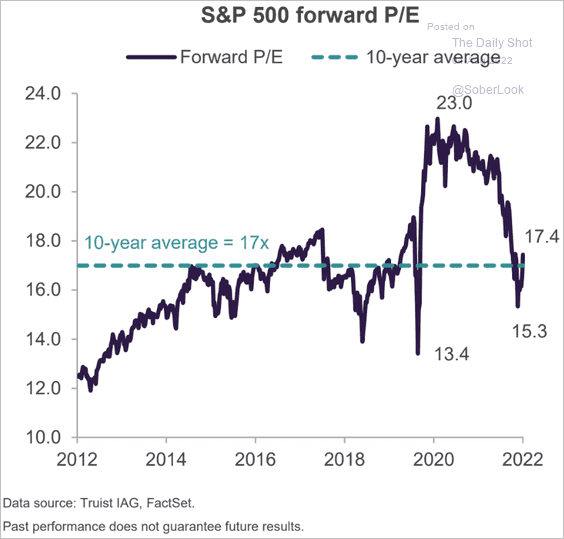 Source: Truist Advisory Services
Here are the valuation comparisons to 20-year averages.
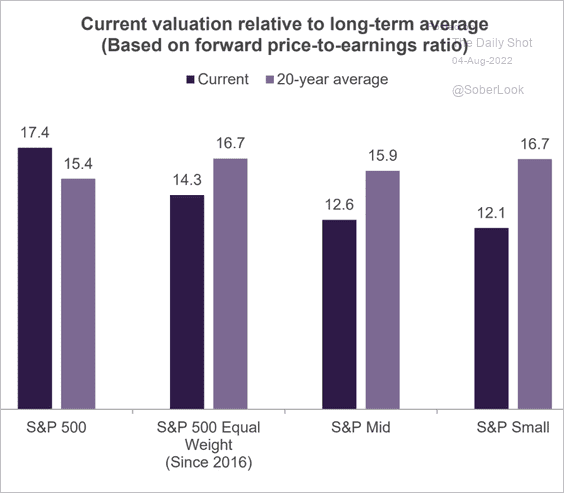 Source: Truist Advisory Services
——————–
4. Tighter credit conditions point to further underperformance of stocks vs. bonds.
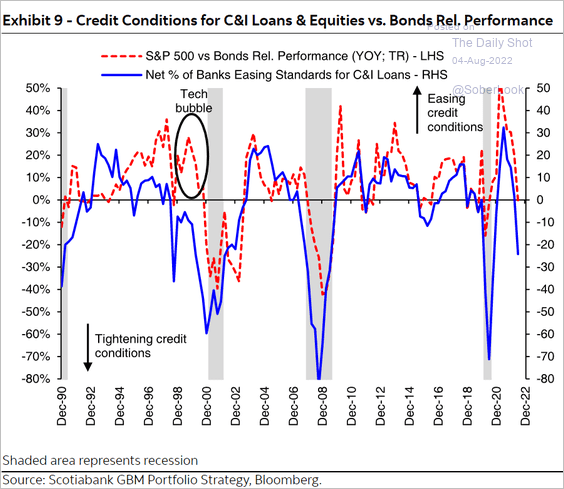 Source: Hugo Ste-Marie, Portfolio & Quantitative Strategy Global Equity Research, Scotia Capital
5. The S&P 500 has been tracking its cycle composite this year, which points to further strength before a September pullback.
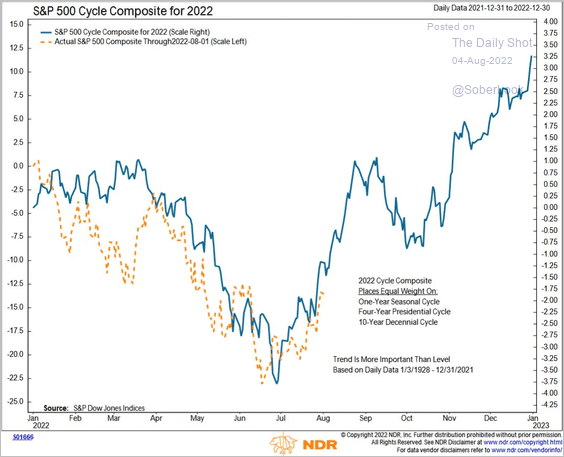 Source: @NDR_Research
6. Earnings surprise ratios have been moving lower.
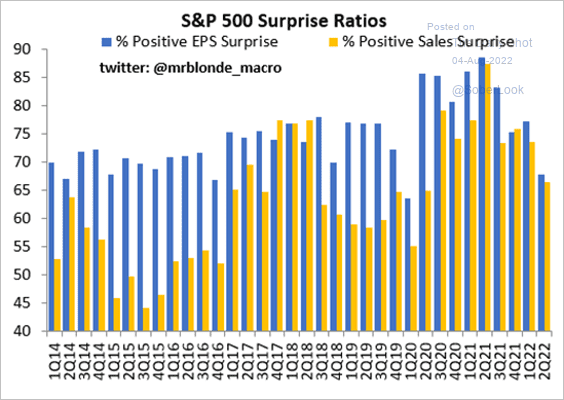 Source: @MrBlonde_macro
7. Deutsche bank’s end-of-cycle equity index has been outperforming the “late cycle” index.
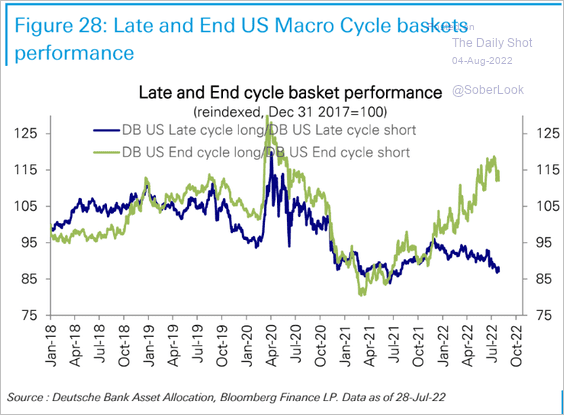 Source: Deutsche Bank Research
8. The S&P 500 continues to outperform global peers.
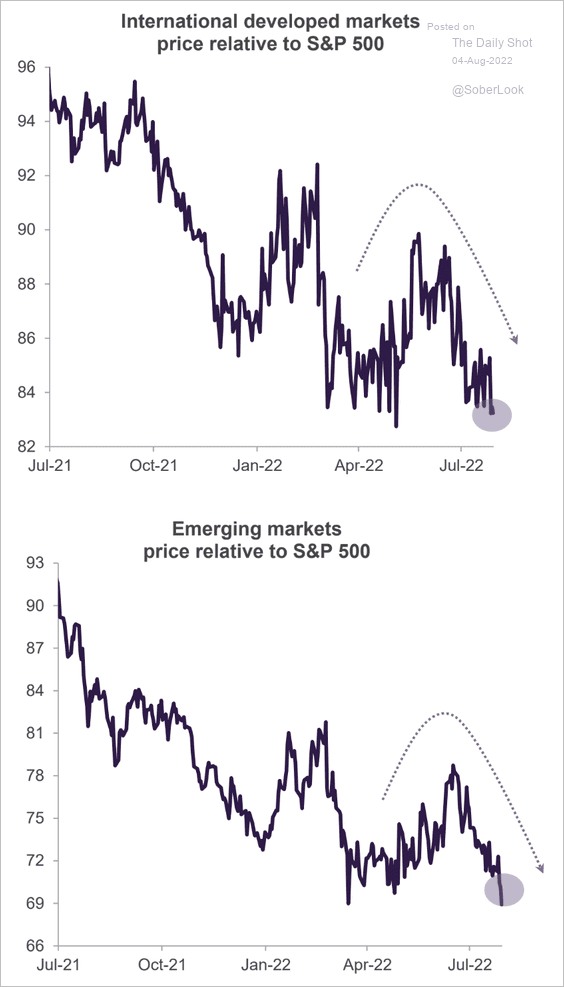 Source: Truist Advisory Services
9. While sell-side strategist sentiment deteriorated further in July, …
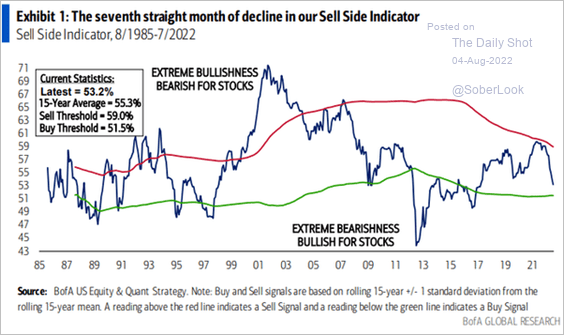 Source: BofA Global Research
… risk appetite is returning.
• Stories mentioning “new bull market”:
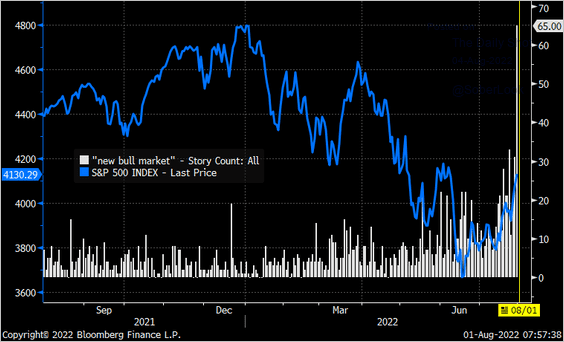 Source: Michael Kantrowitz, Piper Sandler
• The Longview Economics Medium Term risk appetite model:
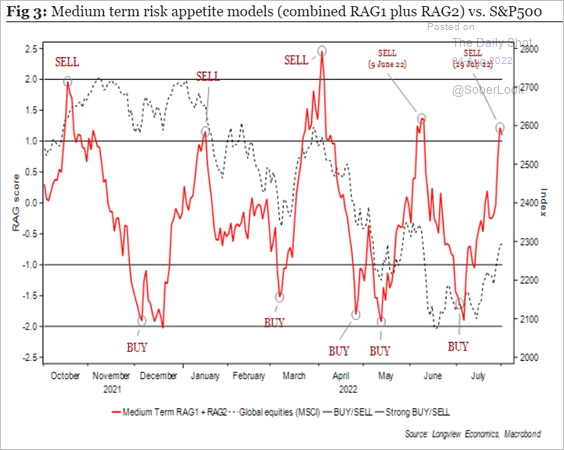 Source: Longview Economics
• Retail investors shifting from ETFs to stocks:
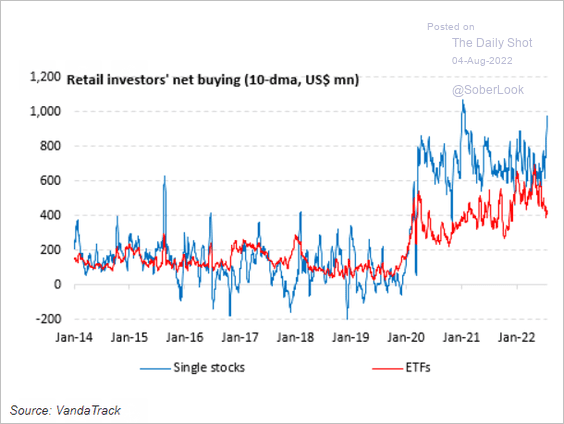 Source: Vanda Research
• Meme stocks (2 charts):
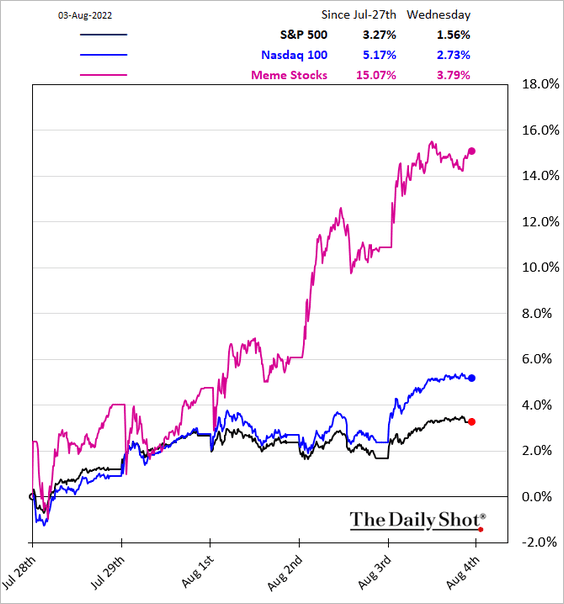
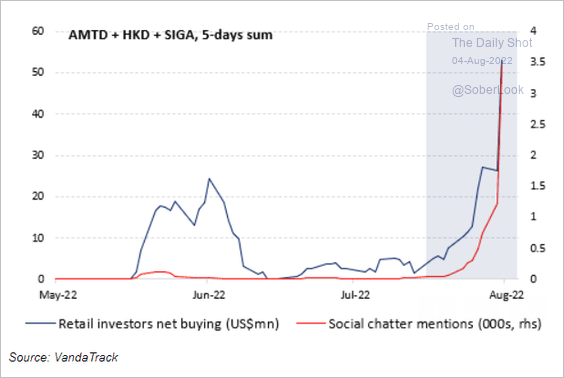 Source: Vanda Research
——————–
10. Next, we have some sector updates.
• Outside of tech, most US sectors saw softer business activity growth or a contraction in July.
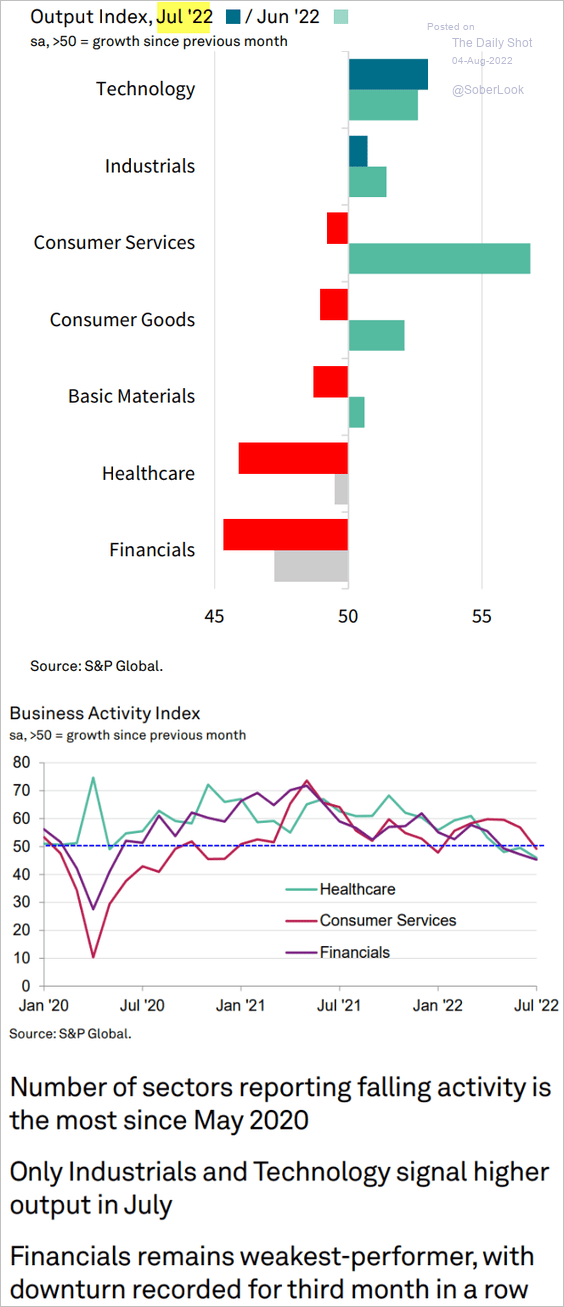 Source: S&P Global PMI
• Chemicals stocks face cyclical risks, which could weigh on relative performance.
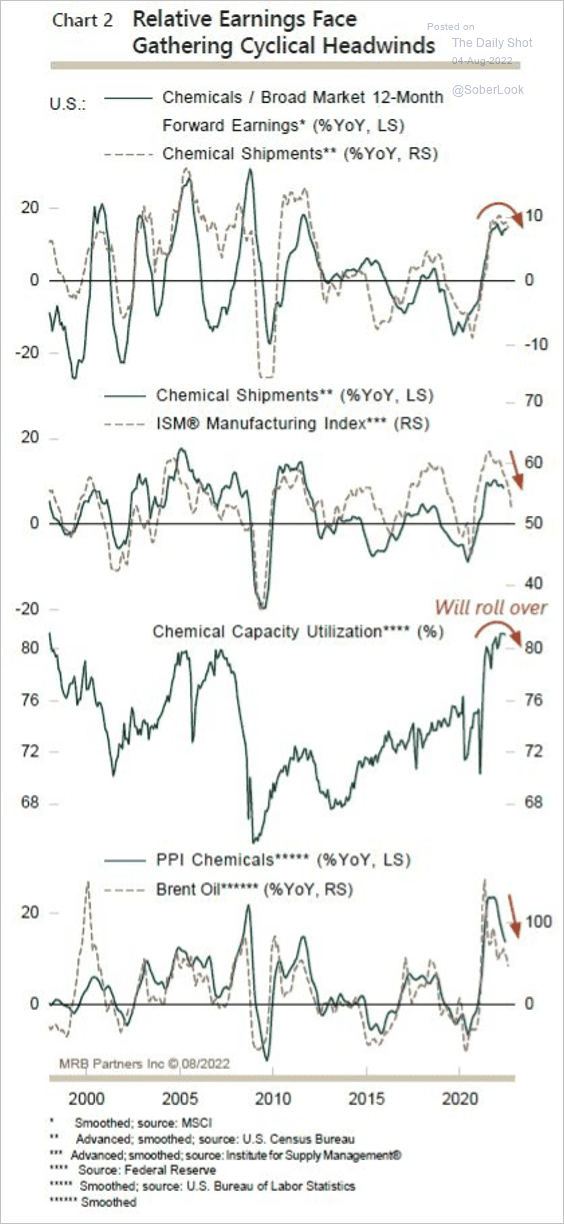 Source: MRB Partners
• Relative earnings of industrial stocks are starting to rise.
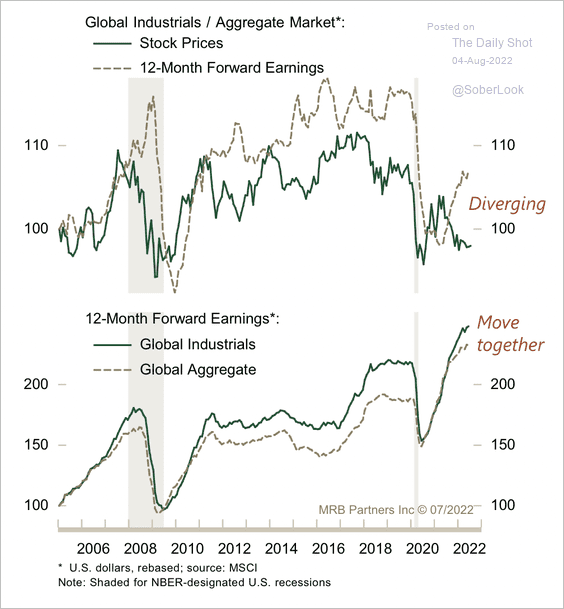 Source: MRB Partners
• Have fund flows in financials finally bottomed?
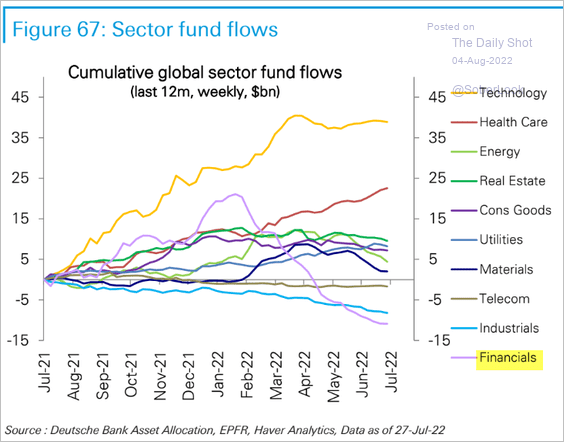 Source: Deutsche Bank Research
• Here are some sector performance charts over the past five business days.
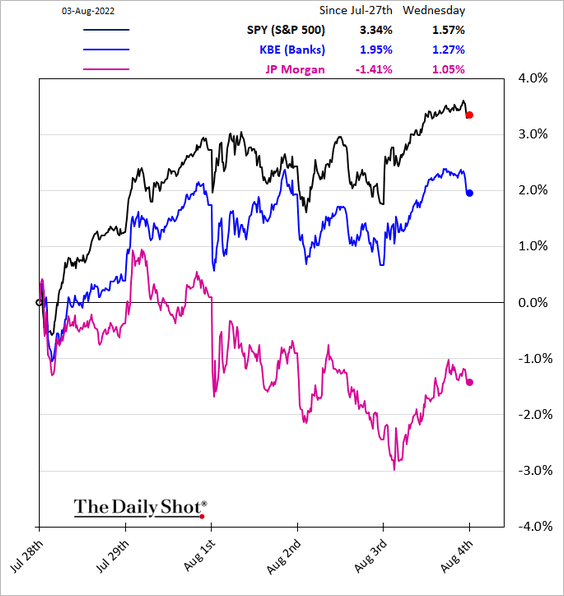
– Banks:
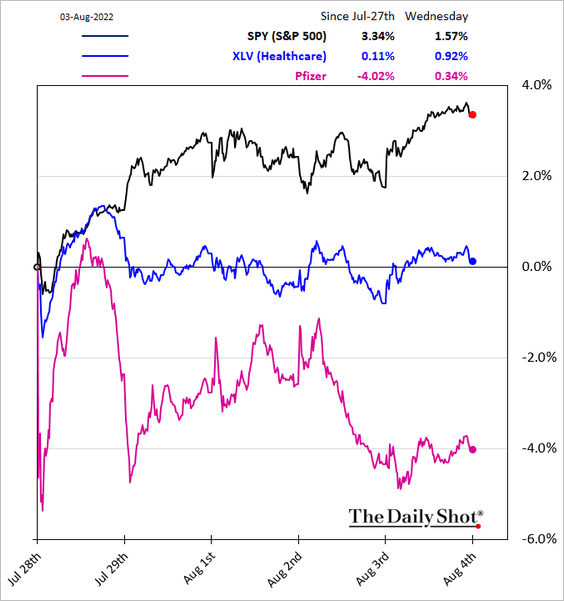
– Healthcare:
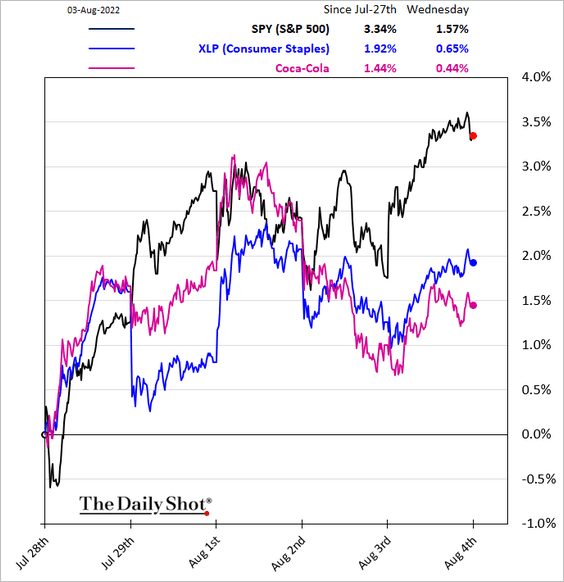
– Consumer Staples:
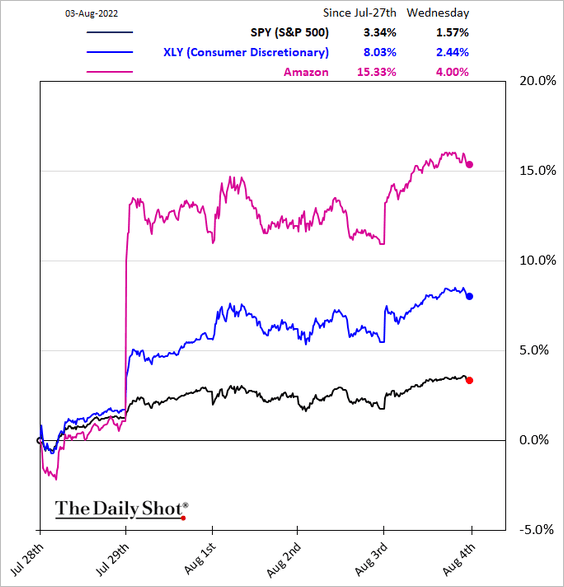
– Consumer Discretionary:
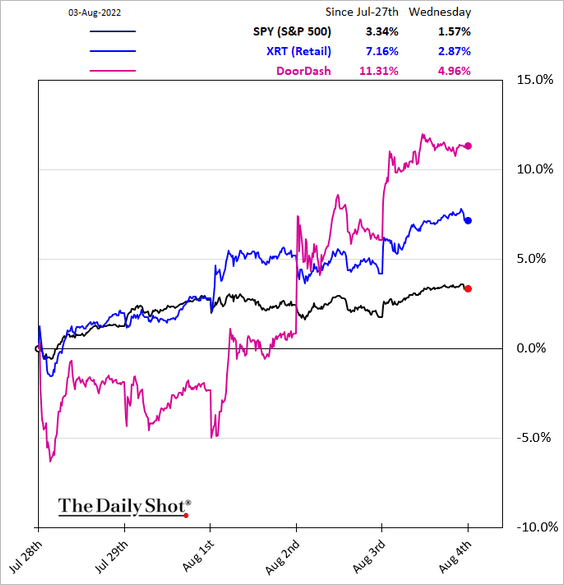
– Retail:
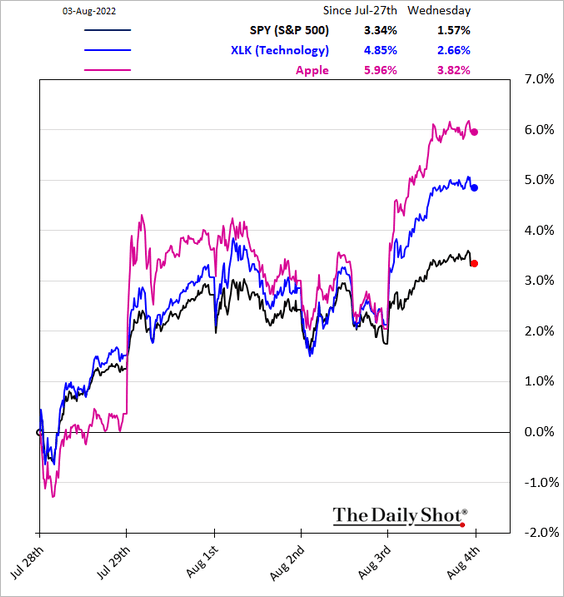
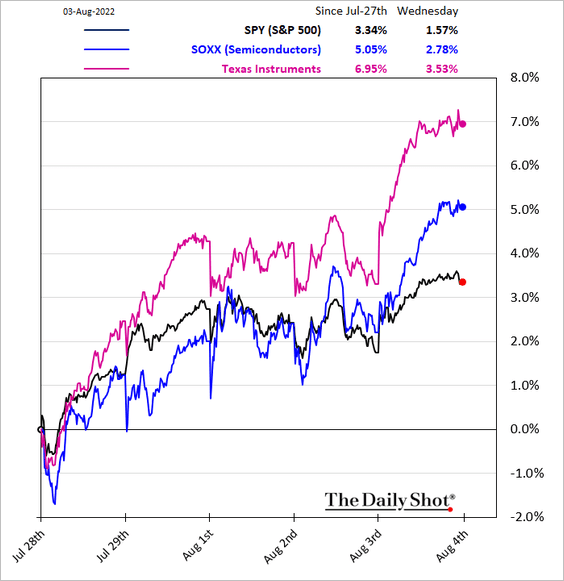
– Tech and semiconductors:
– Transportation:
![]()
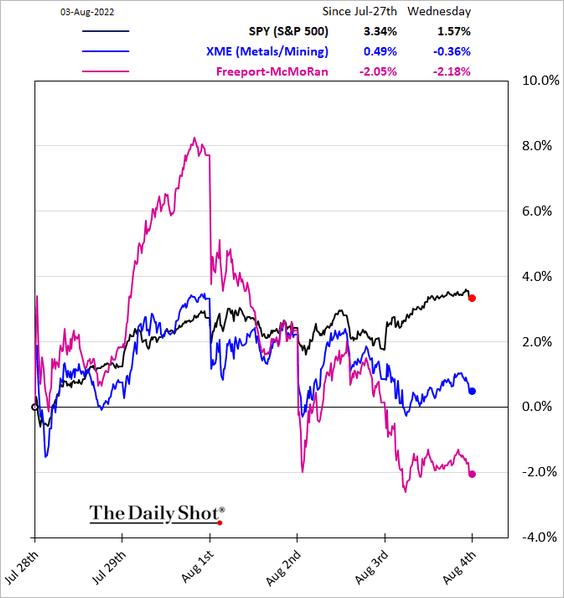
– Metals & Mining:
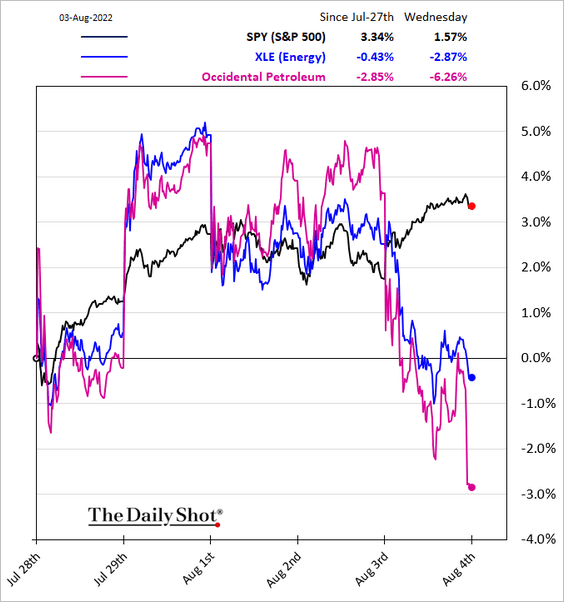
– Energy:
By the way, retail investors have been buying OXY.
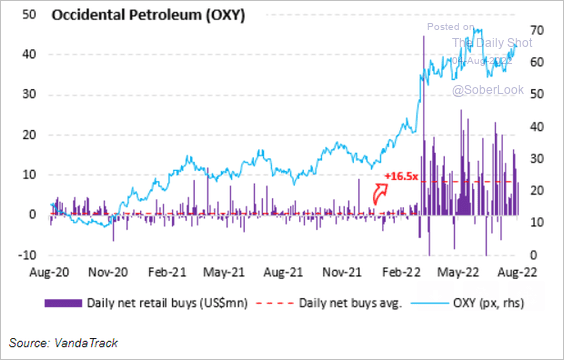 Source: Vanda Research
——————–
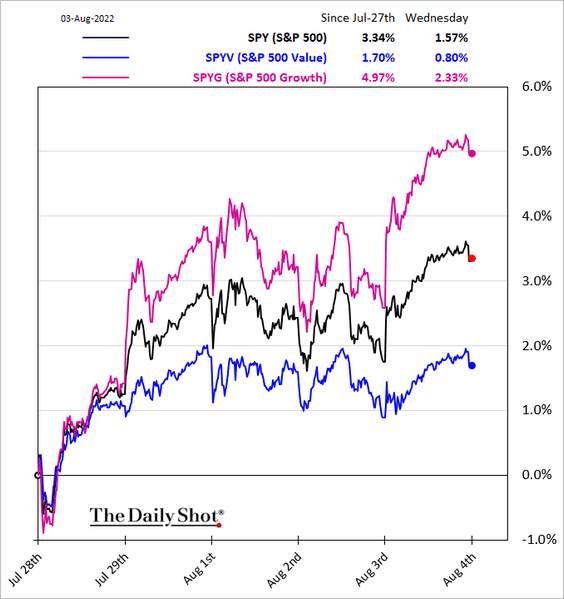
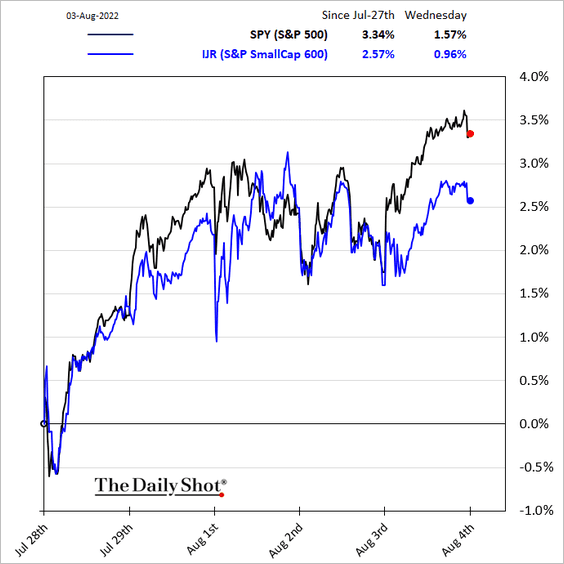
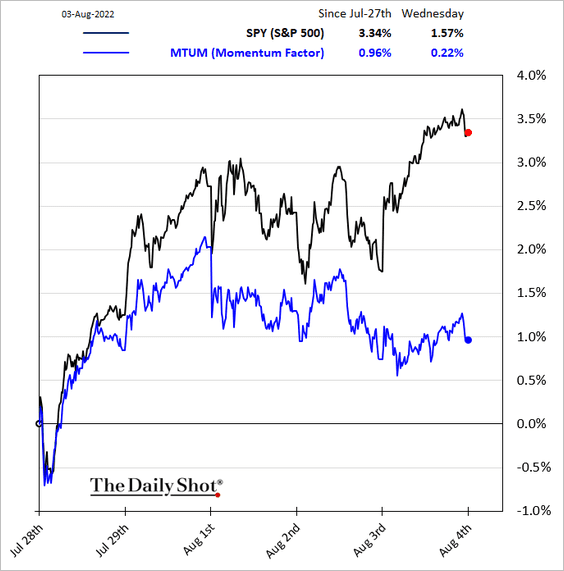
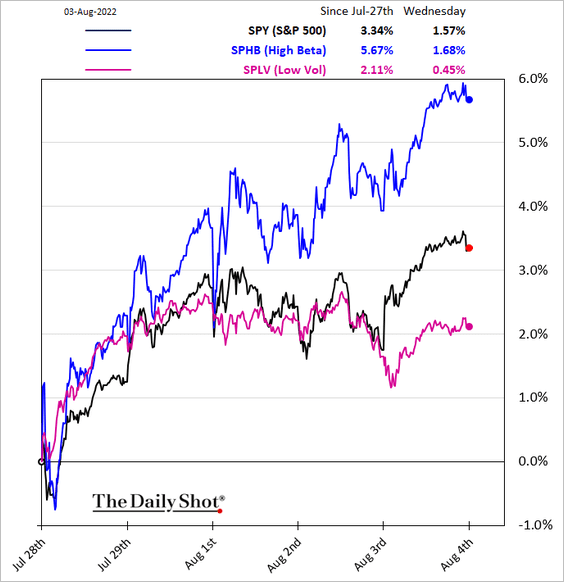
11. Finally, we have some equity factor performance data.
• Value vs. growth:
• Small caps:
• Momentum (hurt by energy and healthcare):
• High-beta and low vol:
Back to Index
Rates
1. The Treasury will issue more T-Bills in the months ahead, which is what the market has been craving.
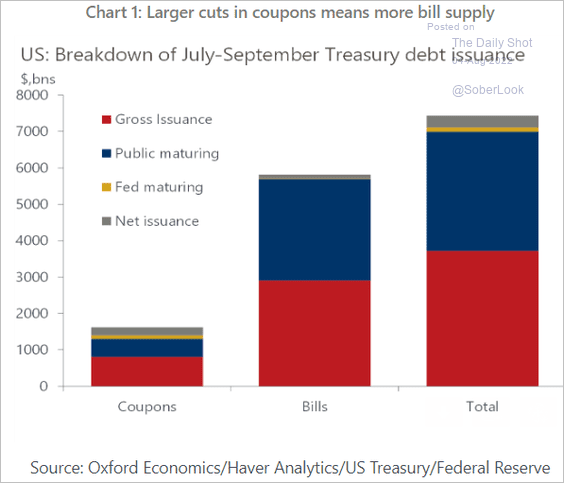 Source: Oxford Economics
2. This chart shows the average maturity of government money market funds.
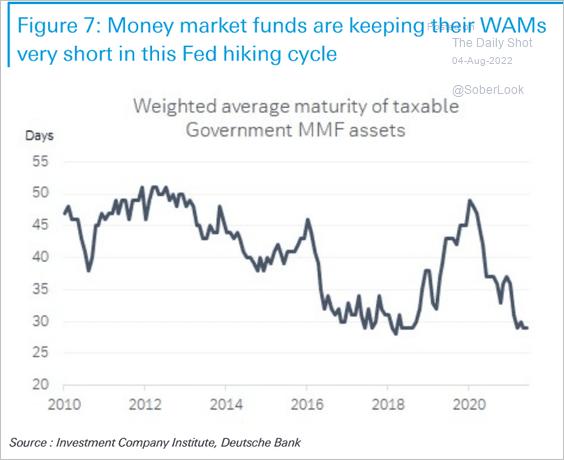 Source: Deutsche Bank Research
——————–
Food for Thought
1. Amazon’s logistics costs:
 Source: Statista
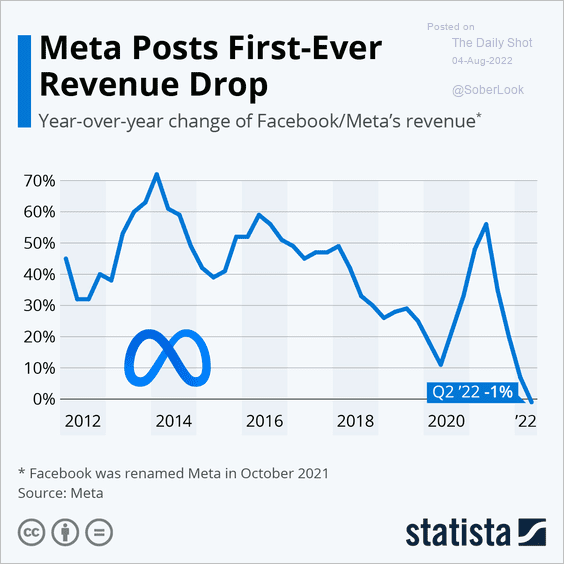
2. Meta’s revenue growth:
 Source: Statista
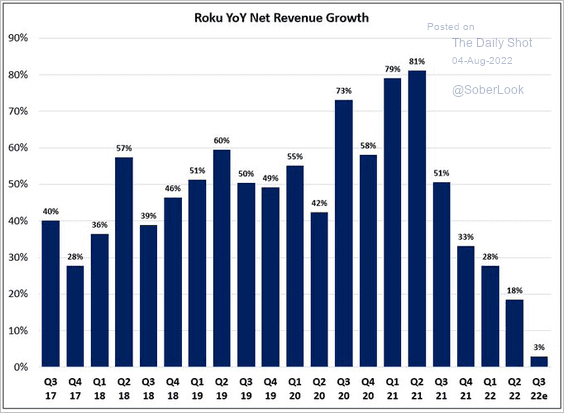
3. ROKU’s revenue growth:
 Source: @TSOH_Investing
4. World’s largest oil producers:
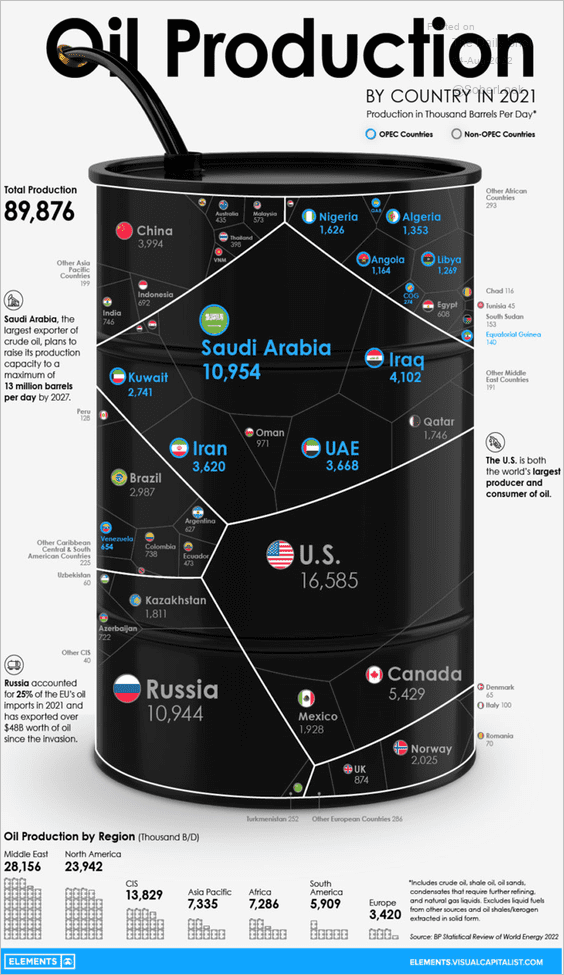 Source: Visual Capitalist Read full article
5. US population by age group:
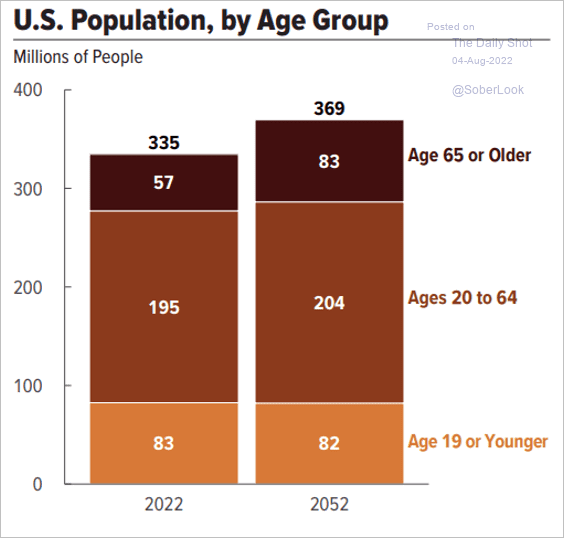 Source: CBO Read full article
6. Antarctic sea ice extent:
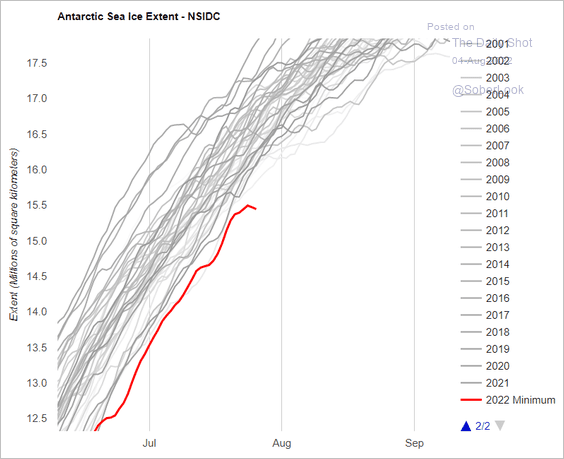 Source: @kevpluck Further reading
7. US confidence in the accuracy of elections:
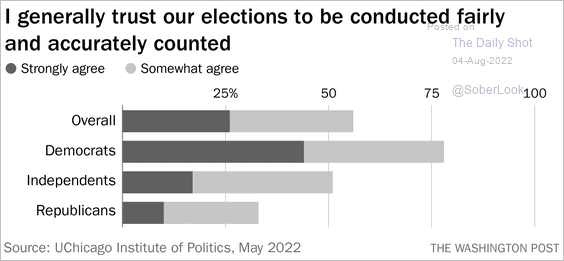 Source: The Washington Post Read full article
8. Most popular paintings:
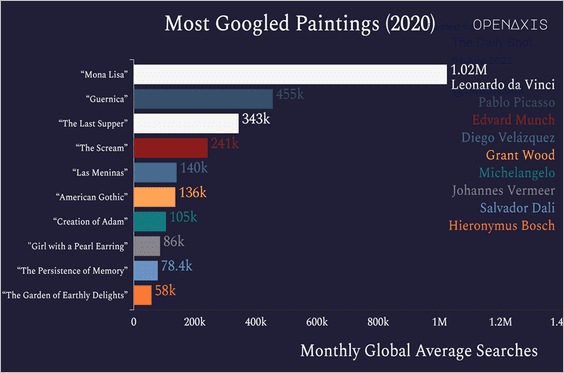 Source: OpenAxis Read full article
——————–
Back to Index