
The Daily Shot: 21-Jun-24
• The United States
• The United Kingdom
• The Eurozone
• Europe
• Japan
• Asia-Pacific
• China
• Emerging Markets
• Cryptocurrency
• Commodities
• Energy
• Equities
• Credit
• Food for Thought
The United States
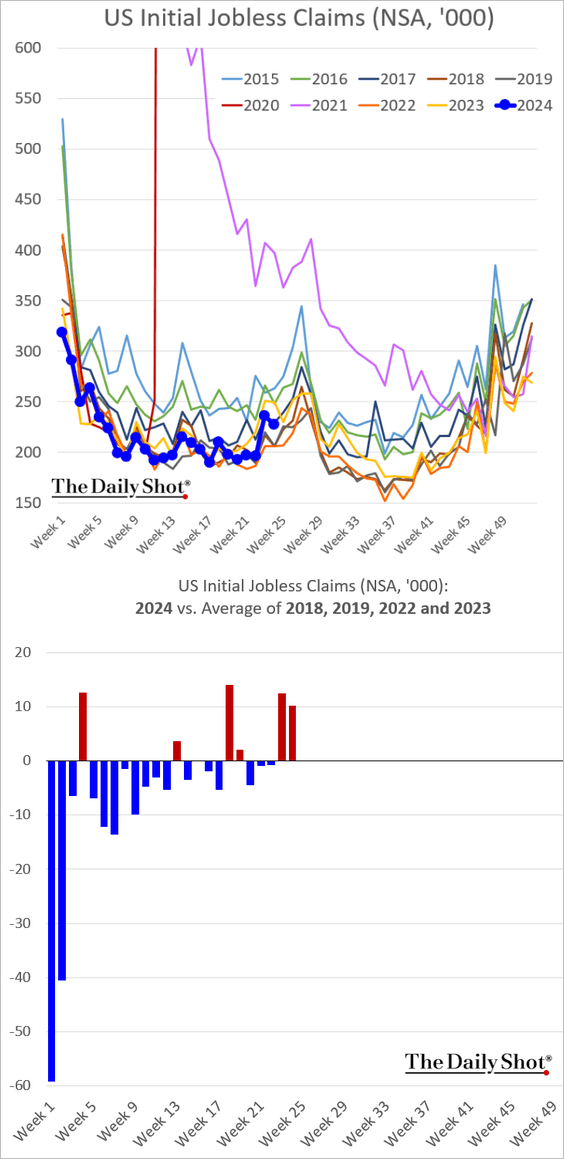
1. Initial jobless claims have been a bit firmer lately.
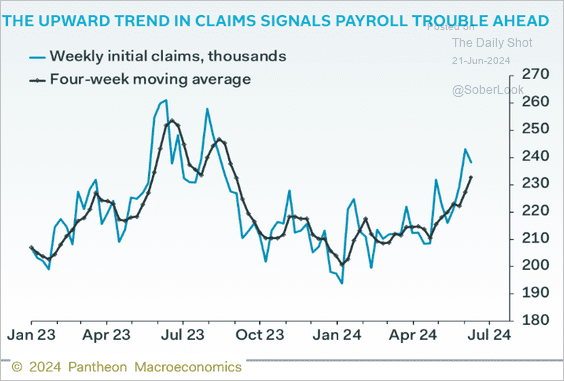 Source: Pantheon Macroeconomics
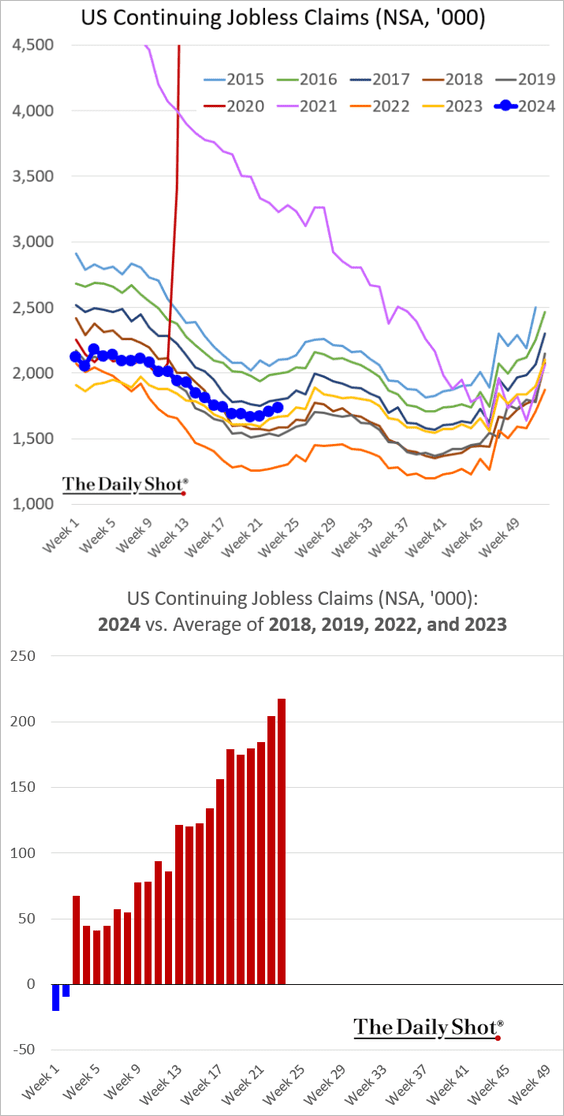
Continuing claims keep diverging from the trends we’ve seen in recent years.
——————–
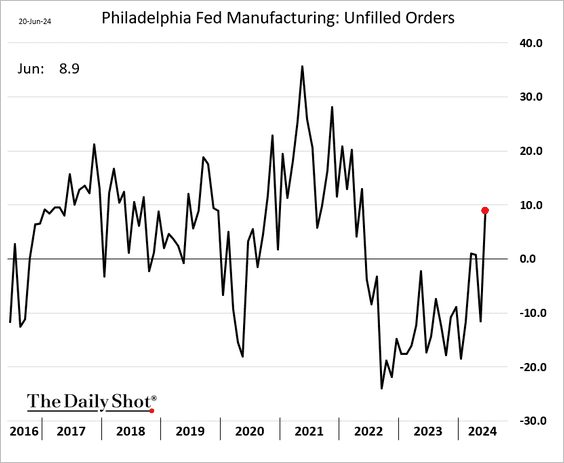
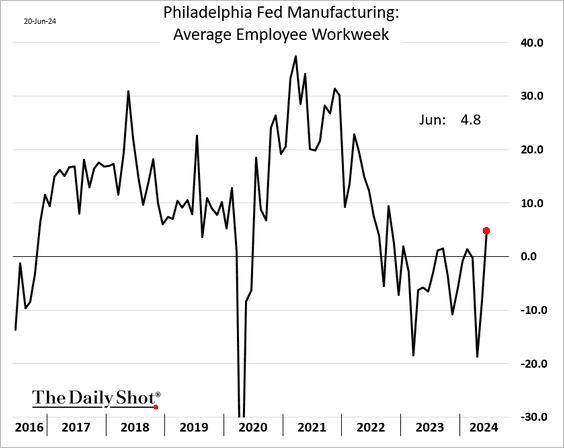
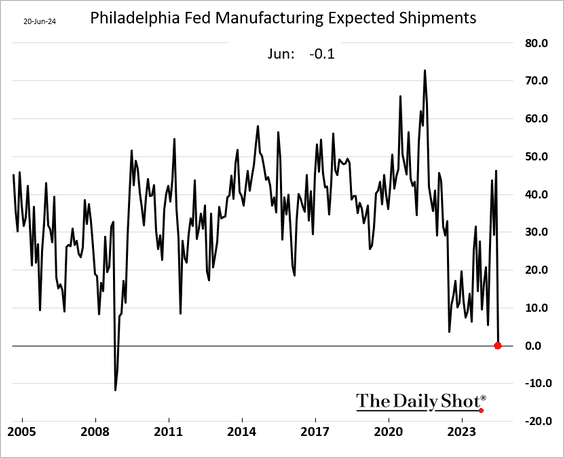
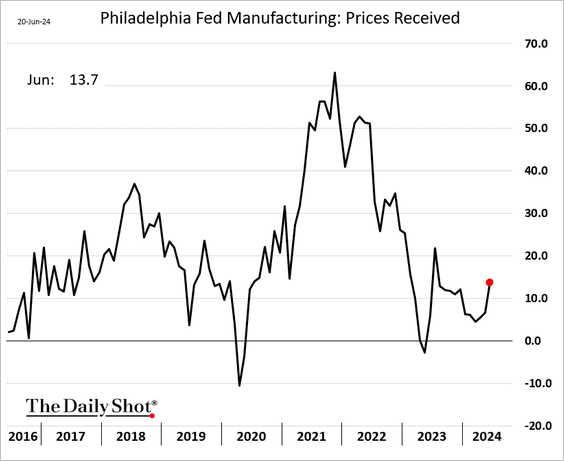
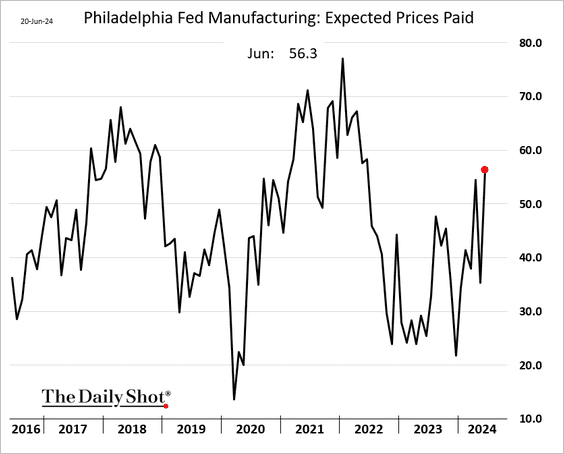
2. The Philly Fed’s regional manufacturing report showed a mixed picture.
• The headline index registered a slowdown.
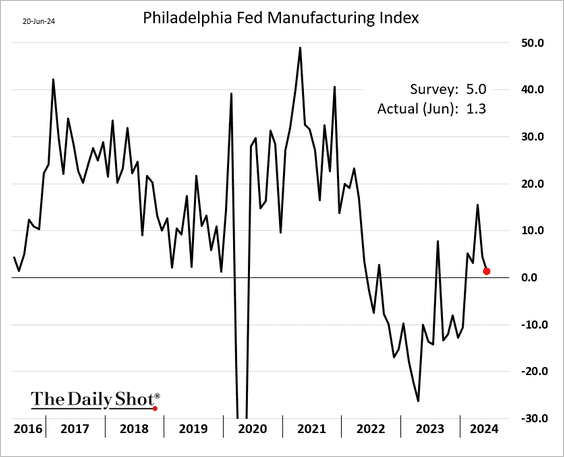
• Demand appears to be firmer.
• Employee hours improved.
• The index of expected shipments hit the lowest level since the GFC.
• More firms are reporting higher prices.
——————–
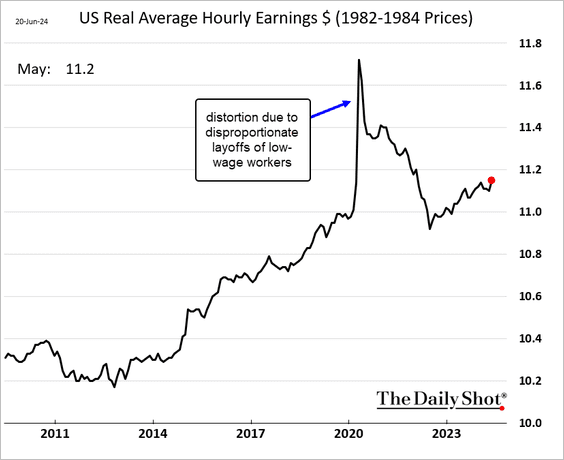
3. US real hourly wages have been trending higher.
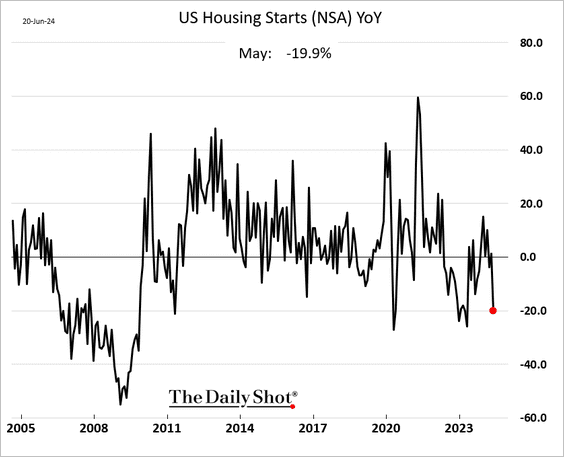
4. Housing starts dipped well below last year’s levels in May.
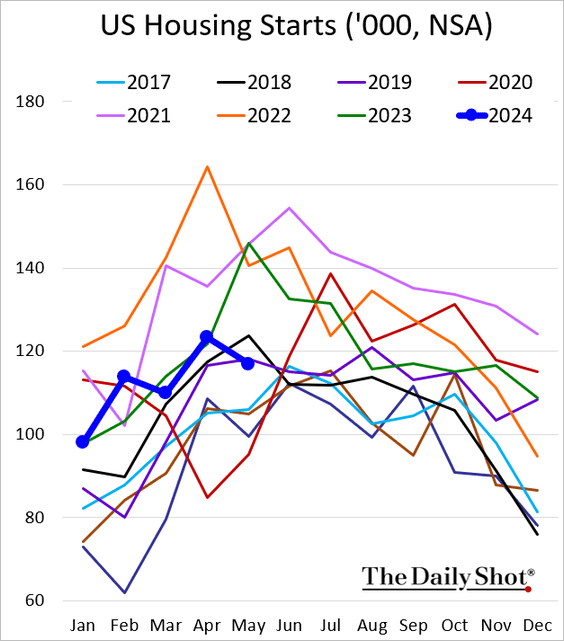
Here is the seasonally adjusted index.
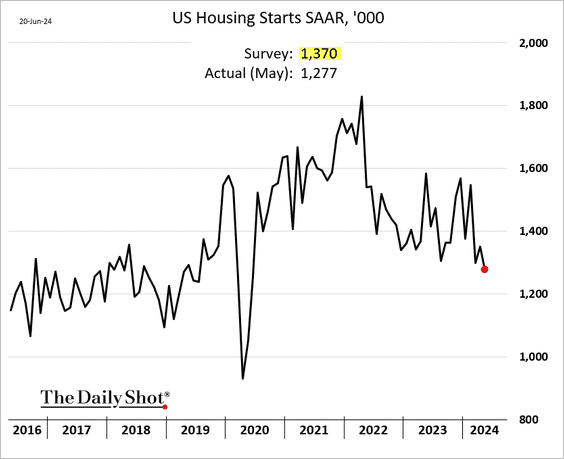
 Source: @economics Read full article
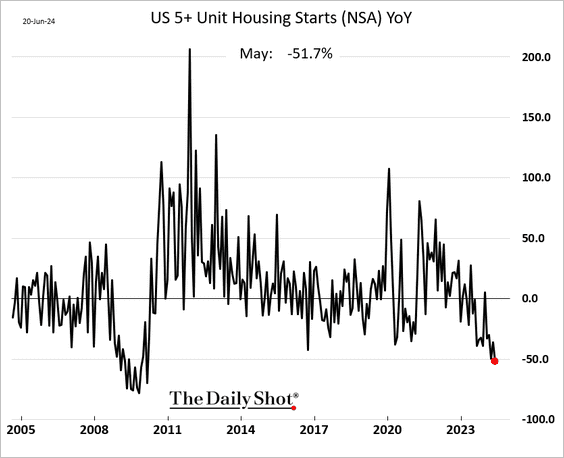
• While construction activity has declined across the board, multifamily housing has been particularly hard hit. Starts are at multi-year lows, …
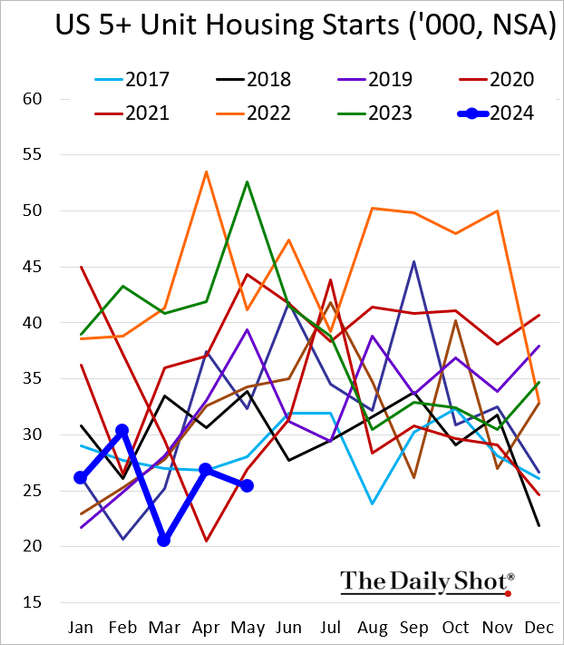
… down almost 52% from a year ago.
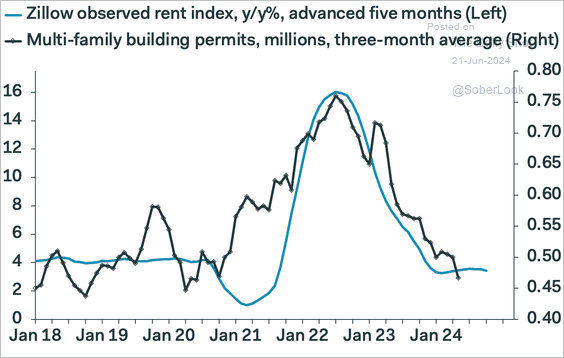
– Multifamily building permits are also at multi-year lows, …
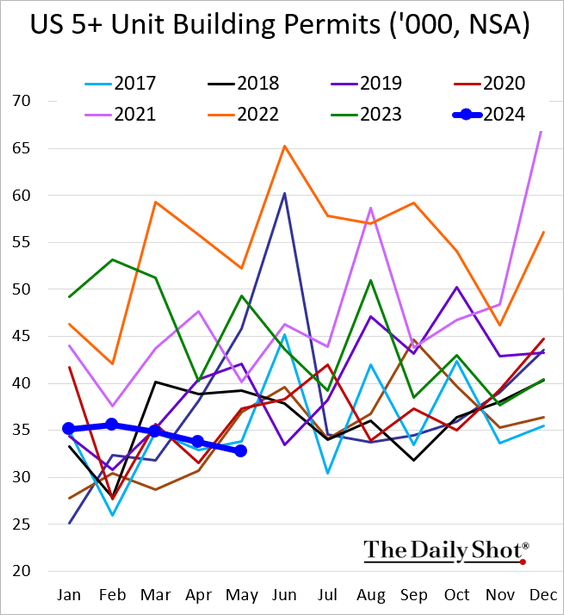
… amid a softer rental market.
 Source: Pantheon Macroeconomics
– This chart illustrates the trends in single-family and multifamily housing permits, seasonally adjusted.
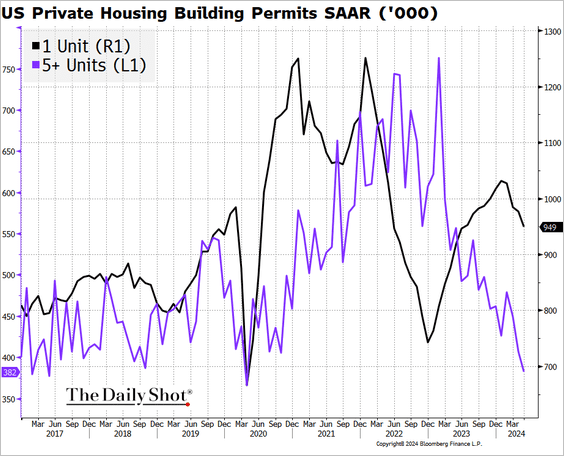 Source: @TheTerminal, Bloomberg Finance L.P.
——————–
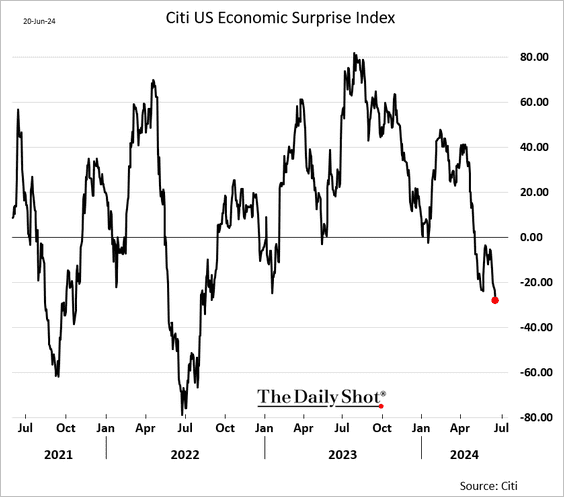
5. The Citi Economic Surprise Index hit its lowest level since 2022.
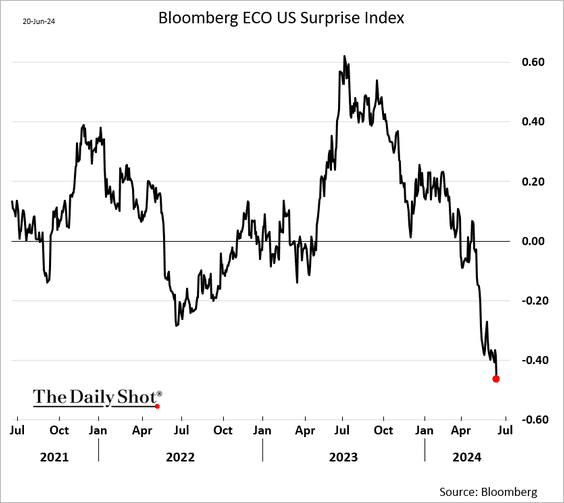
Bloomberg’s economic surprise index is also at multi-year lows.
——————–
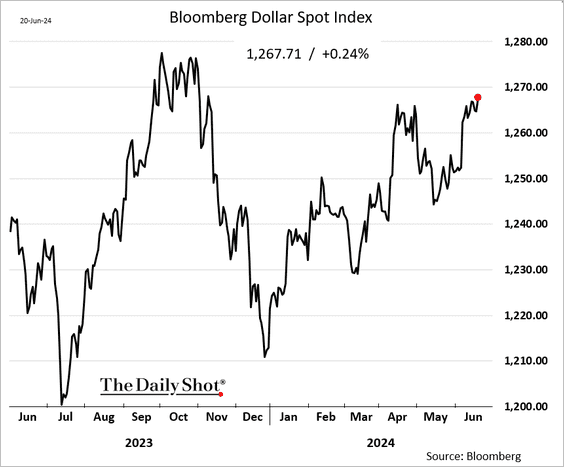
6. The US dollar continues to strengthen. Bloomberg’s dollar index reached its highest level of the year.
Back to Index
The United Kingdom
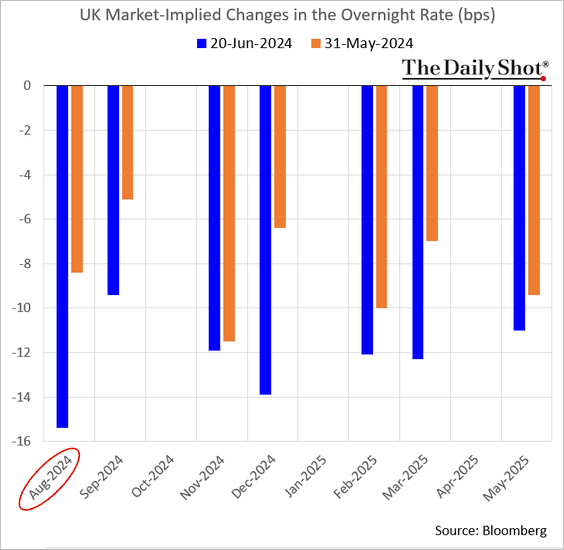
1. The BoE left rates unchanged, striking a somewhat dovish tone. The market expects a rate cut in August.
 Source: CNBC Read full article
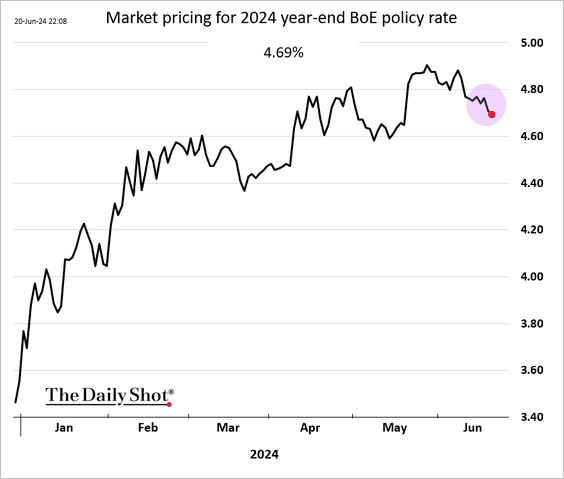
• Here is the market expectation for the year-end base rate.
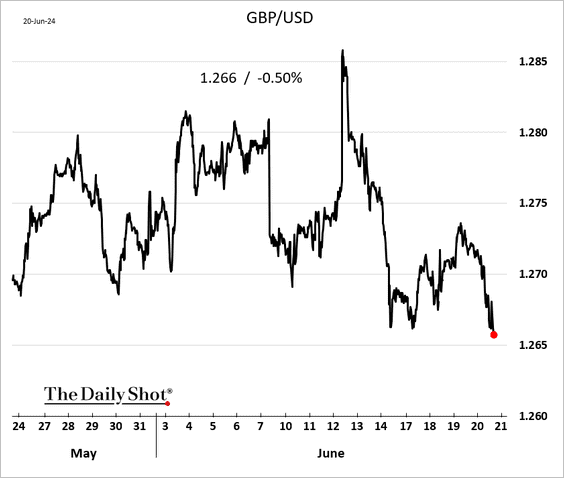
• The pound weakened
——————–
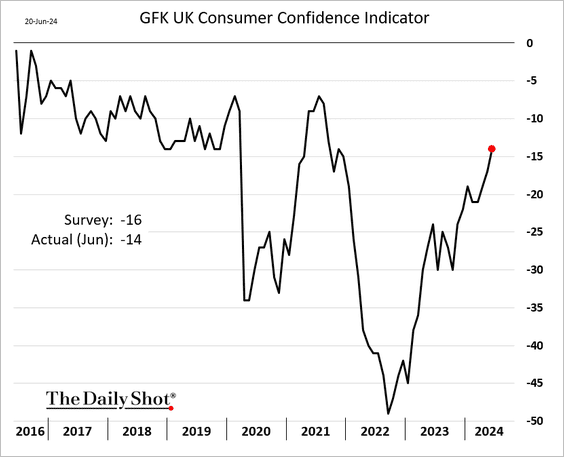
2. Consumer sentiment has been improving.
Back to Index
The Eurozone
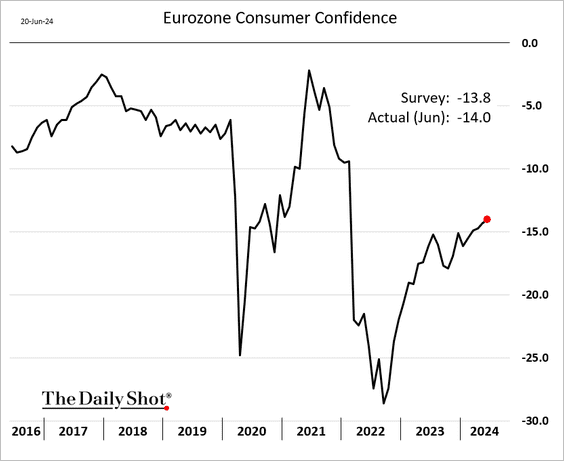
1. Consumer confidence improvements have been slower than expected.
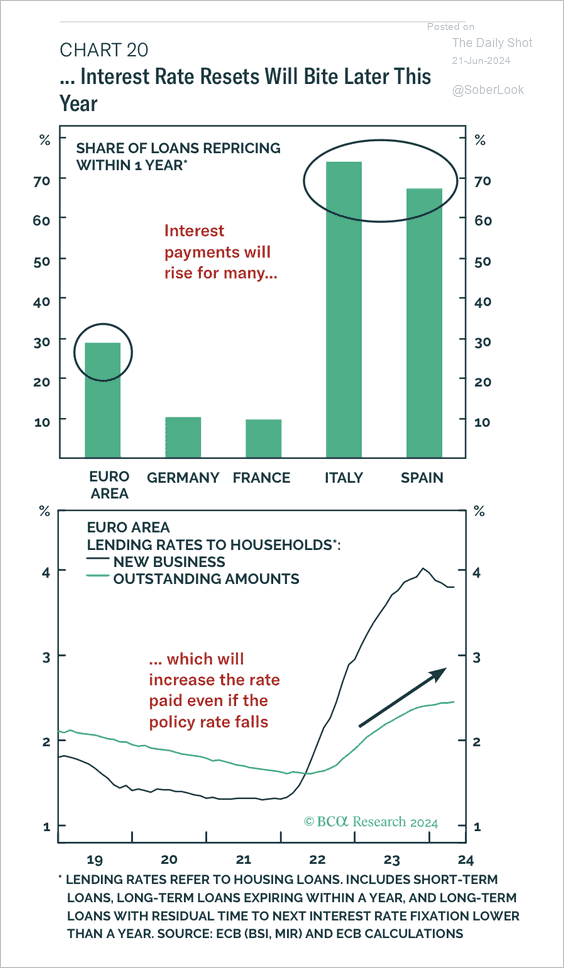
2. Over the next 12 months, a large share of European consumer loans will reset to higher interest rates.
 Source: BCA Research
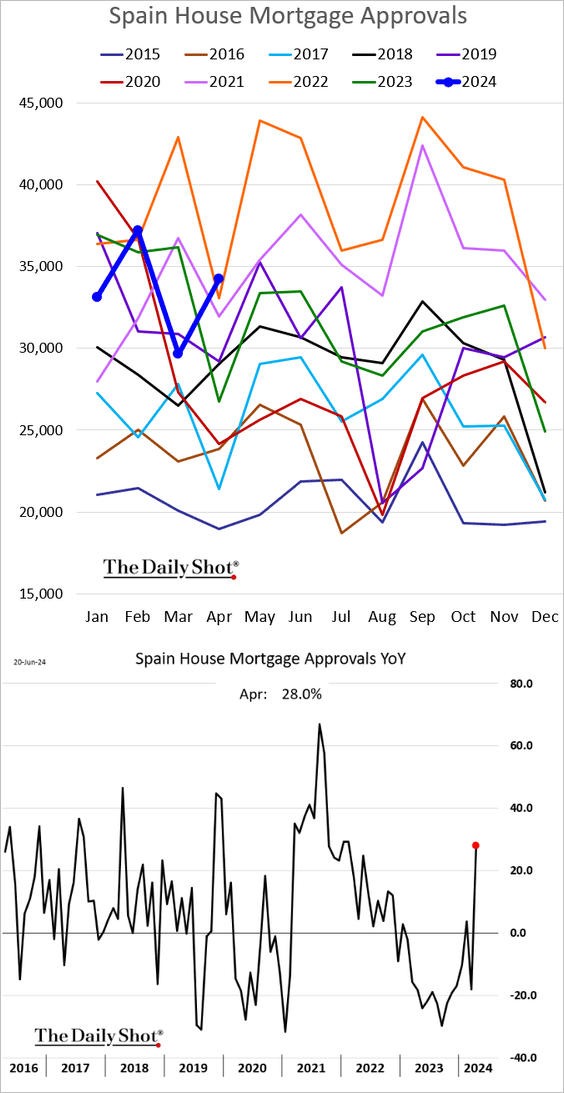
3. Spain’s mortgage approvals hit a multi-year high in April.
4. This chart shows the negative impact of policy tightening on the euro area economy, particularly housing and business investment.
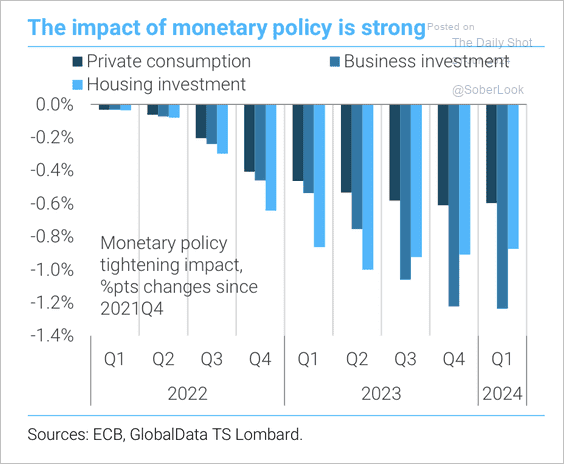 Source: TS Lombard
Back to Index
Europe
1. Norway’s central bank struck a hawkish tone.
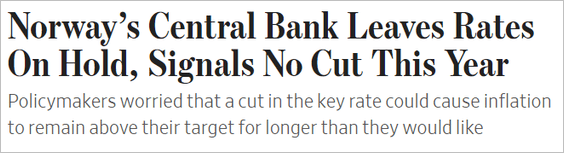 Source: @WSJ Read full article
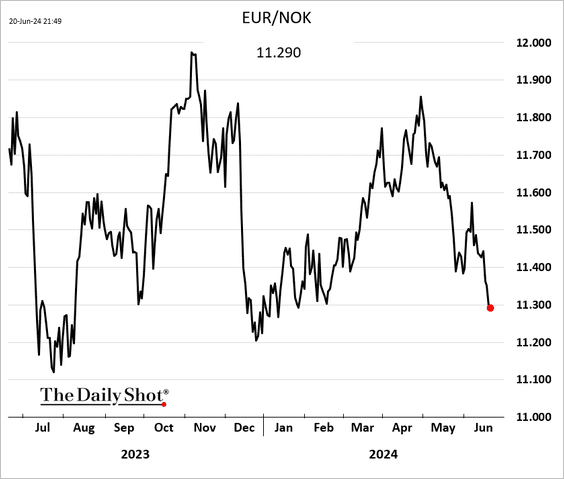
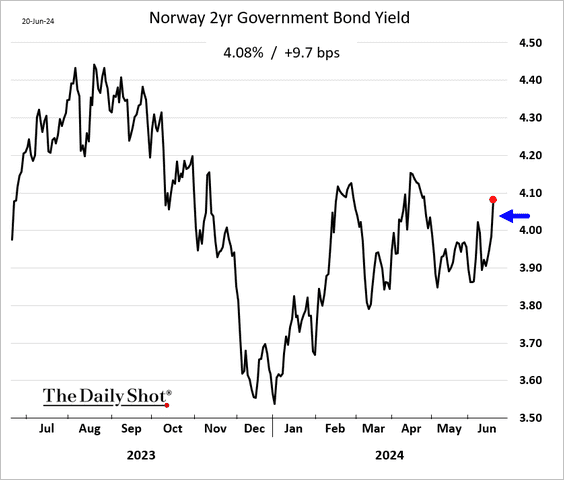
• The Norwegian krone and Norway’s bond yields moved higher.
——————–
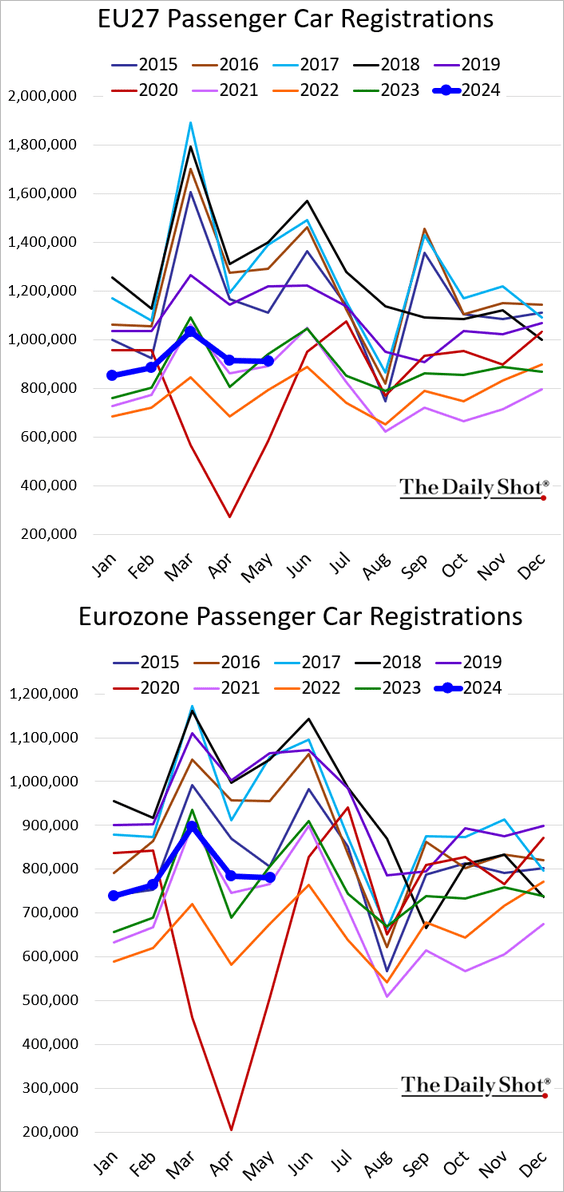
2. New vehicle registrations in the EU dipped below last year’s levels.
3. Next, we have the EU-China trade in new electric vehicles.
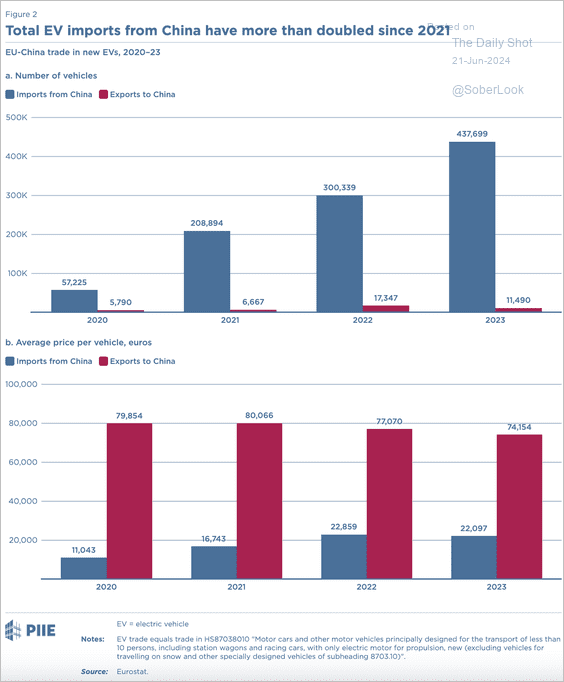 Source: PIIE Read full article
4. Here is a look at changes in livestock populations in the EU.
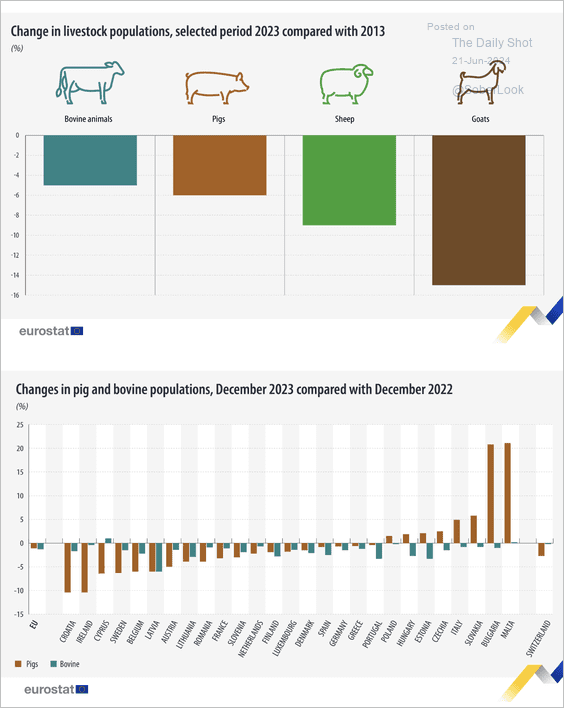 Source: Eurostat Read full article
Back to Index
Japan
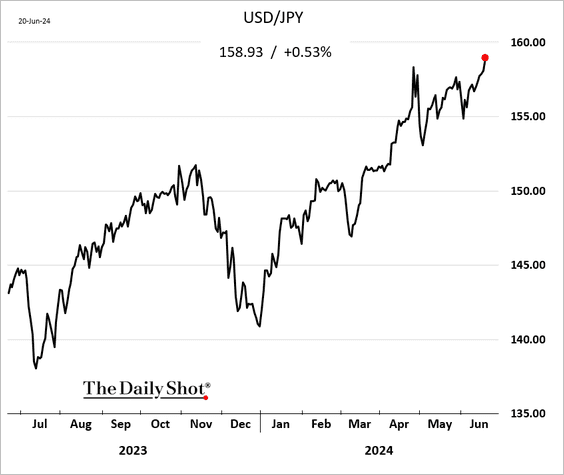
1. The yen continues to weaken, causing unease in both Tokyo and Washington.
 Source: Reuters Read full article
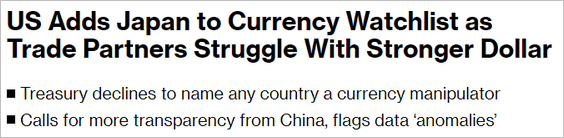 Source: @markets Read full article
——————–
2. The headline CPI increased, driven by higher fuel and utilities costs, yet it remained below forecasts. Meanwhile, core inflation continues to moderate.
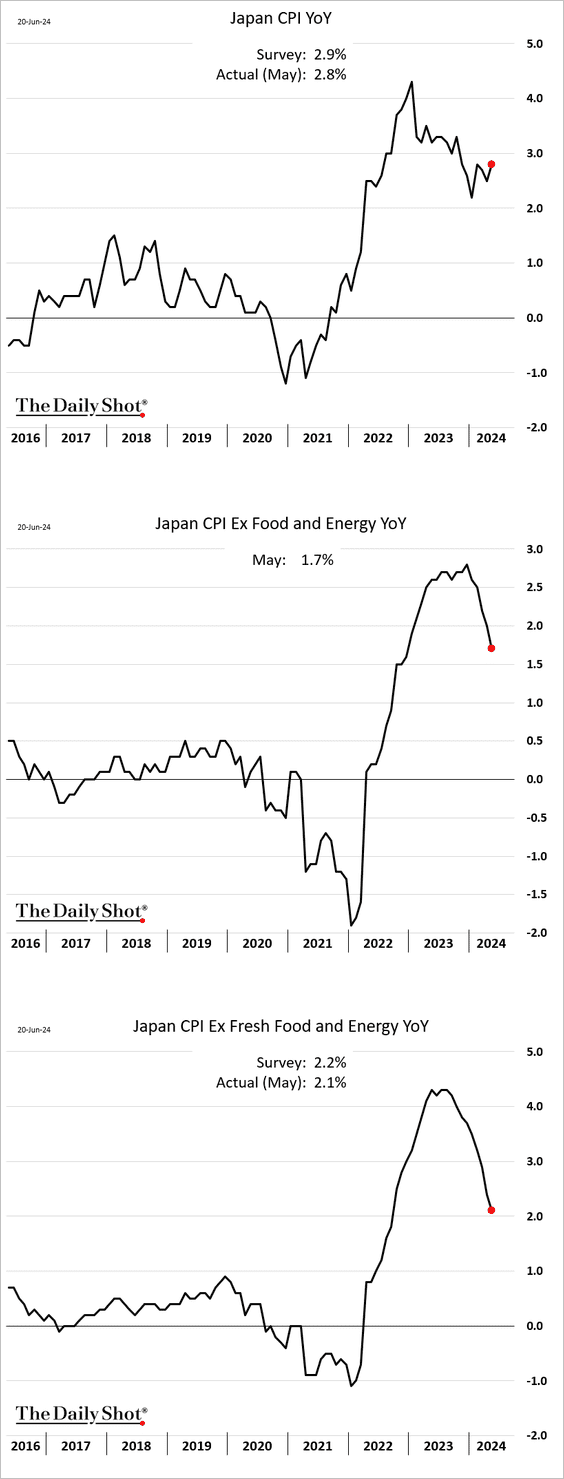
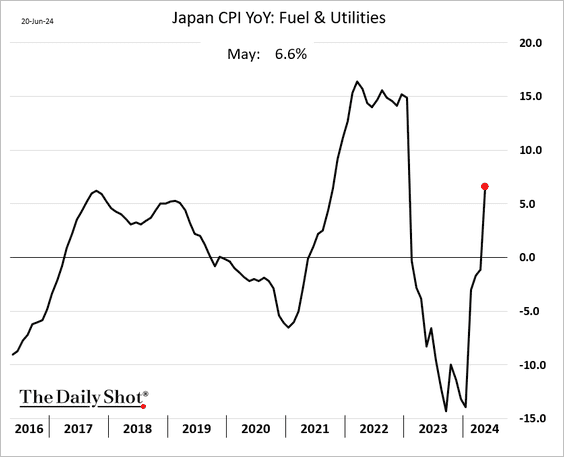
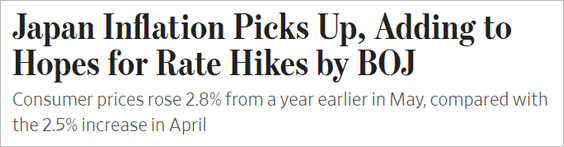 Source: @WSJ Read full article
——————–
3. The manufacturing activity barely grew in June as price increases accelerated.
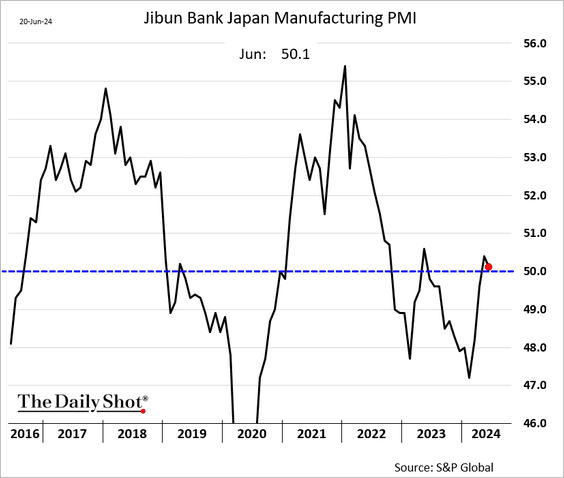
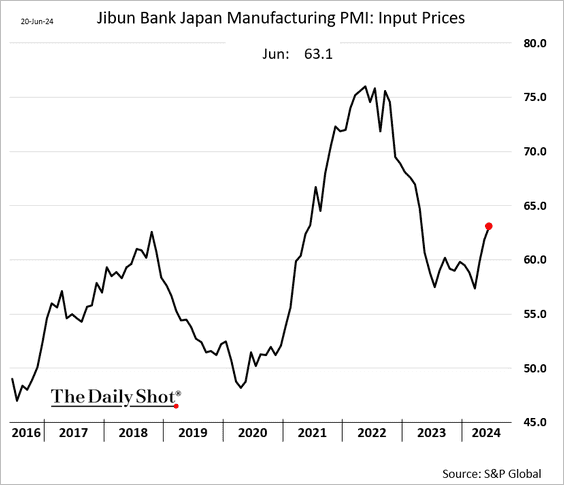
 Source: Reuters Read full article
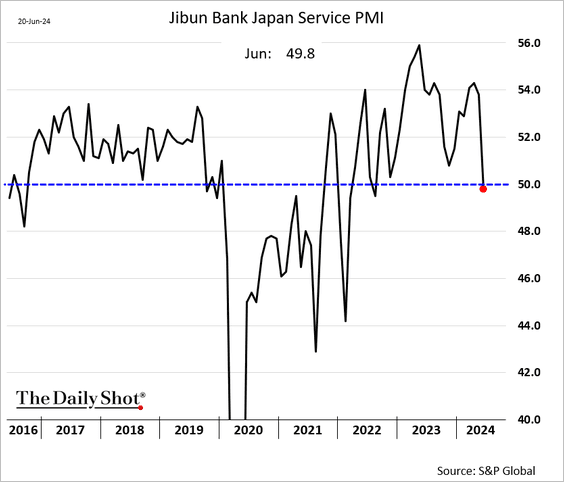
• Services moved into contraction for the first time since 2022.
Back to Index
Asia-Pacific
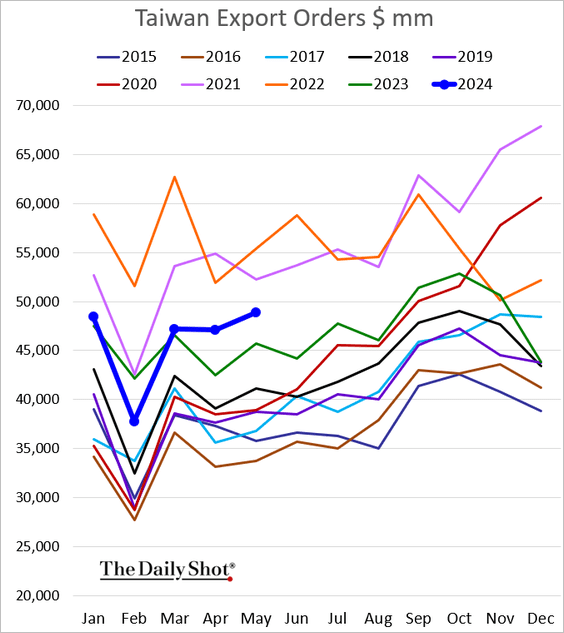
1. Taiwan’s export orders remain well above last year’s levels.
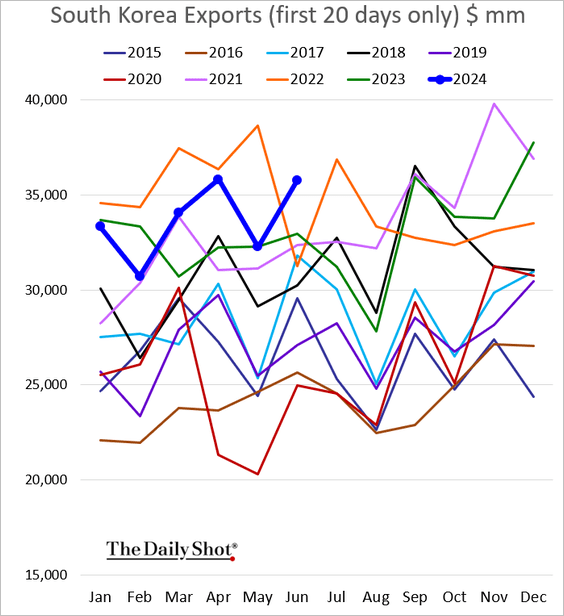
2. South Korea’s exports hit a new high for the month of June.
• Here is South Korea’s current account balance with the US and China.
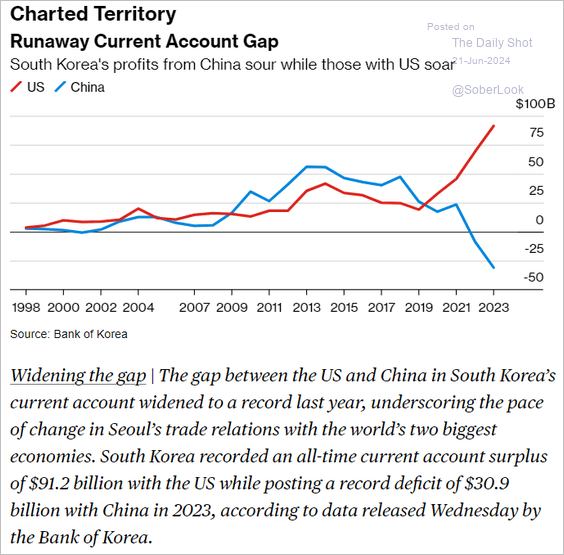 Source: @economics Read full article
——————–
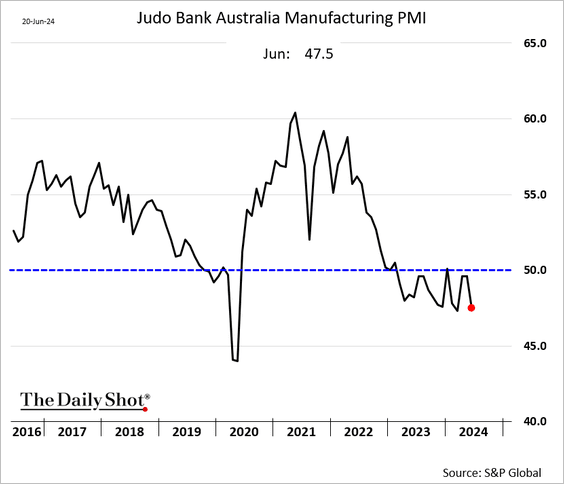
3. Australia’s manufacturing activity moved deeper into contraction territory.
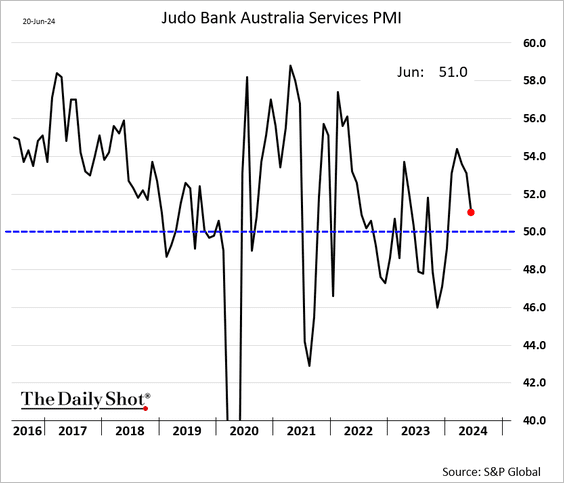
Service sector growth slowed.
Back to Index
China
1. Foreigners have been selling mainland shares.
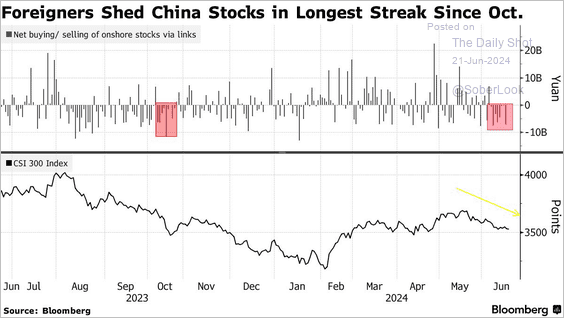 Source: @markets Read full article
2. The credit impulse has turned negative again, largely reflecting the slowdown in social financing.
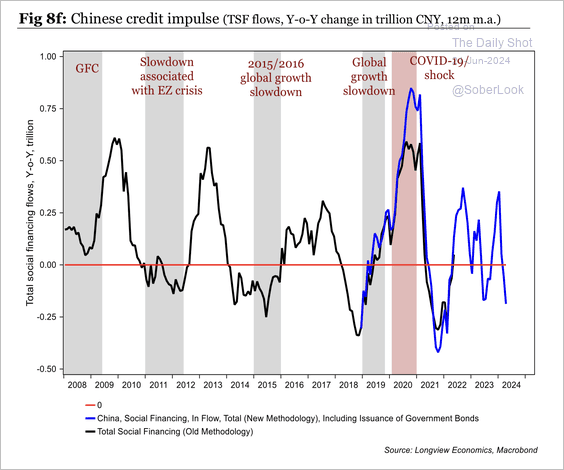 Source: Longview Economics
Back to Index
Emerging Markets
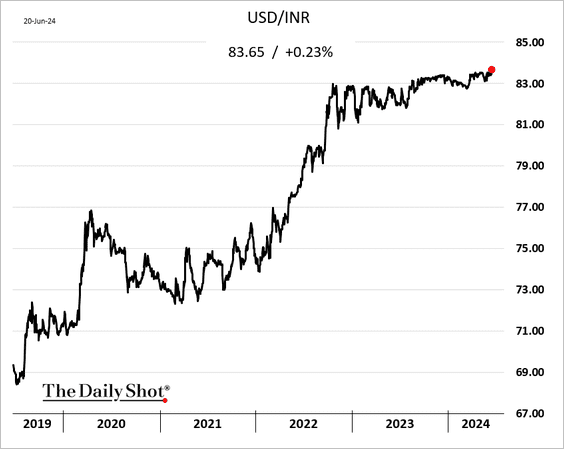
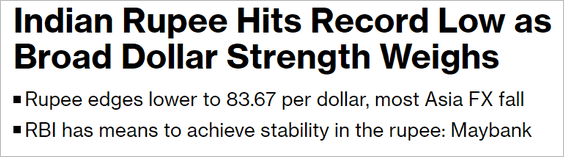
1. The Indian rupee hit a record low vs. USD.
 Source: @markets Read full article
——————–
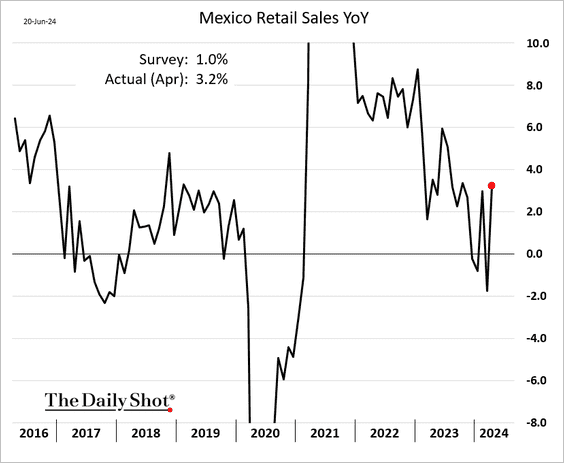
2. Mexican retail sales strengthened in April.
3. There have been wide divergences within the EM currency space.
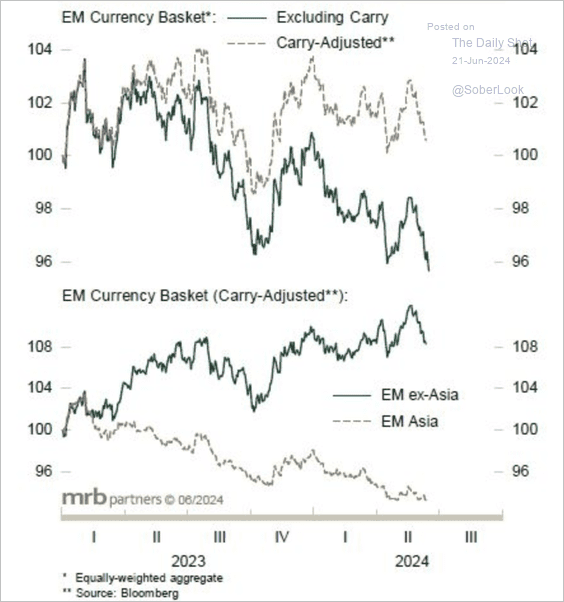 Source: MRB Partners
Back to Index
Cryptocurrency
1. So far, it has been a mixed quarter for cryptos, with Ether (ETH) outperforming and XRP underperforming top peers.
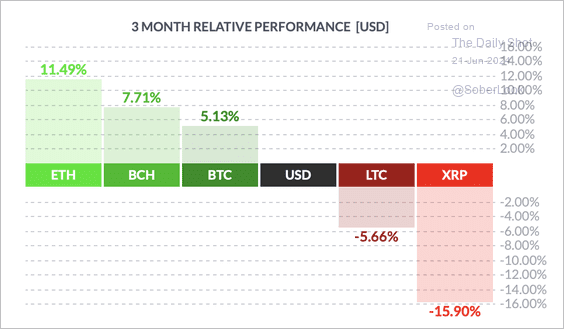 Source: FinViz
2. ETH/USD remains stuck below resistance, which prevented a swift retest of the 2021 all-time-high.
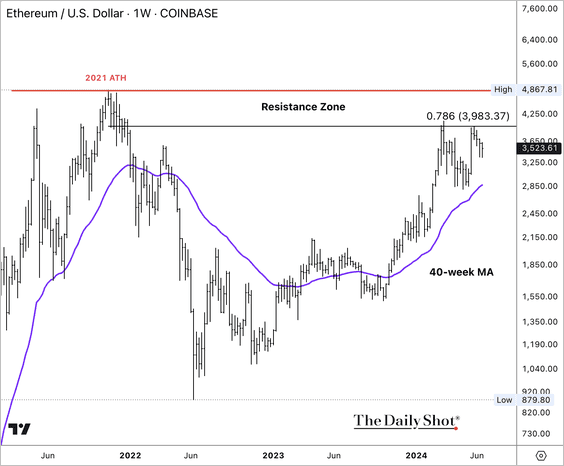
3. There has been a pickup in ETH long liquidations as the crypto pulled back from the $3,983 resistance level.
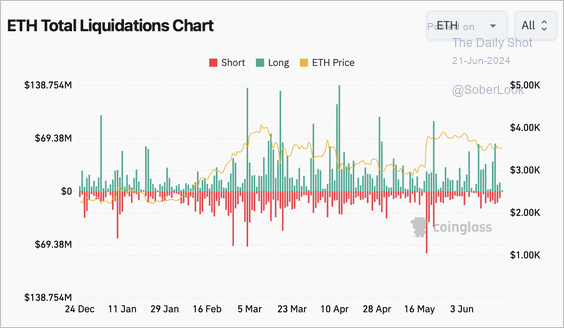 Source: Coinglass
4. Liquidity among memecoins reached an all-time high earlier this month before retreating slightly.
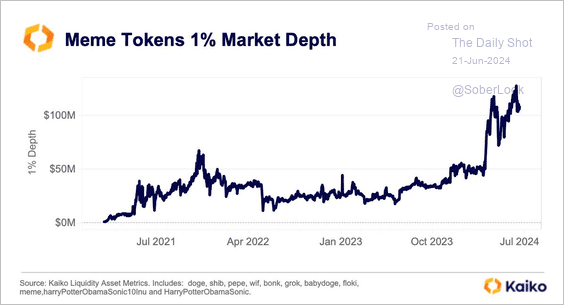 Source: @KaikoData
5. Stablecoin issuers have become an emerging source of demand for Treasury notes.
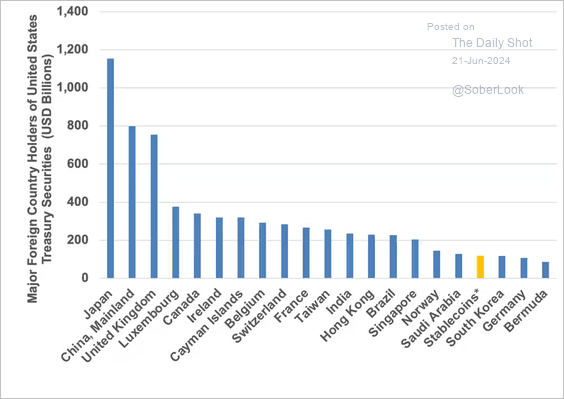 Source: CoinDesk Read full article
Back to Index
Commodities
1. Here are some updates on copper.
• Investors remain bullish.
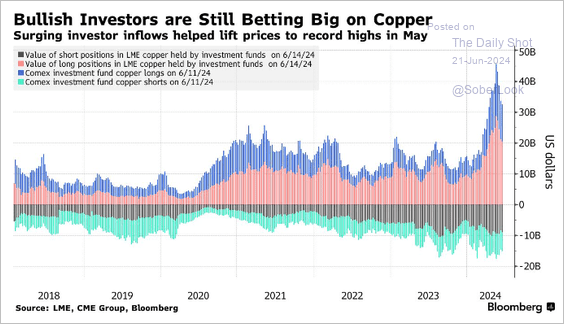 Source: @markets Read full article
• China is importing scrap copper …
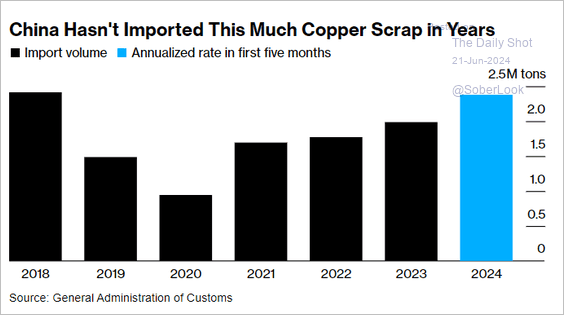 Source: @markets Read full article
… and flooding the market with cheap copper exports.
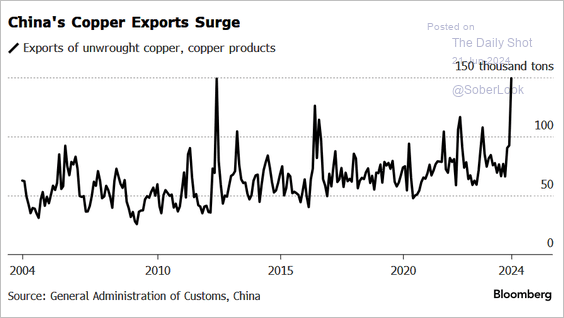 Source: Yahoo Finance, @markets Read full article
——————–
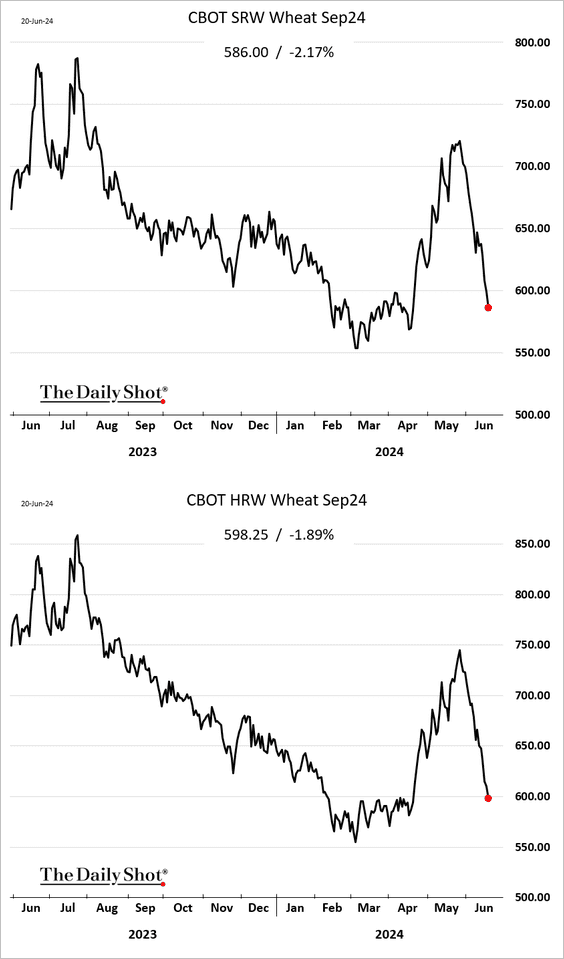
2. Wheat prices remain under pressure.
• Russia has been gaining wheat market share at Ukraine’s expense.
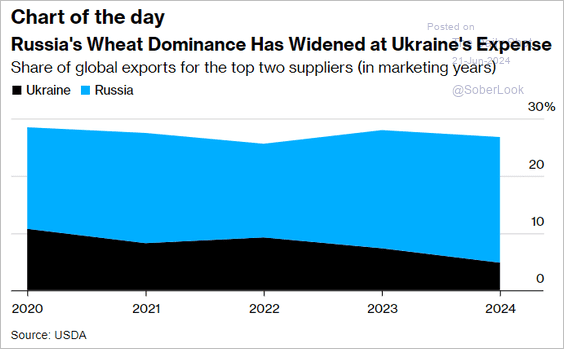 Source: @JLeeEnergy, @markets Read full article
Back to Index
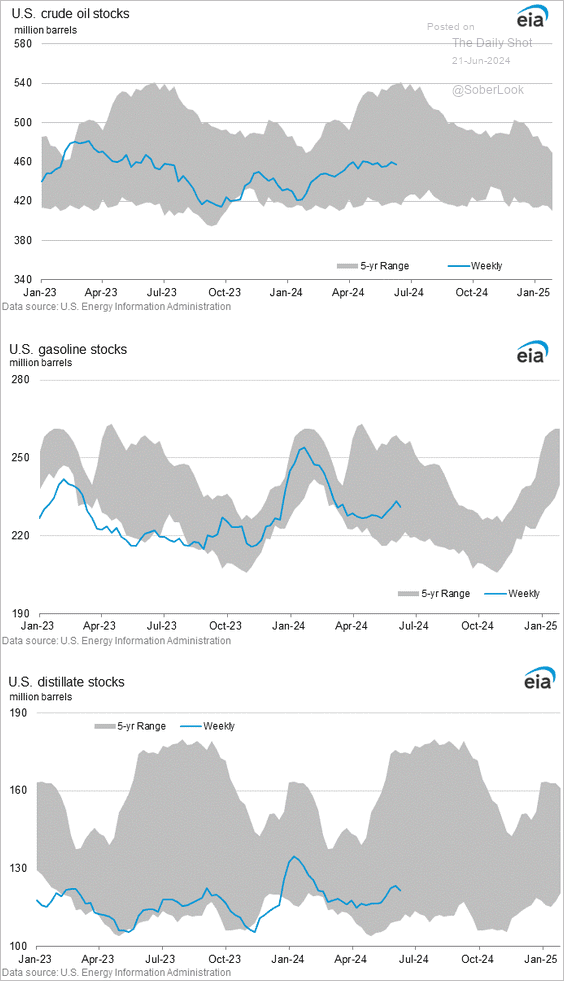
Energy
US inventories of crude oil and refined products declined last week.
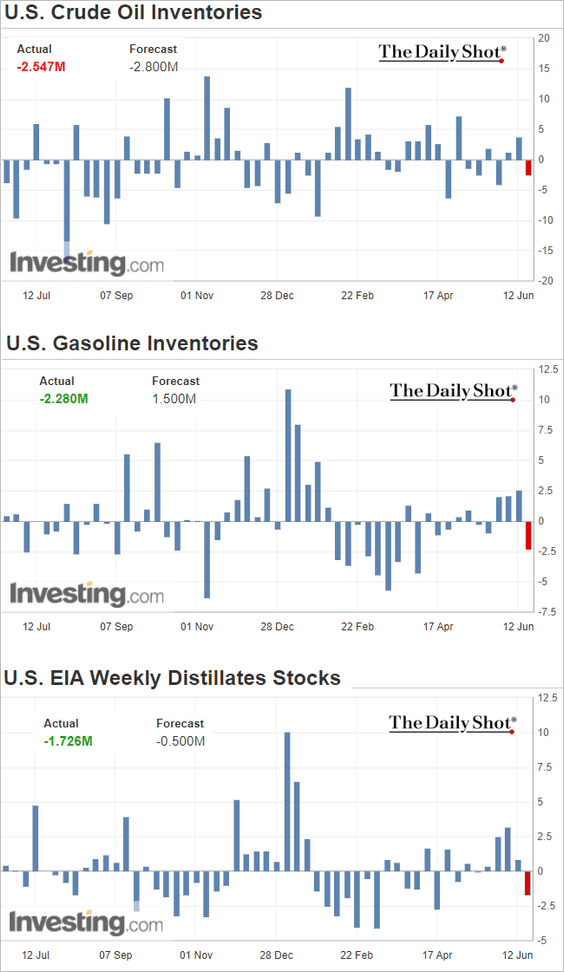
Here are the levels.
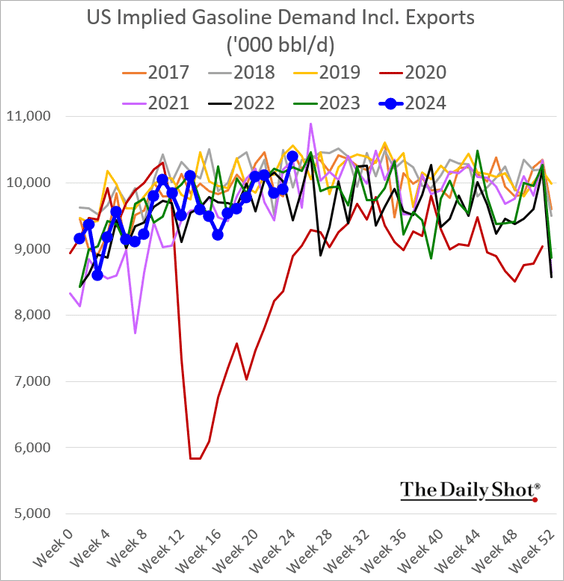
• US gasoline demand has firmed up.
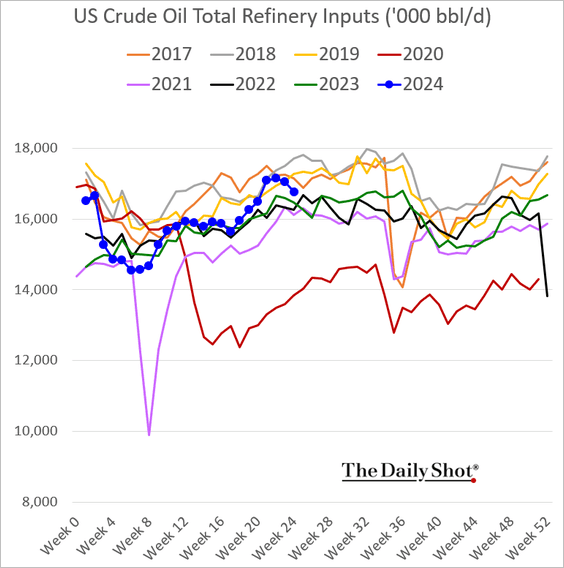
• Refinery runs eased last week.
Back to Index
Equities
1. A lot of options contracts are expiring today
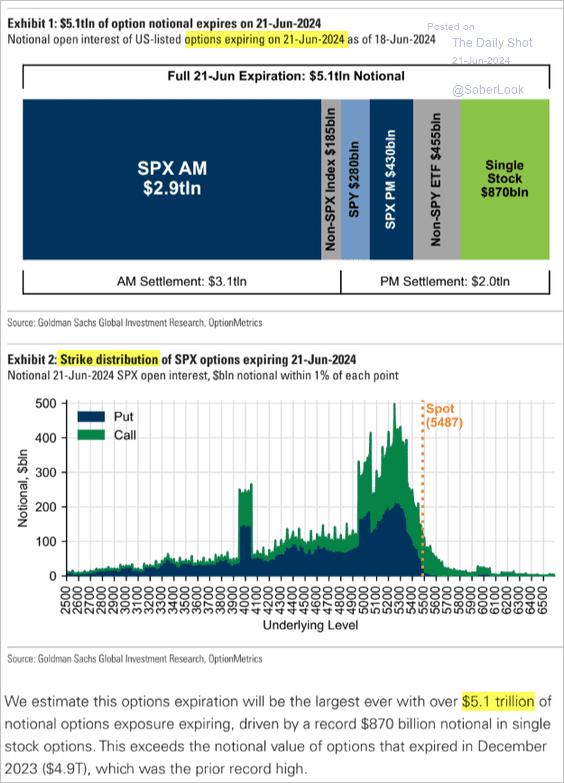 Source: Goldman Sachs; @WallStJesus
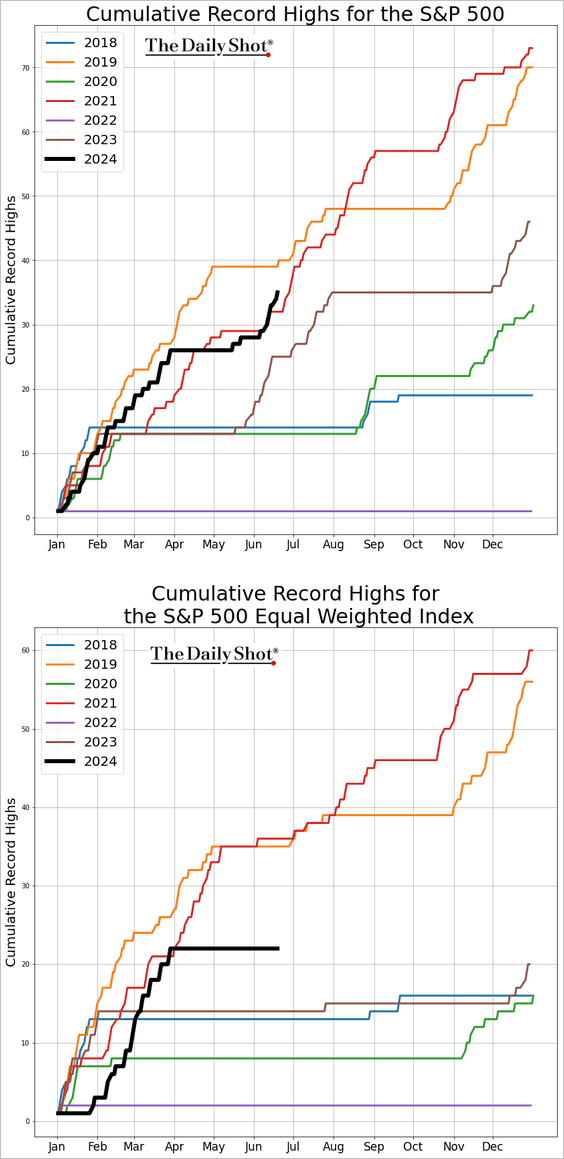
2. This chart shows the cumulative count of record highs by year for the S&P 500 and the S&P 500 Equal Weight Index.
3. The current bull market has caught up to the average trend.
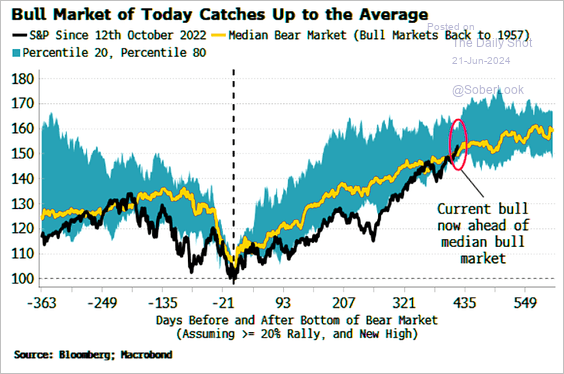 Source: Simon White, Bloomberg Markets Live Blog
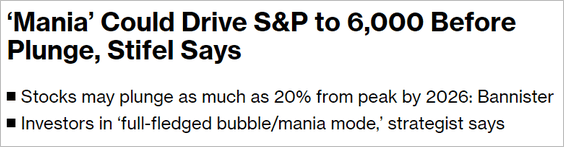
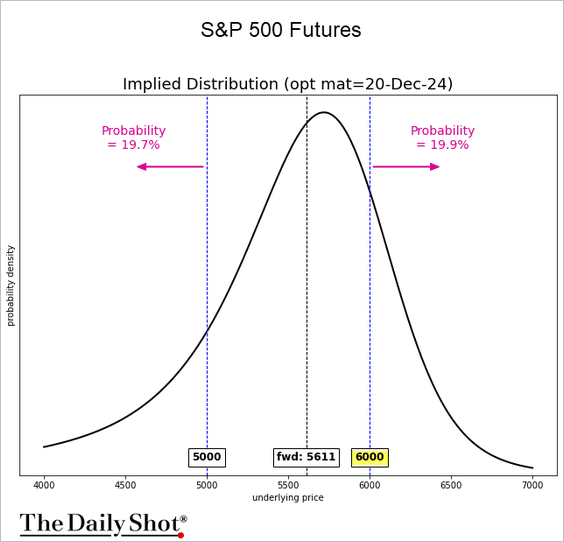
4. There has been talk of the S&P 500 hitting 6,000.
 Source: @markets Read full article
The options market estimates roughly a 20% probability that the S&P 500 will exceed 6000 by year-end. The index is similarly likely to fall below 5000.
——————–
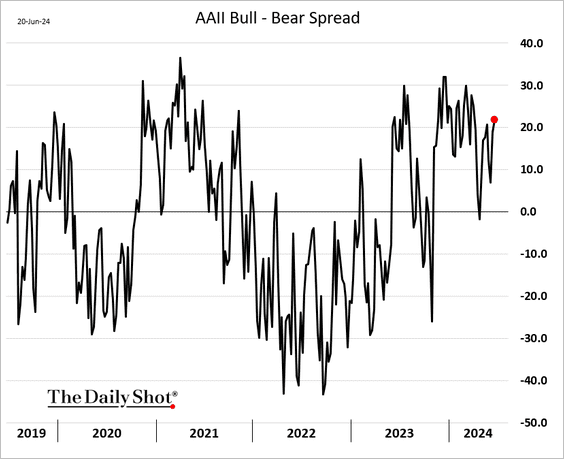
5. Retail investors are relatively bullish.
• But retail stock purchases have slowed in recent months.
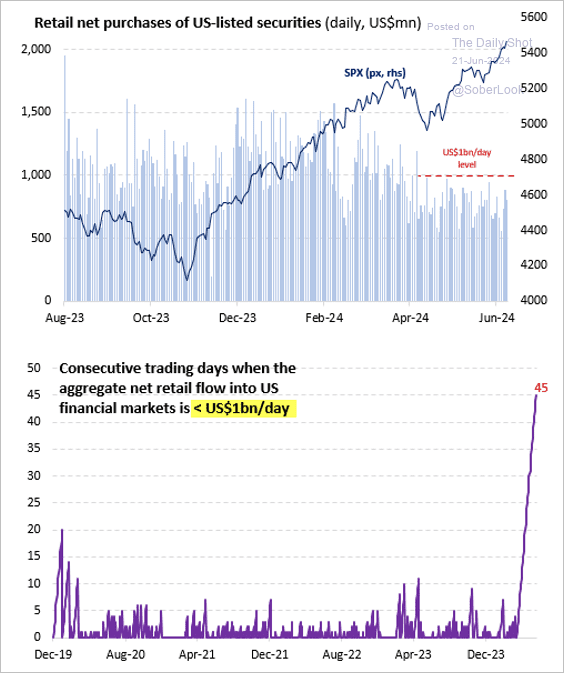 Source: Vanda Research
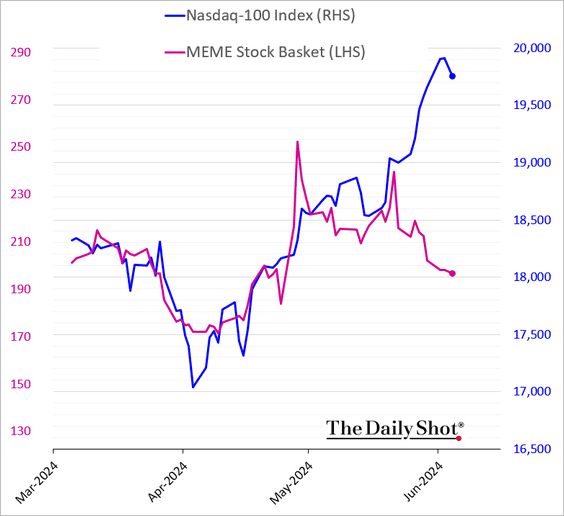
• Meme stocks have been sinking.
——————–
6. The Treasury’s cash balance at the Fed has increased, …
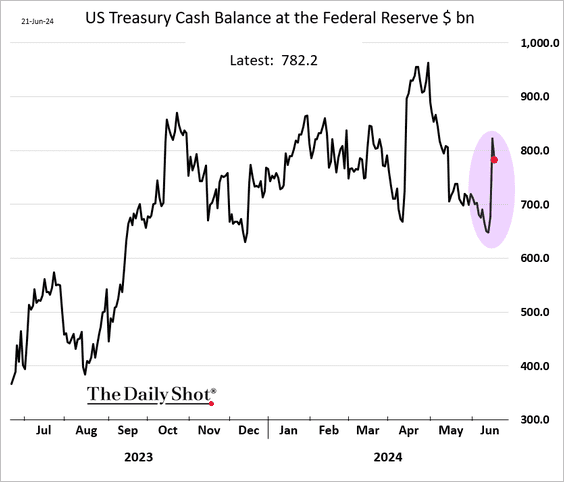
… which tends to reduce liquidity. This chart shows the Fed reserve balances.
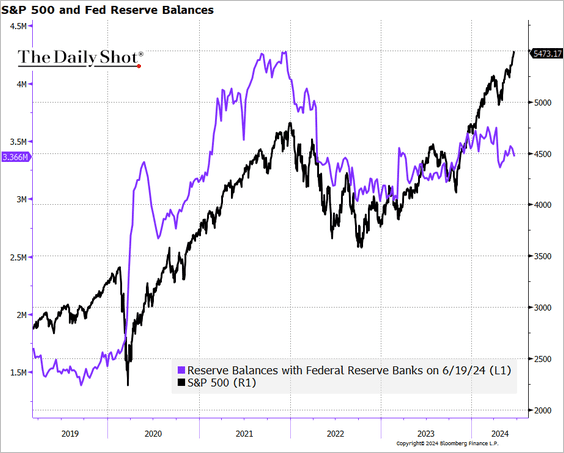 Source: @TheTerminal, Bloomberg Finance L.P.
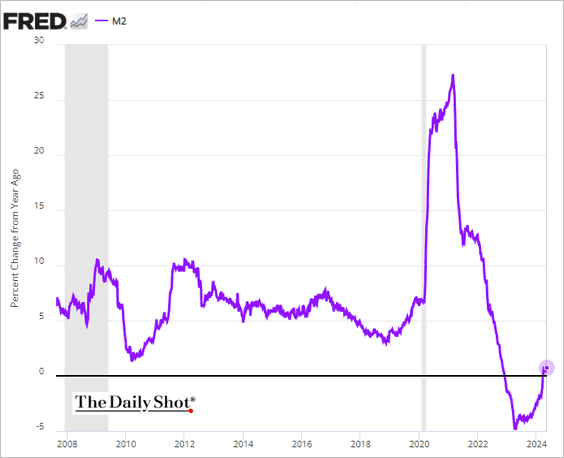
• And broader liquidity growth has been tepid. Will this create a drag on stocks?
• Perhaps global liquidity will help?
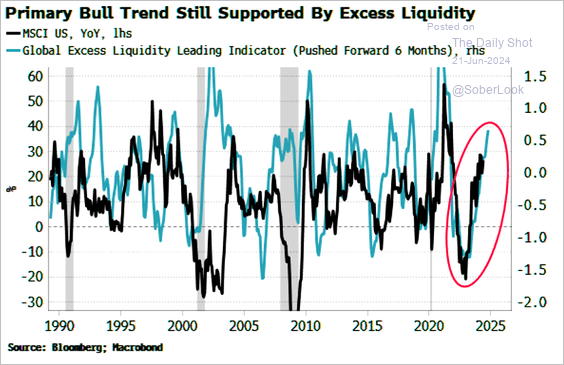 Source: Simon White, Bloomberg Markets Live Blog
• What happens when short-term rates decline and investors in money market funds begin searching for the next destination for their capital?
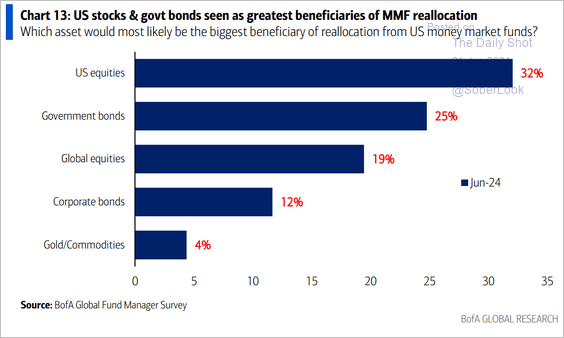 Source: BofA Global Research
——————–
7. The average SP 500 stock valuation discount to the index continues to widen.
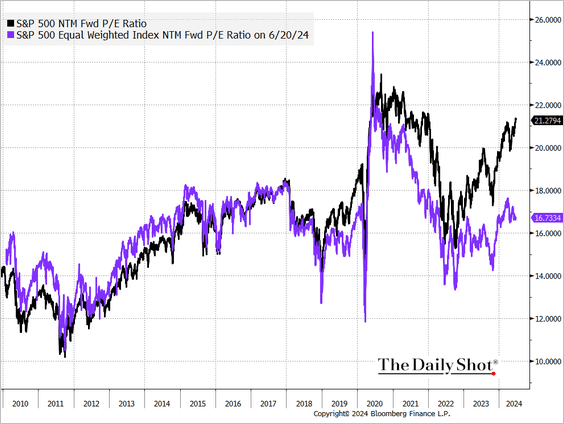 Source: @TheTerminal, Bloomberg Finance L.P.
8. Here is a look at the trajectory of consensus earnings revisions.
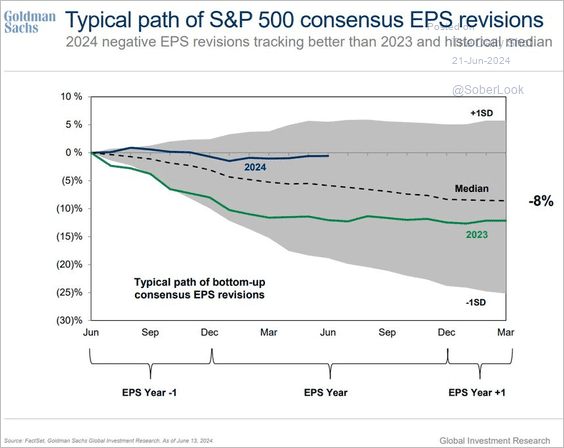 Source: Goldman Sachs; @MikeZaccardi
9. Earnings expectations for small caps have recently increased, yet they continue to lag behind the trend for large caps.
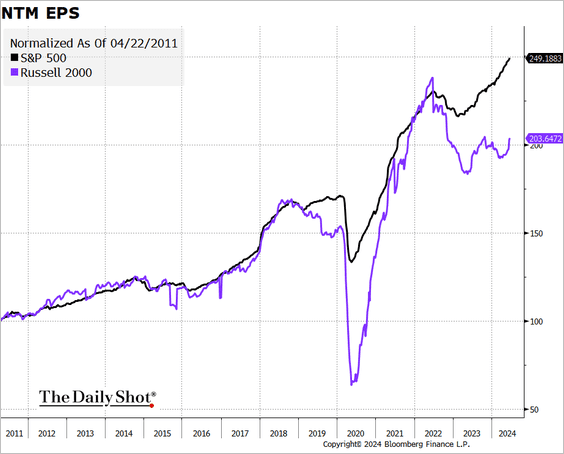 Source: @TheTerminal, Bloomberg Finance L.P.
Back to Index
Credit
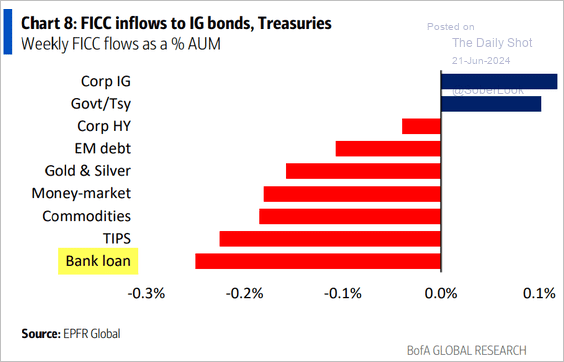
1. Investors have started getting out of leverage loans as the market expects Fed rate cuts ahead (leverage loans are a floating rate product).
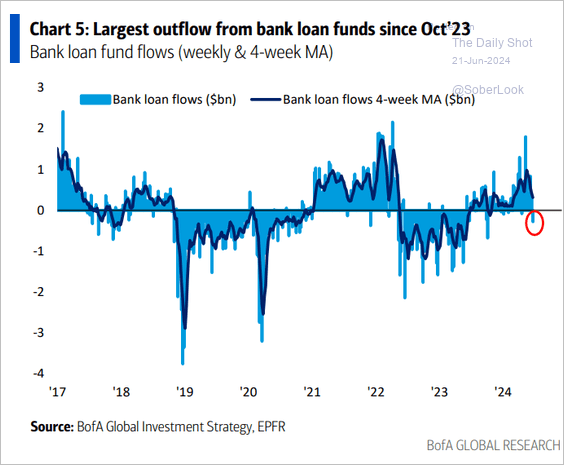 Source: BofA Global Research
 Source: BofA Global Research
——————–
2. Here is a look at US corporate bond issuance.
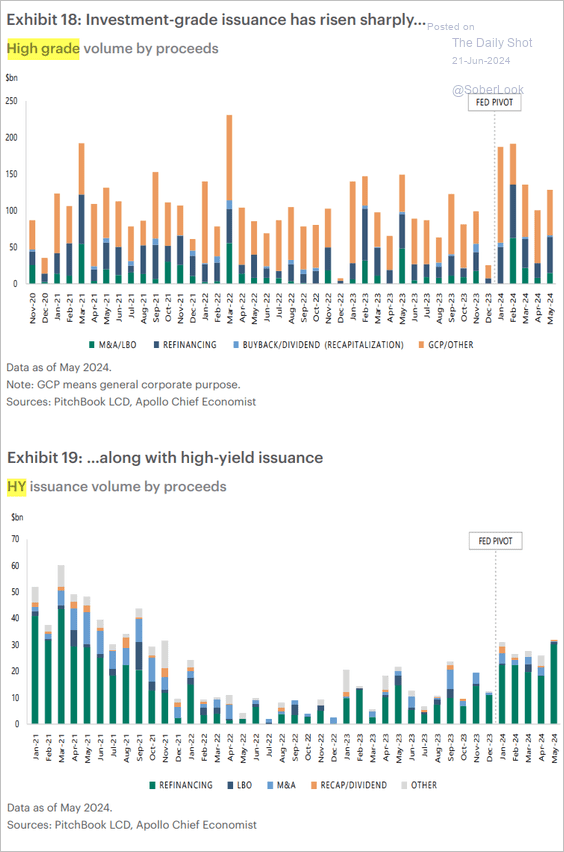 Source: Torsten Slok, Apollo
——————–
Food for Thought
1. US Employee Motivation and Commitment Index:
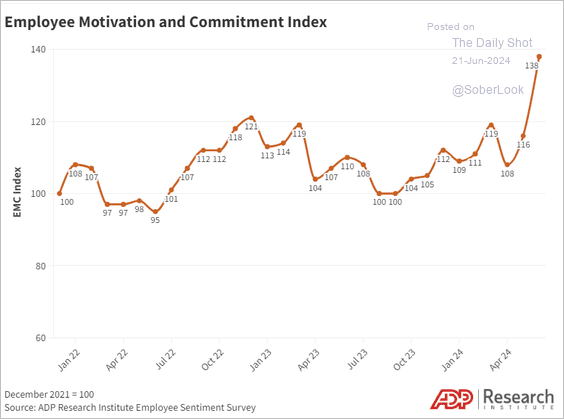 Source: ADP Read full article Further reading
2. Countries offering digital nomad visas and length of stay allowed:
 Source: Visual Capitalist Read full article
3. Police and sheriff’s patrol officer wages adjusted for cost of living:
 Source: USAFacts
4. Youth voter sentiment on election impact in the US:
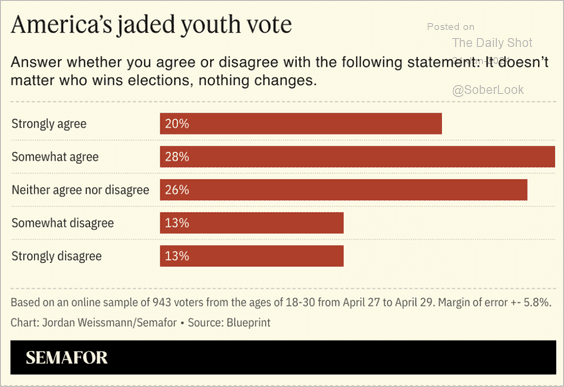 Source: Semafor
5. Change in crime rates:
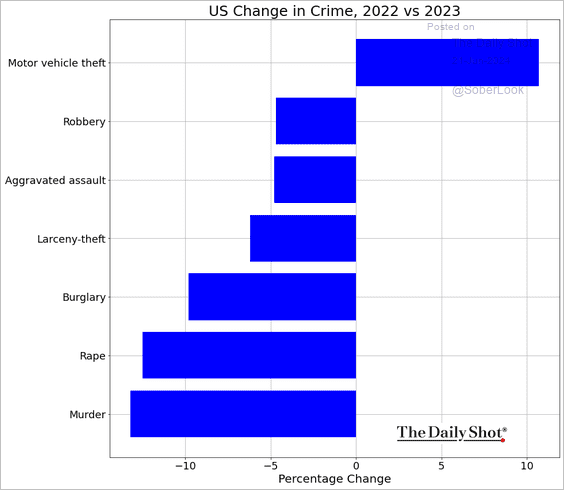 Source: @Crimealytics
6. Percentage of households renting in selected countries:
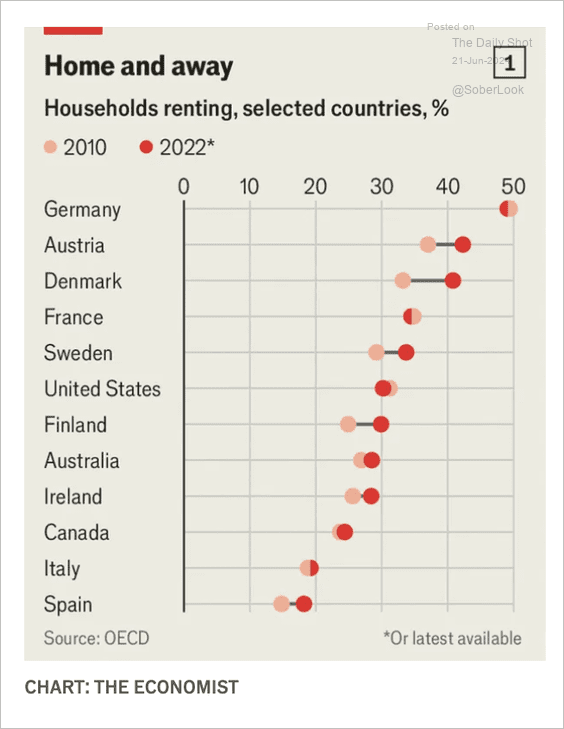 Source: The Economist Read full article
7. Density of hail events:
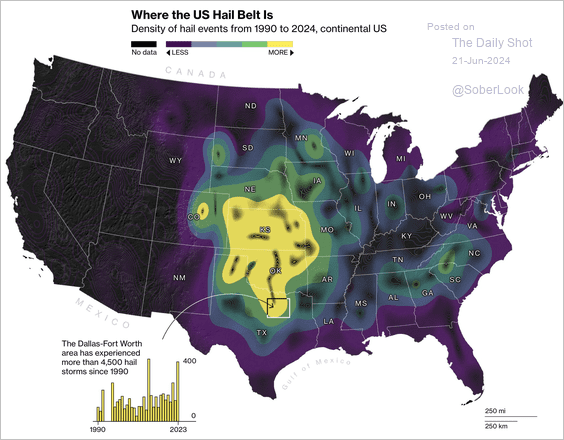 Source: @bbgvisualdata Read full article
——————–
Have a great weekend!
Back to Index