
The Daily Shot: 17-Mar-20
• Equities
• Credit
• Rates
• Commodities
• Energy
• Emerging Markets
• China
• Asia – Pacific
• Europe
• The Eurozone
• The United Kingdom
• Canada
• The United States
• Global Developments
• Food for Thought
Equities
1. The S&P 500 declined 12% on Monday – the worst one-day drop since 1987. The index is now near the 2018 “Christmas selloff” lows.
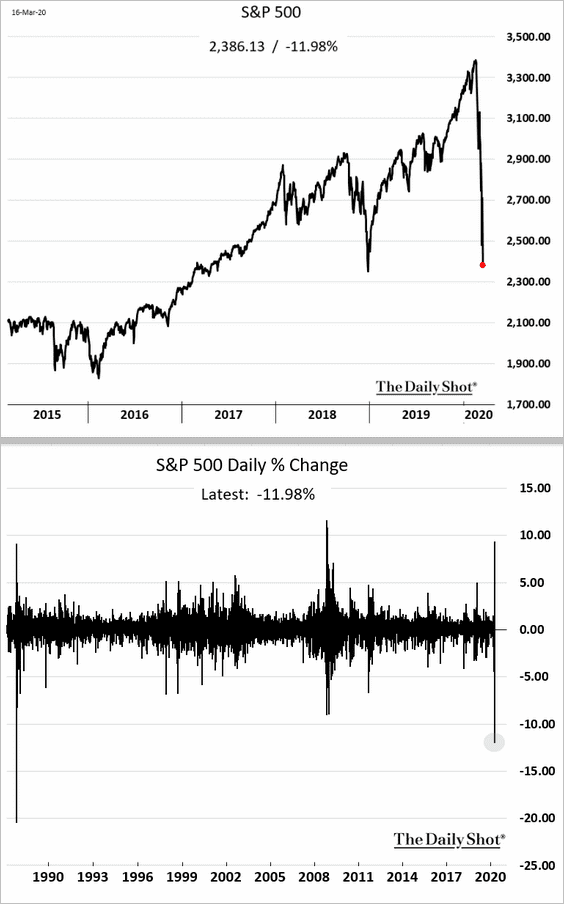
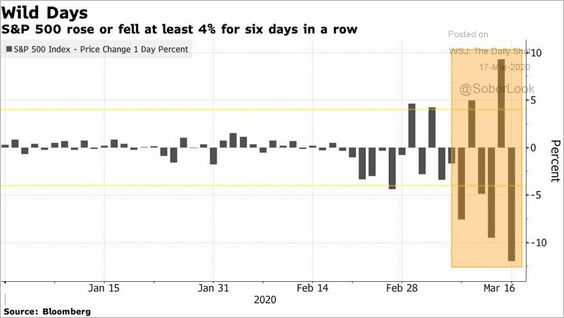
Market swings have been spectacular.
 Source: @markets Read full article
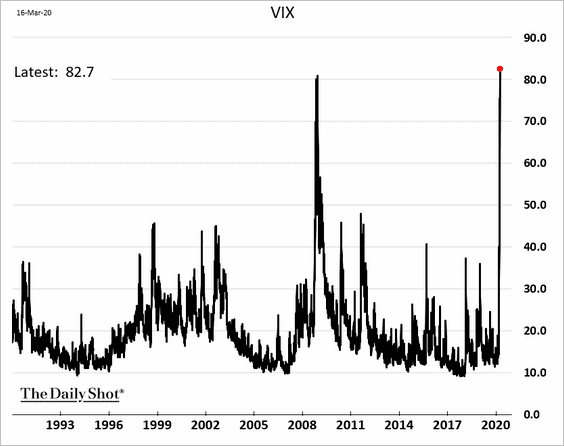
VIX hit a record high.
——————–
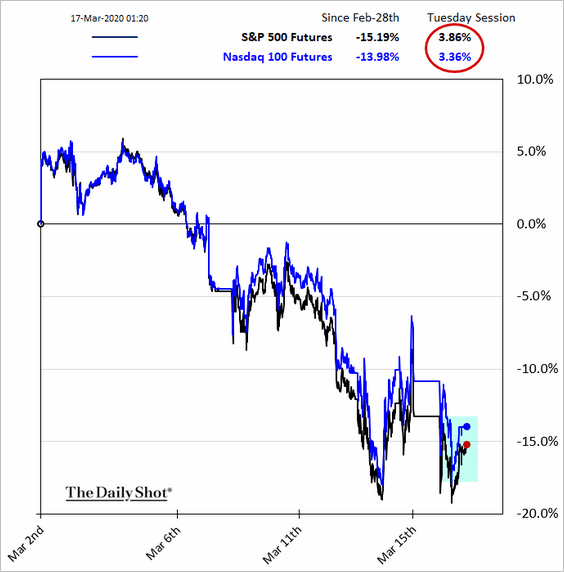
2. However, stock futures bounced from the lows in early trading on Tuesday, hitting the upper trading limit.
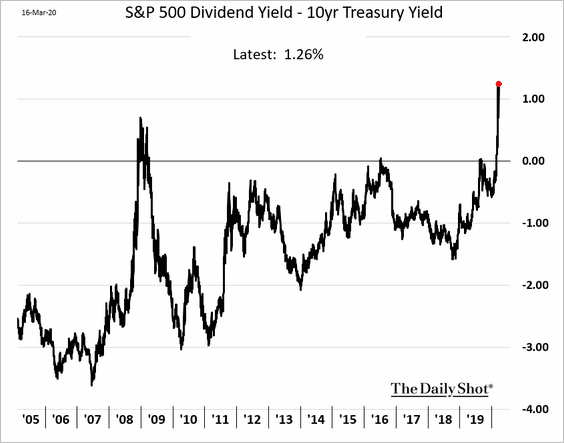
3. The spread between the S&P 500 dividend yield and the 10yr Treasury reached a new high. The market expects companies to start cutting dividends.
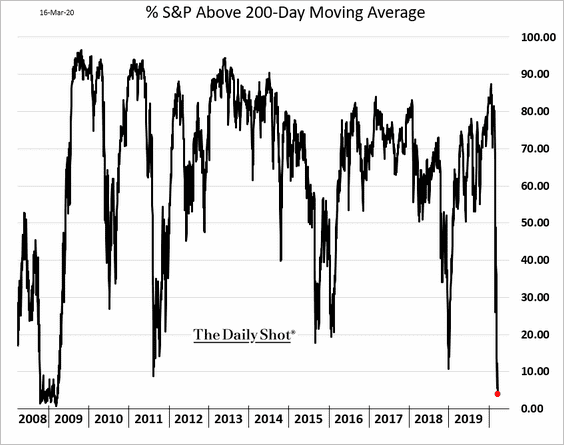
4. Less than 5% of S&P 500 stocks are above their 200-day moving average – the lowest since early 2009.
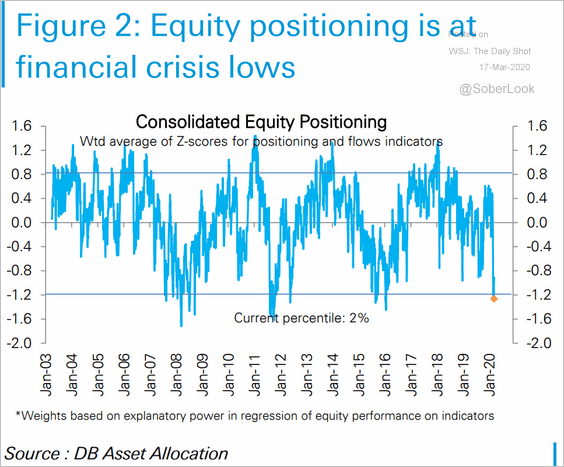
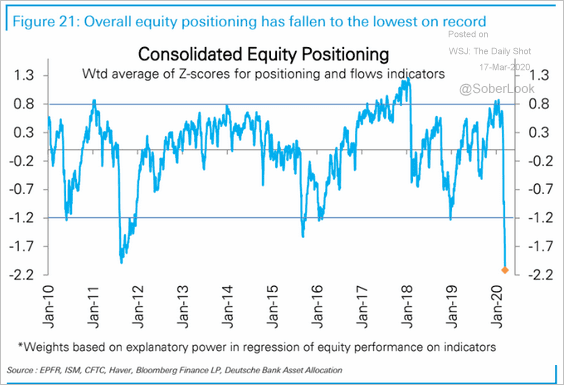
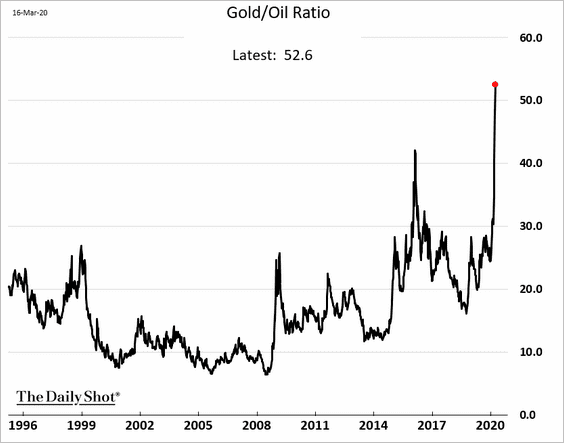
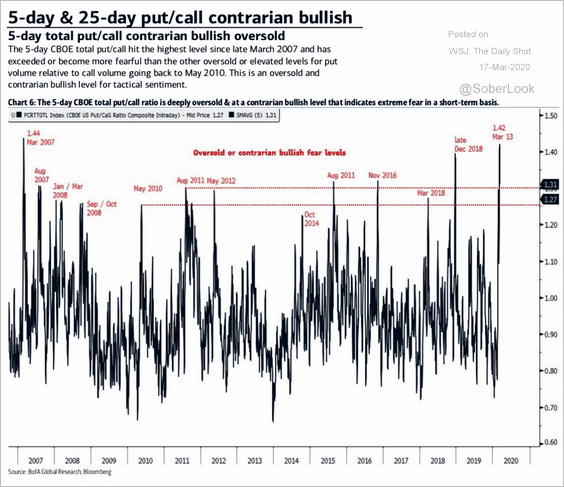
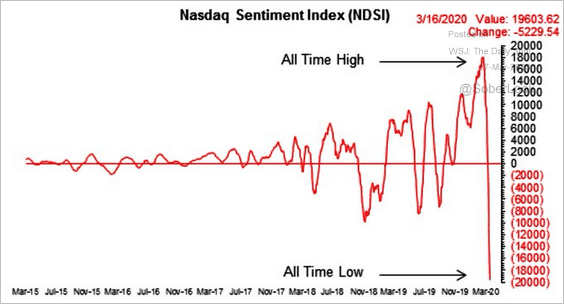
5. Several indicators now point to extreme bearish sentiment, suggesting that stocks are oversold.
• Deutsche Bank’s equity positioning indicator:
 Source: Deutsche Bank Research
 Source: Deutsche Bank Research
• The gold-to-oil ratio (a measure of risk aversion):
 h/t Gregor Stuart Hunter, @TheTerminal
• Put/call indicators:
 Source: BofAML, @WallStJesus
• Nasdaq Sentiment Index:
 Source: BofAML, @WallStJesus
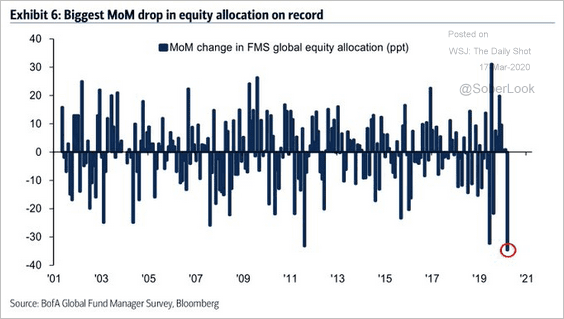
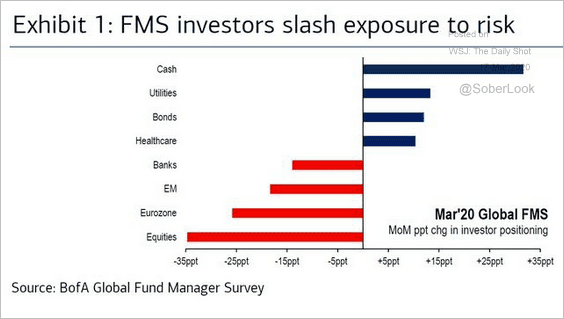
• Changes in fund managers’ equity allocations:
 Source: BofAML, @TayTayLLP
 Source: BofAML, @Callum_Thomas
——————–
6. On the other hand, the overall drawdown has been relatively mild when compared to previous recessions (2 charts).
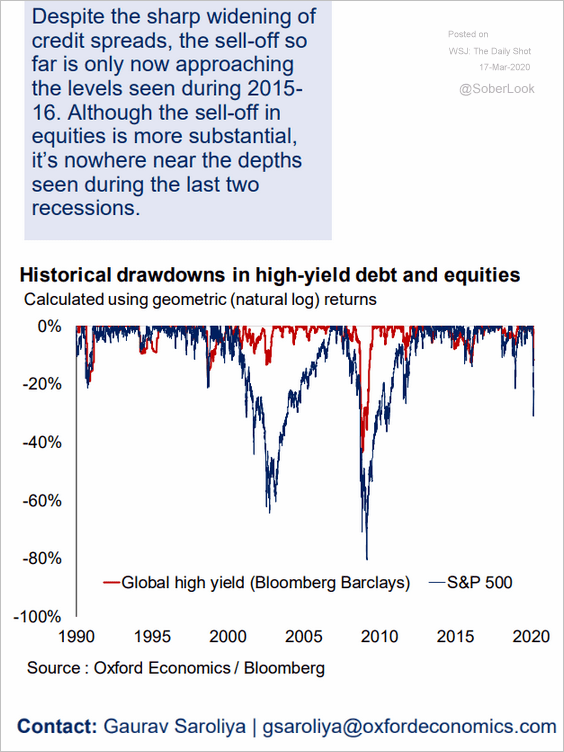 Source: Oxford Economics
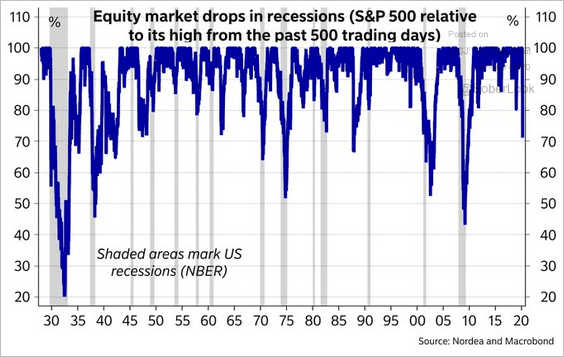 Source: @JanVonGerich
According to Capital Economics, the S&P 500 bottomed out nearly a year after a relatively mild recession in 2001 (back to average valuation levels).
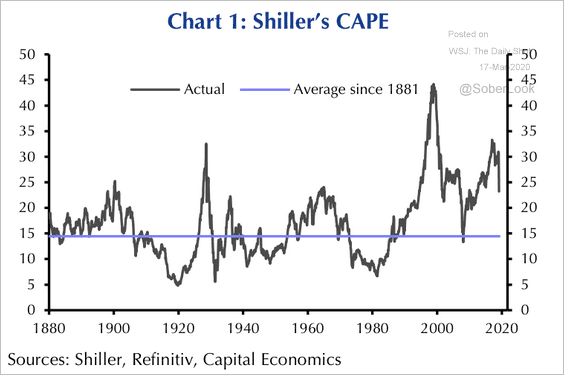 Source: Capital Economics
——————–
7. Here are the S&P 500 returns during recessions.
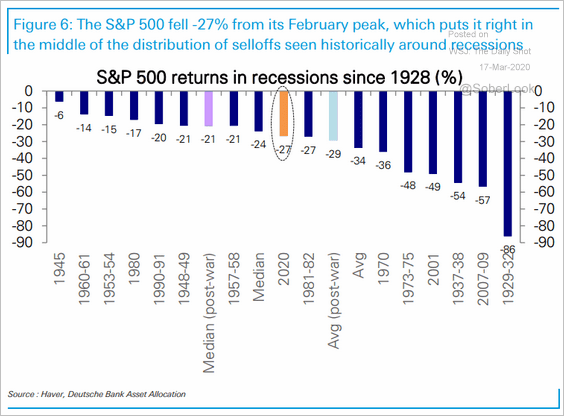 Source: Deutsche Bank Research
8. Analysts continue to downgrade S&P 500 earnings estimates.
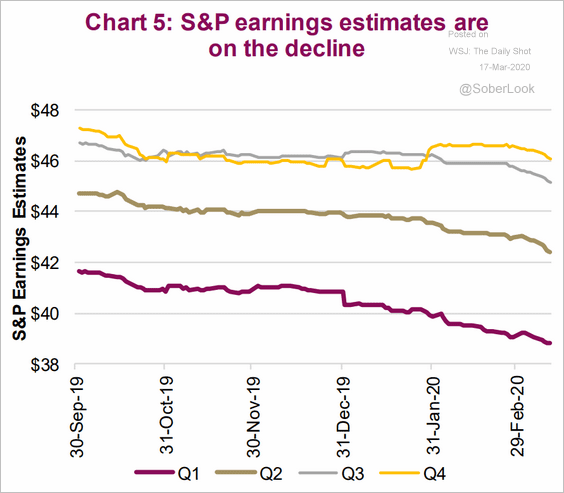 Source: Market Ethos, Richardson GMP
Fund managers have become extremely pessimistic about corporate earnings.
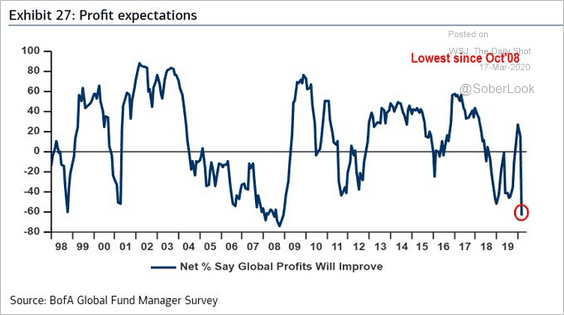 Source: BofAML, @Callum_Thomas
——————–
9. S&P 500 cyclicals appear cheap relative to defensives.
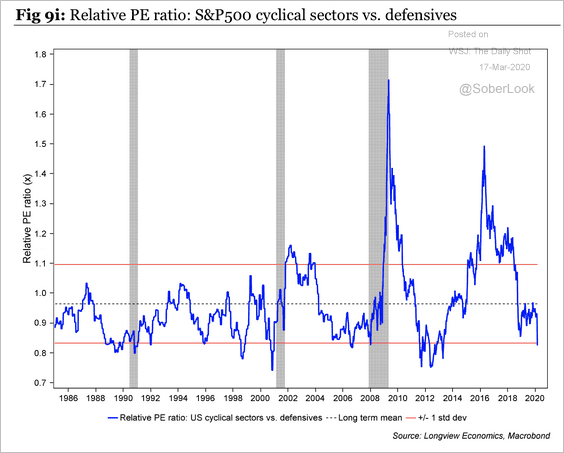 Source: Longview Economics
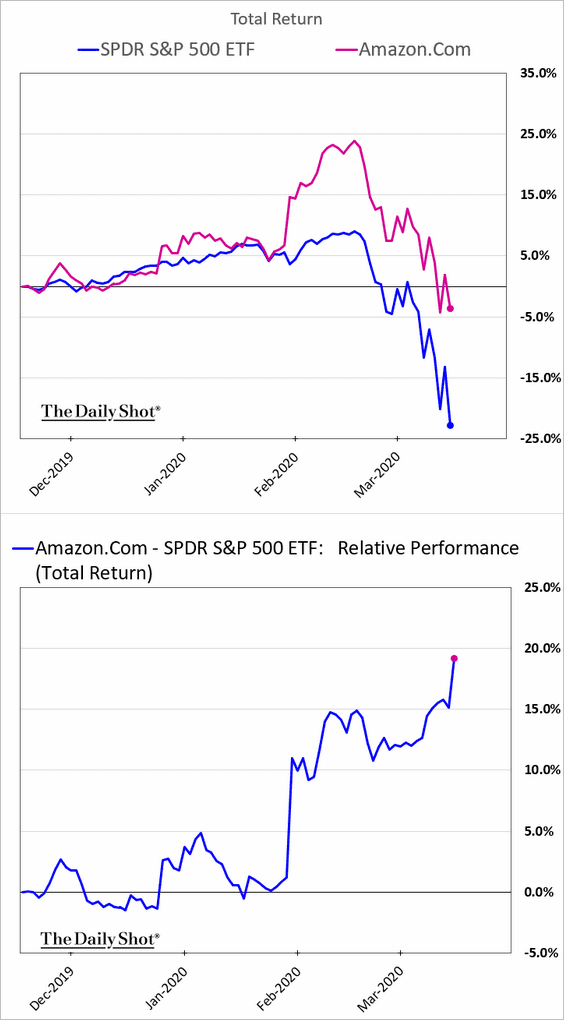
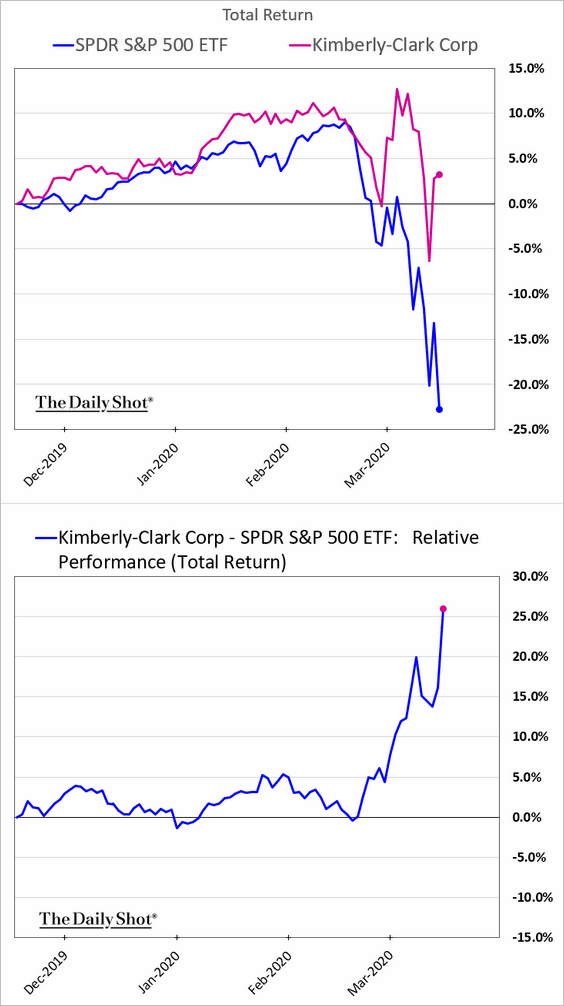
10. Which stocks are outperforming in the current environment? Most outperformance is related to changes in consumer behavior.
• Buying stuff from home:
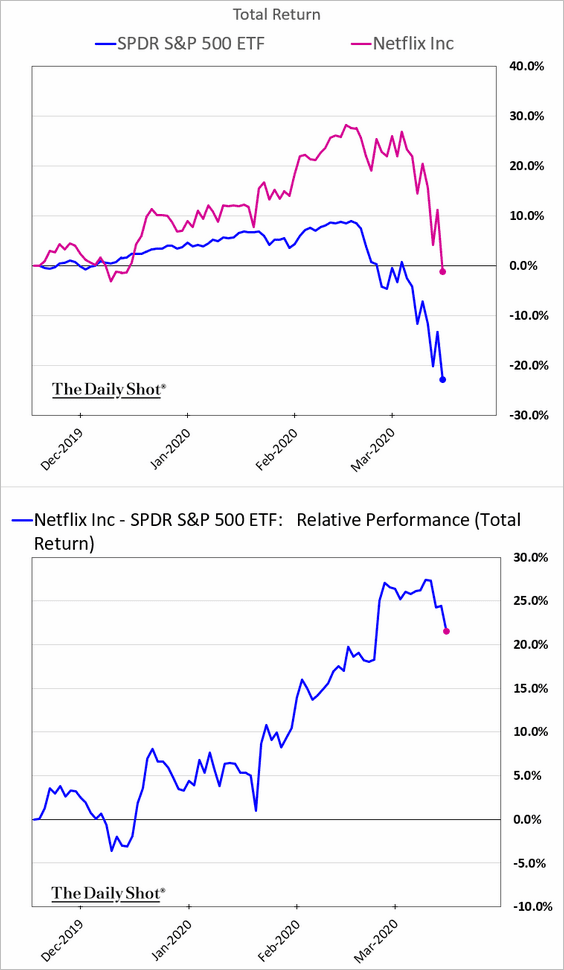
• Passing time at home:
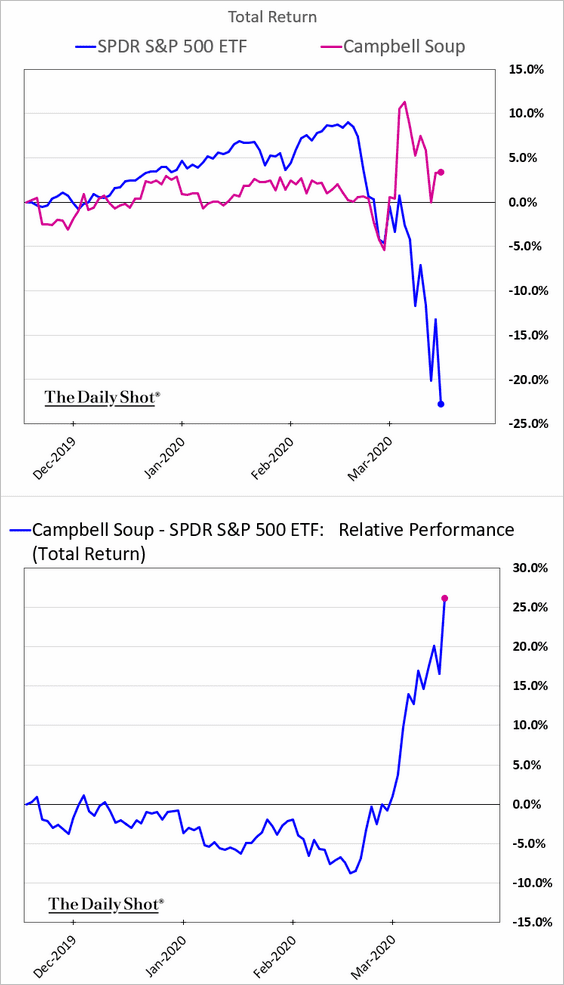
• Eating soup – at home:
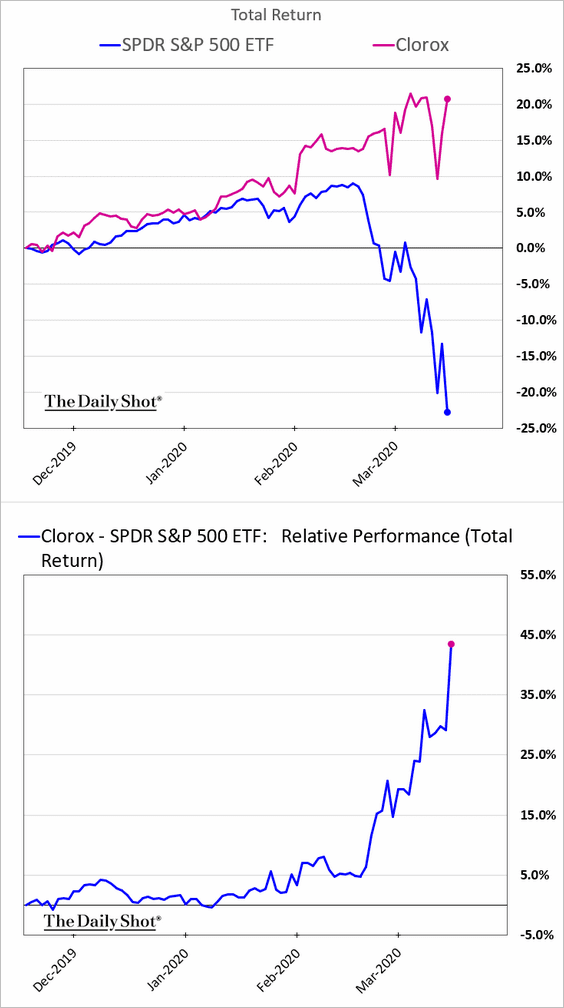
• Disinfecting surfaces:
• Hoarding toilet paper:
Credit
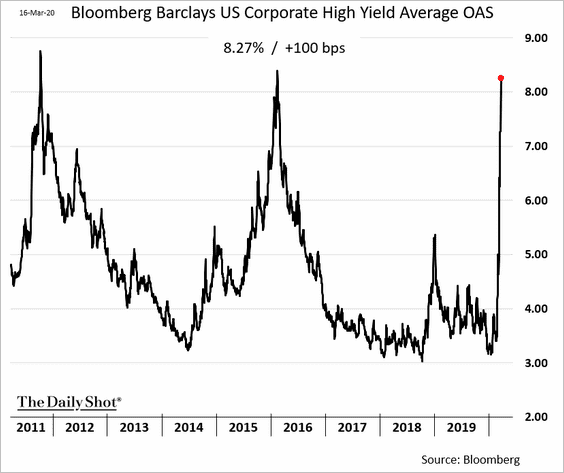
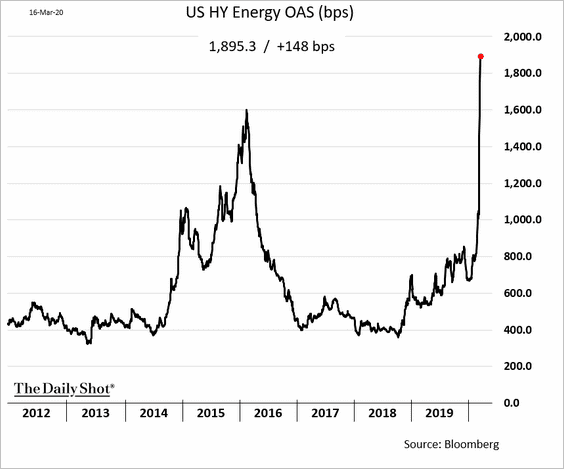
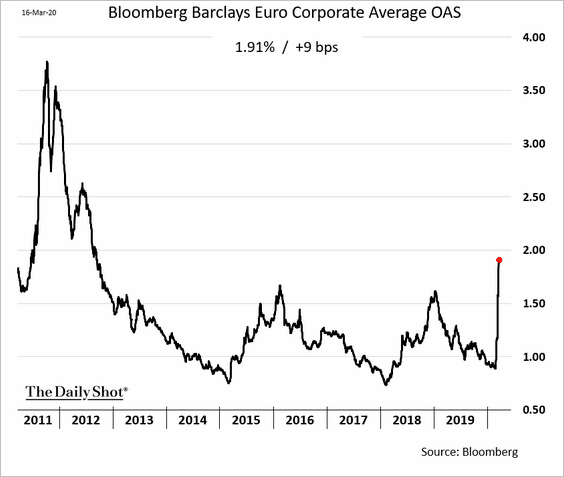
1. Corporate bond spreads keep widening.
• US high-yield spread:
• Energy-sector high-yield spread:
• European investment-grade spread:
• US AA-AAA spread:
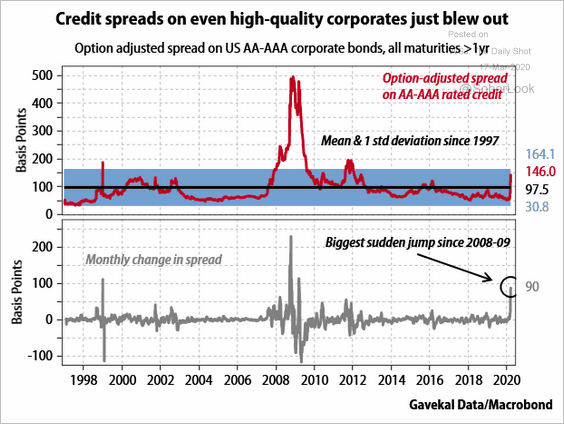 Source: Gavekal
——————–
2. Will firms have trouble rolling their maturing debt?
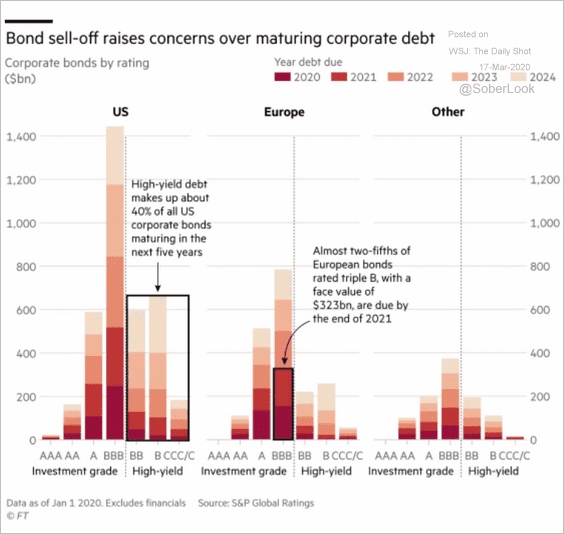 Source: @financialtimes Read full article
According to IIF, high-debt corporates are increasingly exposed to refinancing risks as the global growth outlook dims.
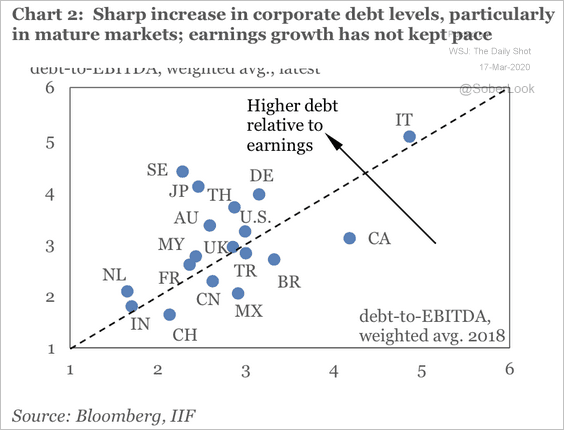 Source: IIF
——————–
3. How much will bond issuance slow during the current downturn?
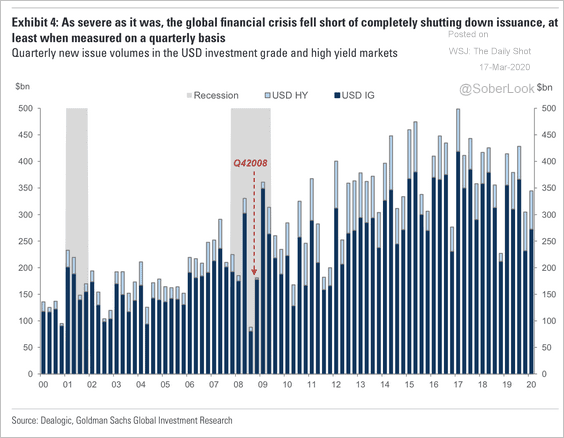 Source: Goldman Sachs
4. Which sectors are most exposed?
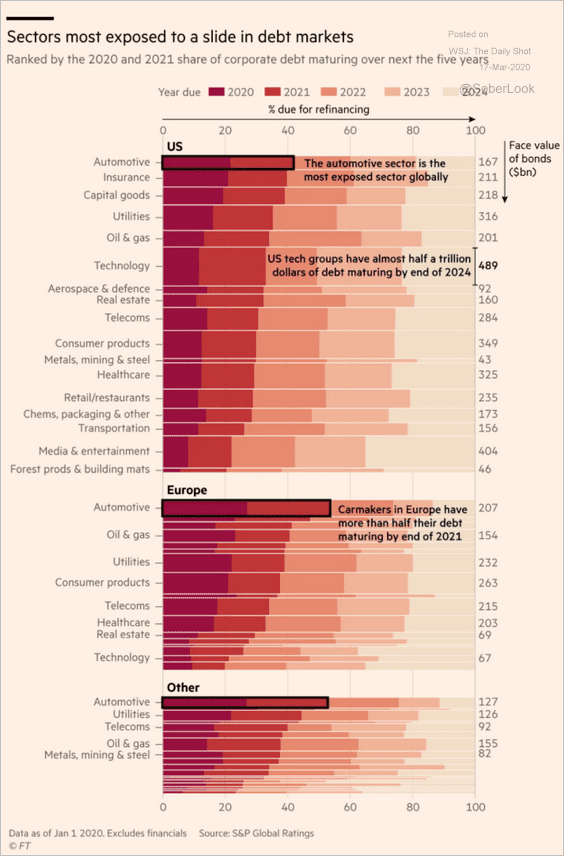 Source: @financialtimes Read full article
5. Funding markets are under pressure but not at the levels we saw during the financial crisis.
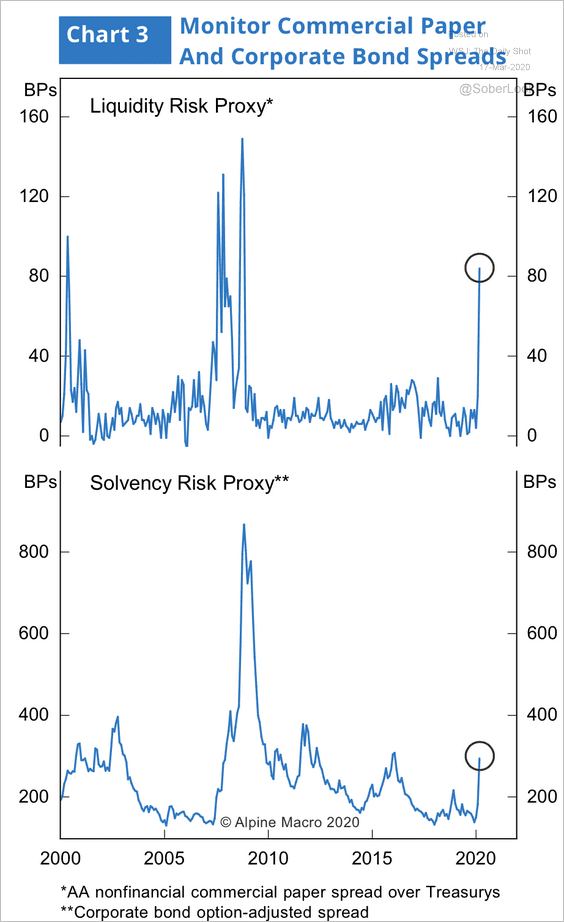 Source: Alpine Macro
Alpine Macro expects the TED spread (interbank borrowing rates over the risk-free rate) to tighten. The Fed is pumping massive amounts of liquidity into the market.
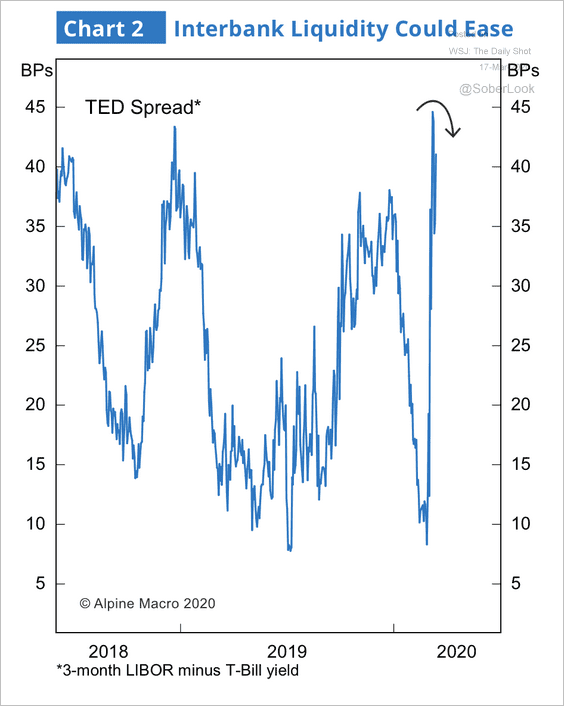 Source: Alpine Macro
——————–
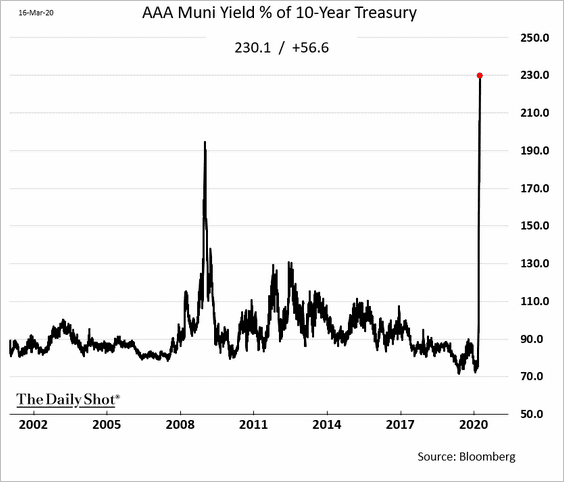
6. The US muni market correction has been remarkable. This chart shows the ratio of AAA muni yields to the 10yr Treasury yield.
Rates
According to Gavekal, on a valuation basis, long bond yields are now two standard deviations too low – a record.
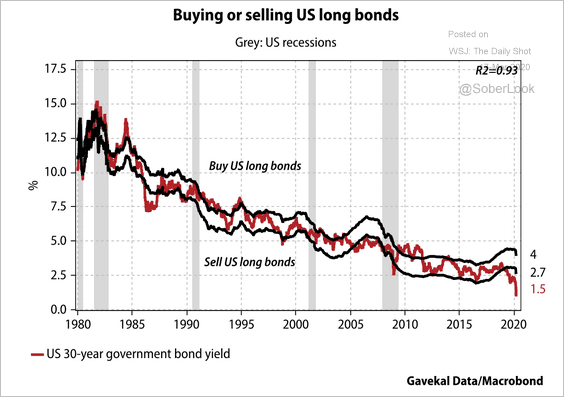 Source: Gavekal
Commodities
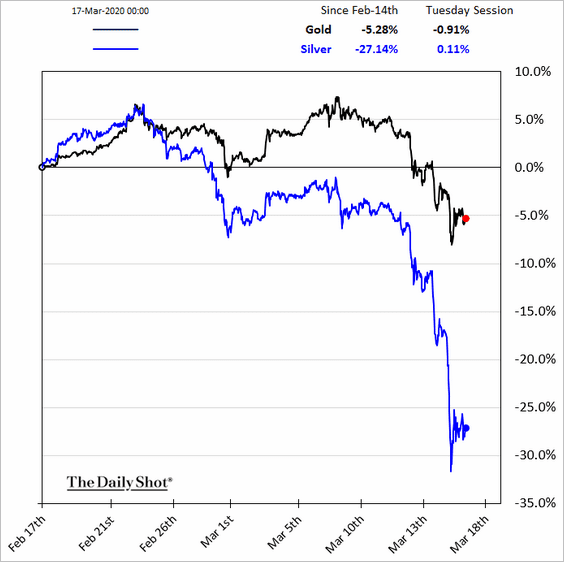
1. Precious metals have been under pressure in recent days.
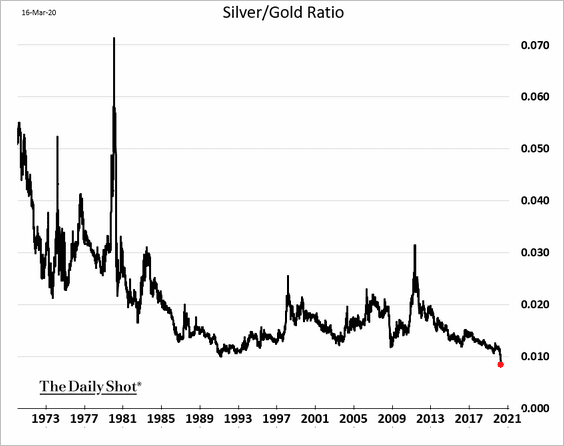
2. The silver-to-gold ratio hit the lowest level in recent history.
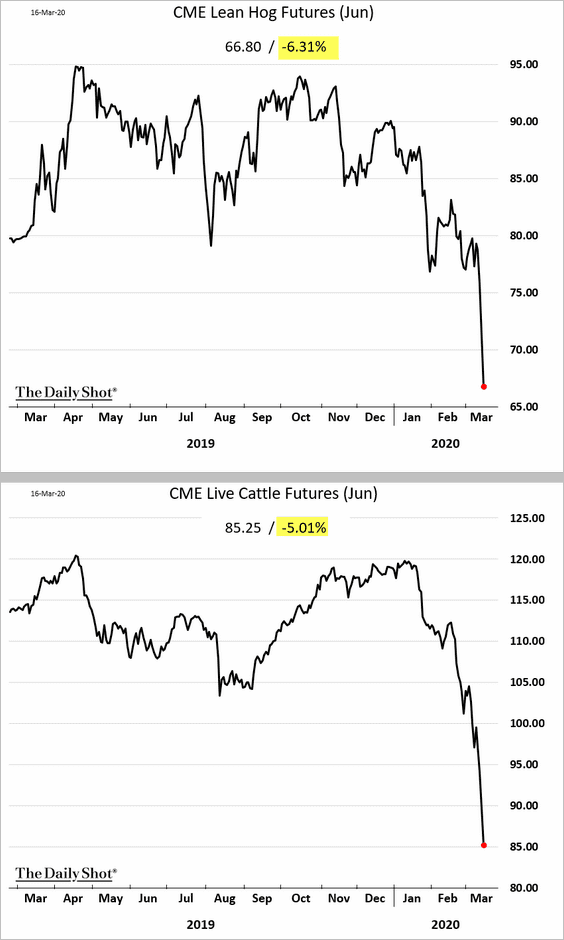
3. The selloff in US livestock futures has been relentless.
Energy
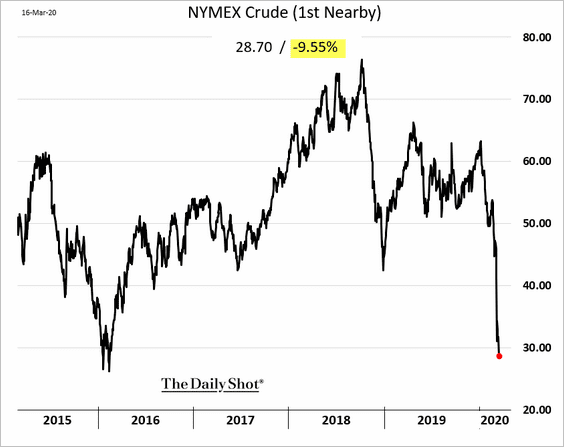
1. US crude oil dipped below $30/bbl, declining some 10% on Monday. But oil futures appear to have stabilized on Tuesday morning.
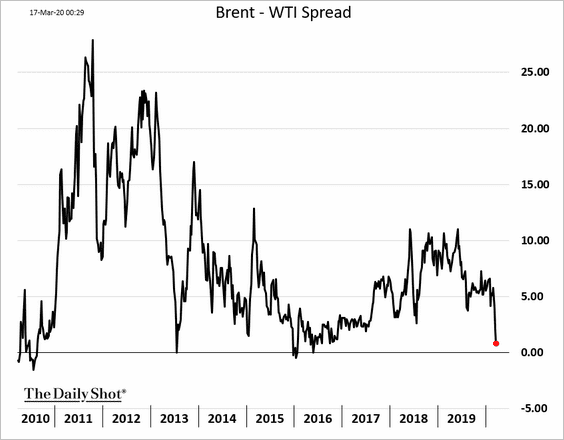
2. The Brent-WTI spread is nearing zero (driven by weak global demand).
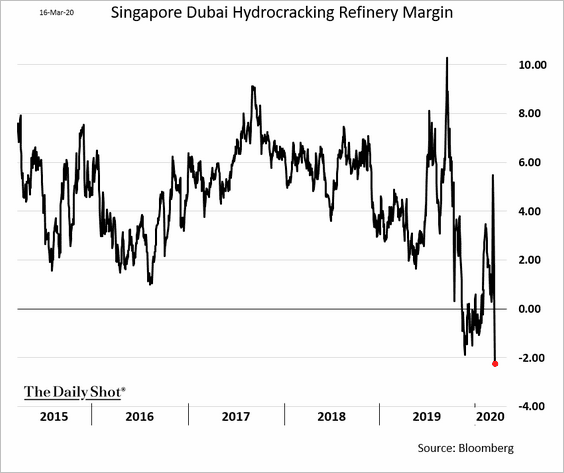
3. Asian refinery margins are back in negative territory.
4. How much exposure do US banks have to energy?
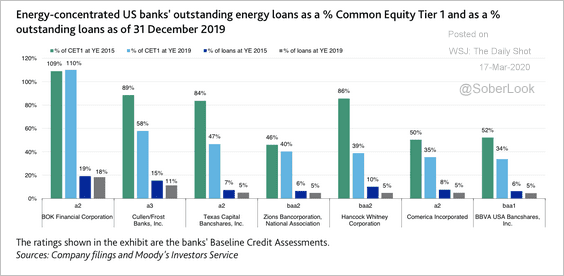 Source: Moody’s Investors Service
Emerging Markets
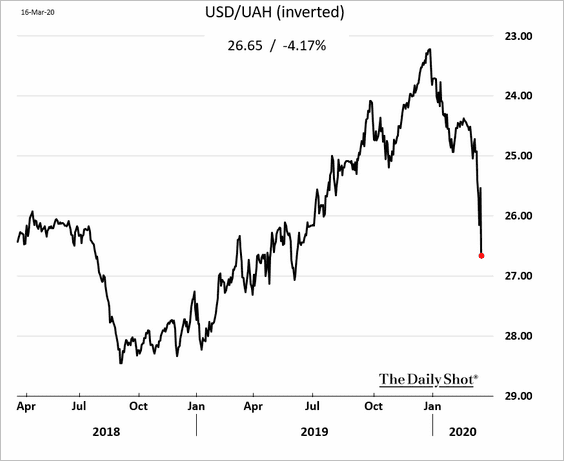
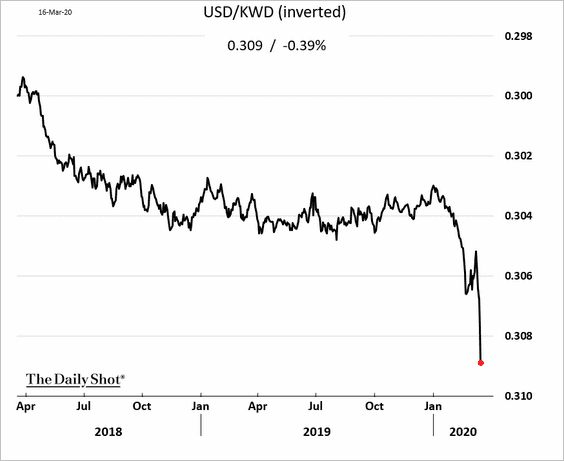
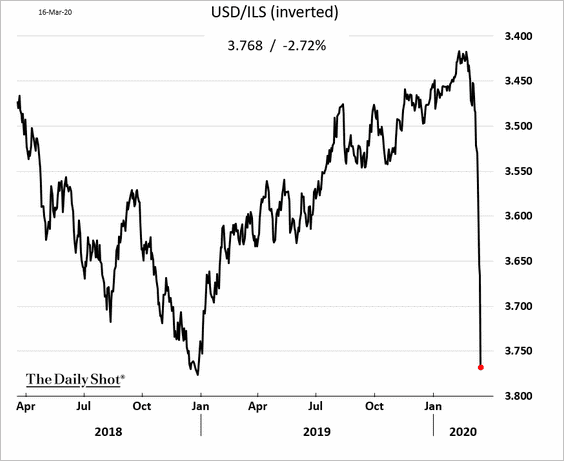
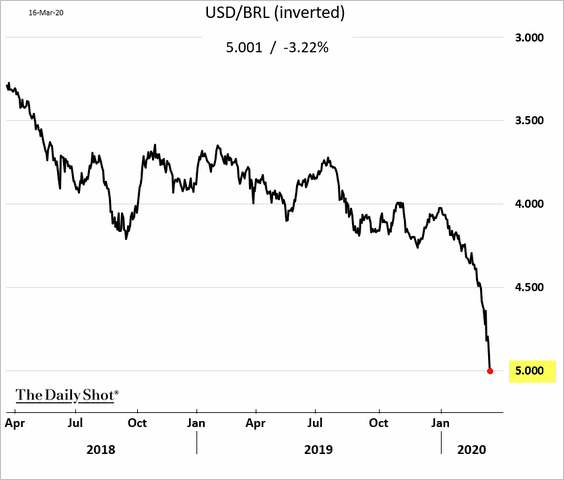
1. EM assets continued to tumble on Monday, with currency declines accelerating in some cases.
• The Ukrainian hryvnia:
• The Kuwaiti dinar:
• The Israeli shekel:
• The Brazilian real (breached five reais to the dollar):
——————–
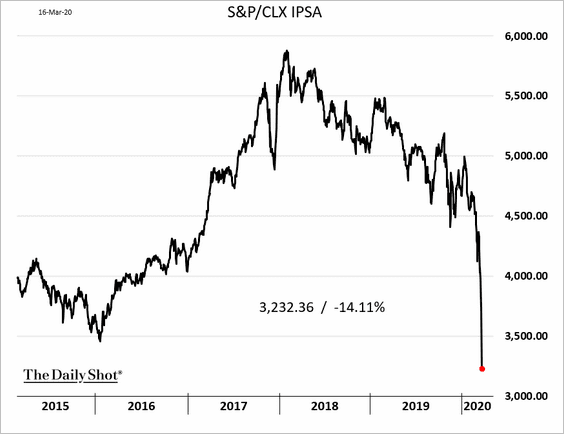
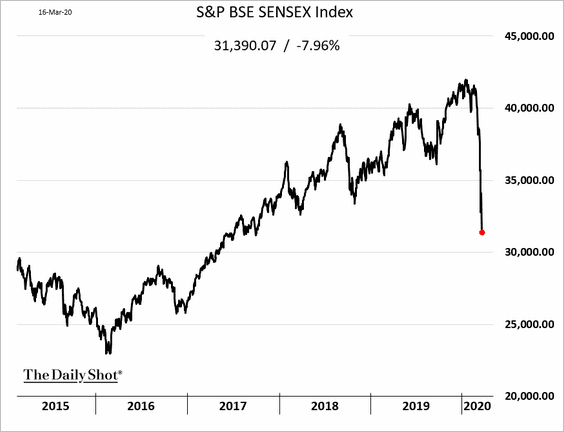
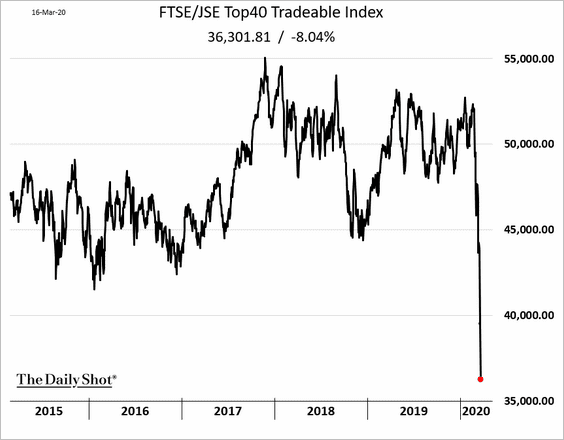
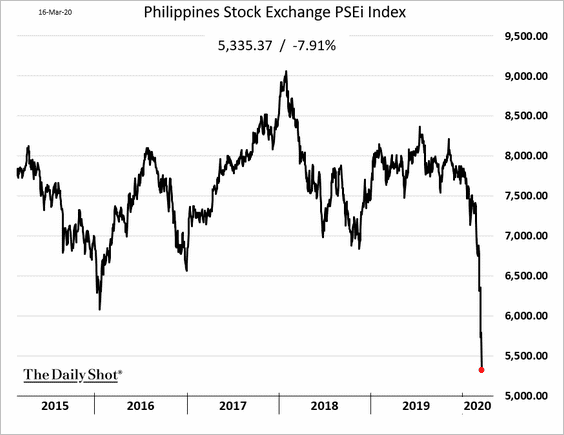
2. Some equity markets have experienced dramatic selloffs.
• Chile:
• India:
• South Africa:
• The Philippines:
 Source: @markets Read full article
——————–
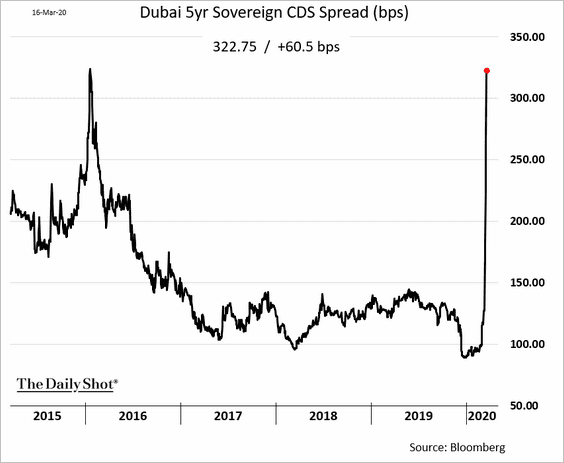
3. Sovereign credit default swap spreads keep widening. Here is Dubai.
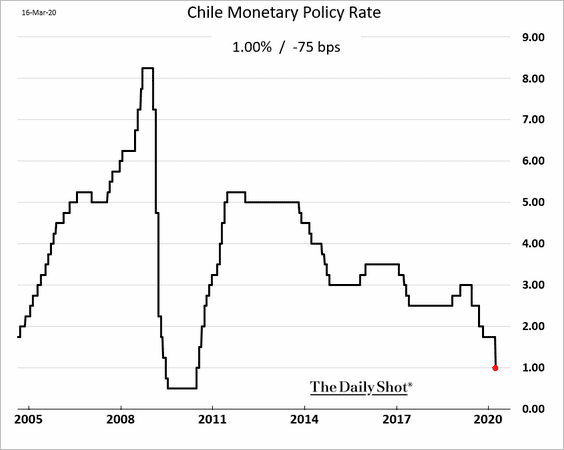
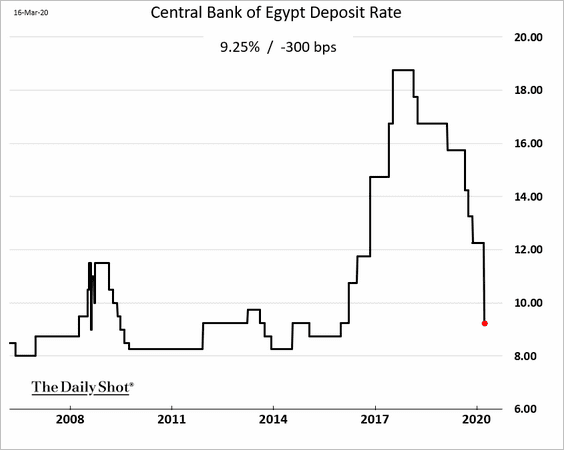
4. Central banks are easing aggressively.
• Chile:
• Egypt:
China
1. Economic activity is gradually recovering.
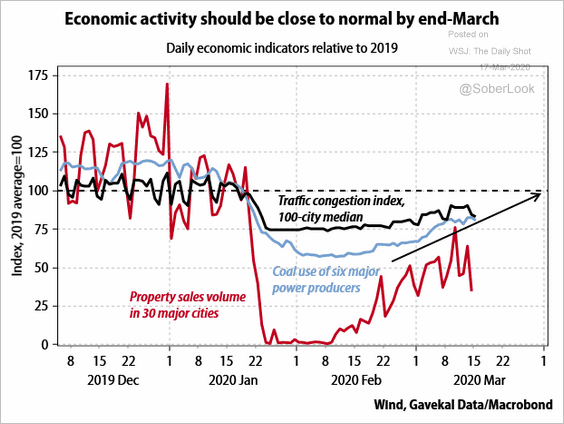 Source: Gavekal
2. Here is the year-over-year GDP growth forecast from Moody’s Analytics.
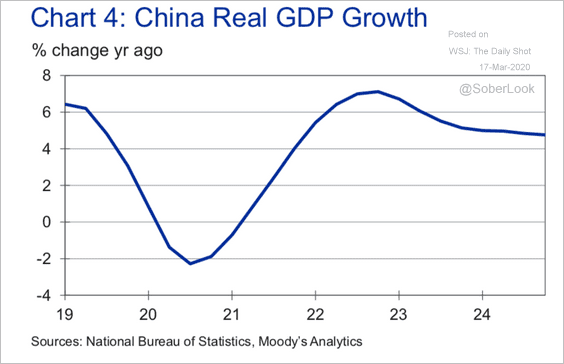 Source: Moody’s Analytics
4. Most new coronavirus cases in China are now imported.
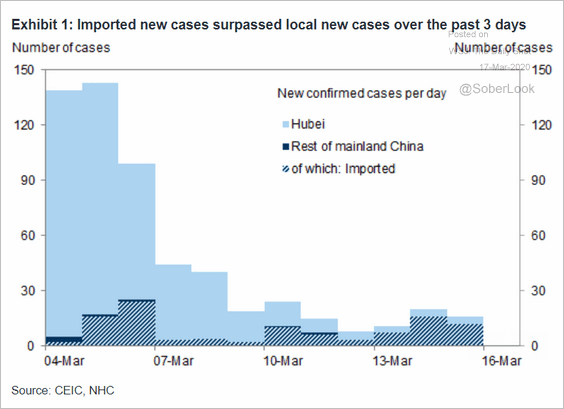 Source: Goldman Sachs
5. The housing market has softened.
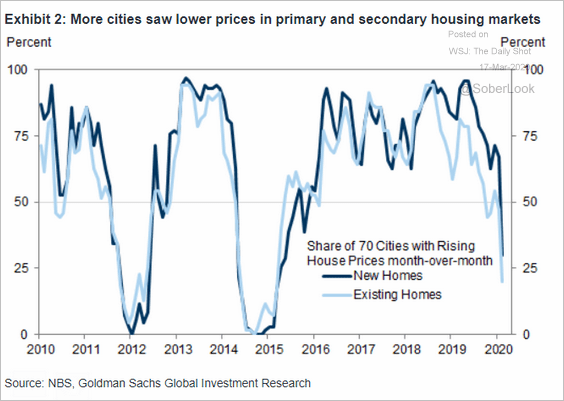 Source: Goldman Sachs
6. Many US firms have been struggling in China even before the epidemic.
 Source: @WSJ Read full article
Asia – Pacific
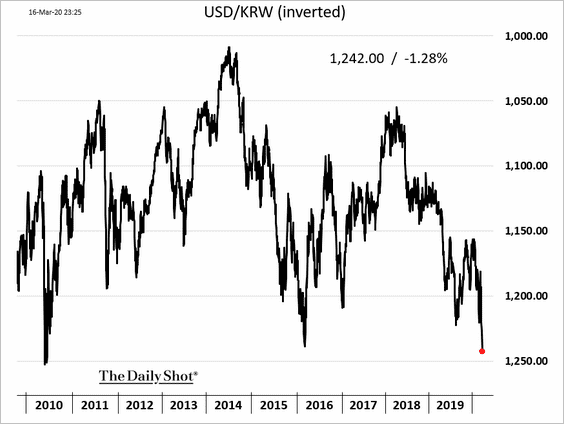
1. The South Korean won hit the lowest level since 2010.
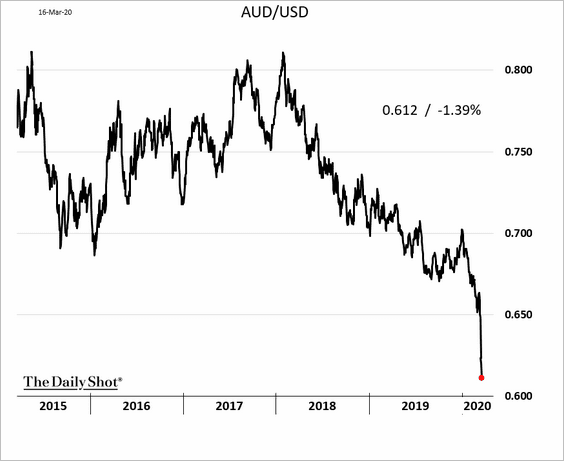
2. The Aussie dollar selloff has been remarkable. Is it overdone?
3. The BoJ is boosting its securities purchases.
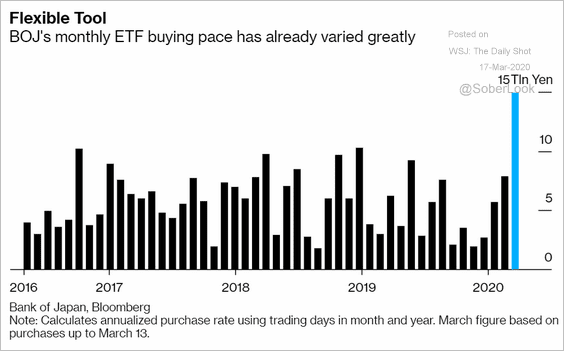 Source: @markets Read full article
Europe
1. European bank shares dropped 11% on Monday.
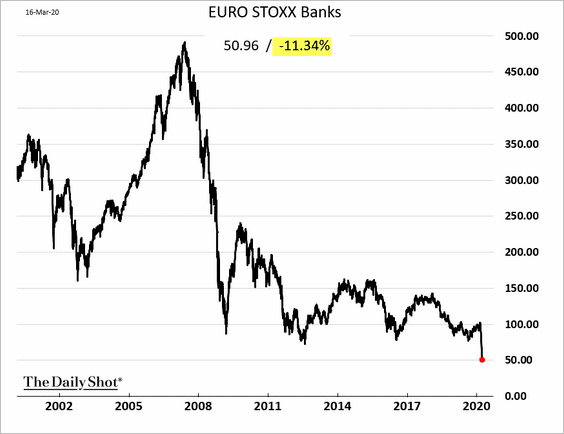
Valuations are at the lows we saw during the Eurozone crisis.
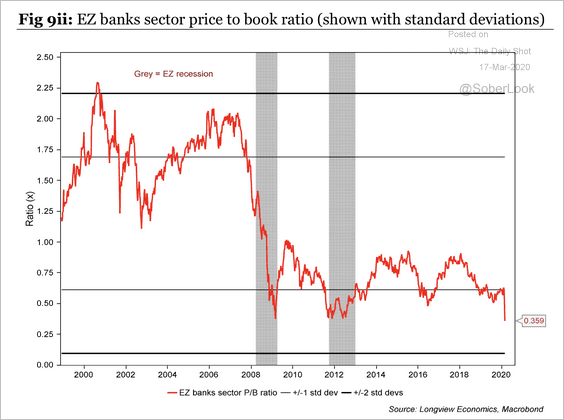 Source: Longview Economics
——————–
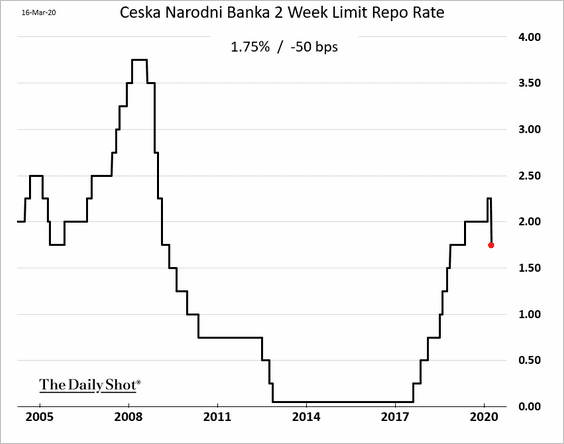
2. The Czech central bank cut rates after hiking them just a few weeks ago.
The Eurozone
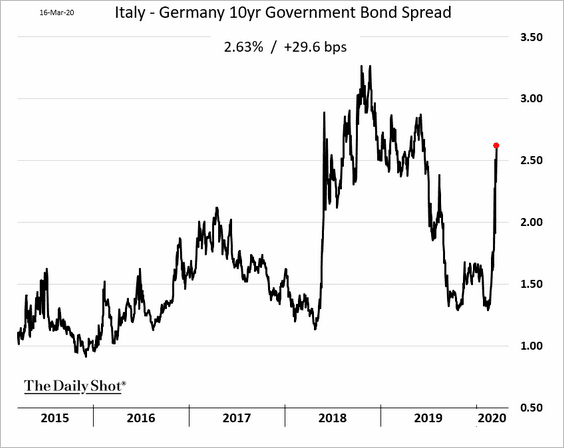
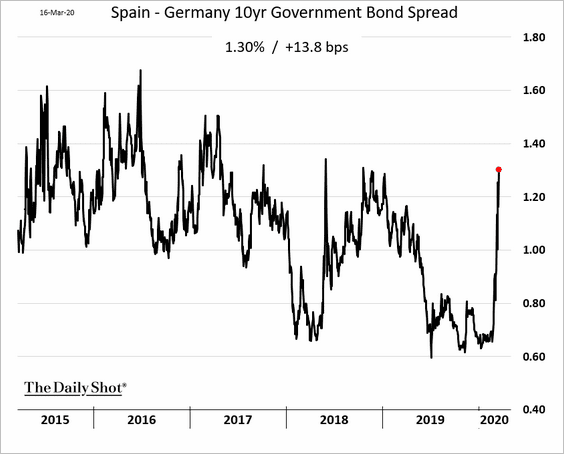
1. Sovereign bonds spreads have widened but are nowhere close to previous highs.
• Italy:
• Spain:
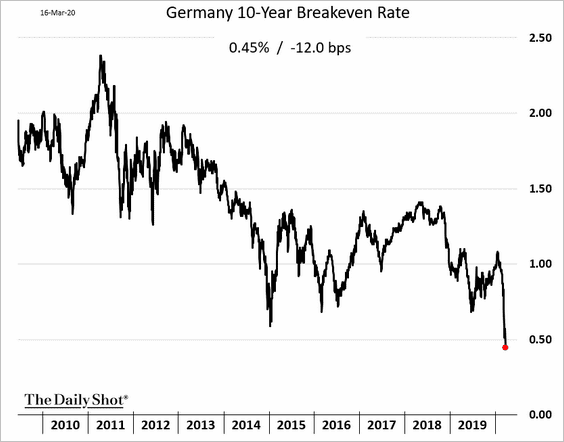
——————–
2. Market-based inflation expectations continue to tumble.
3. According to Moody’s, these three regions, which are on coronavirus lock-down, account for more than 40% of Italian GDP.
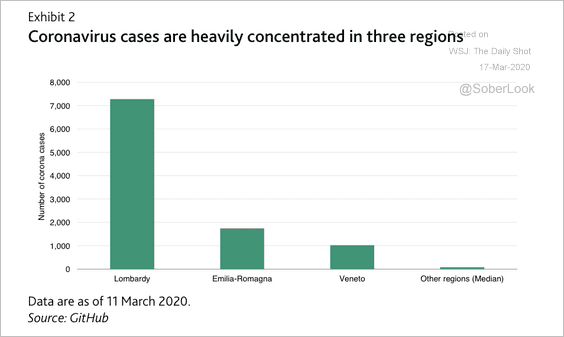 Source: Moody’s Investors Service
4. New infections in Germany and Italy keep climbing.
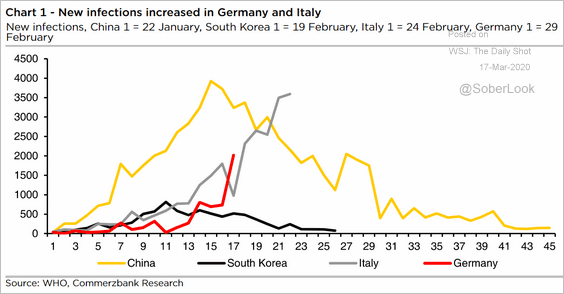 Source: Commerzbank Research
The United Kingdom
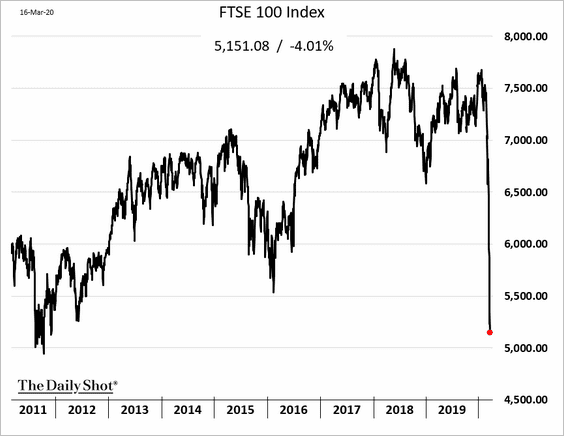
1. The FTSE 100 hit the lowest level since 2011.
From a global perspective, UK stocks have de-rated meaningfully this year (mostly driven by the heavy weighting in financials and energy), making them cheaper than all major equity markets, according to Pavilion Global Markets.
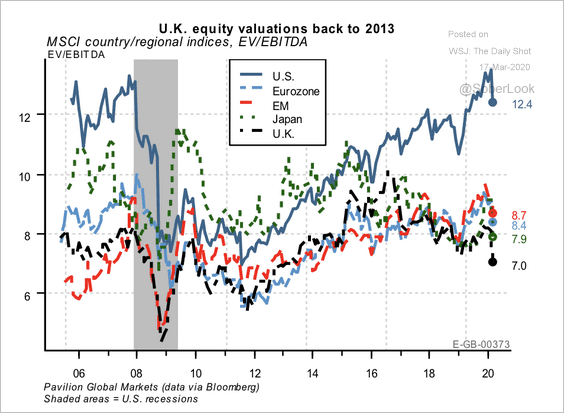 Source: Pavilion Global Markets
——————–
2. Online search activity suggests that the nation’s consumers are retreating rapidly.
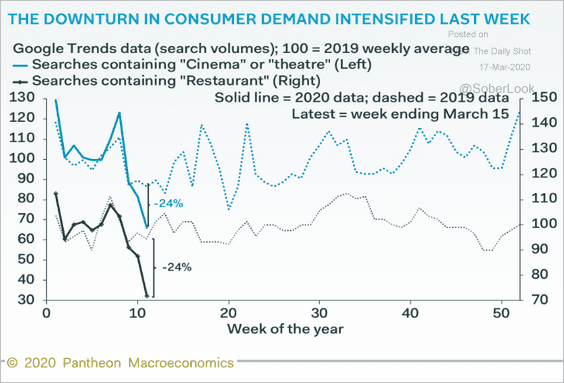 Source: Pantheon Macroeconomics
3. The GDP forecast from Pantheon Macroeconomics points to a long-term impact on growth.
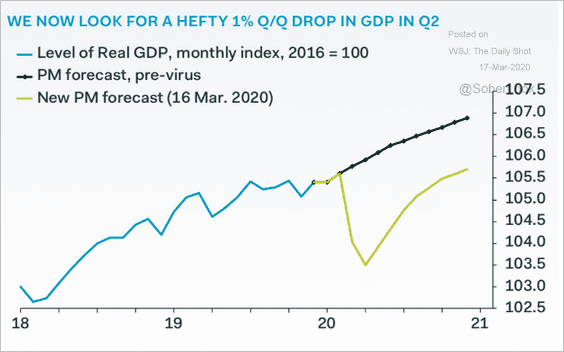 Source: Pantheon Macroeconomics
Canada
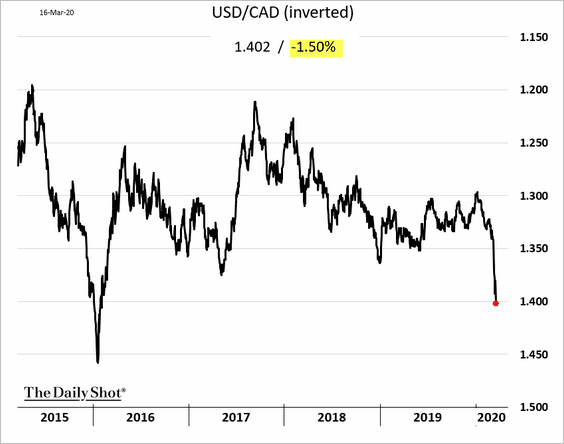
1. The loonie hit the lowest level in over four years.
2. The economy is headed for recession.
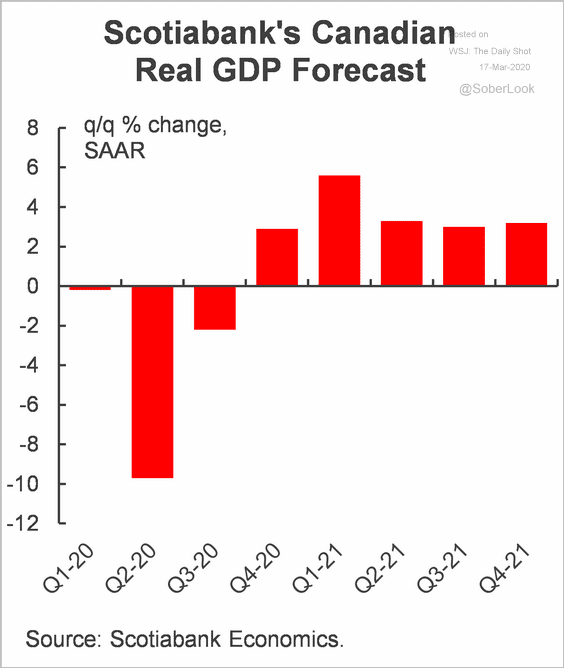 Source: Scotiabank Economics
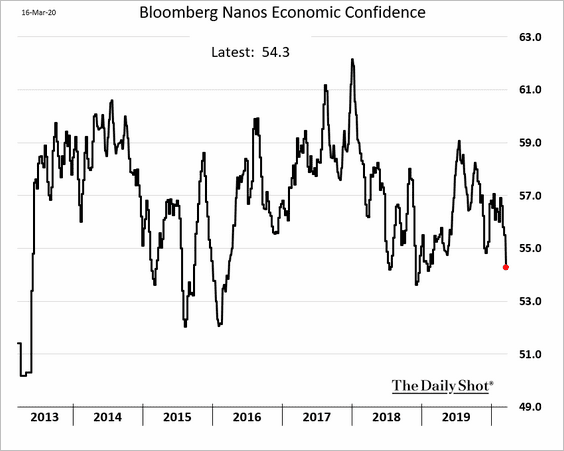
3. Economic confidence is starting to deteriorate.
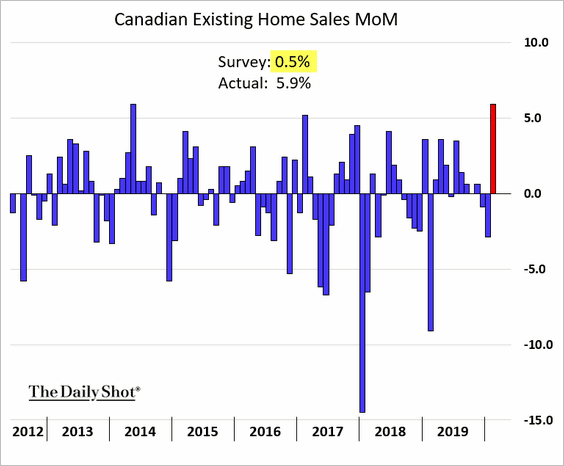
4. Existing home sales surprised to the upside in February.
The United States
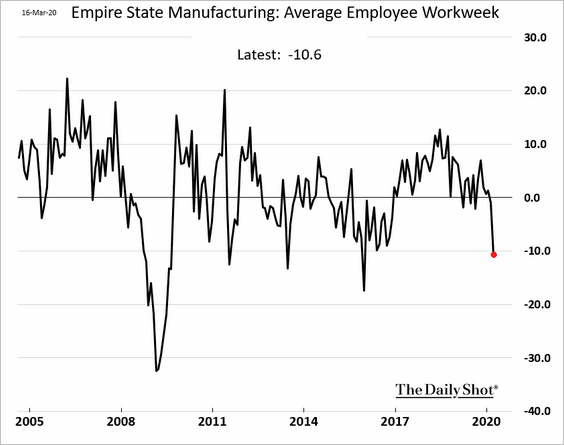
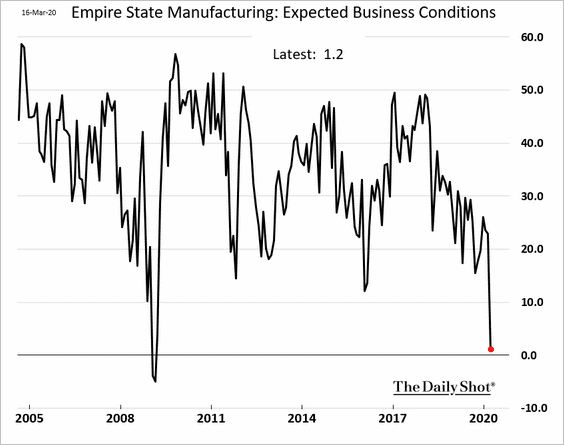
1. The NY Fed’s manufacturing report (Empire State Manufacturing) showed the region’s factory activity deteriorating rapidly this month.
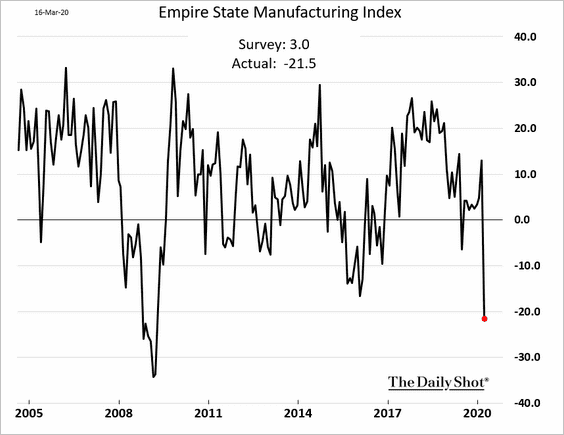
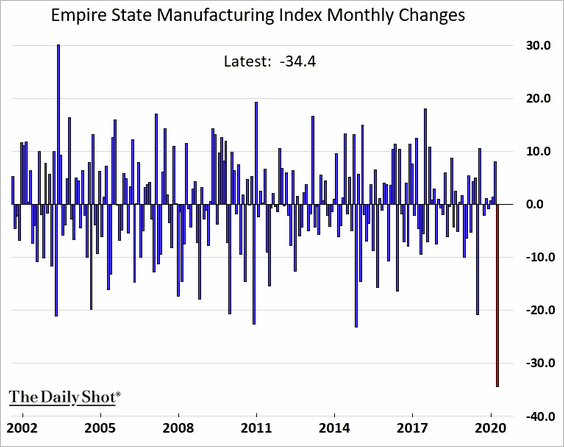
The decline in the index was the largest on record.
• Employee hours are getting cut.
• Business outlook has worsened.
• The NY Fed’s report doesn’t bode well for factory activity at the national level (ISM).
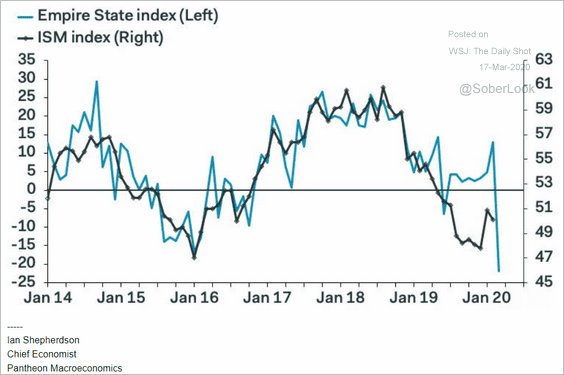 Source: Pantheon Macroeconomics
——————–
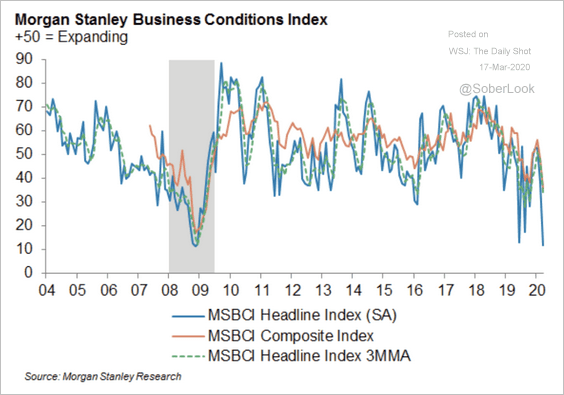
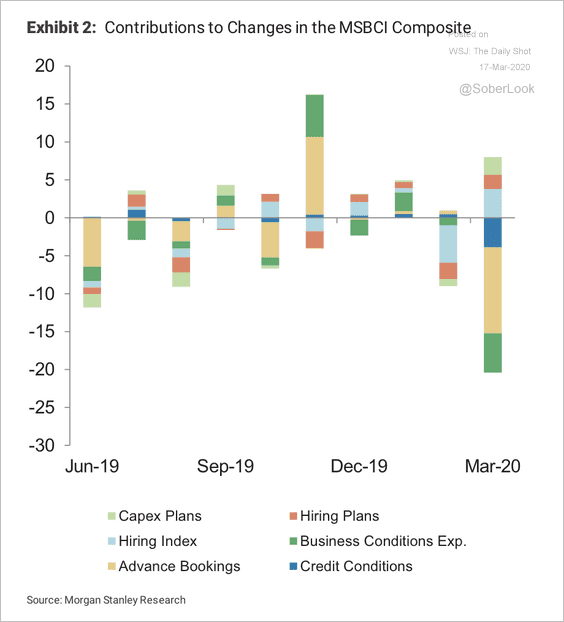
2. Morgan Stanley’s business conditions index is near record lows …
 Source: Morgan Stanley Research
… driven by weak advanced bookings, credit conditions, and expectations of business conditions.
 Source: Morgan Stanley Research
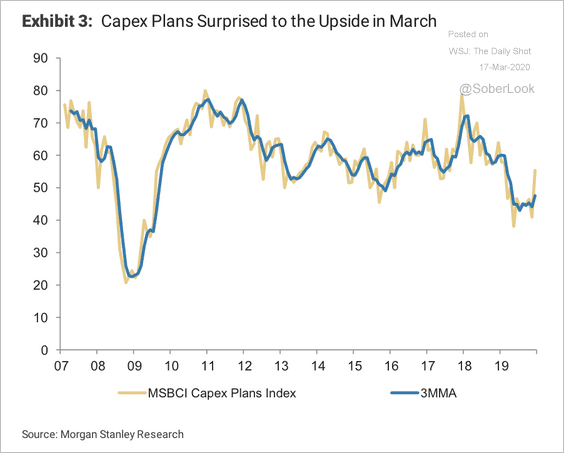
However, CapEx plans surprised to the upside this month.
 Source: Morgan Stanley Research
——————–
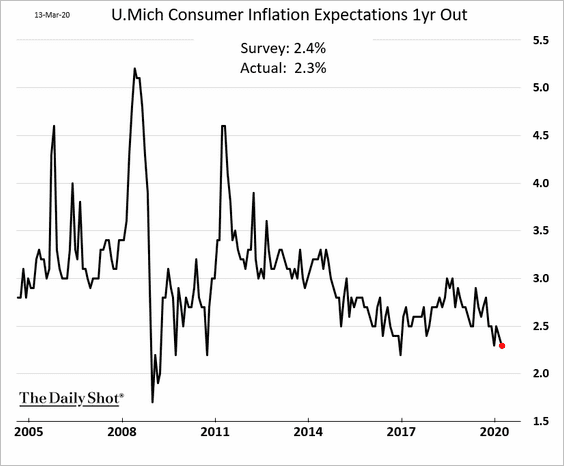
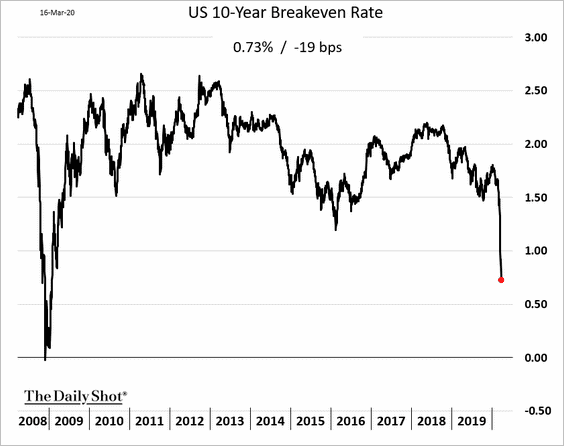
3. Inflation expectations continue to decline.
• Consumer inflation expectations:
• Market-based inflation expectations:
——————–
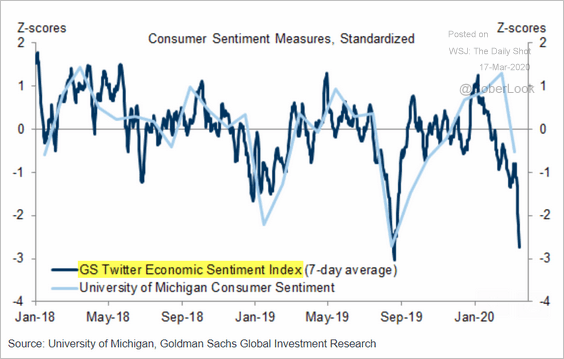
4. Based on Goldman’s analysis of Twitter data, US consumer sentiment has deteriorated sharply.
 Source: Goldman Sachs
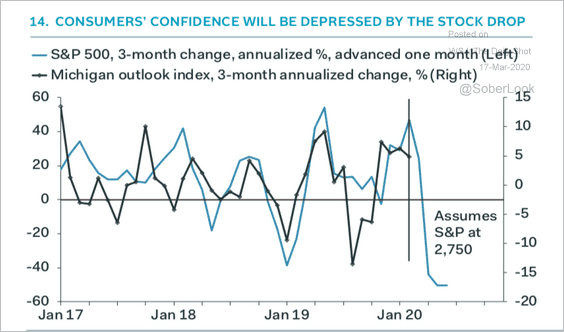
According to Pantheon Macroeconomics, the stock market rout is the key reason for slumping confidence.
 Source: Pantheon Macroeconomics
——————–
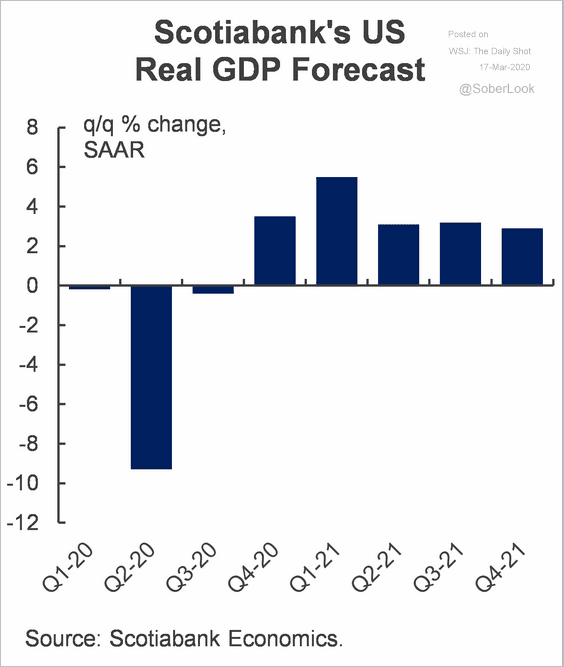
5. Here are a couple of GDP growth forecasts:
• Scotiabank (quarter-over-quarter):
 Source: Scotiabank Economics
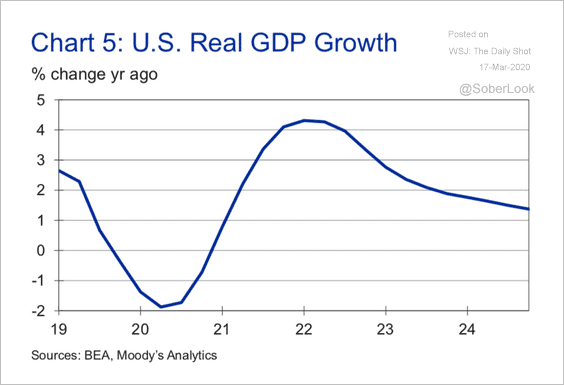
• Moody’s Analytics (year-over-year):
 Source: Moody’s Analytics
How long do US recessions typically last?
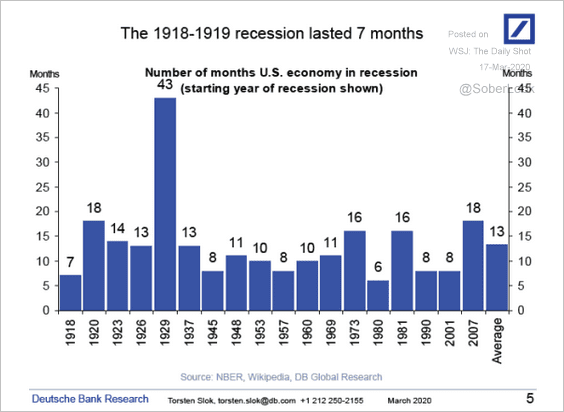 Source: Deutsche Bank Research
——————–
6. As discussed previously, the US banking system is in good shape. Below is the tier-1 capital ratio over time. That’s not to say that some smaller banks won’t run into trouble, especially those exposed to the energy sector (see last chart in the energy section).
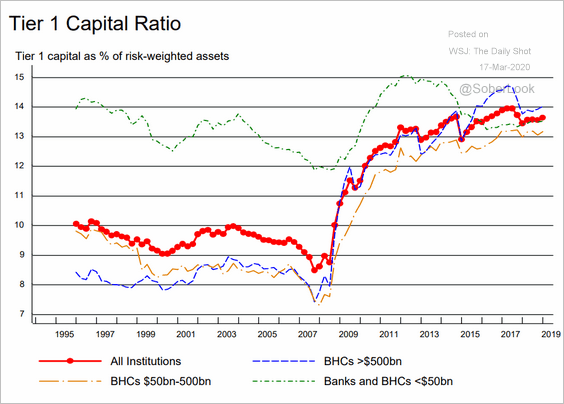 Source: NY Fed
Global Developments
1. Here’s the effect of school closures on global GDP, according to Capital Economics.
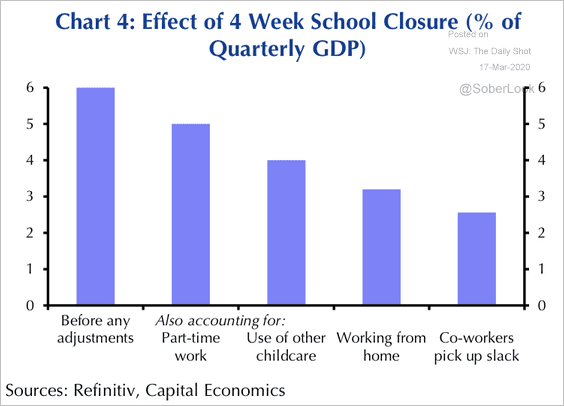 Source: Capital Economics
This chart from Oxford Economics shows the number of students affected.
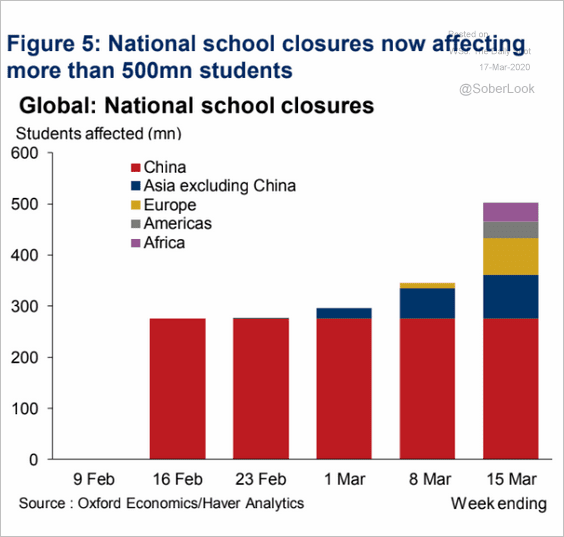 Source: Oxford Economics
——————–
2. Synchronized central bank easing should generate a rebound in global business activity (PMI) once the pandemic subsides.
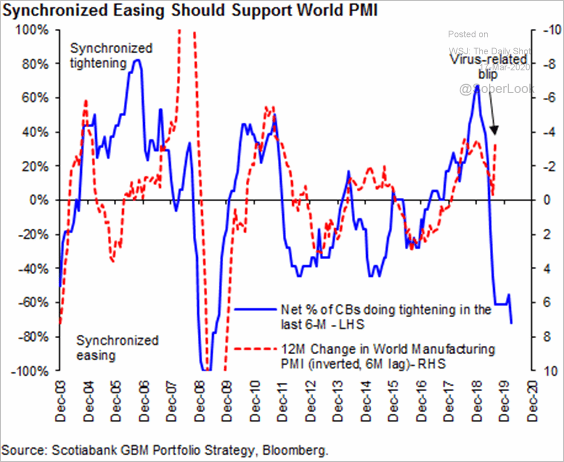 Source: Hugo Ste-Marie, Portfolio & Quantitative Strategy Global Equity Research, Scotia Capital
3. Economists are rapidly downgrading their GDP growth forecasts for this year.
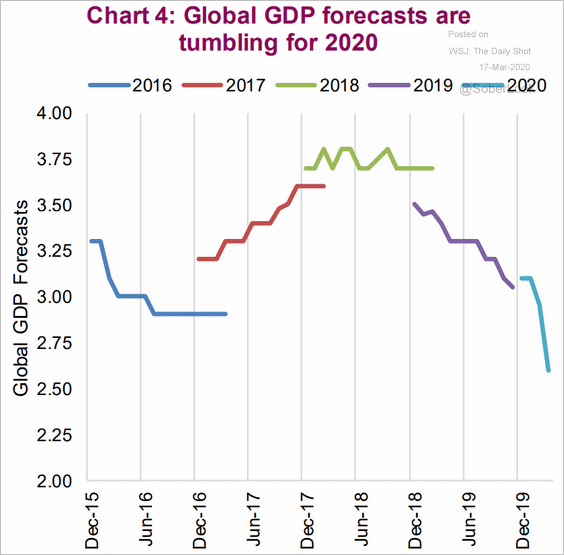 Source: Market Ethos, Richardson GMP
The growth downgrade by fund managers was the largest on record, according to BofA Merrill Lynch.
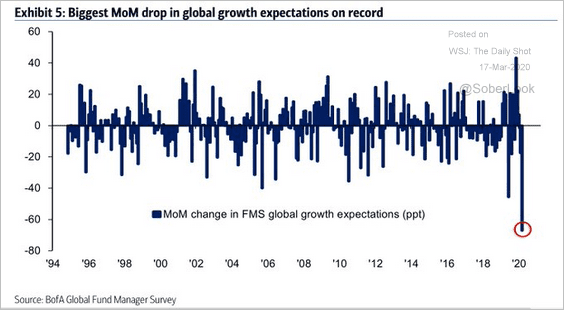 Source: BofAML, @TayTayLLP
——————–
4. Coronavirus fears have led to sharp downgrades of corporate earnings estimates.
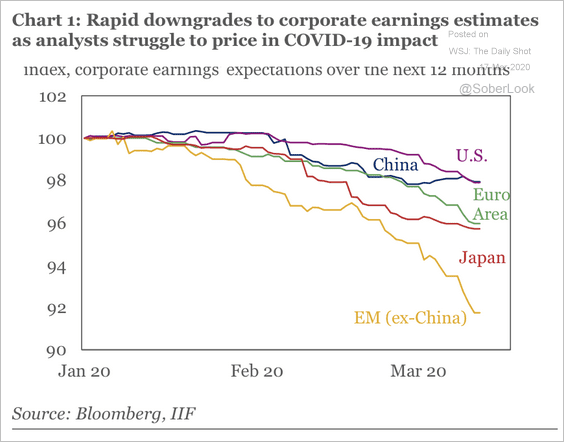 Source: IIF
5. Private-sector credit growth in major developed economies has been relatively subdued over the past decade.
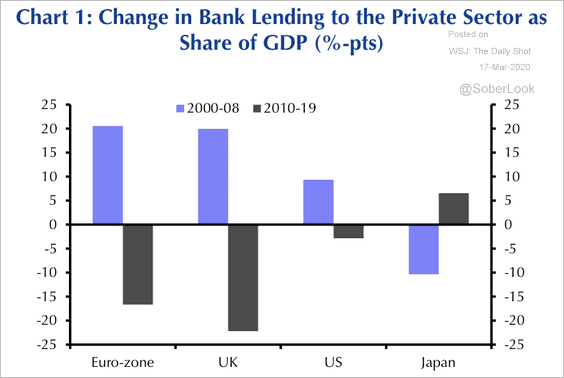 Source: Capital Economics
——————–
Food for Thought
1. Physical inactivity across the US:
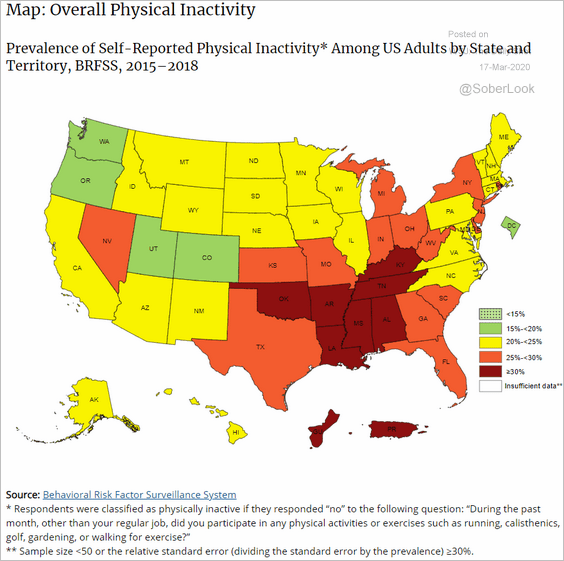 Source: CDC, {ht} HighTower Las Vegas & RCG Economics Read full article
2. The number of new US coronavirus cases:
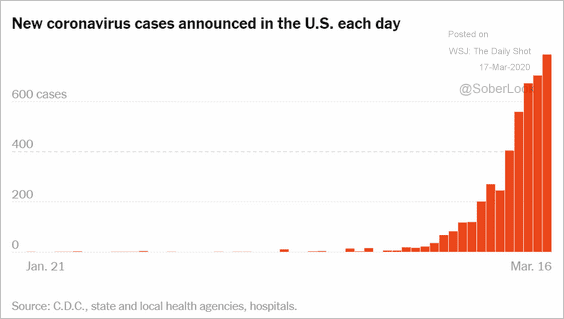 Source: The New York Times Read full article
3. Coronavirus mortality rates by age in the US and South Korea:
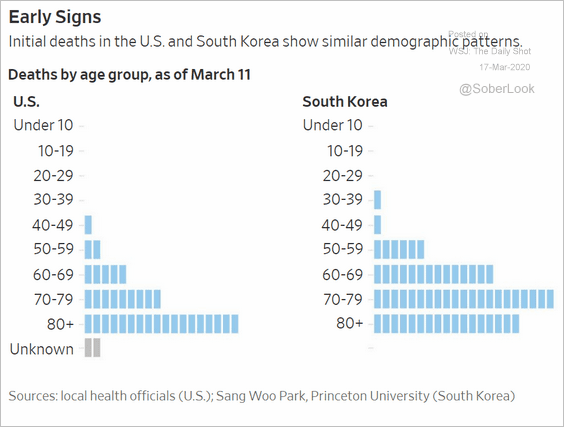 Source: @WSJ Read full article
4. The number of physicians and nurses per 1,000 people, by country:
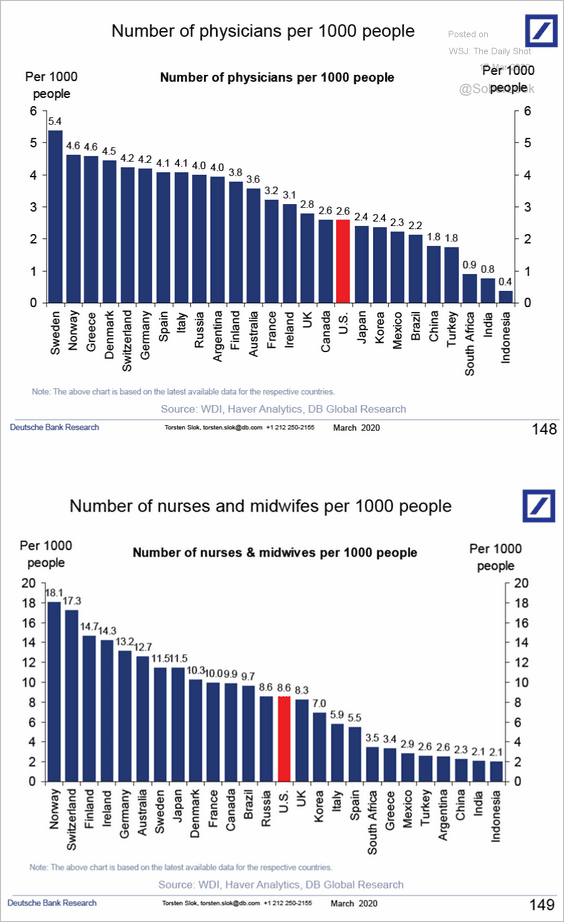 Source: Deutsche Bank Research
——————–
5. US homeowners planning to move:
 Source: LendingTree Read full article
6. The average age of US women giving birth:
 Source: @WSJ Read full article
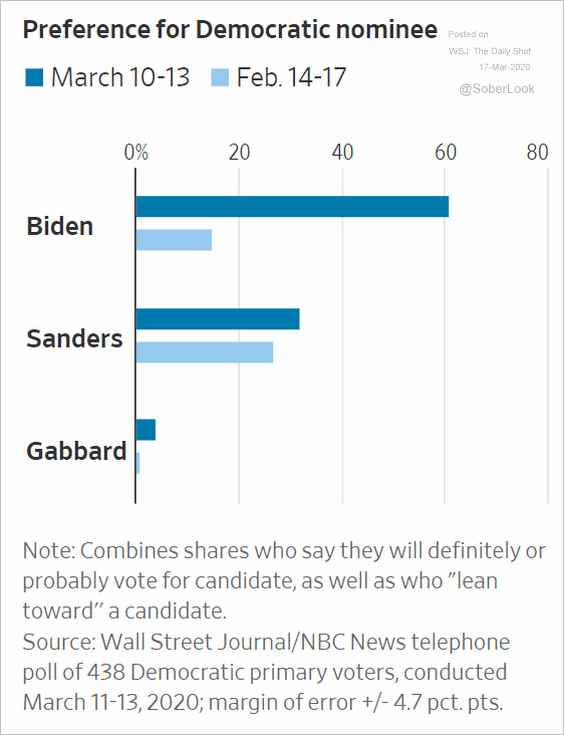
7. The latest Democratic nomination polls:
 Source: @WSJ Read full article
8. Betting market odds for the Democratic VP nomination:
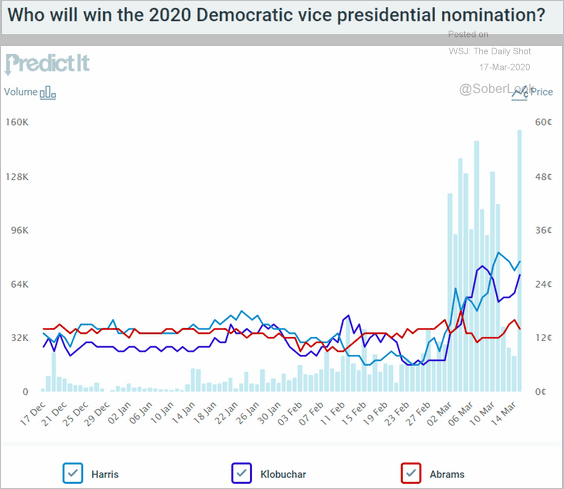 Source: PredictIt.org
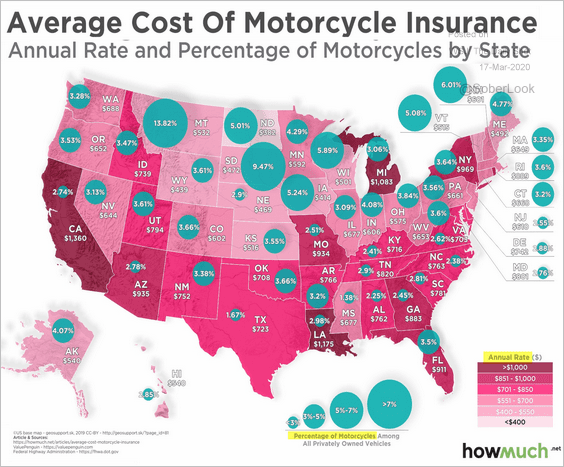
9. The average cost of motorcycle insurance:
 Source: @howmuch_net Read full article
——————–