
The Daily Shot: 18-Mar-20
• The United States
• The United Kingdom
• The Eurozone
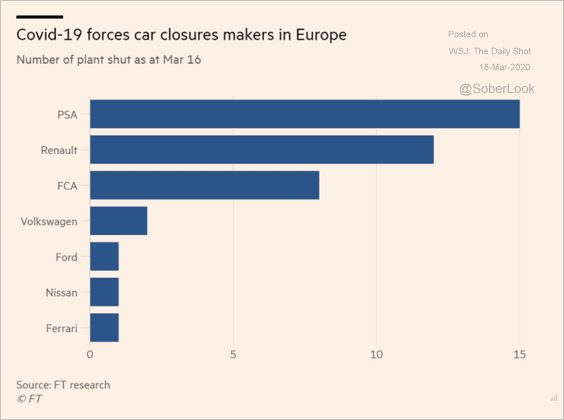
• Europe
• Asia – Pacific
• China
• Emerging Markets
• Commodities
• Energy
• Equities
• Credit
• Rates
• Global Developments
• Food for Thought
The United States
1. Job openings improved in January.
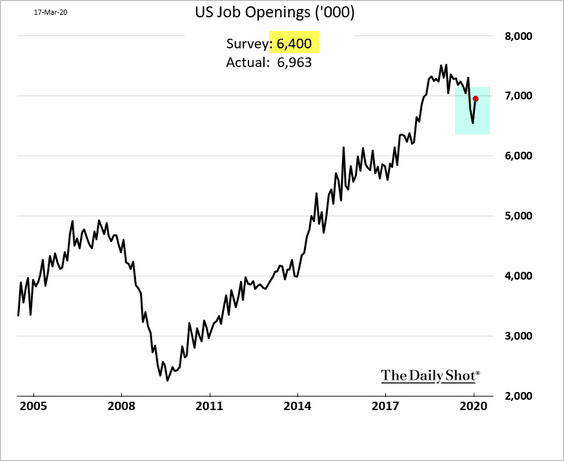
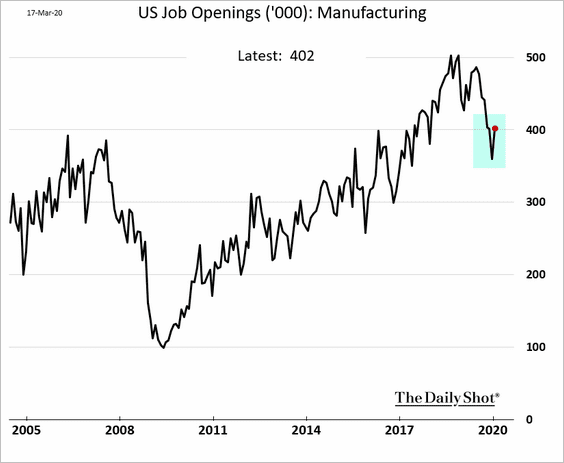
However, much has changed since then, as hiring freezes, furloughs, and layoffs are picking up.
 Source: @WSJ Read full article
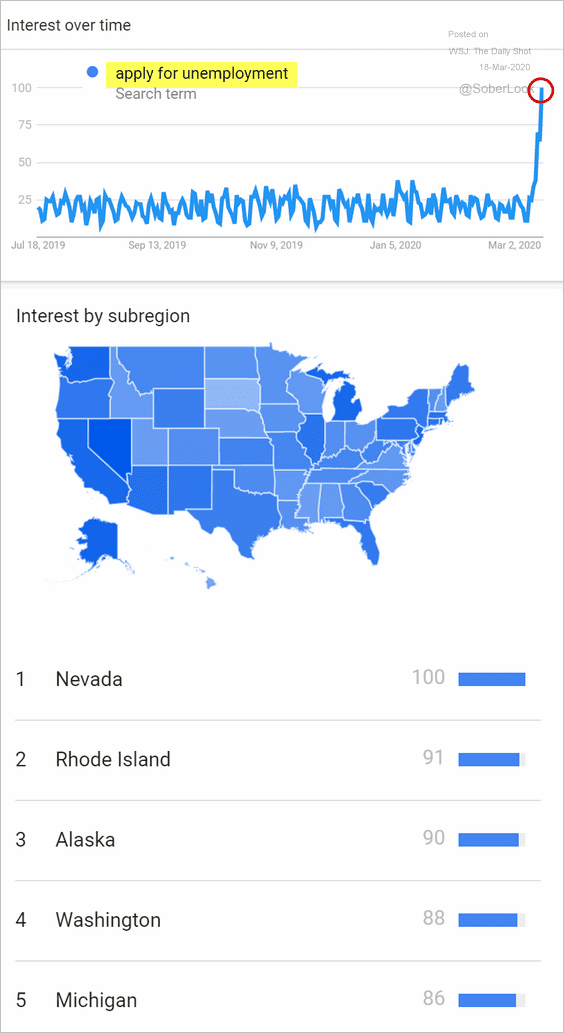
Online search activity related to filing for unemployment has soared in recent days.
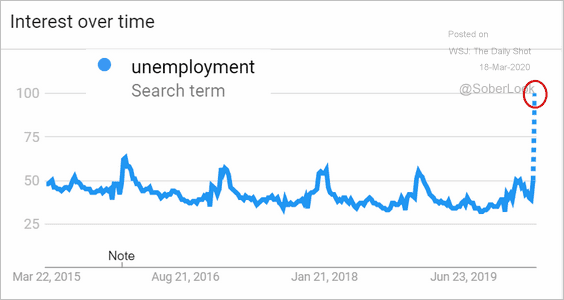 Source: Google Trends
Below are some recent trends (since last July).
 Source: Google Trends
 Source: Google Trends
——————–
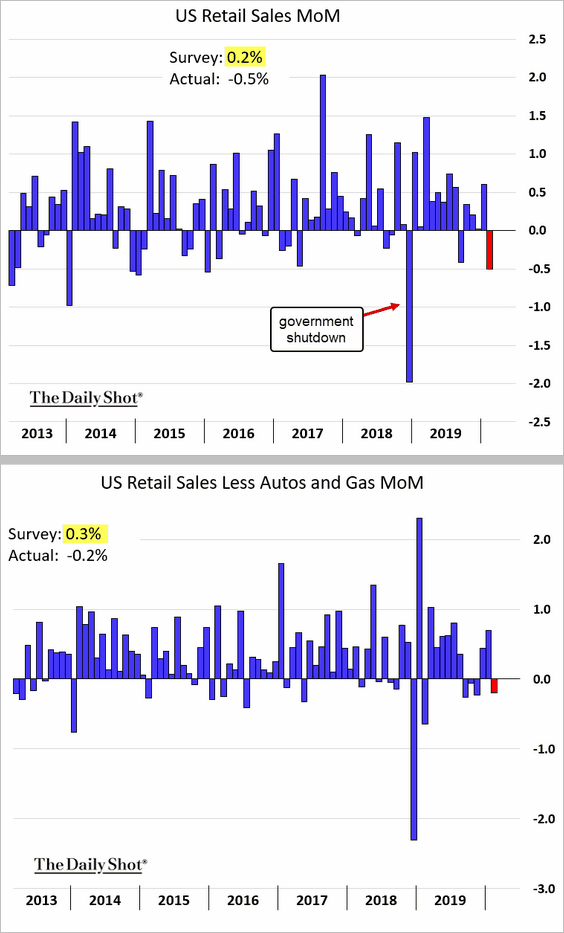
2. Retail sales weakened in February, but that was just a hint of what’s to come.
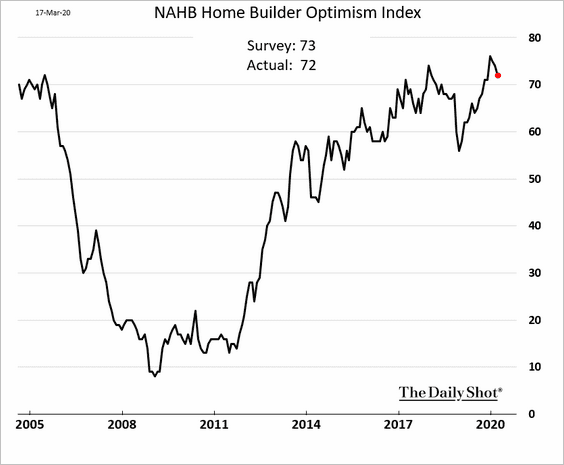
3. Next, we have some updates on the housing market.
• Homebuilder optimism (still healthy):
• Search activity for home financing:
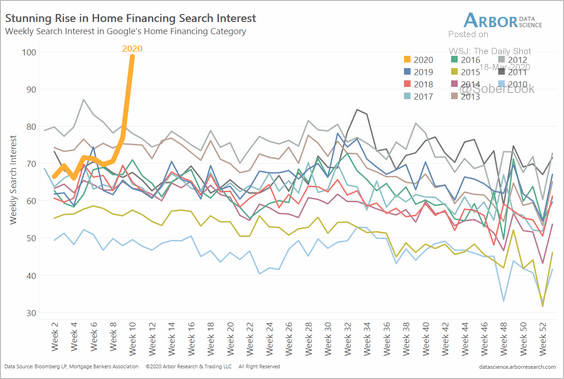 Source: Arbor Research & Trading
• Weak residential investment (contributing to housing shortages):
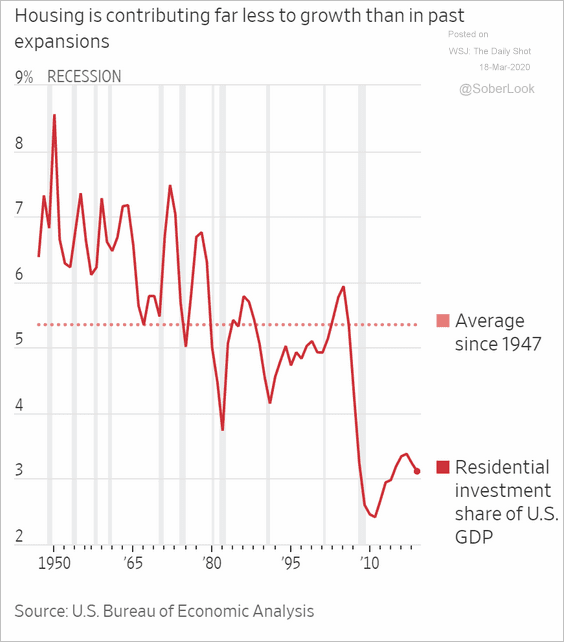 Source: @WSJ Read full article
• Homes built for rent:
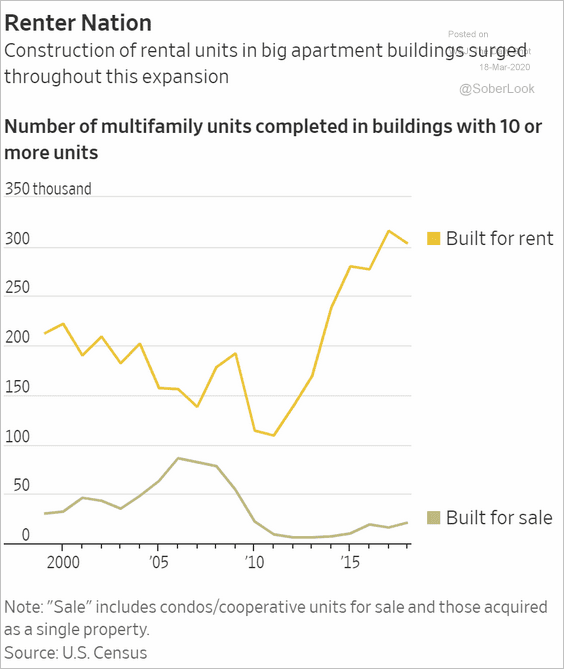 Source: @WSJ Read full article
——————–
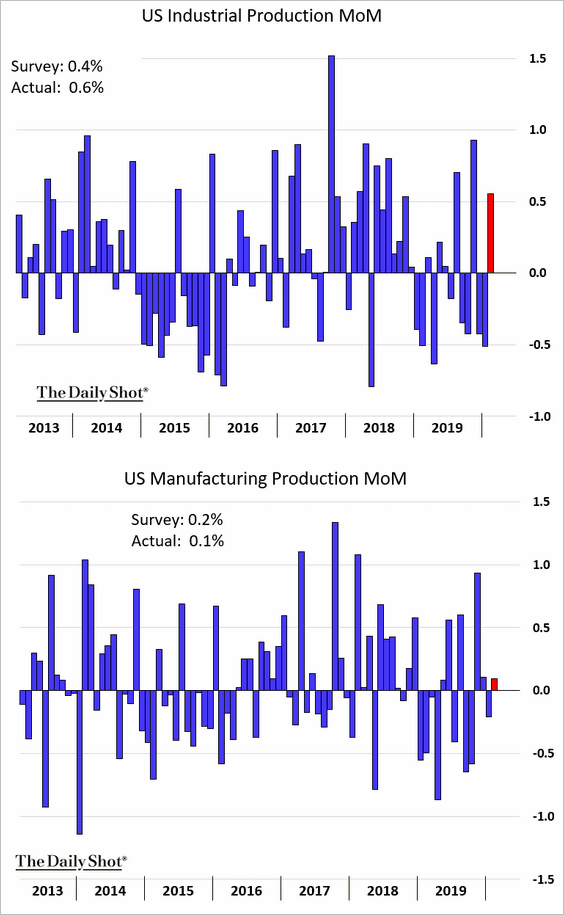
4. US industrial production strengthened last month.
5. According to Alpine Macro, the US stocks-to-bonds ratio implies an annualized GDP growth rate between zero and -1%.
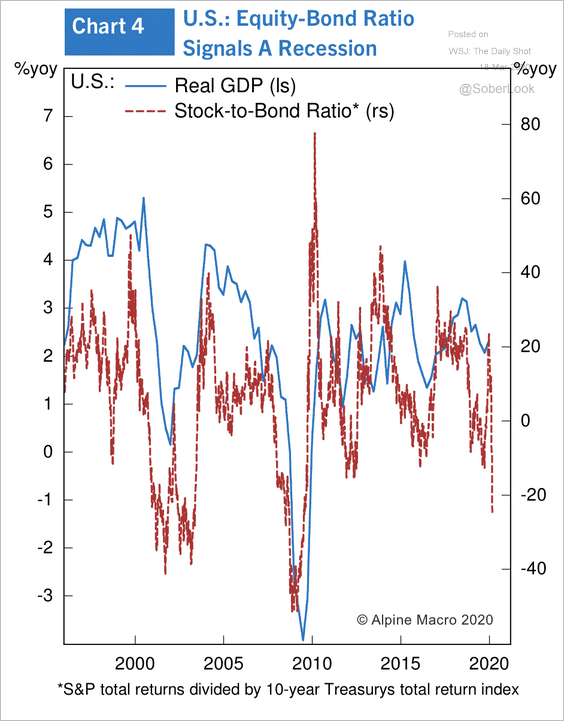 Source: Alpine Macro
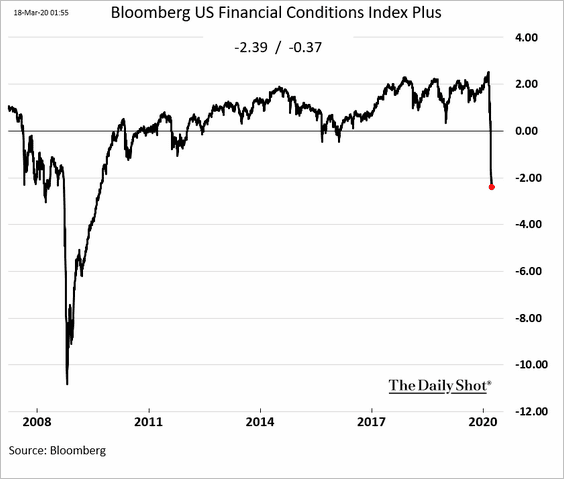
6. Financial conditions continue to tighten.
7. The longest economic expansion on record is over.
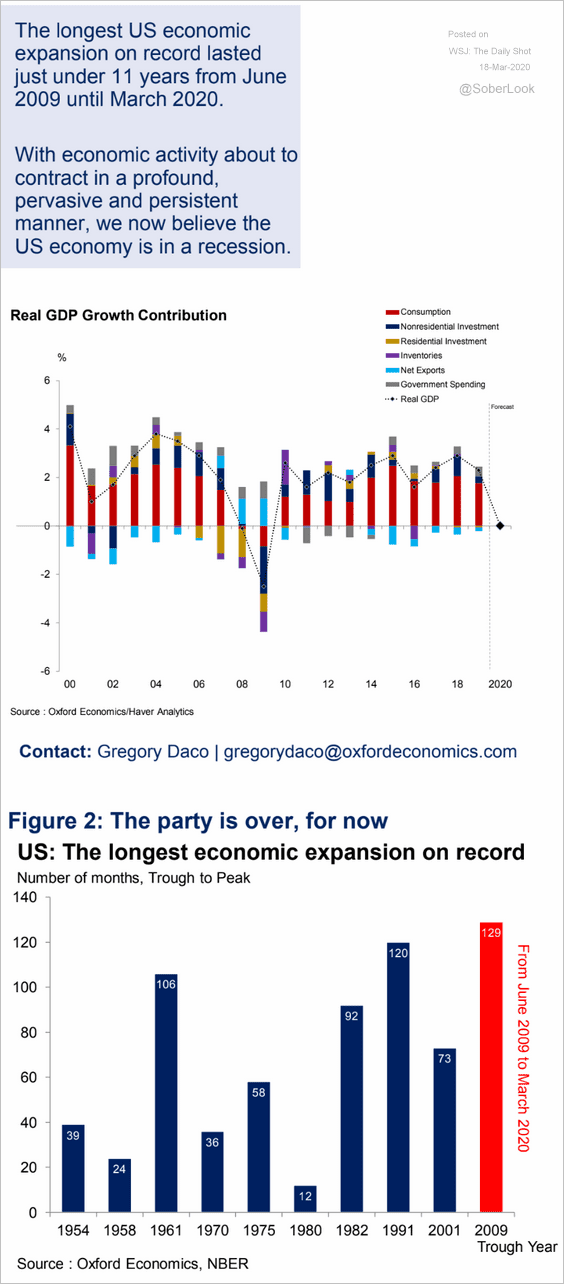 Source: Oxford Economics
The United Kingdom
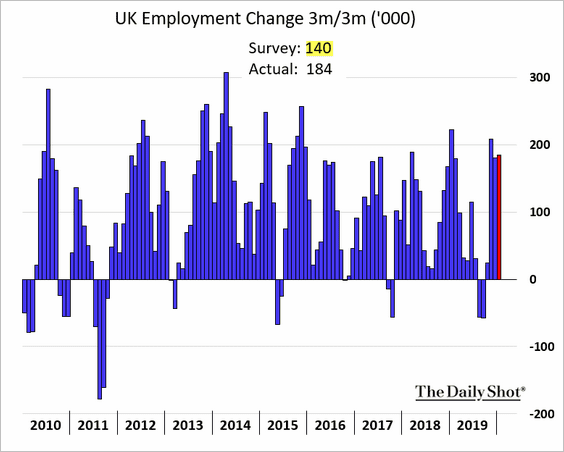
1. The employment report topped economists’ forecasts.
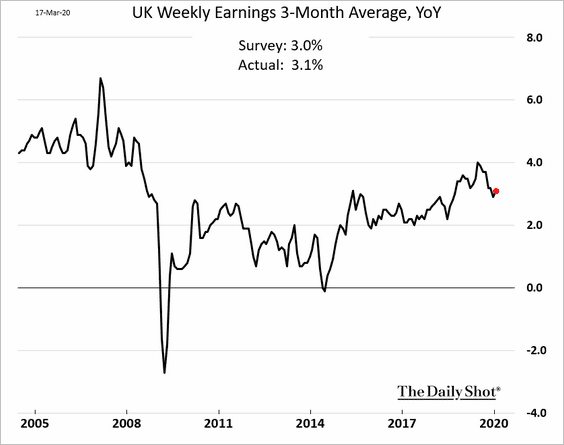
Wage growth remains robust.
• The unemployment rate ticked higher.

• And there is trouble ahead.
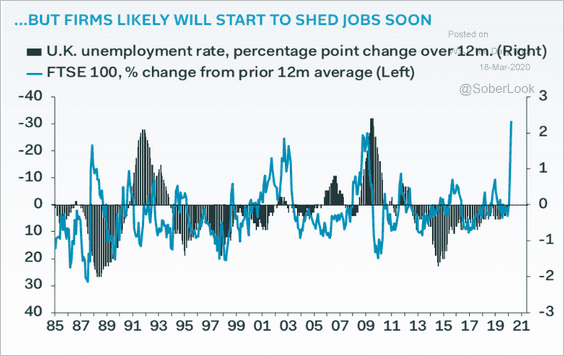 Source: Pantheon Macroeconomics
——————–
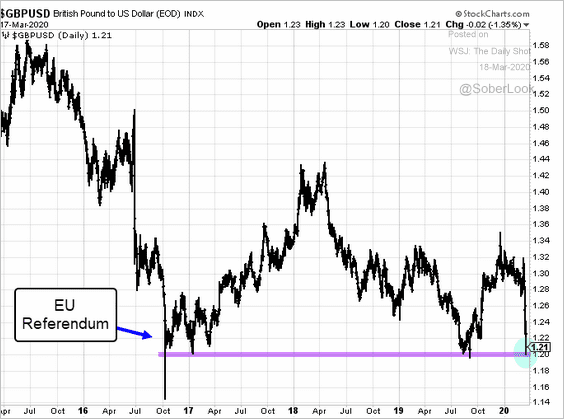
2. Is the British pound going to break below $1.20?
The Eurozone
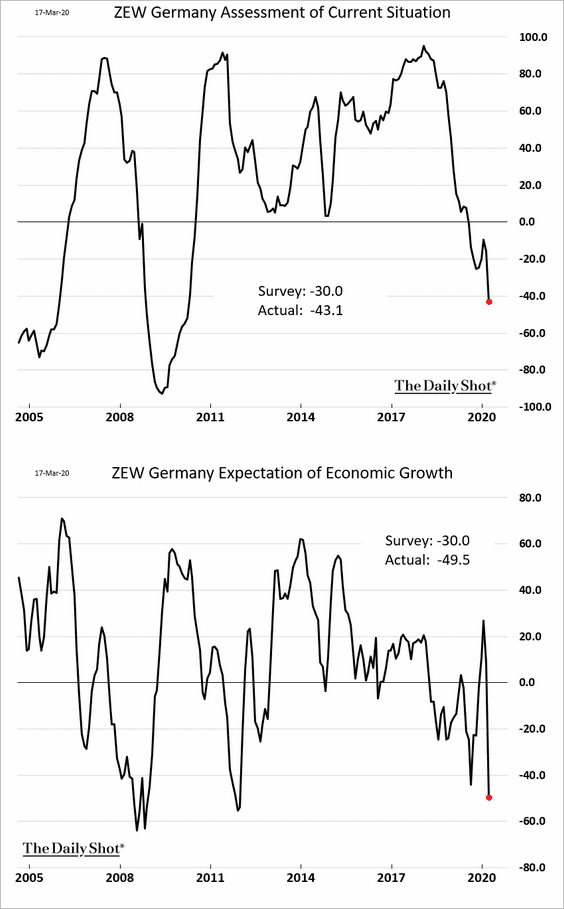
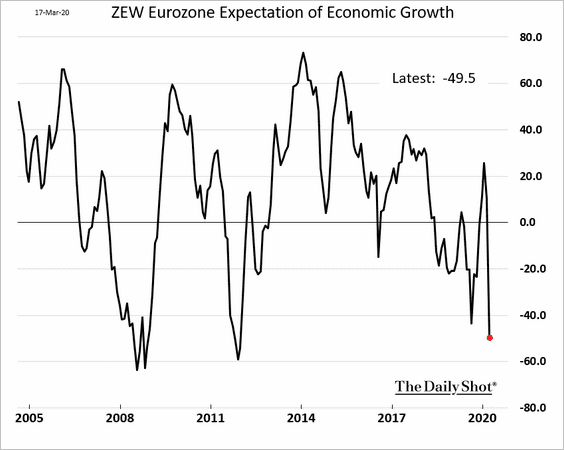
The ZEW indicator showed sentiment deteriorating rapidly this month.
• Germany:
• The Eurozone:
• We are going to see this weakness showing up in March business activity (PMI).
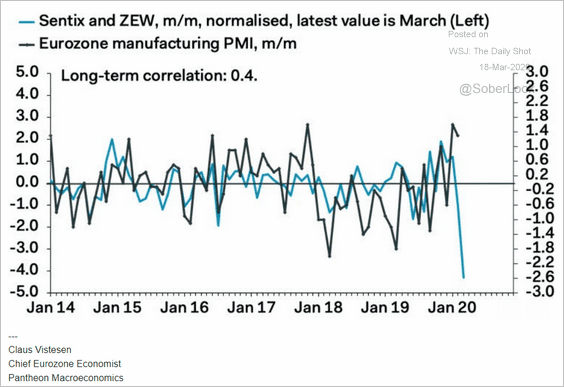 Source: Pantheon Macroeconomics
 Source: @financialtimes Read full article
Europe
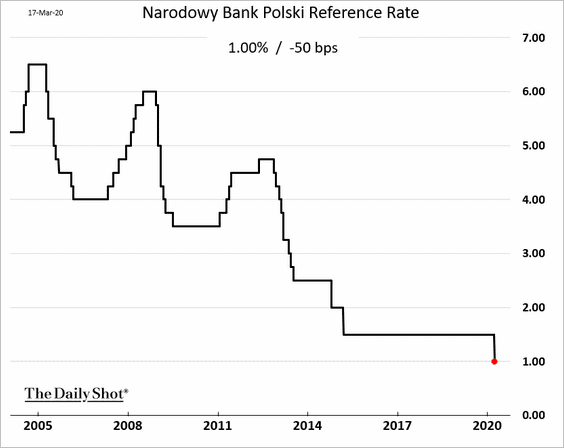
Central banks continue to ease.
• Sweden:
 Source: FX Street Read full article
• Poland:
Asia – Pacific
1. Japan’s recession is deepening.
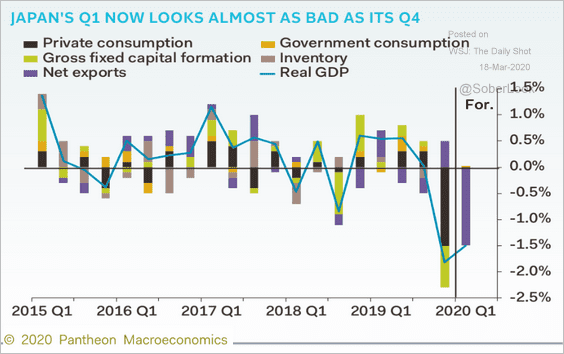 Source: Pantheon Macroeconomics
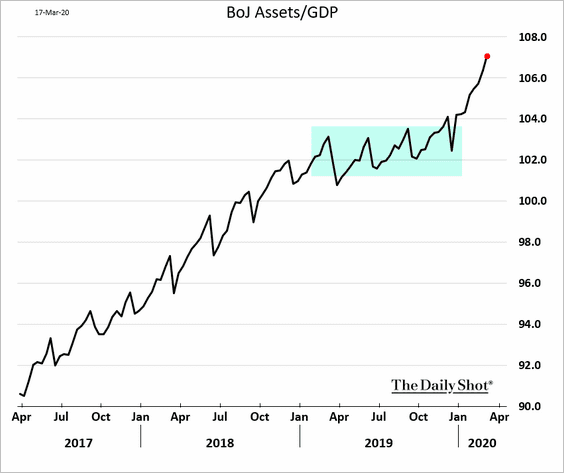
2. The BoJ is ramping up asset purchases.
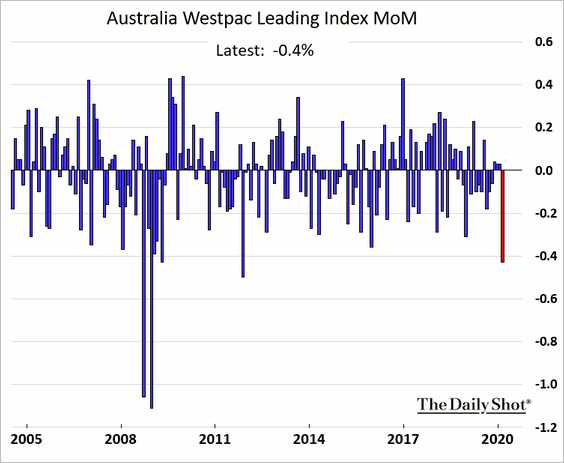
3. Australia’s leading indicator is showing signs of weakness.
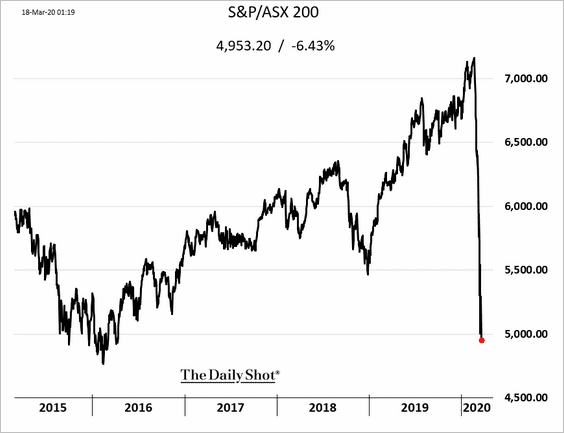
The stock market continues to tumble.
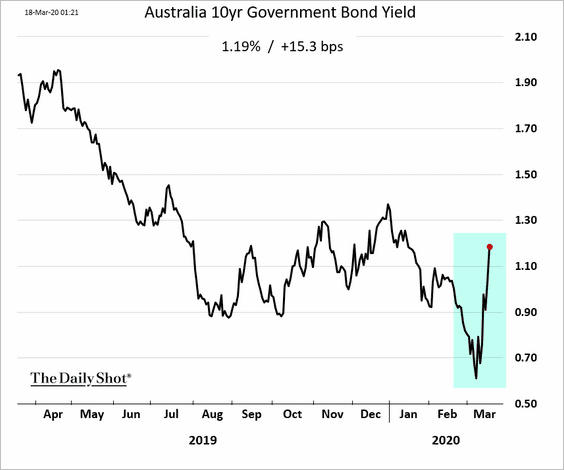
And now Australian bond prices are falling as well (nowhere to hide).
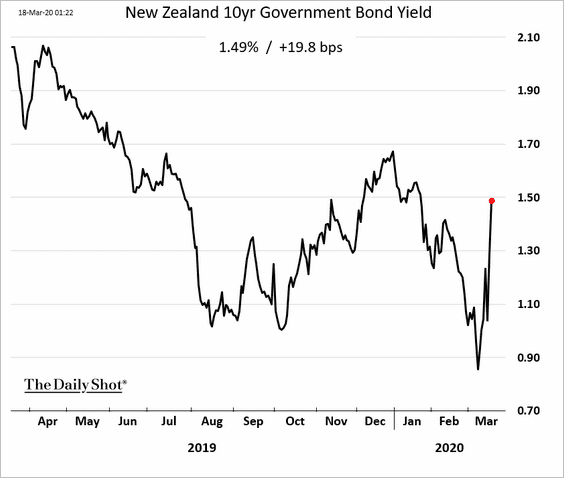
4. New Zealand’s government bonds are under pressure as well.
China
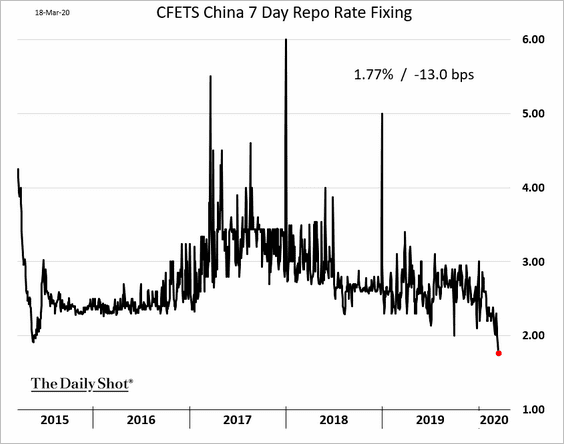
1. Without any official announcements, the PBoC is letting short-term rates dip to multi-year lows (unofficial easing).
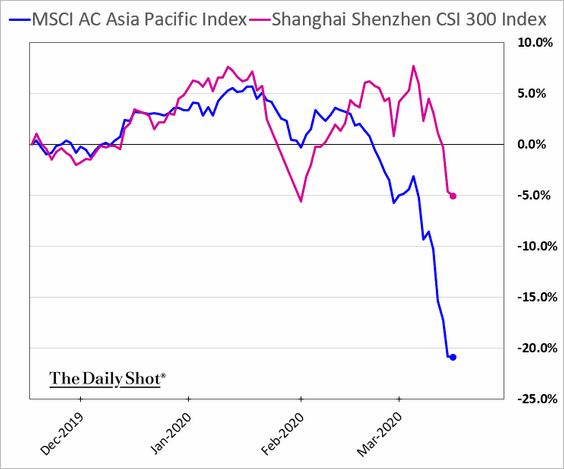
2. The stock market has outperformed peers in Asia and globally.
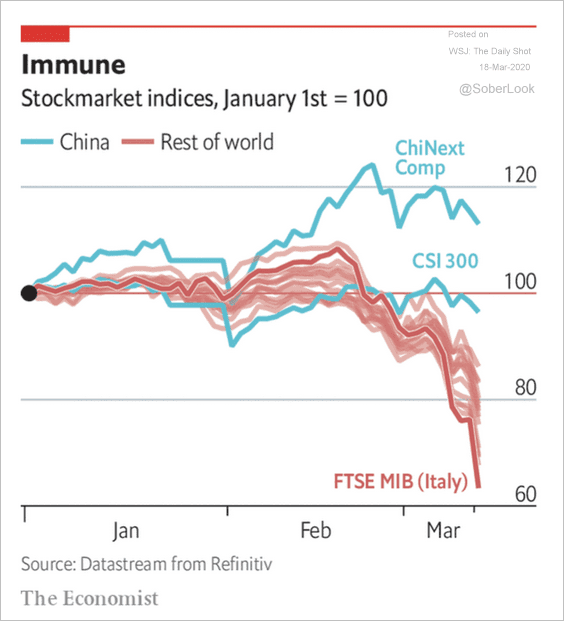 Source: The Economist Read full article
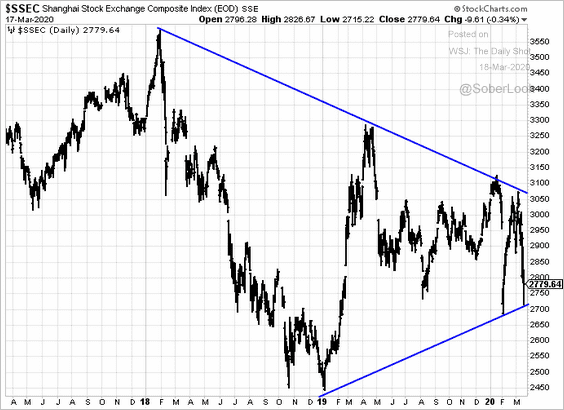
The Shanghai Composite has been consolidating.
 h/t April Ma, @TheTerminal
——————–
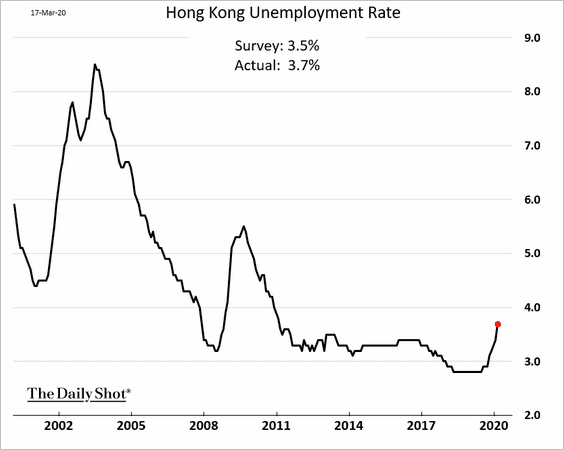
3. Hong Kong’s unemployment rate is creeping higher.
Emerging Markets
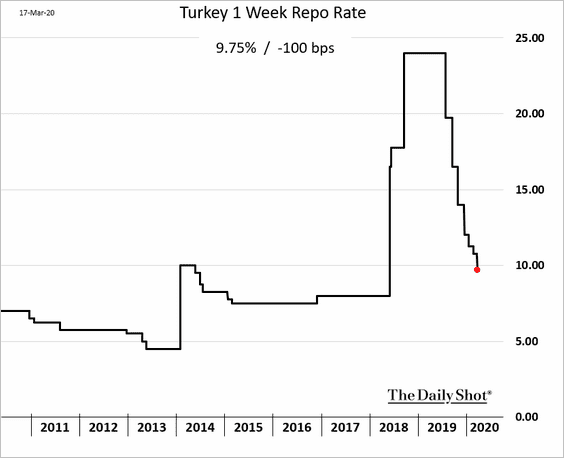
1. Turkey’s central bank cut rates again.
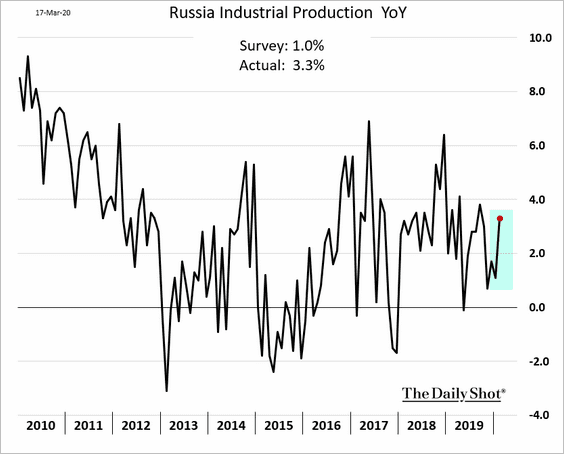
2. Russia’s industrial production has been improving. The rebound is unlikely to last in the current environment.
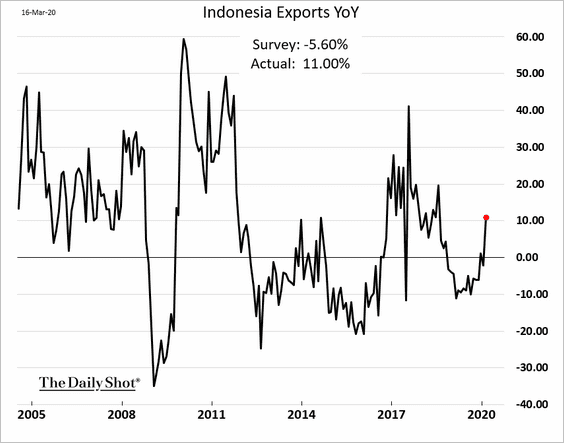
3. Indonesia’s exports unexpectedly strengthened last month.
Commodities
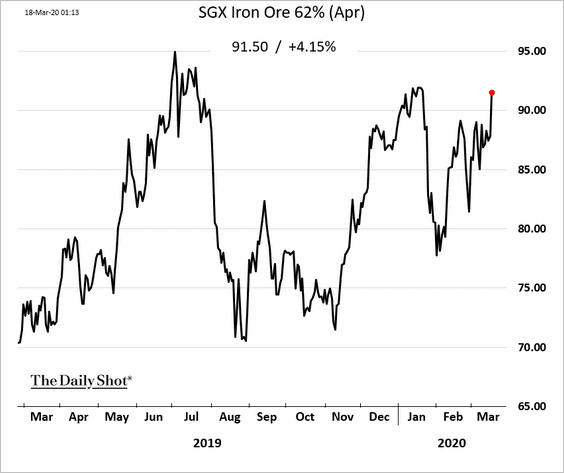
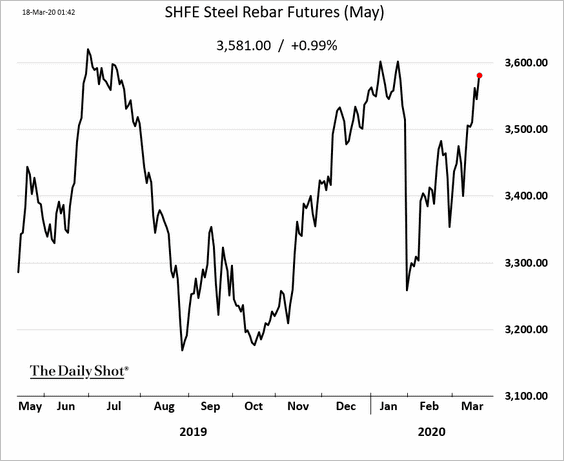
1. China’s steel demand seems to be picking up.
• Iron ore futures (Singapore):
• Steel rebar futures (Shanghai):
——————–
2. Copper remains under pressure.

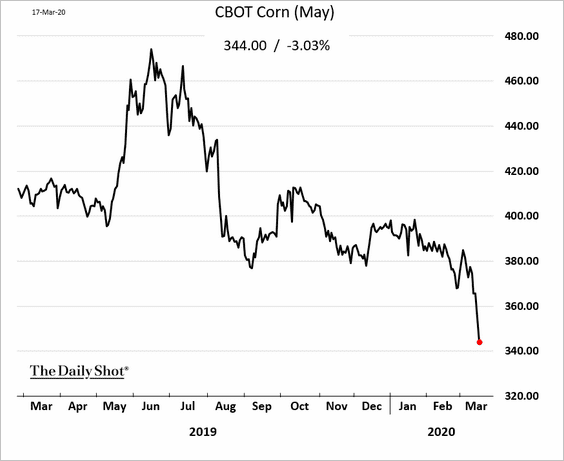
3. US corn prices are tumbling.
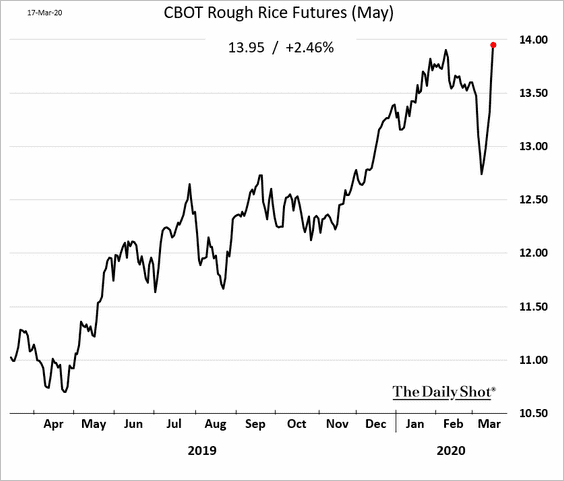
4. Rice futures soared in recent days, driven by hoarders.
 h/t Michael Hirtzer, @TheTerminal
 Source: Seeking Alpha Read full article
Energy
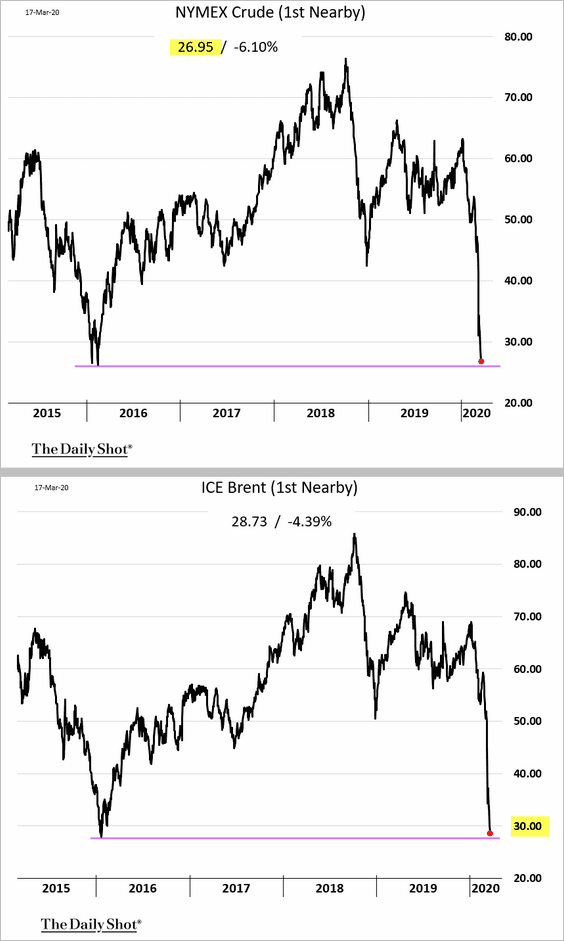
1. US crude oil dipped below $27/bbl while Brent is below $29. We are now near the 2016 lows.
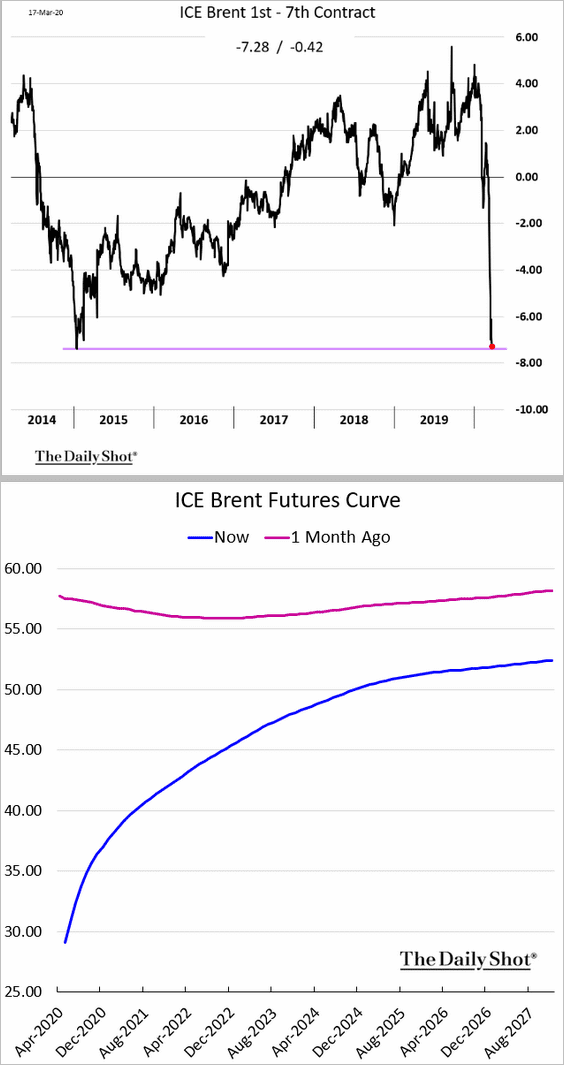
2. Brent contango is also near extreme levels.
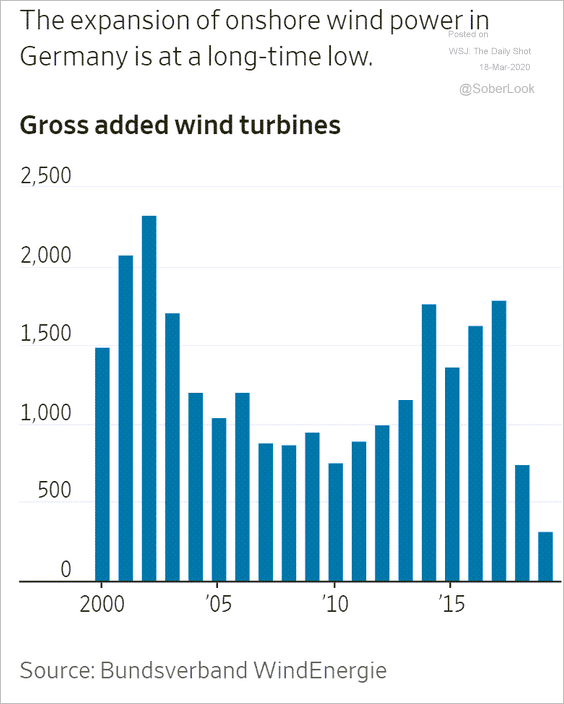
3. Separately, Germany has been slowing its investment in wind turbines.
 Source: @WSJ Read full article
Equities
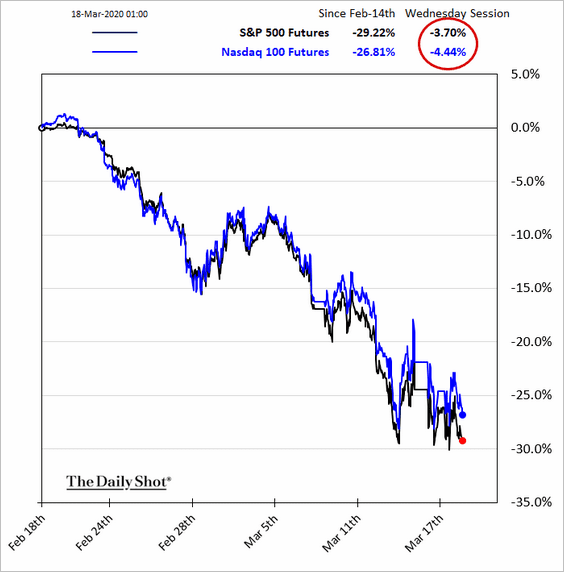
1. Stocks had a good day on Tuesday on stimulus hopes, …
 Source: @bloomberglaw Read full article
… but futures hit limit-down again in early trading on Wednesday.
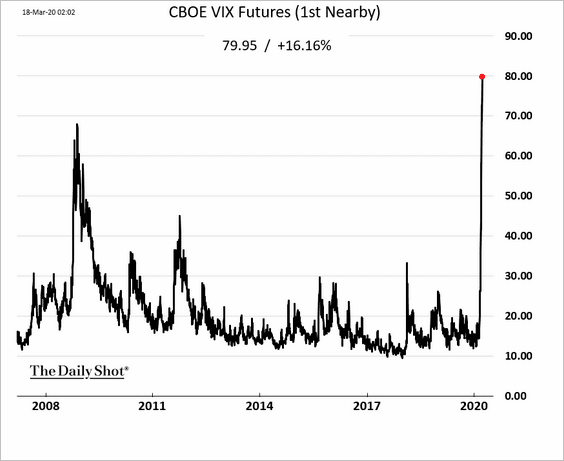
Extreme market volatility persists (3 charts).
 Source: @WSJ Read full article
 Source: @jessefelder, Bloomberg Read full article
 Source: @WSJ Read full article
VIX futures are approaching 80 for the first time.
——————–
2. Correlations are near extremes.
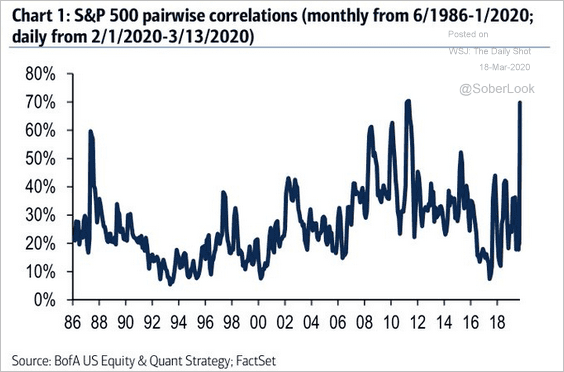 Source: BofAML, @TayTayLLP
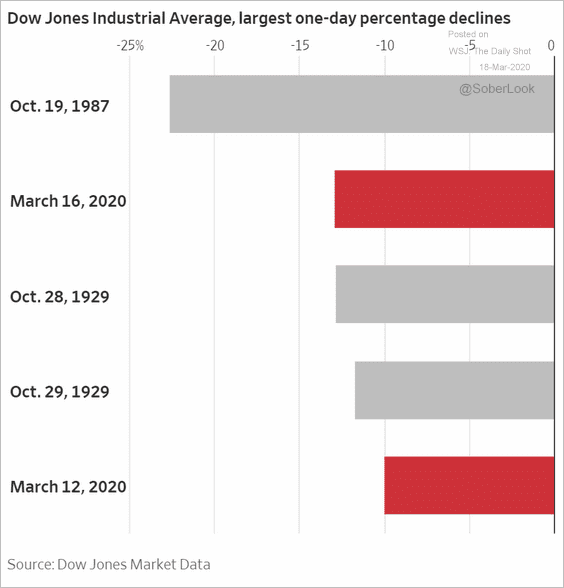
3. This selloff has been the sharpest in history.
 Source: @ISABELNET_SA, @BofAML
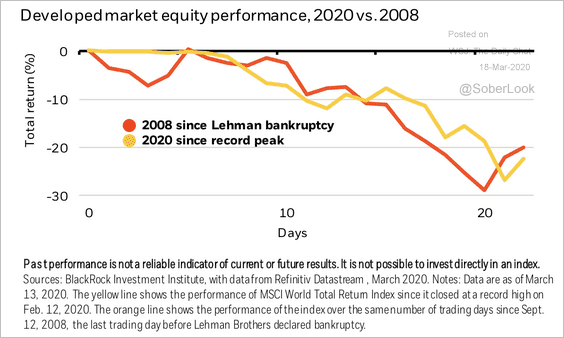 Source: BlackRock
——————–
4. Trading volumes have picked up.
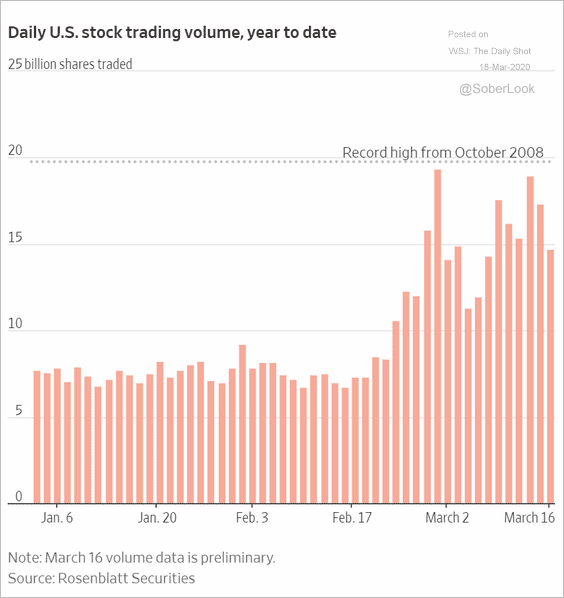 Source: @WSJ Read full article
5. The largest index ETF is registering substantial inflows. The demand could be coming from short-sellers who want to borrow the security (to short it).
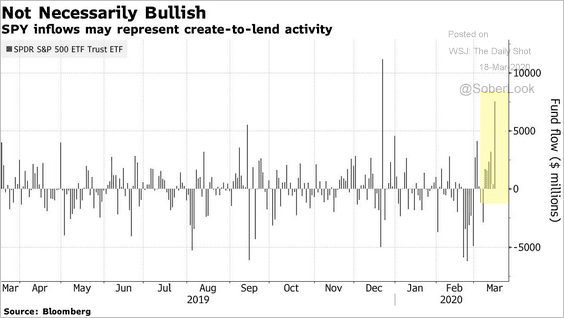 Source: @markets Read full article
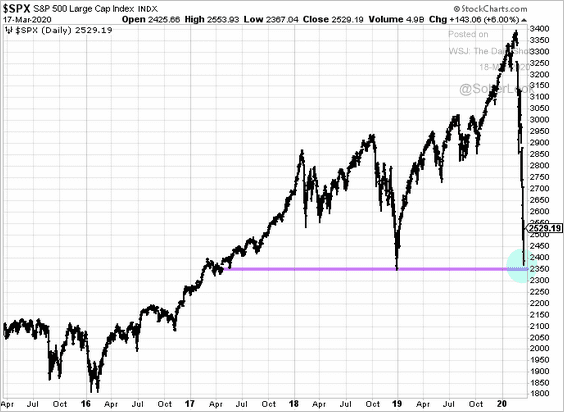
6. Will the S&P 500 break support?
7. Analysts continue to downgrade earnings growth estimates.
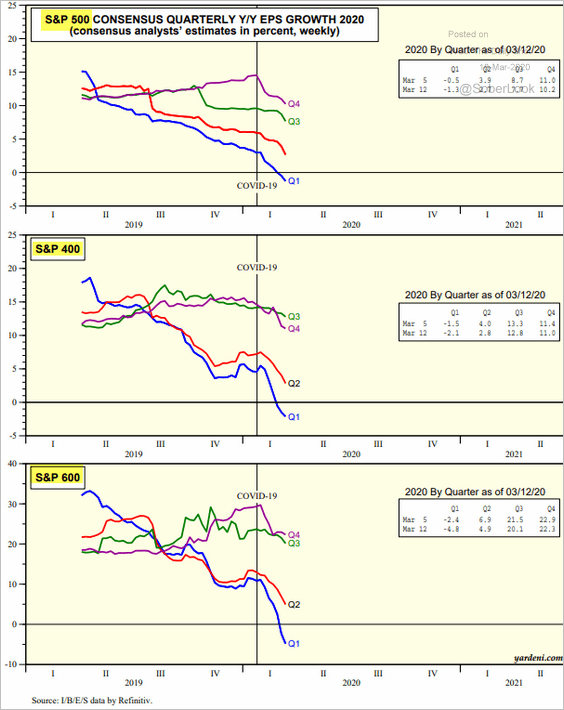 Source: Yardeni Research
8. US active manager pessimism reached 2016 levels.
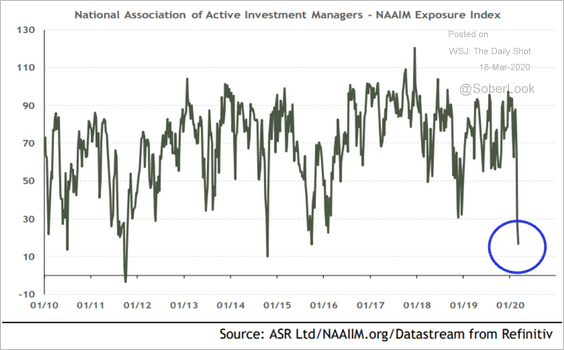 Source: Absolute Strategy Research
9. Systematic funds have been aggressive sellers (2 charts).
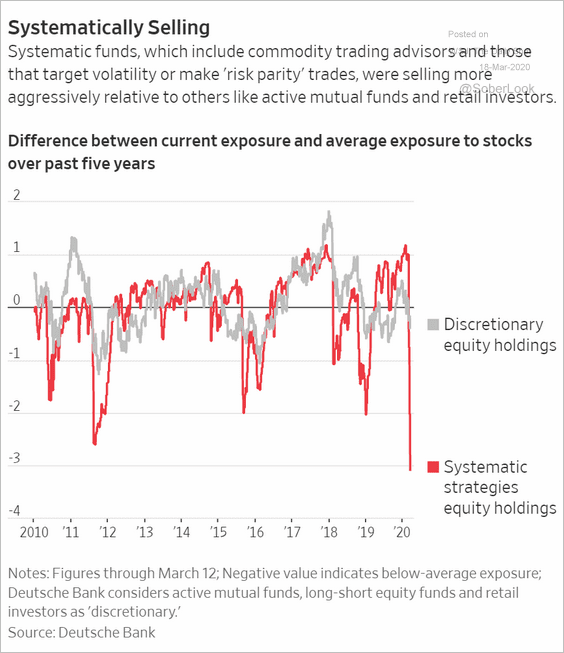 Source: @WSJ Read full article
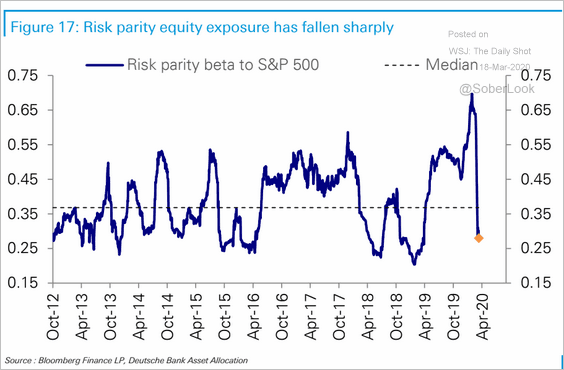 Source: Deutsche Bank Research
——————–
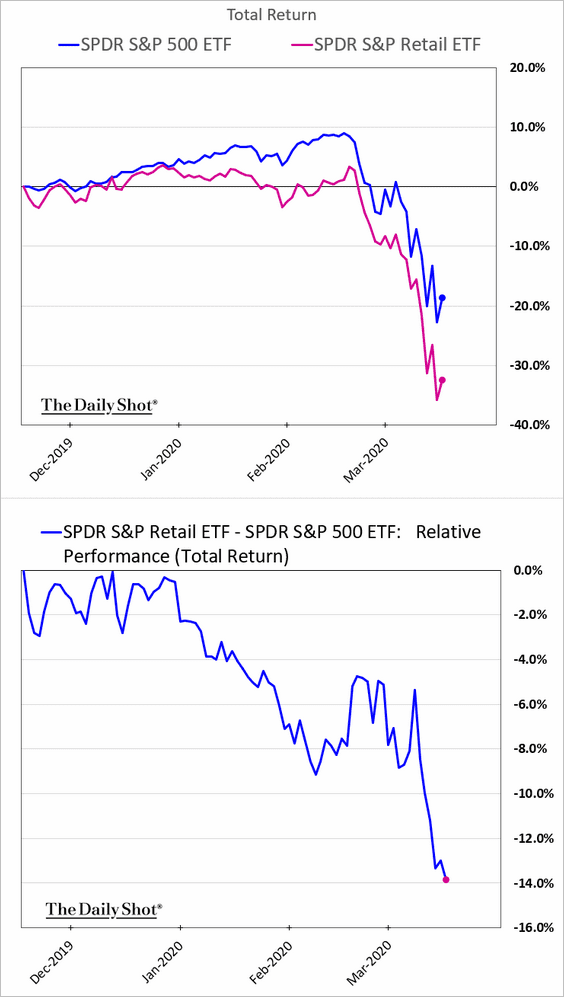
10. Next, we have some sector performance updates.
• Retail:
• Consumer staples:
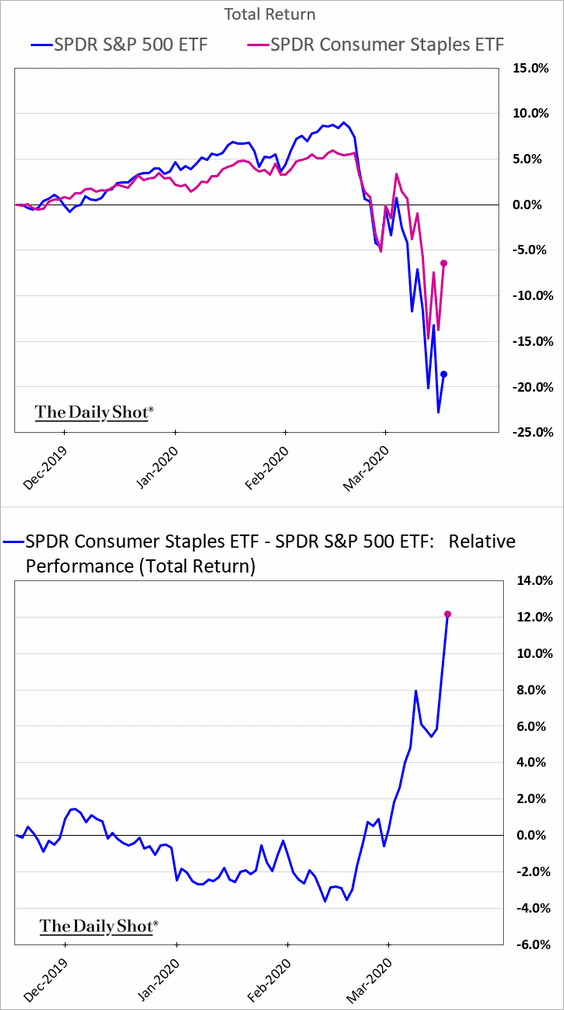
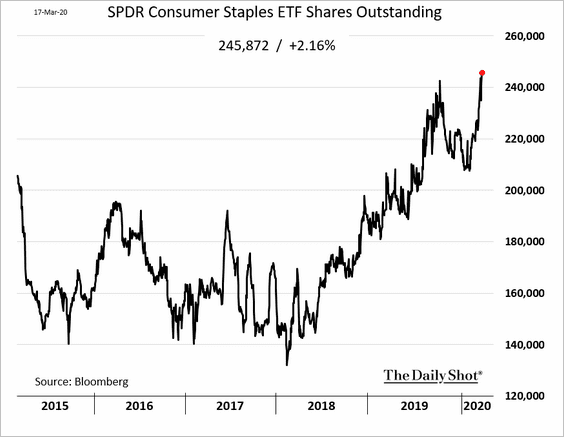
Consumer staples ETF shares outstanding (a measure of fund inflows):
——————–
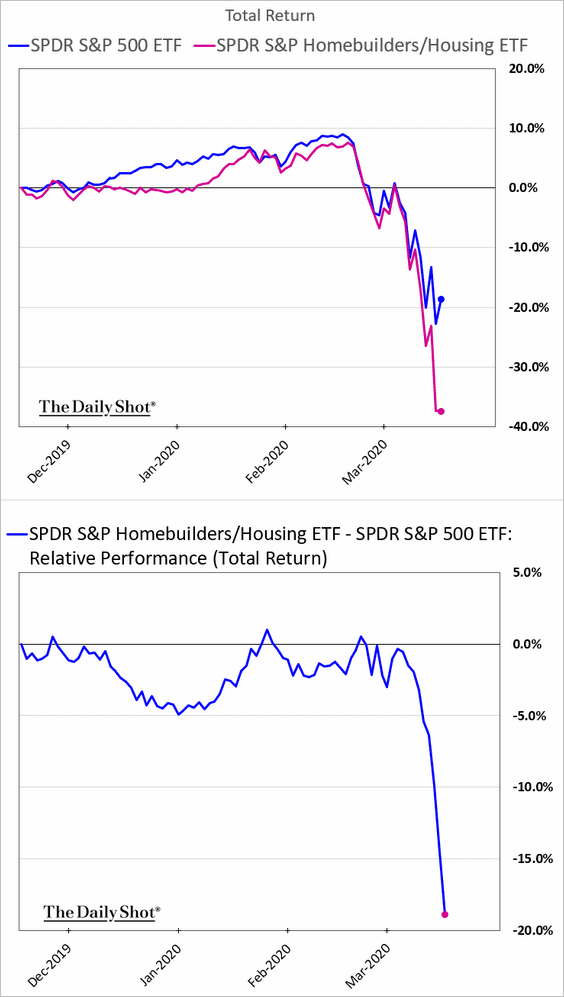
• Homebuilders:
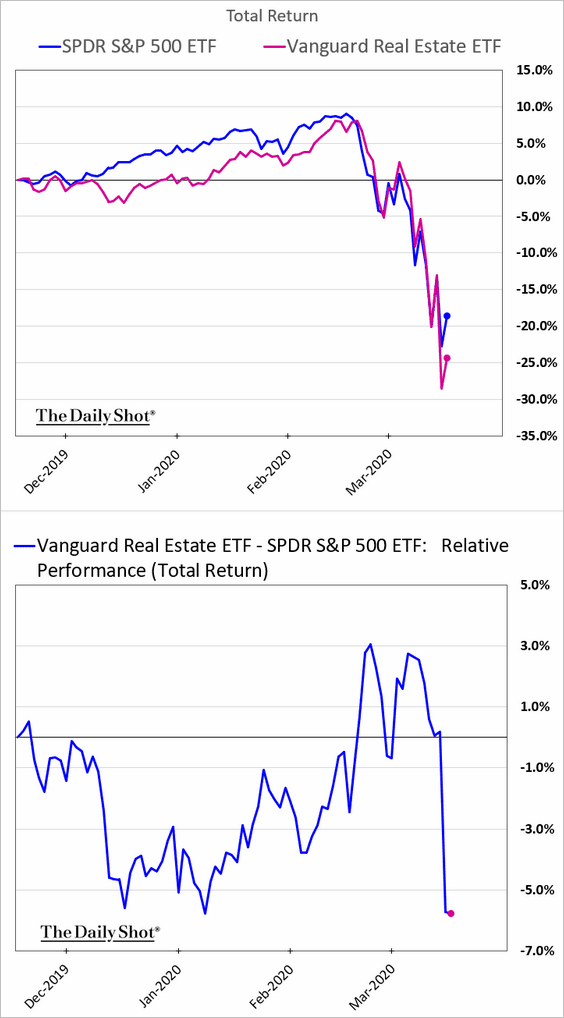
• REITs:
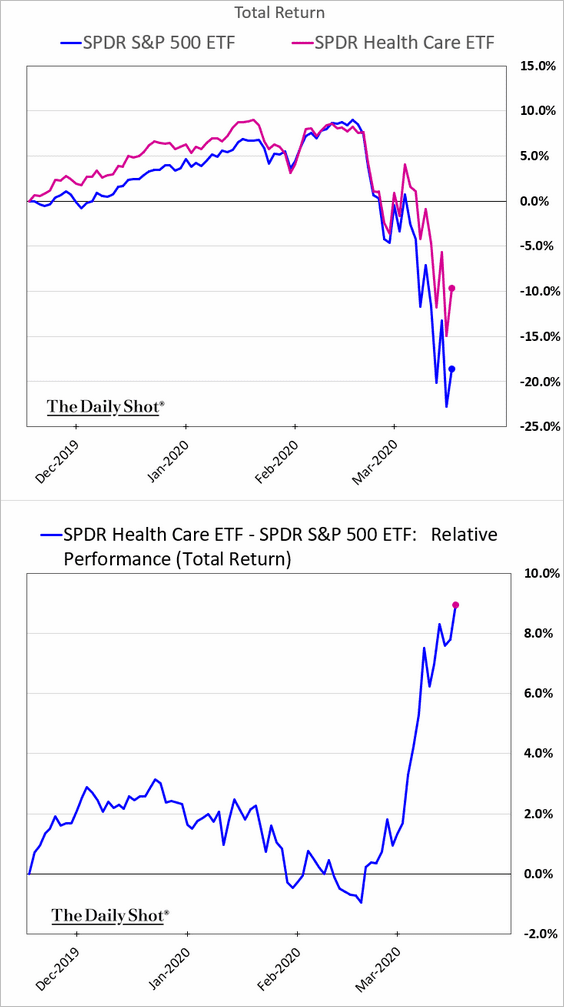
• Healthcare:
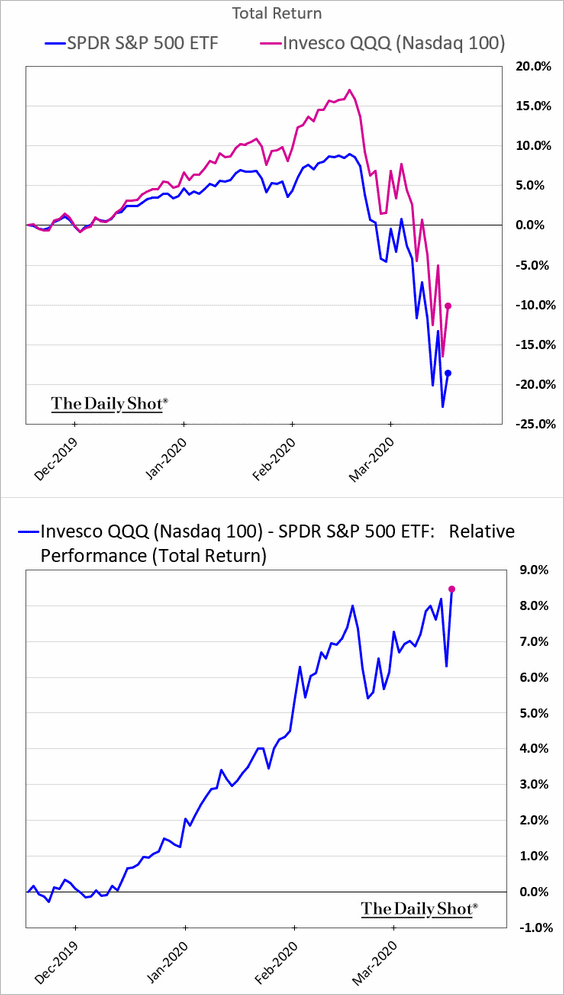
• Tech:
• Industrials:

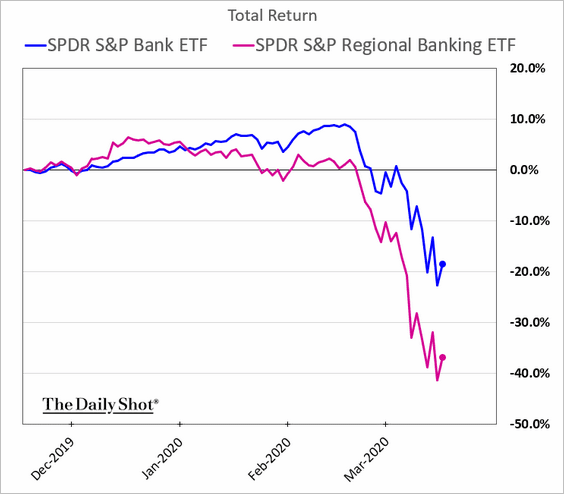
• Regional banks (vs. broad bank index):
• The SPDR financial sector ETF is at long-term support relative to the S&P 500.
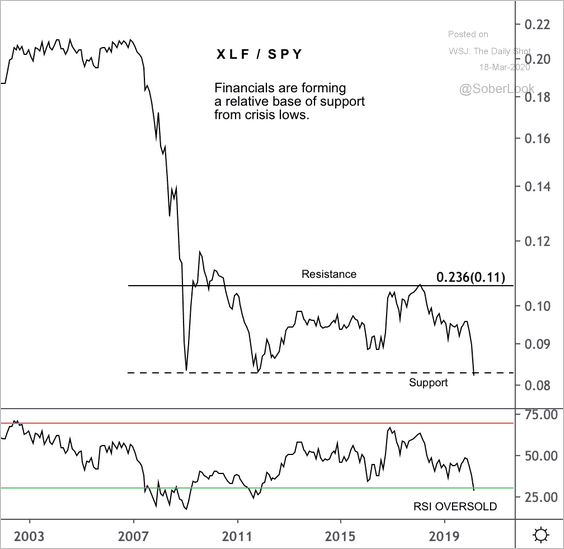 Source: @DantesOutlook
• Energy is now the second smallest sector weighting in the S&P 500.
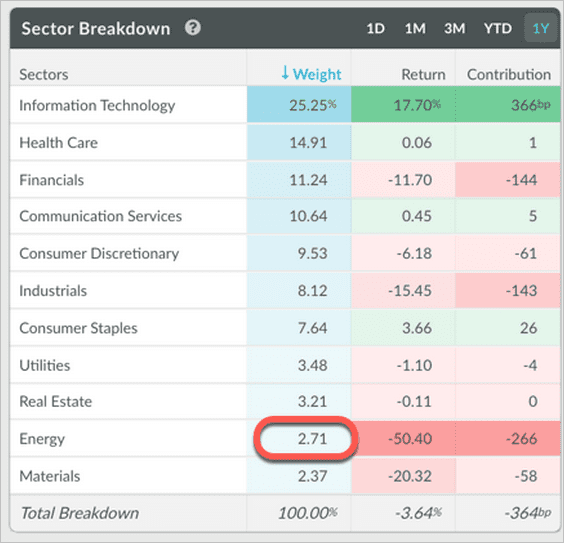 Source: Koyfin
Credit
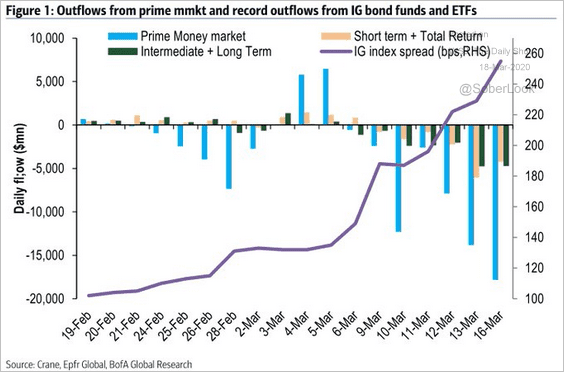
1. We continue to see stress in the funding markets.
• Prime money market funds are experiencing substantial outflows.
 Source: BofAML, @TayTayLLP
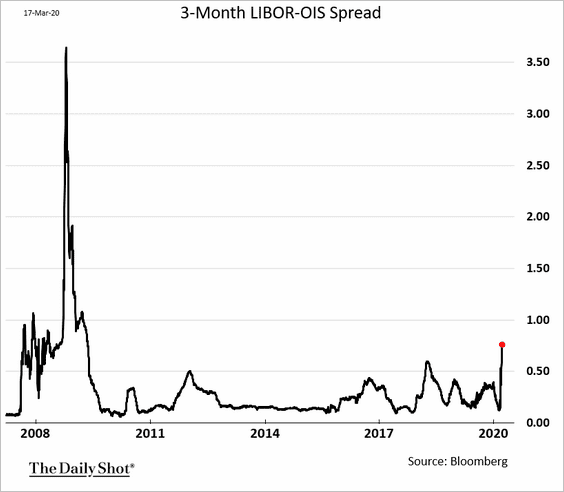
• LIBOR – OIS spread:
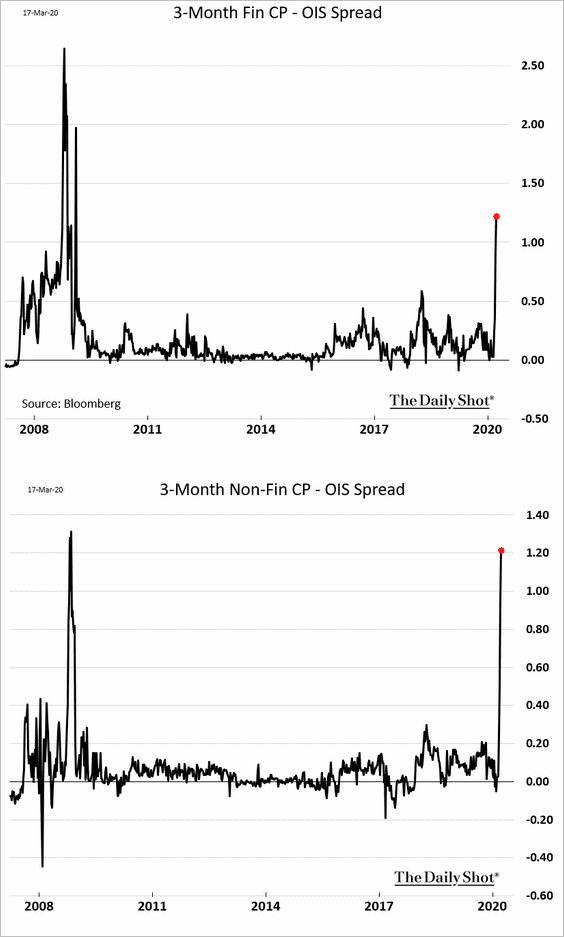
• Commercial paper (CP) spreads:
The first chart shows financial CP spreads (banks); the second is non-financial CP (non-bank corporations).
• The Fed is now stepping in to ease the stress in commercial paper markets.
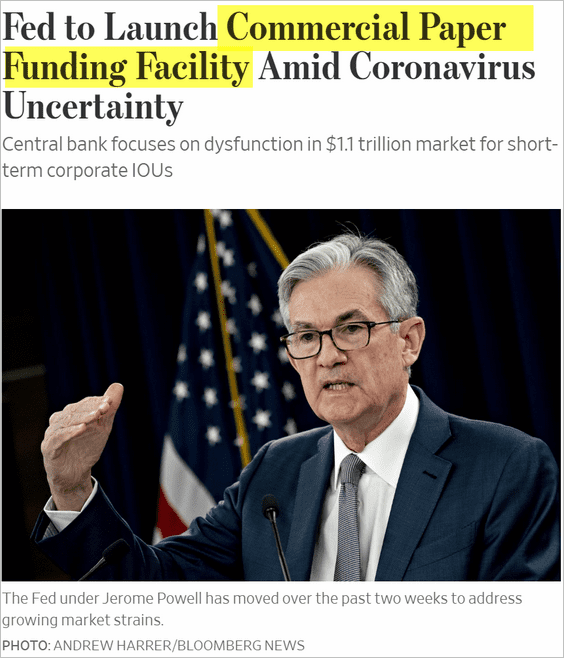 Source: @WSJ Read full article
 Source: Reuters Read full article
——————–
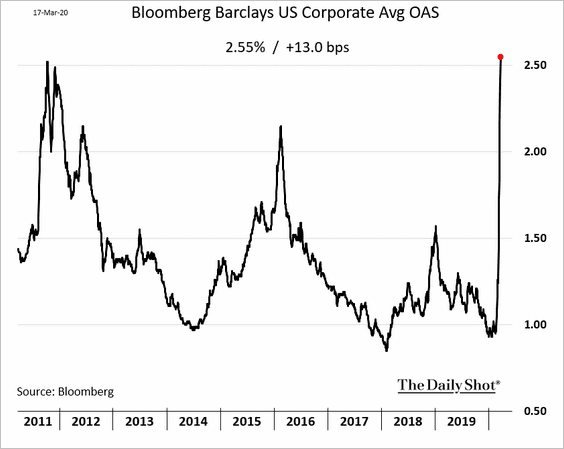
2. Corporate bond spreads keep widening.
• Investment-grade:
• Energy-sector high-yield:

——————–
3. The market now views many investment-grade bonds as junk.
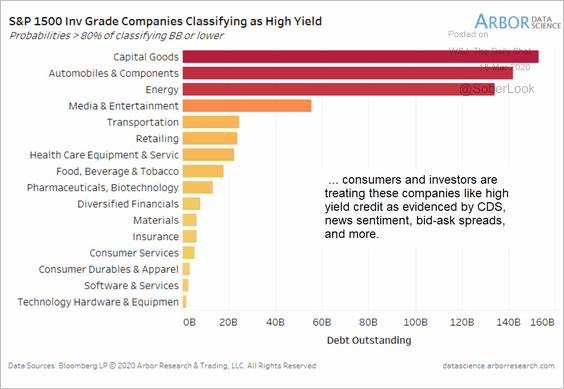 Source: Arbor Research & Trading
There’s a growing risk of downgrades from BBB to junk.
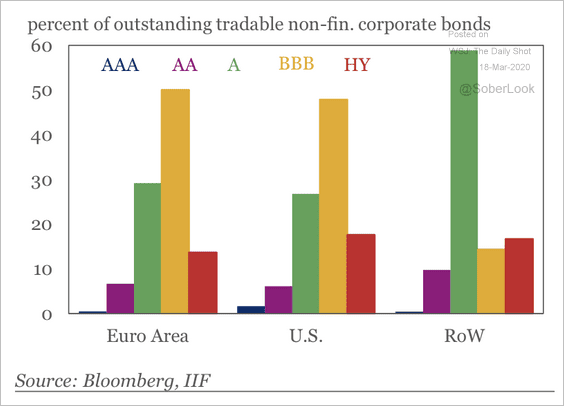 Source: IIF
——————–
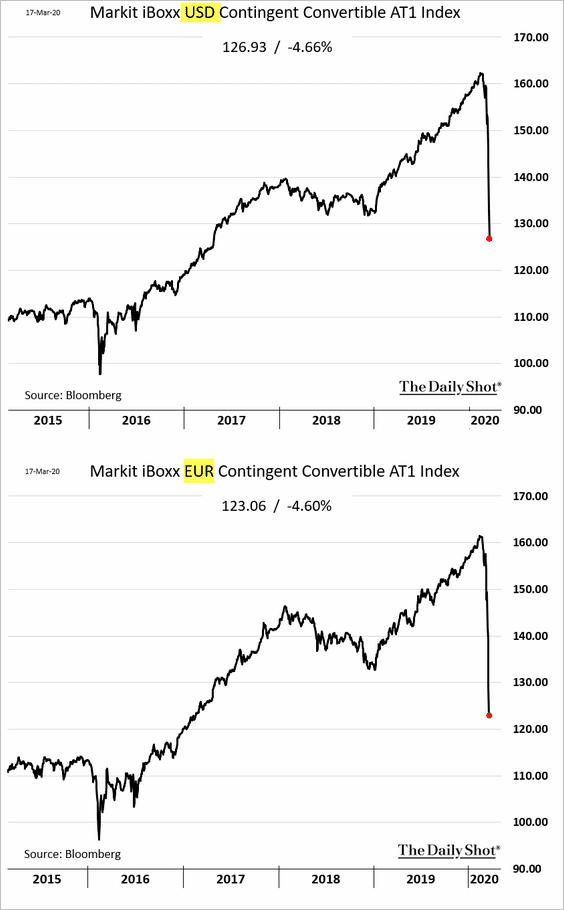
4. Bank CoCos are tumbling.
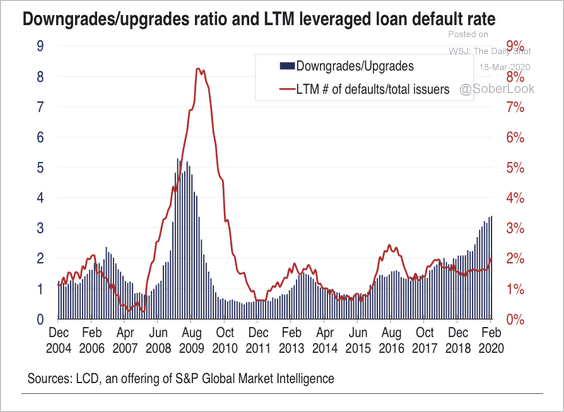
5. Credit downgrades are a pinch-point for CLOs currently holding significant single-B debt. With the 7.5% CCC bucket limit, many would be forced to sell low-quality loans, according to S&P.
 Source: S&P Global Market Intelligence
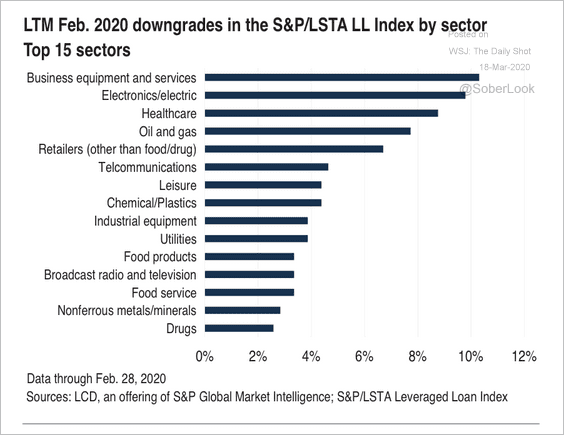
6. The top three sectors vulnerable to downgrade activity (shown below) make up a substantial portion of the overall leveraged loan market, according to S&P.
 Source: S&P Global Market Intelligence
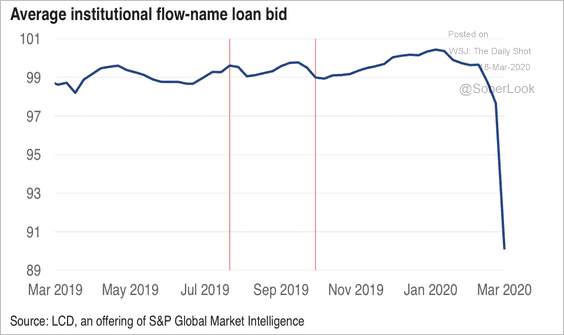
The primary loan market has been essentially shuttered amid market volatility. Bids on institutional loans tanked.
 Source: S&P Global Market Intelligence
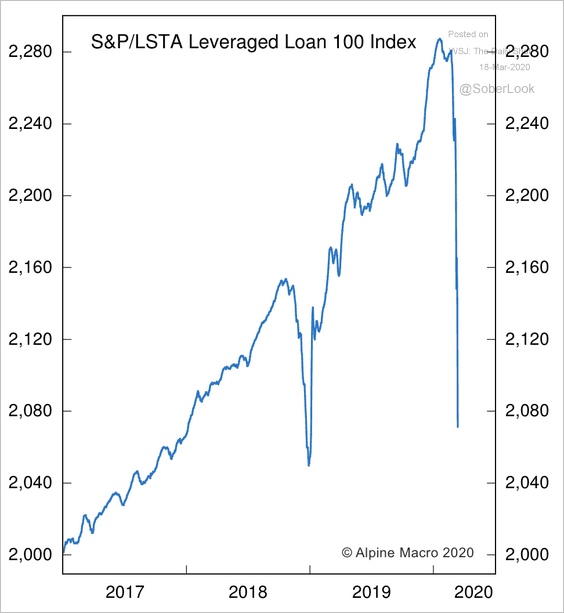 Source: Alpine Macro
——————–
7. Here is another look at exposure by sector.
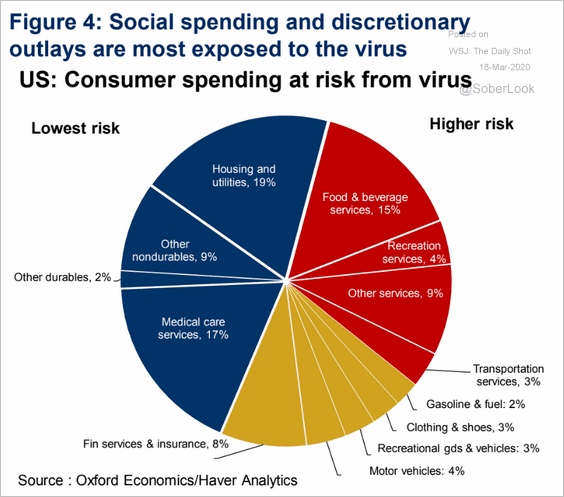 Source: Oxford Economics
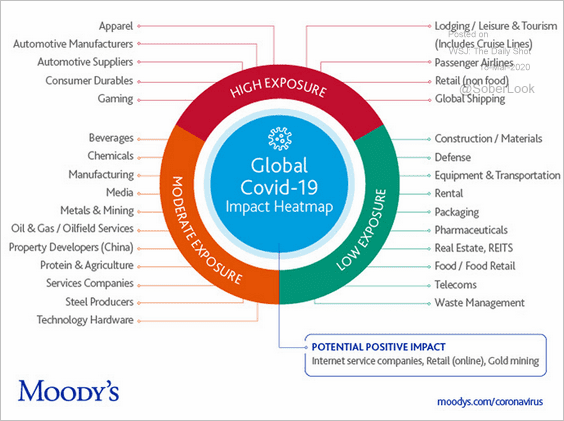 Source: Moody’s
——————–
8. Last week, Moody’s upgraded a relatively large amount of residential mortgage-backed securities (RMBS). The MBS market now has a reliable buyer – the Fed (see story).
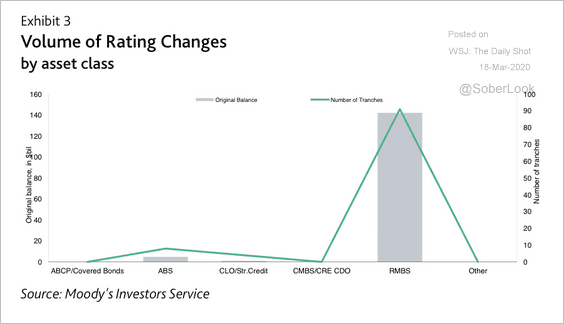 Source: Moody’s Investors Service
Rates
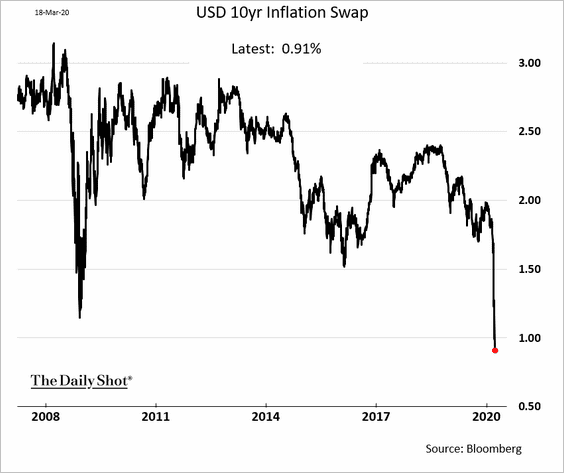
1. Inflation expectations are tumbling.
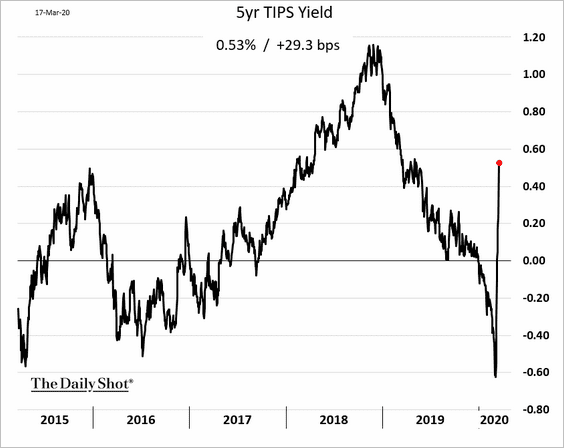
As a result, real rates are on the rise. Here is the 5yr TIPS (inflation-linked Treasury) yield.
——————–
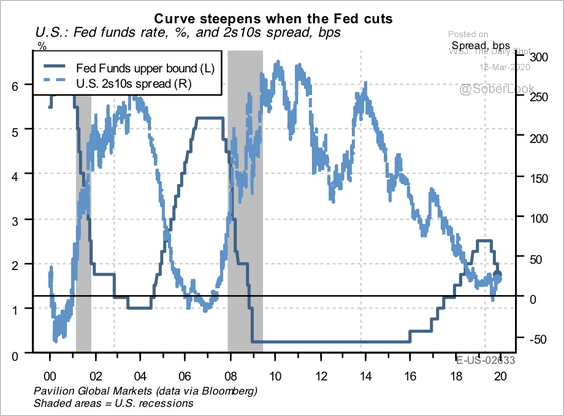
2. According to Pavilion Global Markets, previous aggressive easing cycles suggest that the near-zero Fed funds rate can be consistent with a sustained steepening of the yield curve. Ultimately, this dynamic could benefit bank net-interest margins.
 Source: Pavilion Global Markets
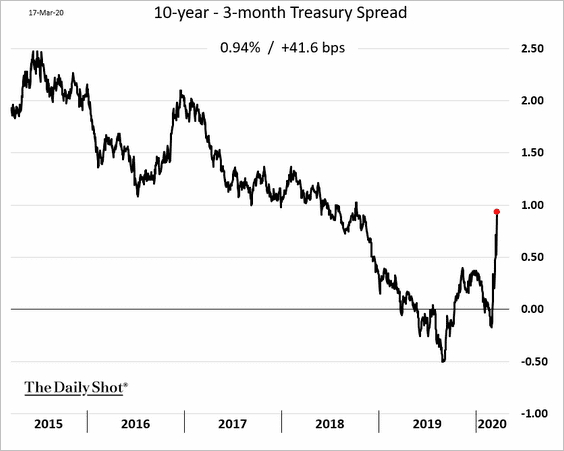
And the yield curve has indeed been steepening.
——————–
3. Here are Piper Sandler’s projected 10-year Treasury nominal rates for different levels of oil and gold prices.
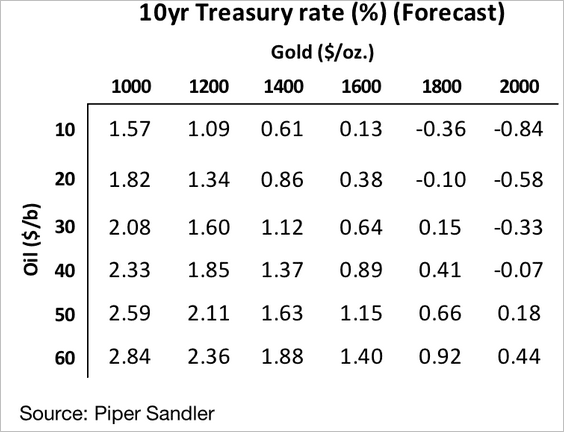 Source: Piper Sandler
4. Long-bond futures’ cheapest-to-deliver basis spreads (see overview) have blown out (driven by extreme volatility).
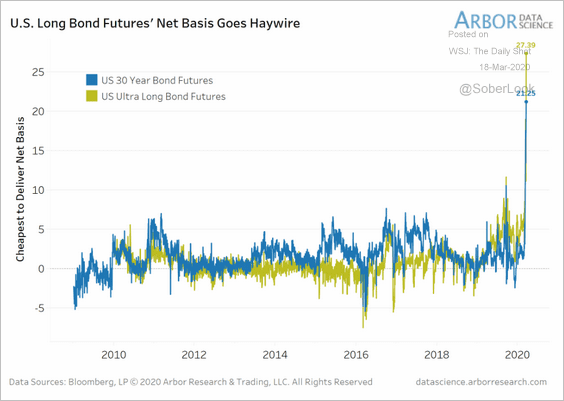 Source: Arbor Research & Trading
Global Developments
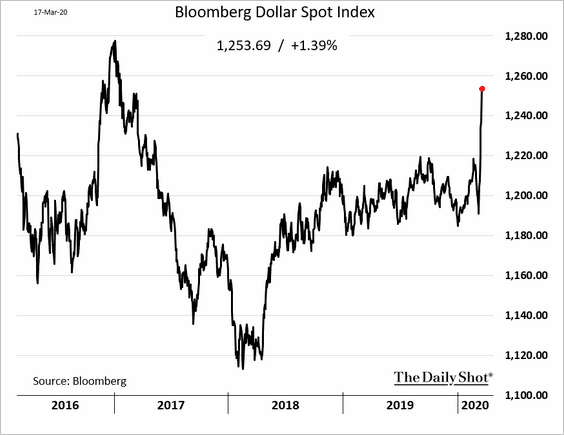
1. The US dollar keeps climbing.
2. Economists continue to downgrade their 2020 growth forecasts (this one is from Fitch Solutions).
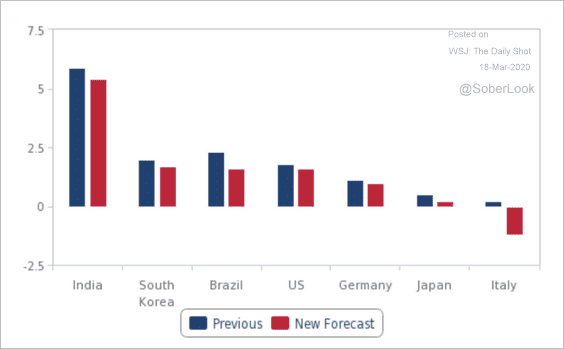 Source: Fitch Solutions Macro Research
3. Central bank easing is accelerating.
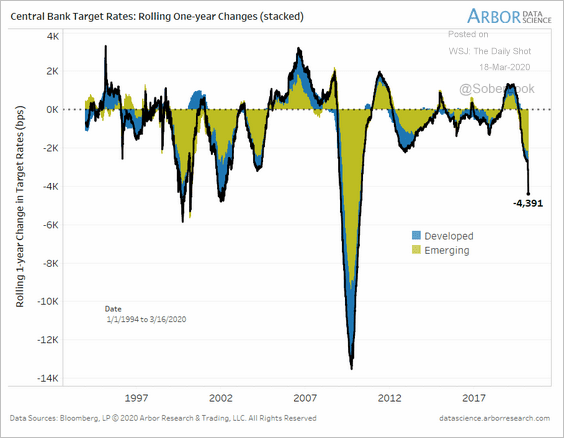 Source: Arbor Research & Trading
4. Here is the cumulative number of coronavirus-related deaths.
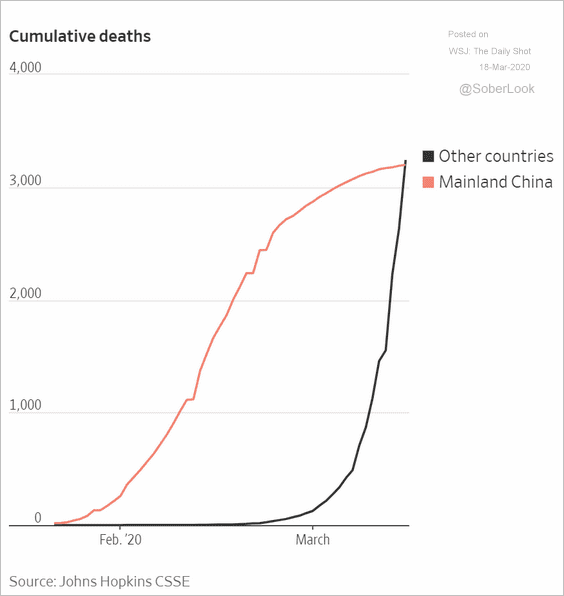 Source: @WSJ Read full article
5. Consumer discretionary spending is about a third of GDP for some countries.
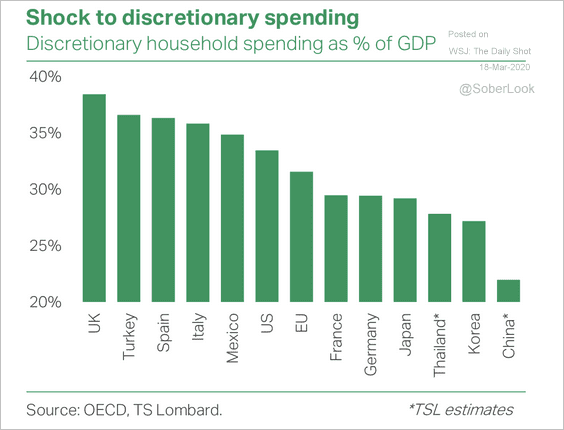 Source: TS Lombard
——————–
Food for Thought
1. Economic costs of air pollution:
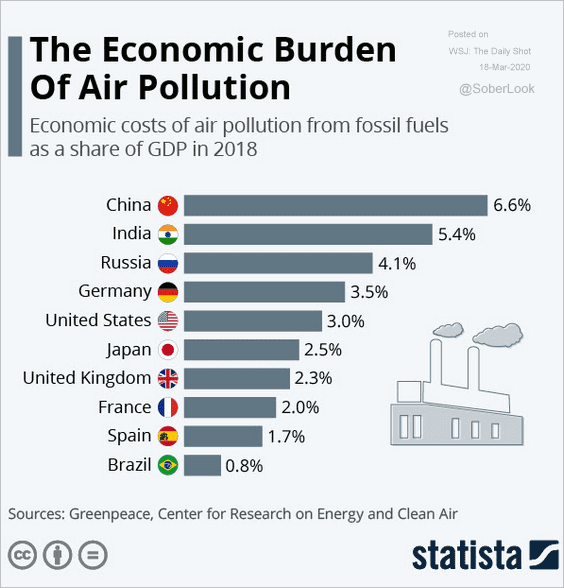 Source: Statista
2. Views on abortion laws:
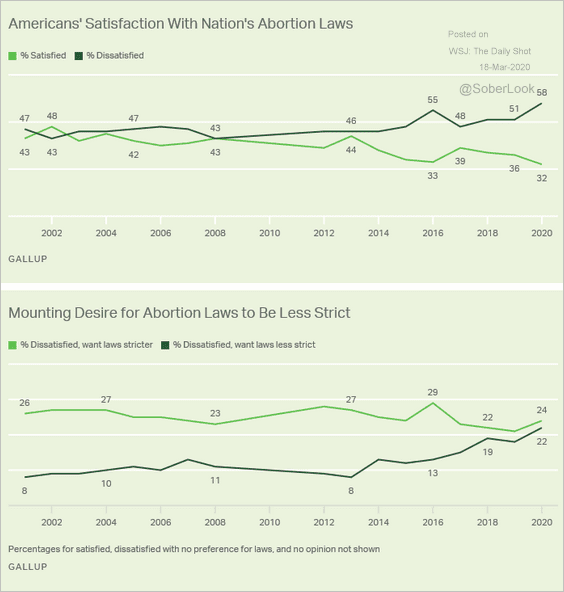 Source: Gallup Read full article
3. Biden-2020 vs. Clinton-2016 spending and tax proposals:
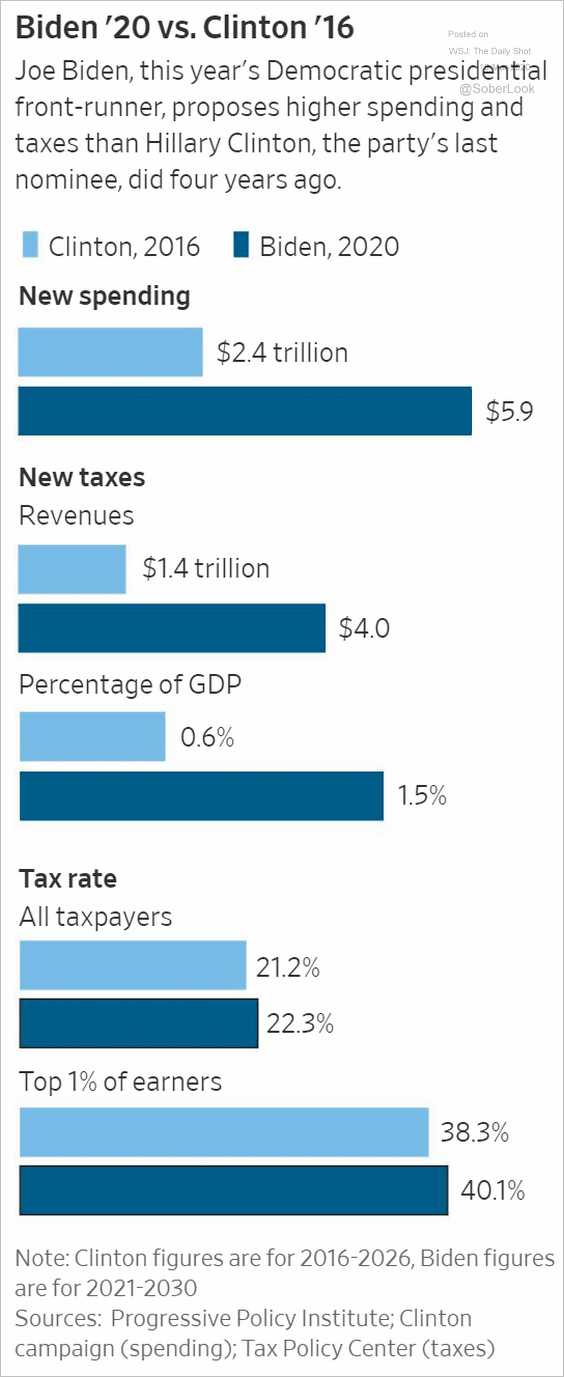 Source: @WSJ Read full article
4. Democratic nomination delegate count:
 Source: @WSJ Read full article
5. Job creation during different administrations:
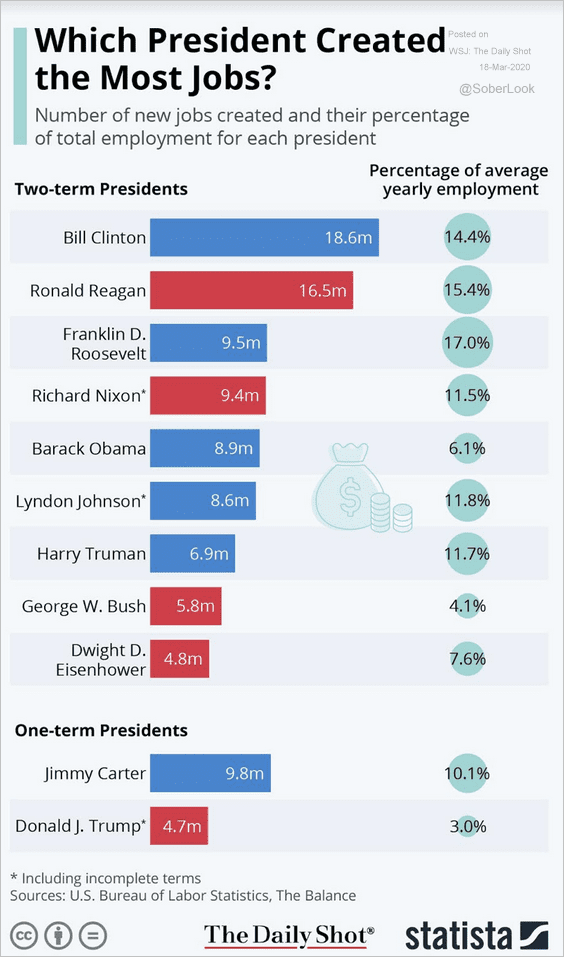 Source: Statista
6. Data on paid sick leave:
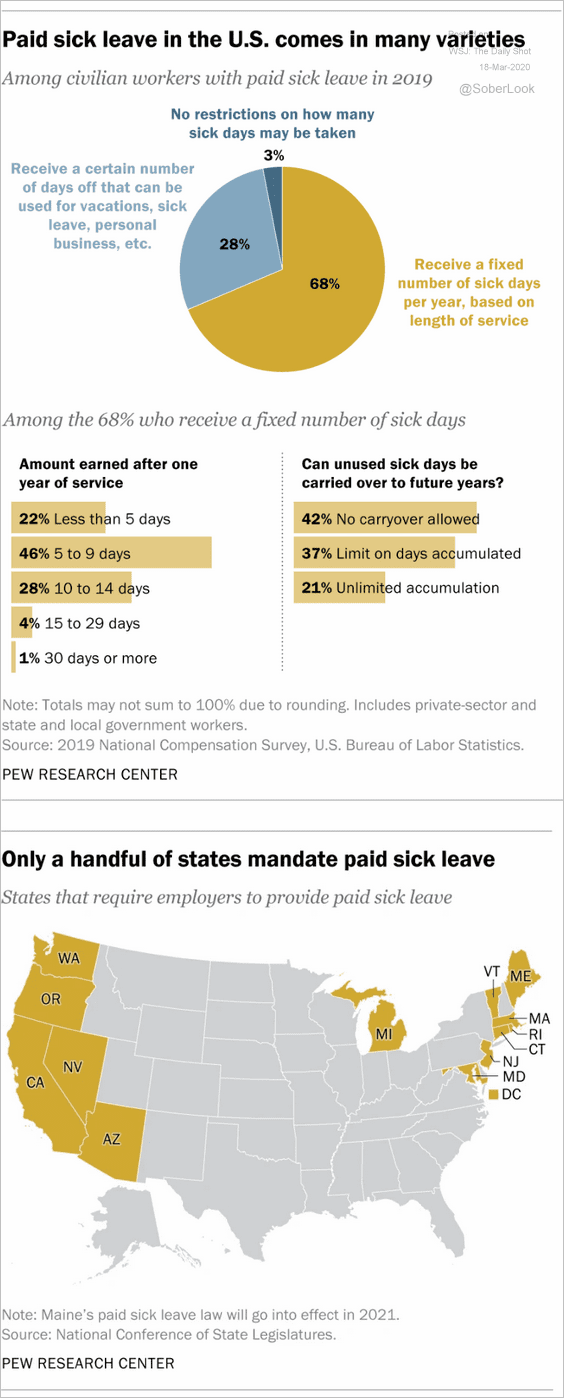 Source: Pew Research Center Read full article
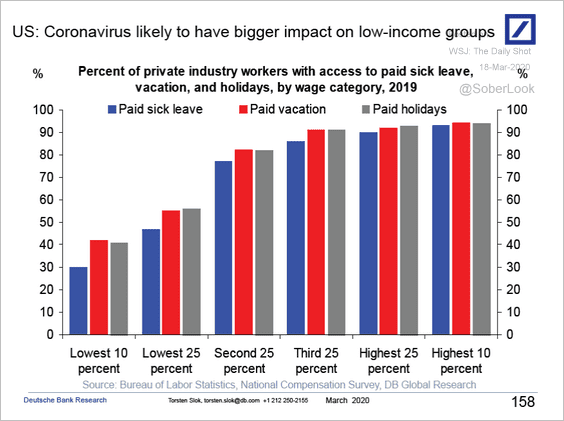 Source: Deutsche Bank Research
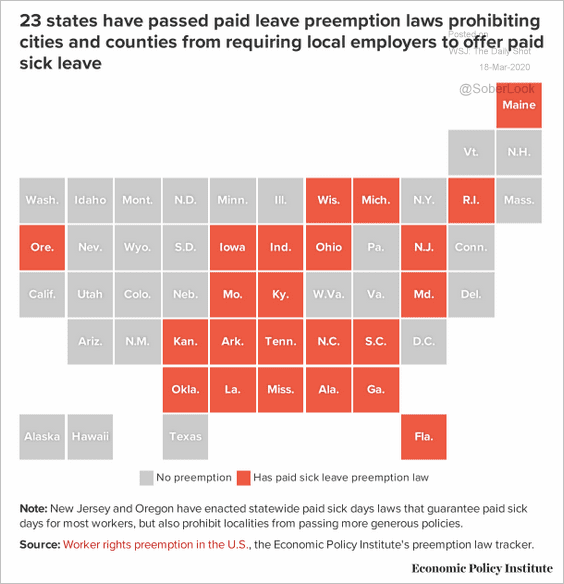 Source: Economic Policy Institute
——————–
7. Is the spread of coronavirus in the US underestimated?
 Source: Oxford Economics
8. Airline cash spending:
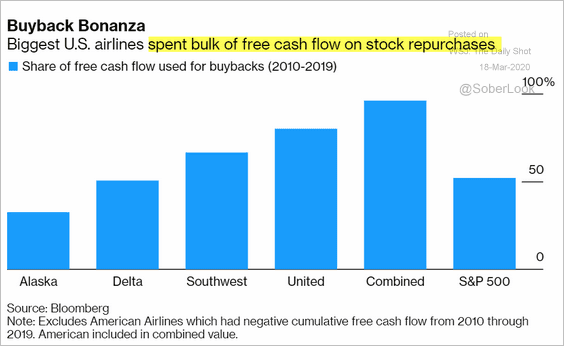 Source: @markets Read full article
 Source: The Hill Read full article
——————–
9. Visited a diner lately?
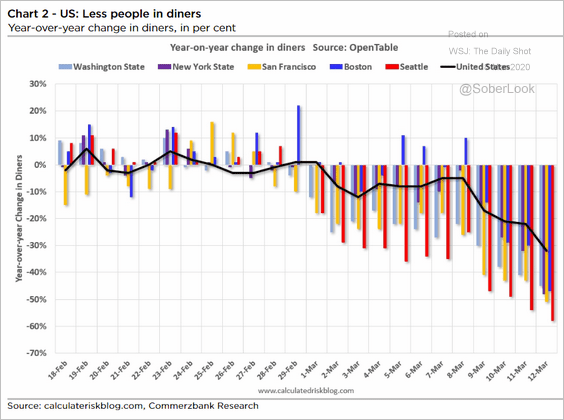 Source: Commerzbank Research
10. What’s considered “binge-watching”?
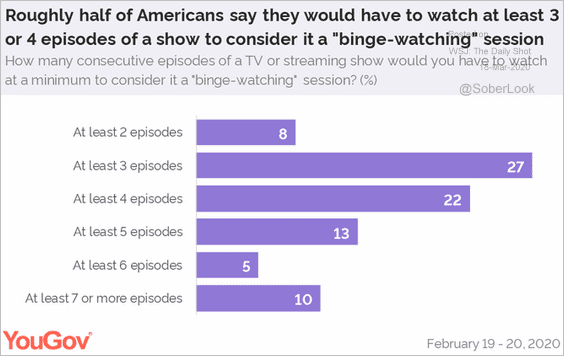 Source: @YouGovUS Read full article
——————–