
The Daily Shot: 02-Apr-20
• The United States
• The Eurozone
• Europe
• Asia – Pacific
• China
• Emerging Markets
• Commodities
• Energy
• Equities
• Credit
• Rates
• Food for Thought
The United States
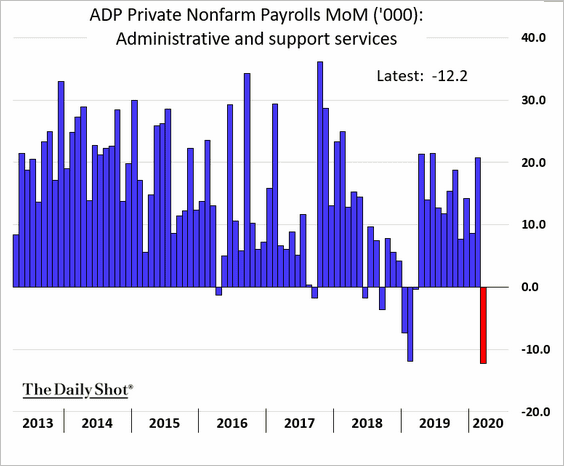
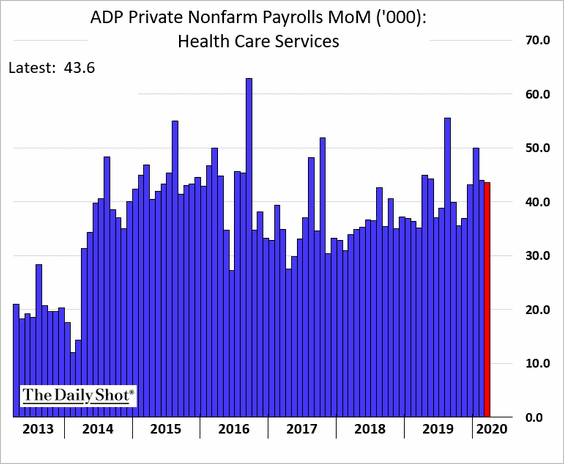
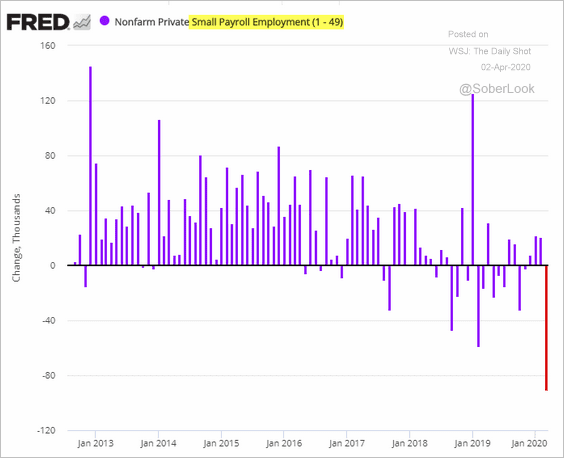
1. The March ADP private payrolls report topped economists’ forecasts, showing a loss of only 27 thousand jobs. However, the labor market has been unraveling so quickly that these figures are already stale.
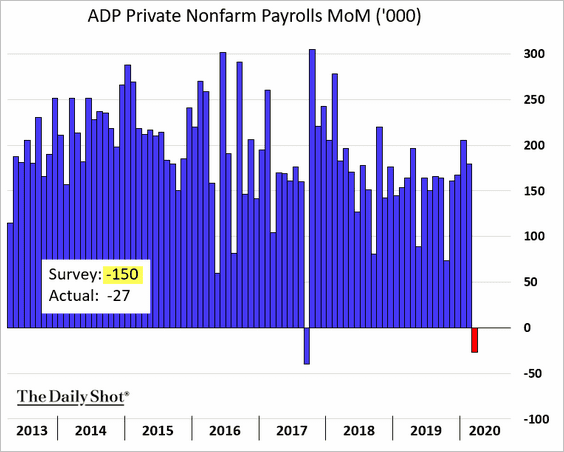
Below are select ADP components by sector.
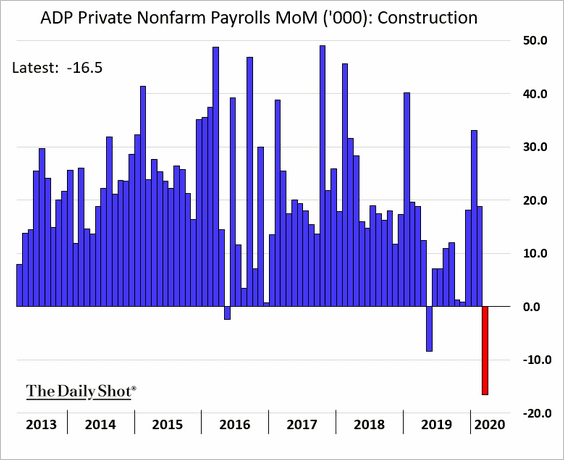
• Construction:
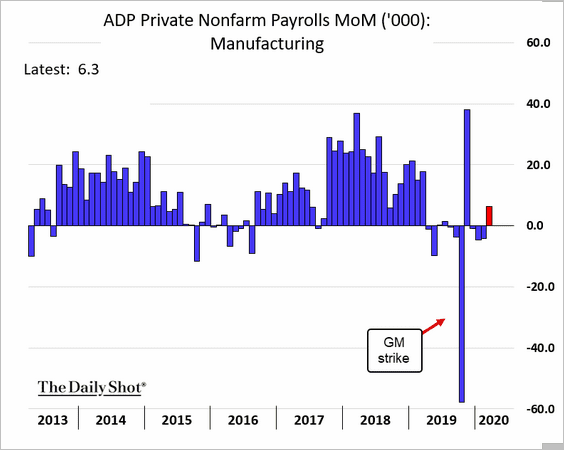
• Manufacturing:
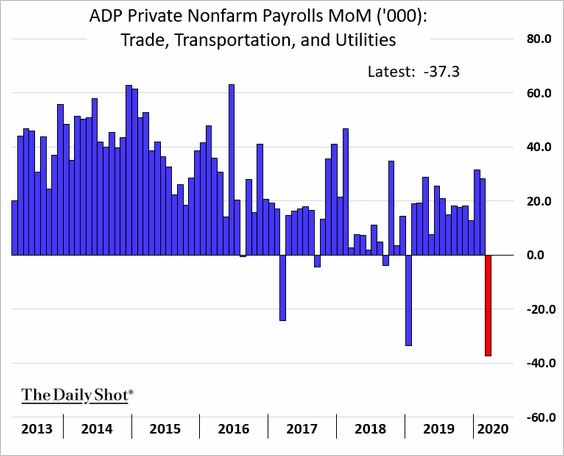
• Trade/transportation:
• Administrative services:
• Healthcare:
• Small businesses:
——————–
2. Many economists are predicting an even more severe rise in initial jobless claims than what we saw last week (the report is out 8:30 AM EST today). Below is an estimate from Desjardins.
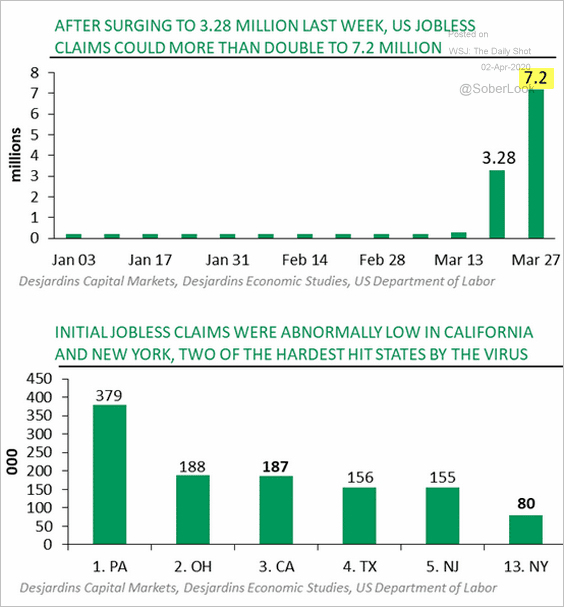 Source: Desjardins
And here is Morgan Stanley’s unemployment rate projection.
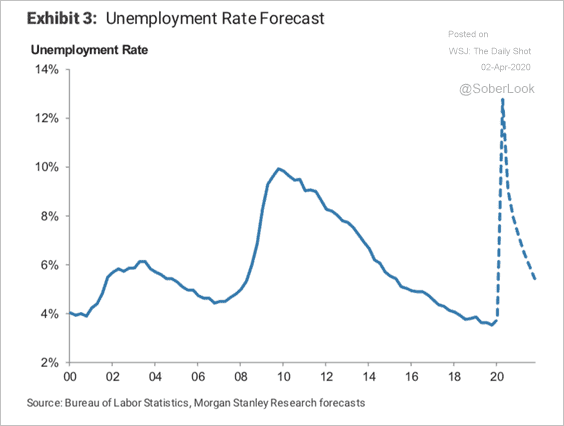 Source: Morgan Stanley Research
——————–
3. Retail traffic has ground to a halt.
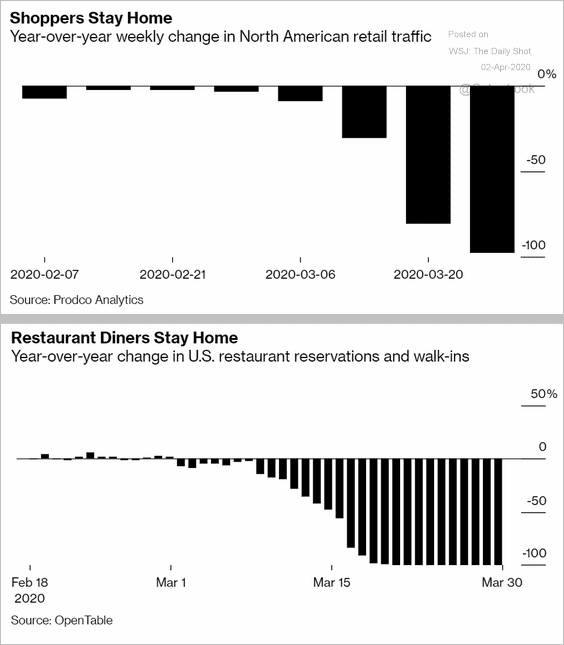 Source: @business Read full article
Over 60% of US consumers have cut back on spending.
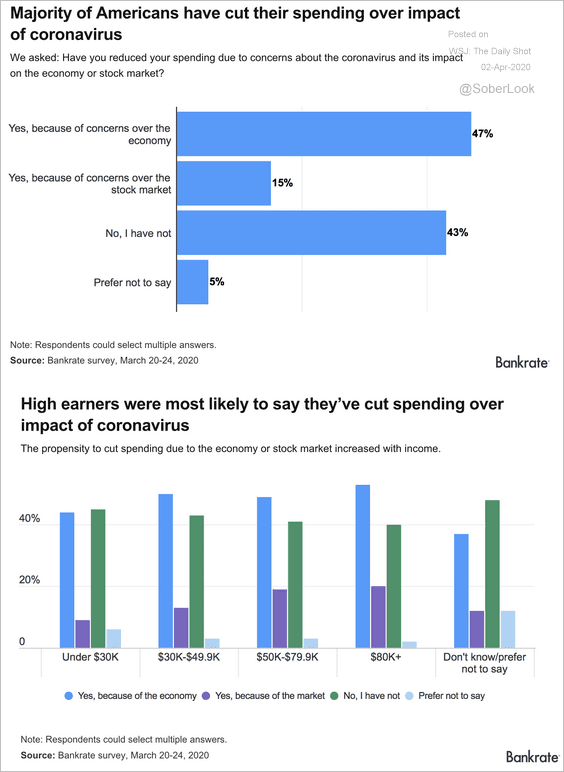 Source: Bankrate Read full article
——————–
4. Consumer sentiment continues to deteriorate.
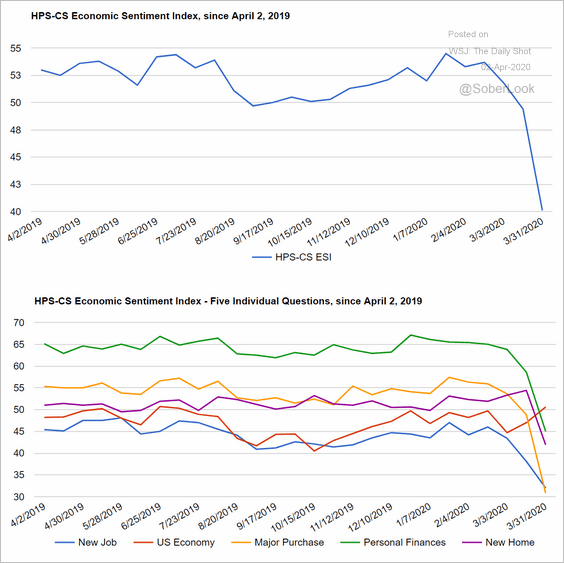 Source: @HPSInsight, @CivicScience
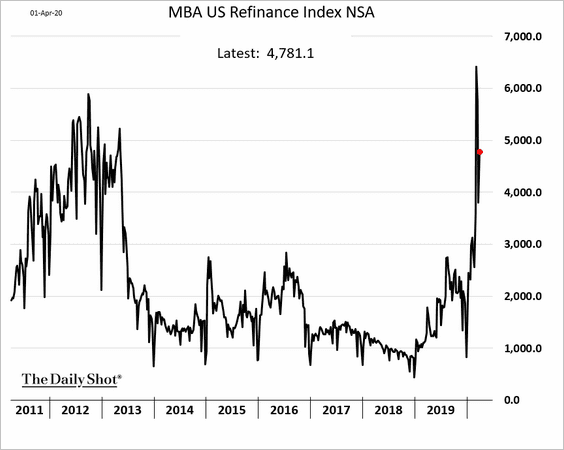
5. Mortgage applications to purchase a home dipped to 2013 levels.
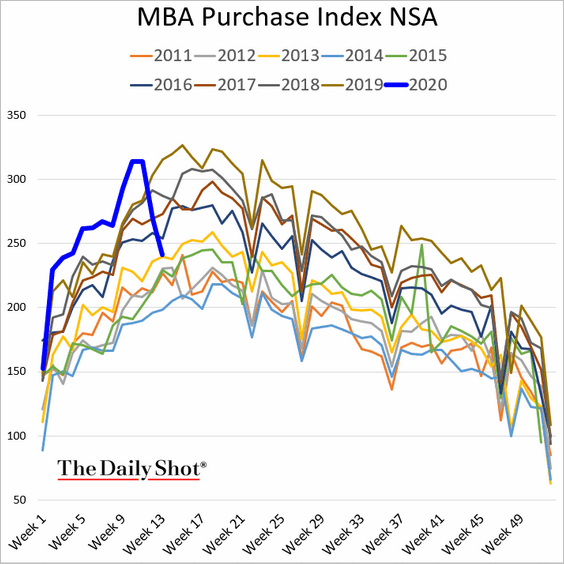
Refi applications rose.
——————–
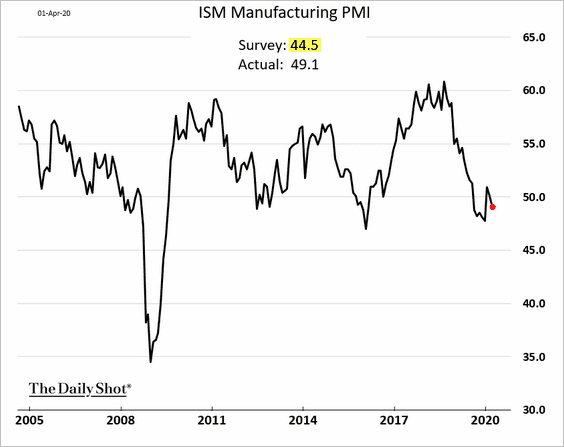
6. The ISM Manufacturing PMI surprised to the upside – economists expected a much larger decline.
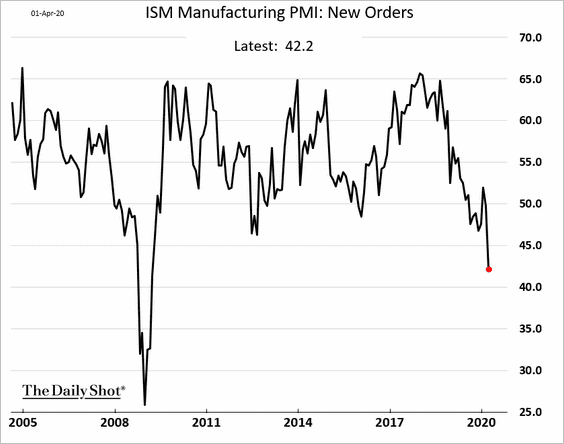
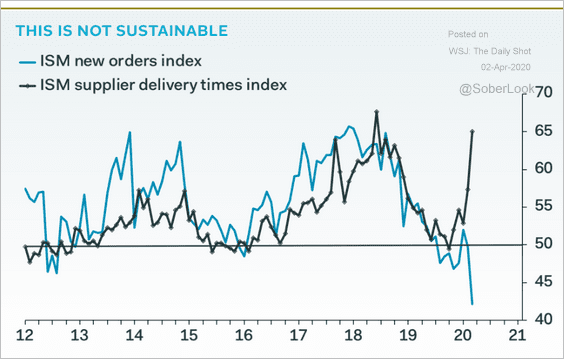
However, the index of new orders deteriorated sharply.
The headline ISM indicator was propped up by a sharp slowdown in supplier deliveries.
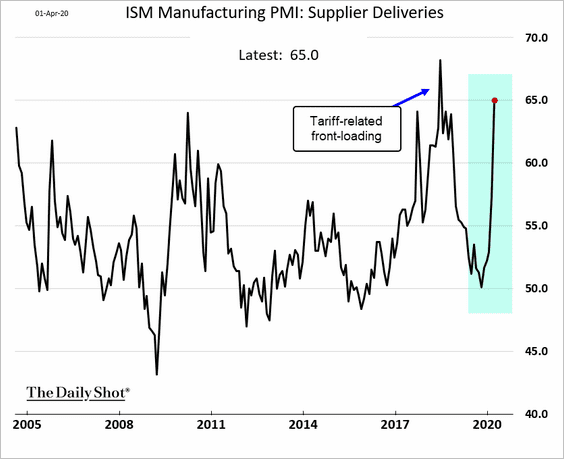
Typically, long supplier delivery times indicate rising demand (suppliers can’t keep up with orders). However, the March supply-chain disruptions were due to production stoppages in China, not increased orders.
 Source: Pantheon Macroeconomics
Hence, the ISM PMI measure understates the extent of the US manufacturing contraction.
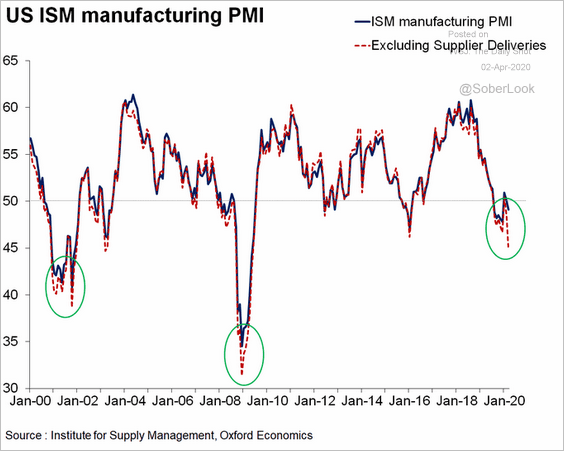 Source: @GregDaco, @OxfordEconomics, @ism
We saw a similar effect in the Chicago PMI report.
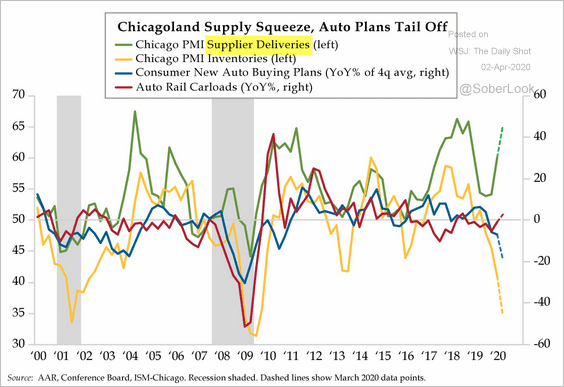 Source: The Daily Feather
——————–
• Treasury yields point to further weakness in the manufacturing sector.
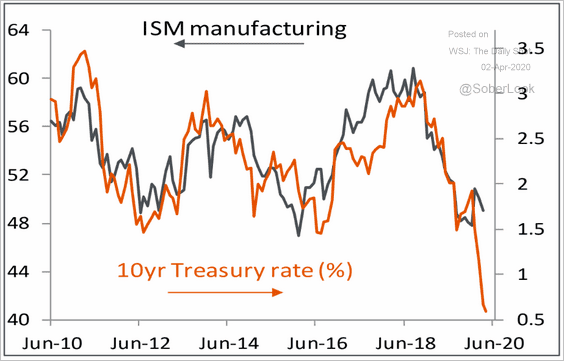 Source: Piper Sandler
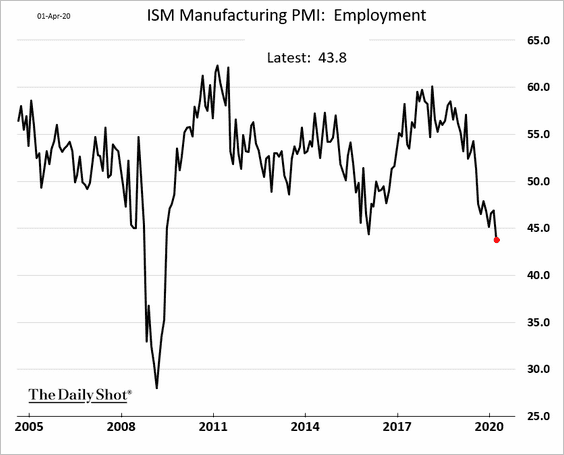
• Contrary to the ADP data (#1 above), manufacturing employment is deteriorating at the fastest pace since 2009.
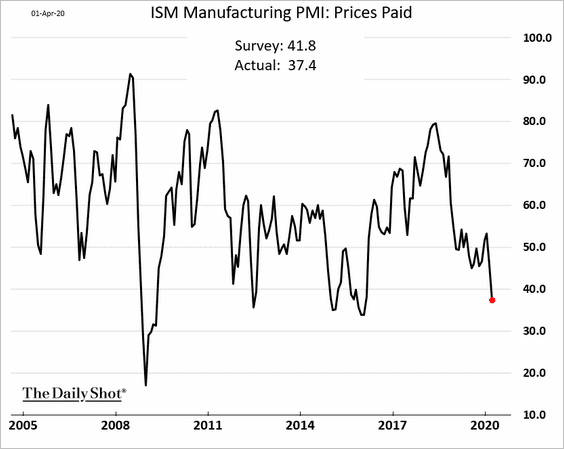
• The “prices paid” index looks deflationary.
——————–
7. Goldman Sachs downgraded the Q2 GDP growth forecast again.
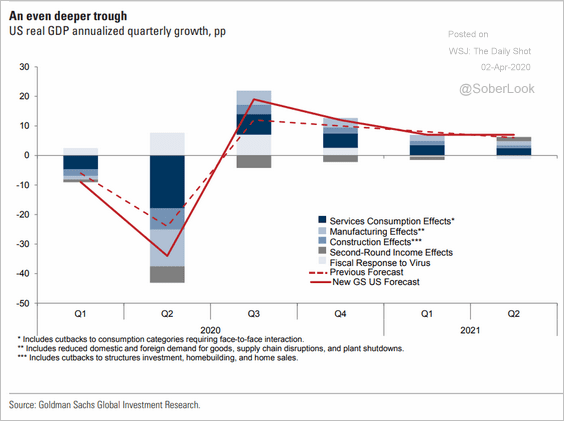 Source: Goldman Sachs
8. US Treasury deposits at the Fed hit the highest level since 2008. The government is ramping up cash balances ahead of the massive liquidity injection into the economy.
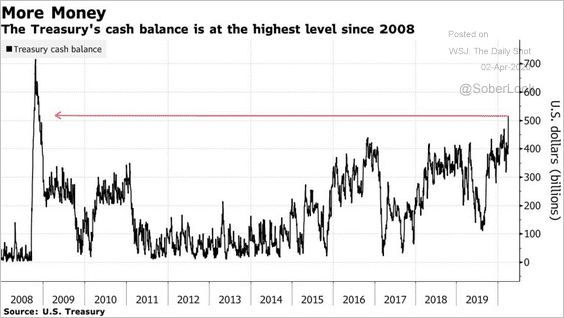 Source: @markets Read full article
The federal government’s debt-to-GDP ratio is expected to approach WW-II levels.
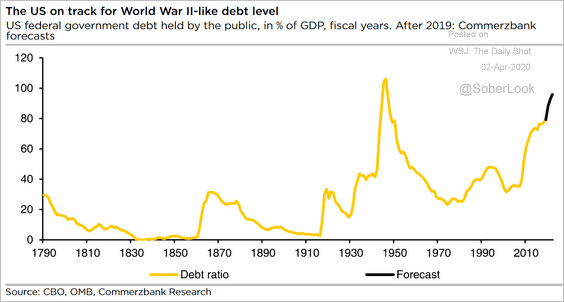 Source: Commerzbank Research
The Eurozone
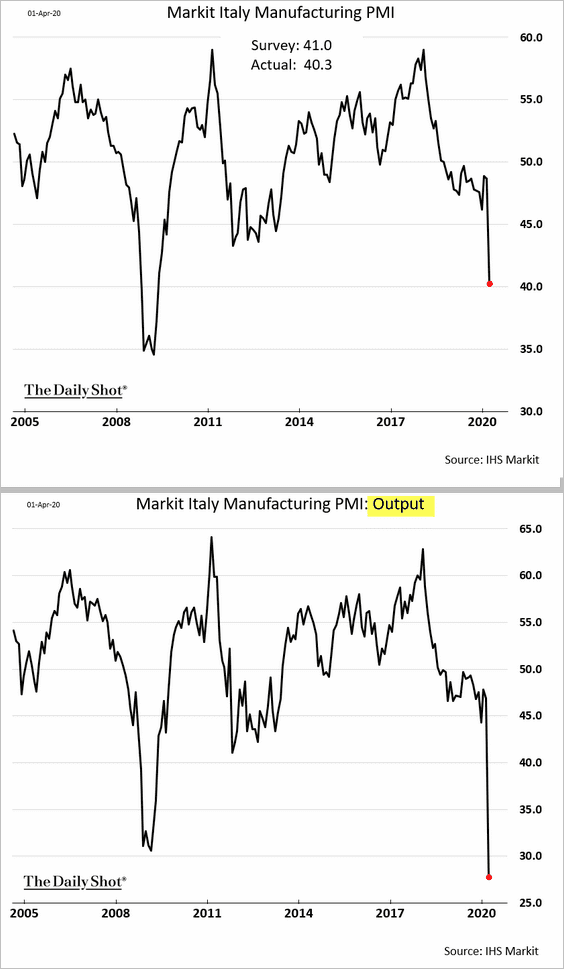
1. Italian manufacturing activity crumbled in March, as output declined at the fastest pace on record.
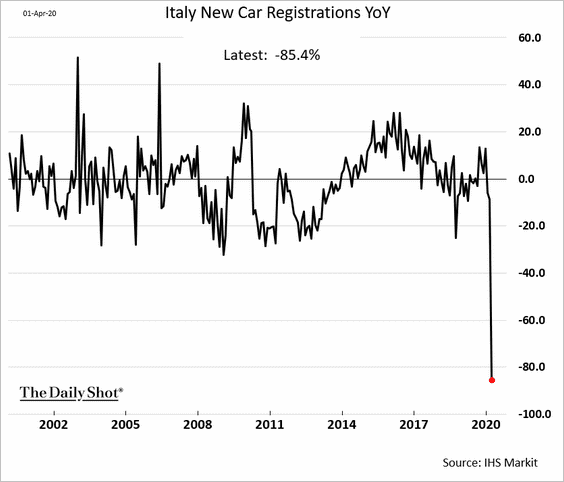
Separately, this chart shows the year-over-year change in new car registrations in Italy.
——————–
2. Here is the French output PMI vs. the official manufacturing production indicator.
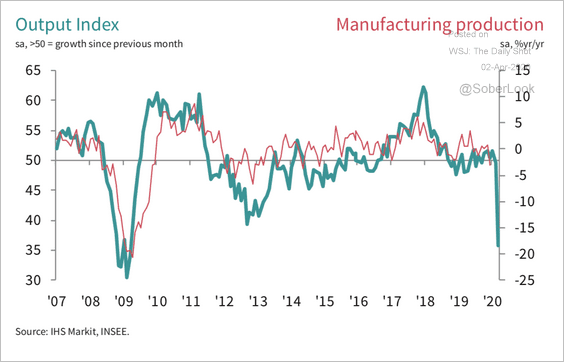 Source: IHS Markit Read full article
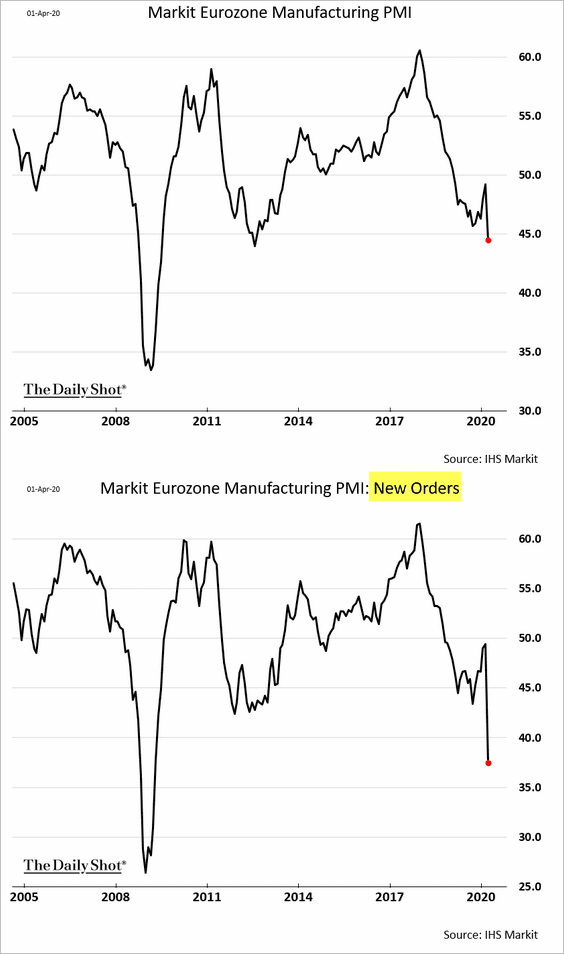
3. Below is the updated Markit Manufacturing PMI at the Eurozone level.
4. How much will the Eurozone’s unemployment rate rise over the coming months?
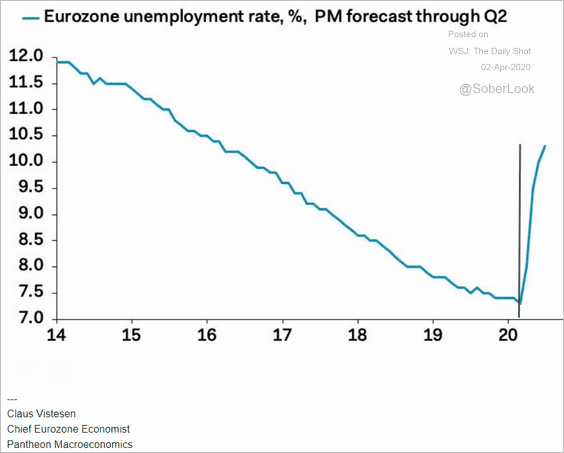 Source: Pantheon Macroeconomics
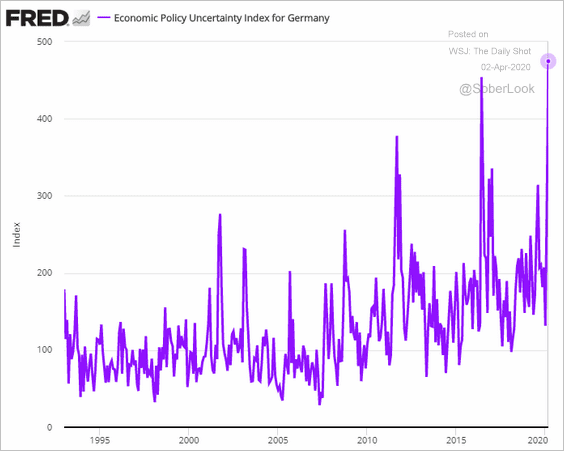
5. The Economic Policy Uncertainty Index for Germany hit a record high.
Europe
1. The UK manufacturing PMI appeared to be stable in March.
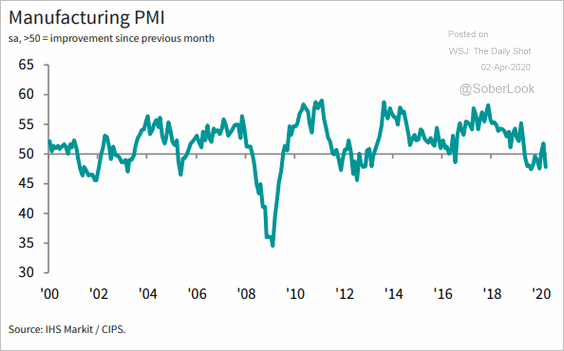 Source: IHS Markit
However, the survey data that came in after March 20th paints a very different picture.
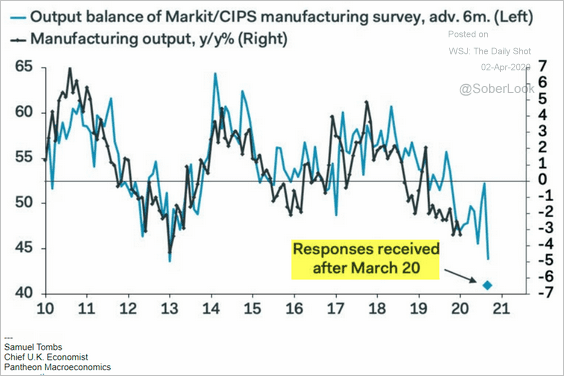 Source: Pantheon Macroeconomics
——————–
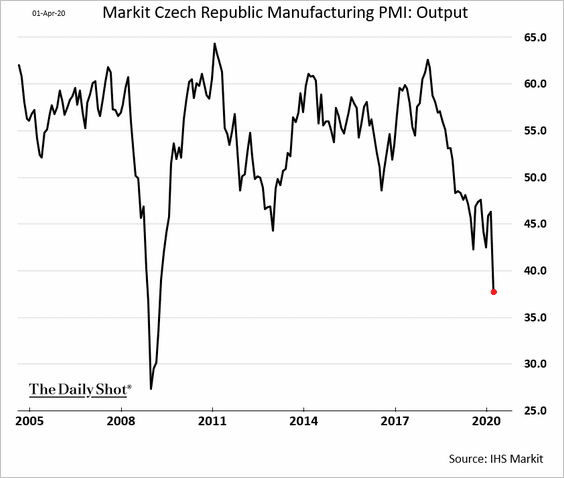
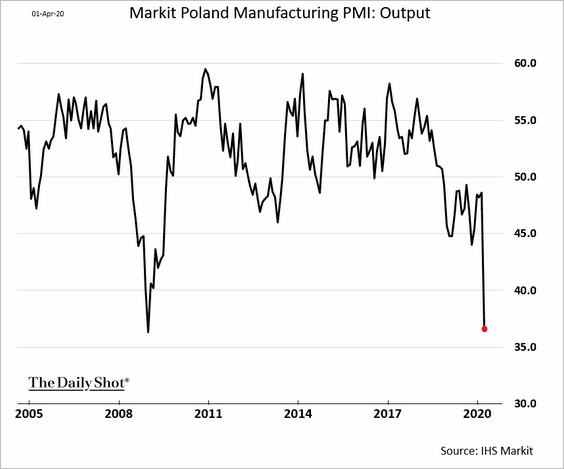
2. Central European economies are in trouble as factory output crashes.
• The Czech Republic:
• Poland:
——————–
3. Many European companies are stopping dividends, which have been the driver of equity returns over the past decade.
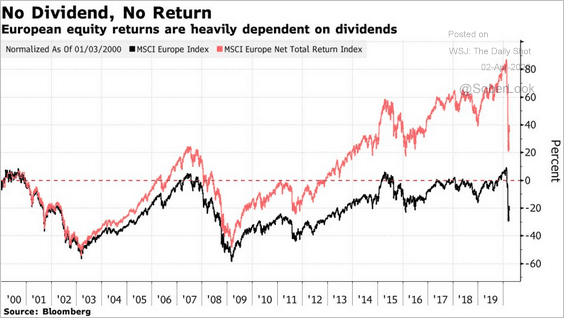 Source: @markets Read full article
4. Next, we have some data on self-employment and new business ownership among young people.
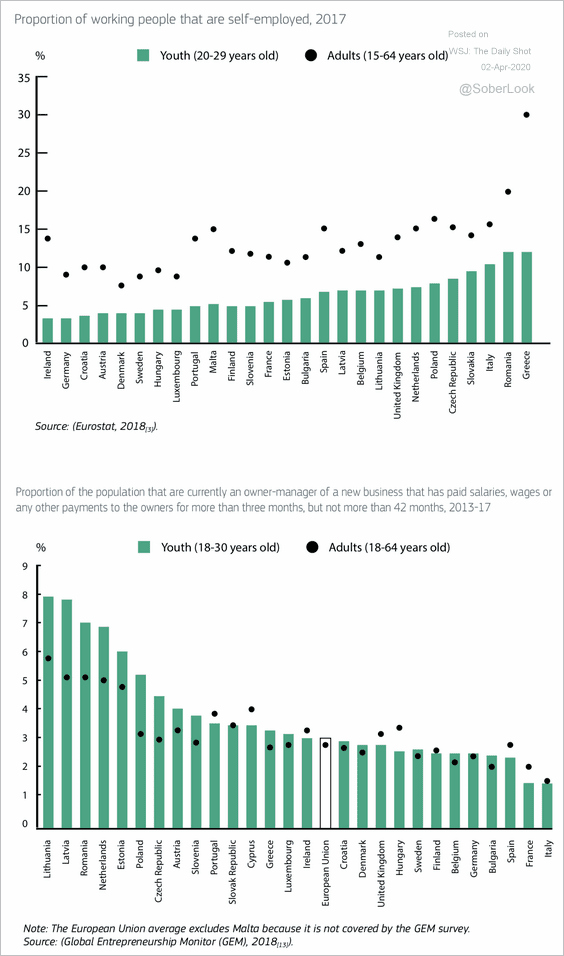 Source: OECD Read full article
Asia – Pacific
1. The Bank of Japan was the first of the major central banks to start buying corporate bonds and now owns a substantial portion of Japanese investment-grade nonfinancial debt. Credit spreads tightened modestly over the life of that program, according to BCA Research.
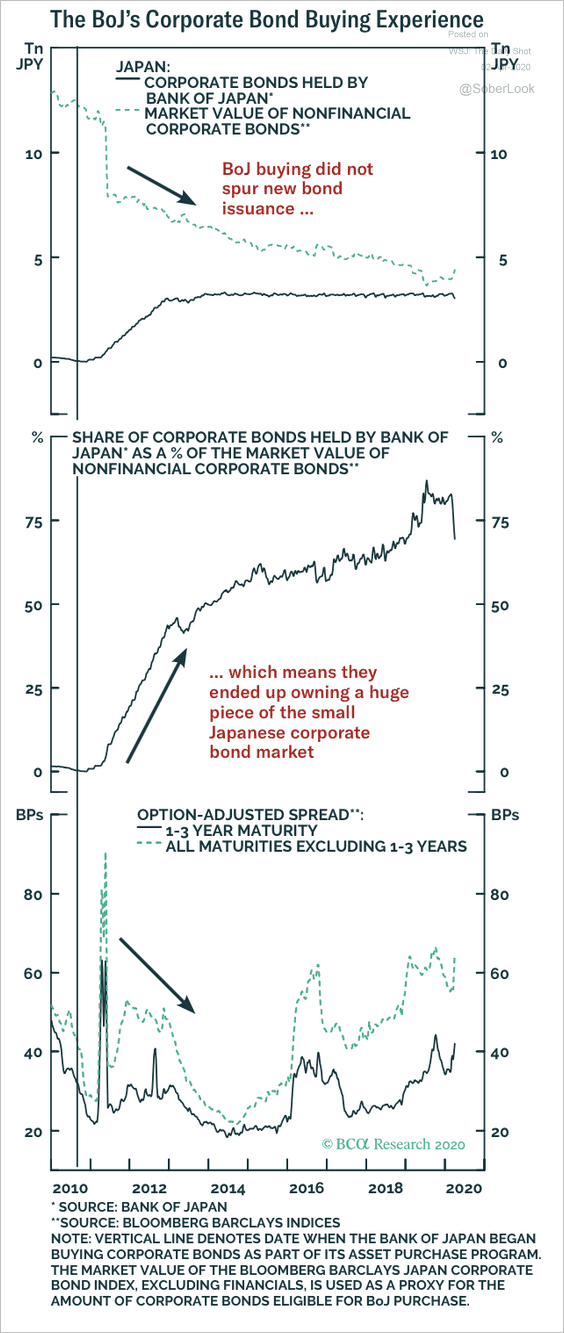 Source: BCA Research
2. March was the most volatile month for Japanese government bonds (JGBs) since the early days of quantitative easing launched in April 2013, according to Tradeweb.
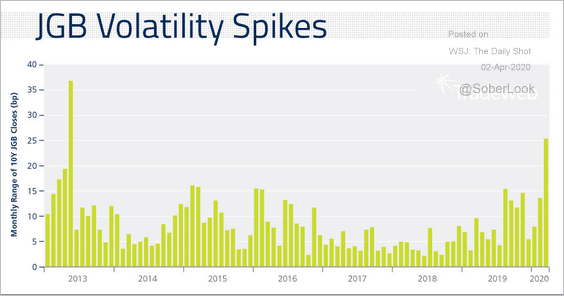 Source: @Tradeweb
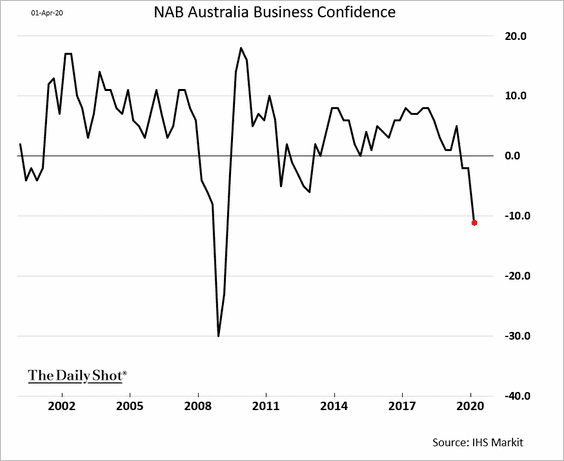
3. Australia’s business confidence has deteriorated in the first quarter.
China
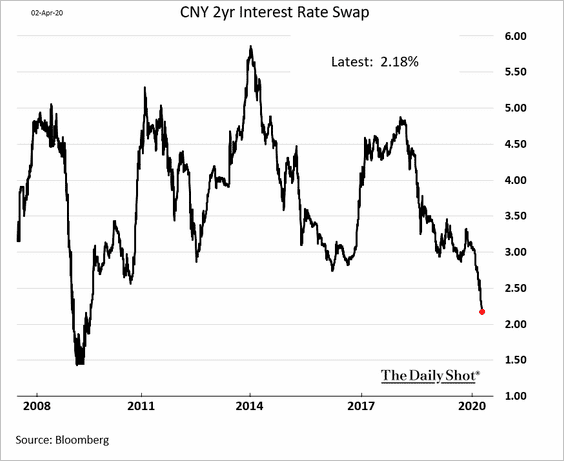
1. Short-term swap rates continue to decline as the market prices in further rate cuts by the PBoC.
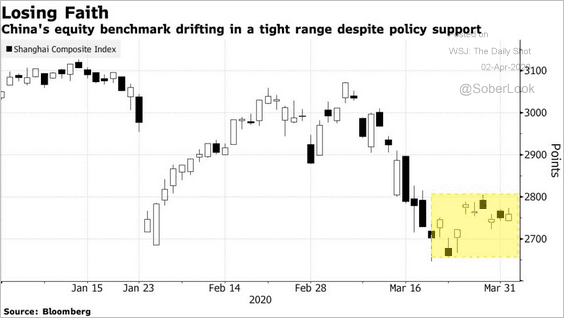
2. Stocks have been range-bound.
 Source: @markets Read full article
3. Economic activity metrics continue to recover.
• Coal consumption:
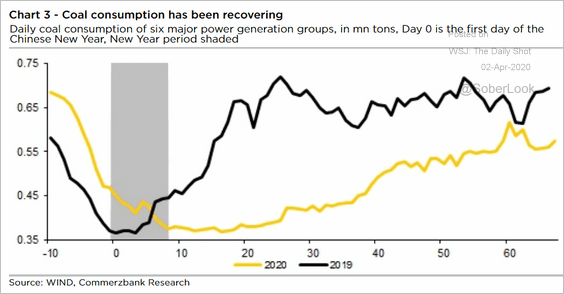 Source: Commerzbank Research
• Subway ridership:
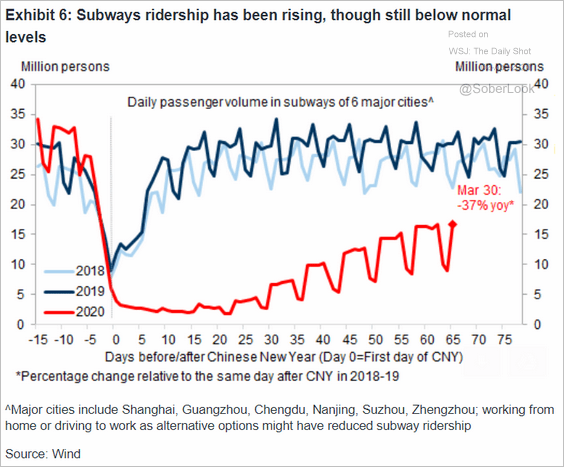 Source: Goldman Sachs
• Home sales:
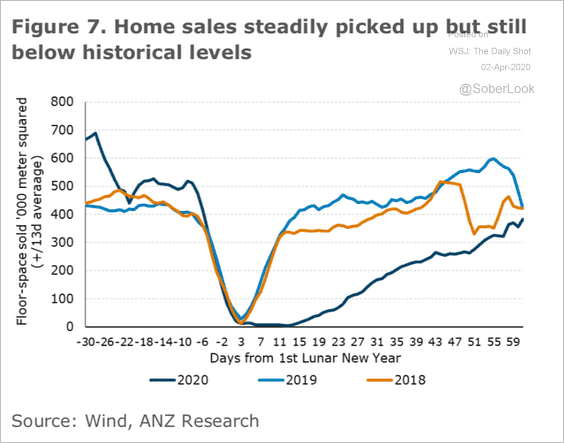 Source: ANZ Research
Emerging Markets
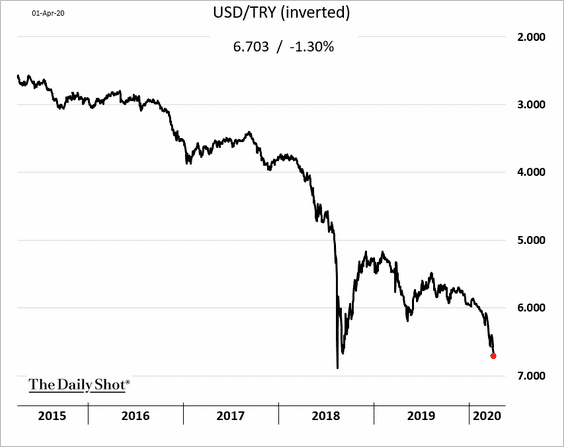
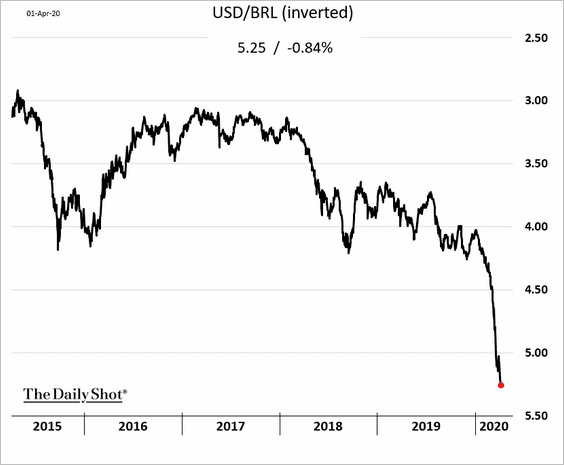
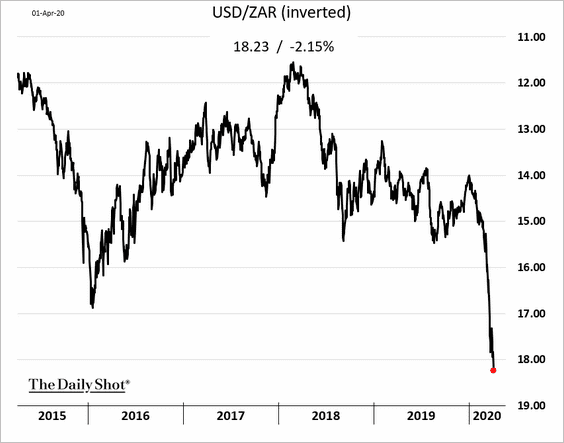
1. Some key EM currencies remain under pressure.
• The Turkish lira:
• The Brazilian real:
• The South African rand:
——————–
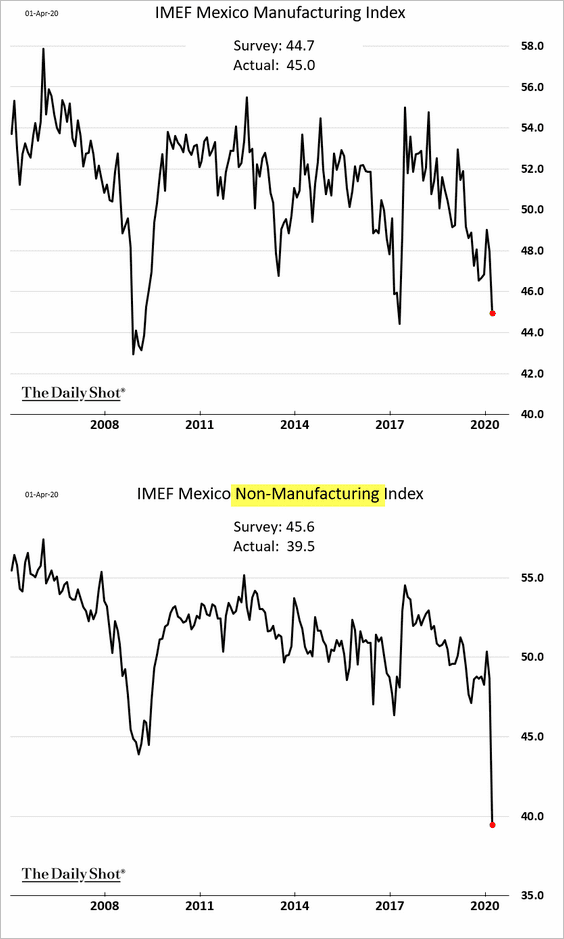
2. Mexican business activity has deteriorated sharply, with service-sector firms hit particularly hard.
Producer confidence has been eroding.
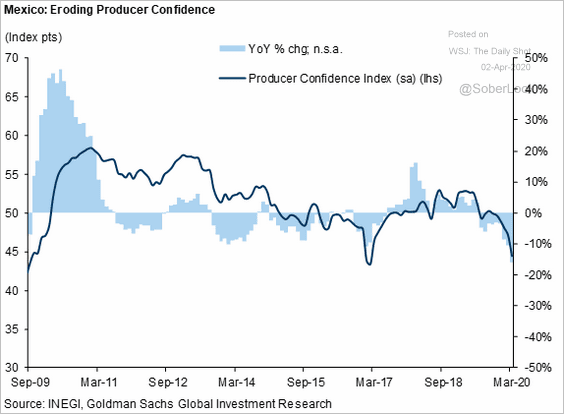 Source: Goldman Sachs
——————–
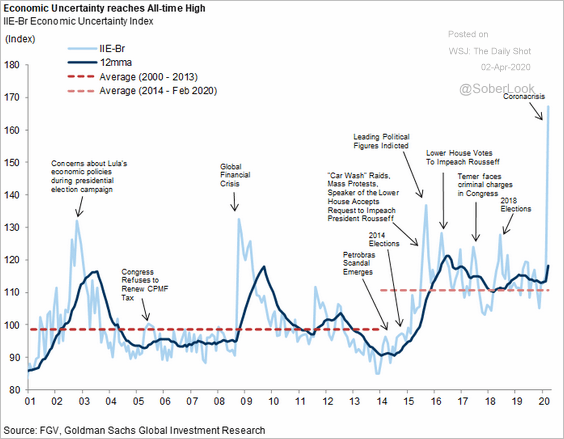
3. Brazil’s manufacturing activity is in contraction mode but is not collapsing yet.
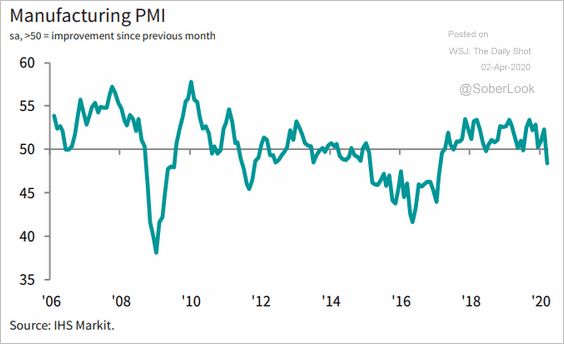 Source: IHS Markit Read full article
Here is Brazil’s economic uncertainty index.
 Source: Goldman Sachs
——————–
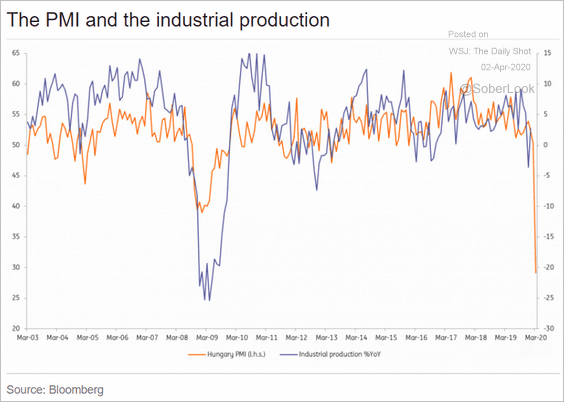
4. Hungary’s manufacturing PMI hit a record low.
 Source: ING
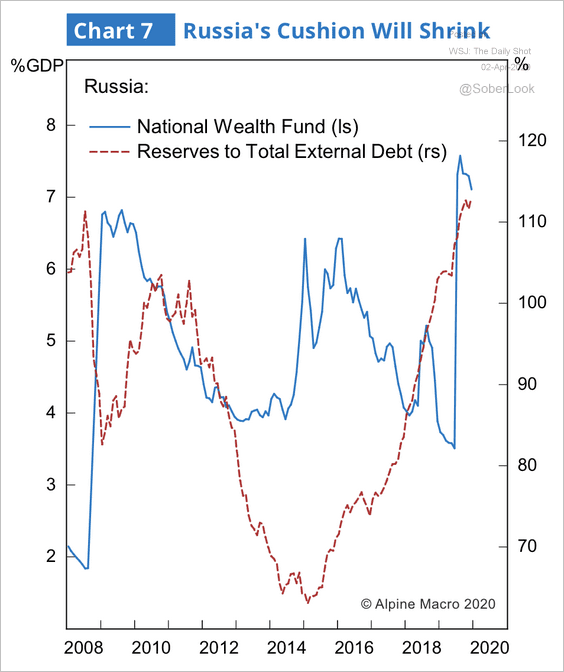
5. The fall in oil prices could drain Russia’s rising foreign exchange reserves and the national wealth fund.
 Source: Alpine Macro
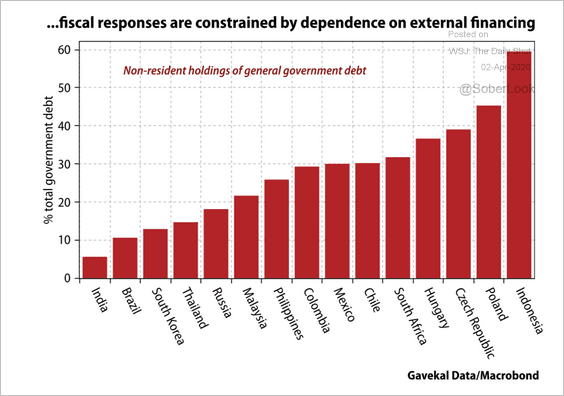
6. Which countries depend most on foreign investors for government debt financing?
 Source: Gavekal
7. EM household debt (as % of GDP) has been climbing steadily.
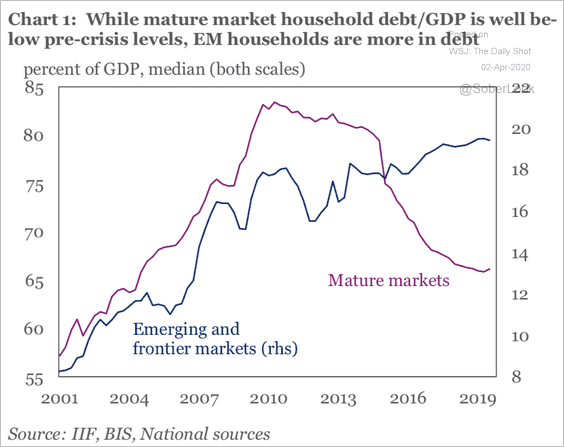 Source: IIF
Commodities
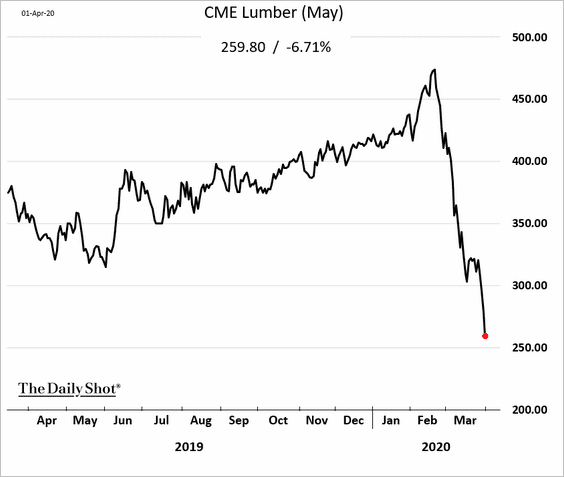
1. Lumber futures are signaling deterioration in US residential construction.
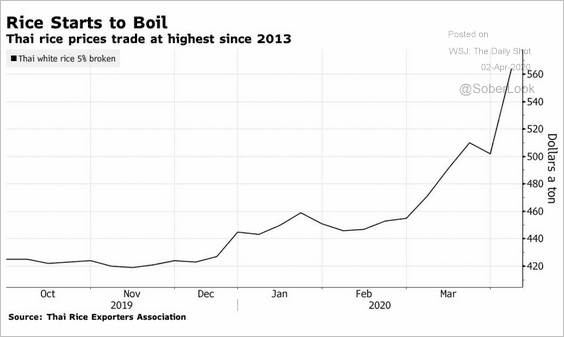
2. As countries and households hoard grains, will some parts of the world face food shortages?
 Source: @markets Read full article
Energy
1. China started buying crude oil for its strategic reserves (at rock-bottom prices).
 Source: @business Read full article
The news sent crude oil futures higher (the $20/bbl support held).
 Source: barchart.com
——————–
2. Producers are bidding up storage in response to a widening futures market contango, according to Alpine Macro. Will we see a similar pattern to 2014-2016?
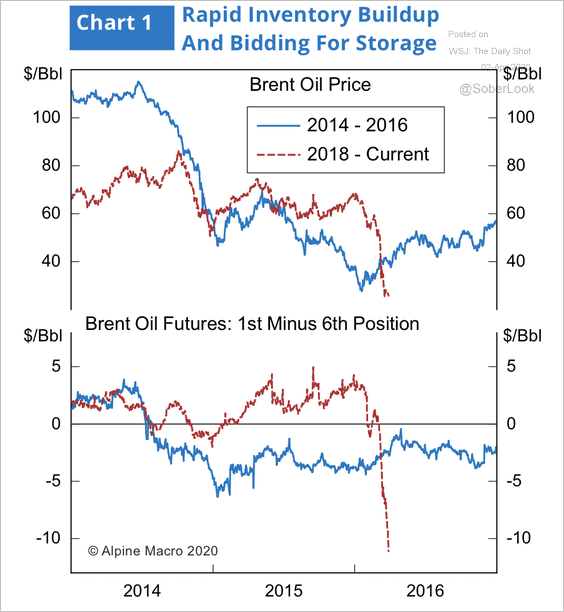 Source: Alpine Macro
3. US refineries have sharply cut back gasoline output as demand collapses and inventories spike.
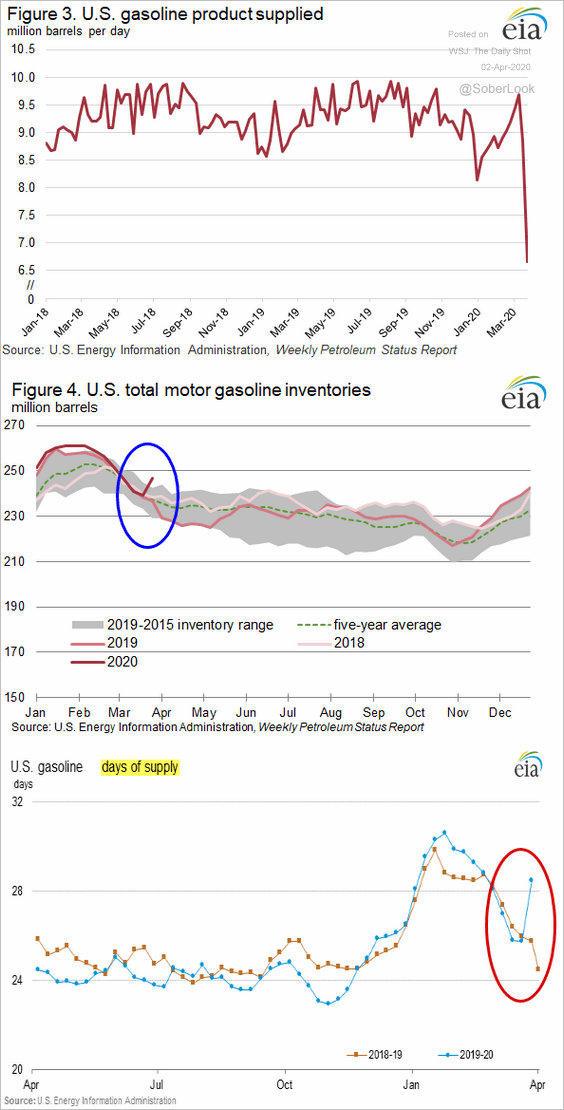 Source: EIA Read full article
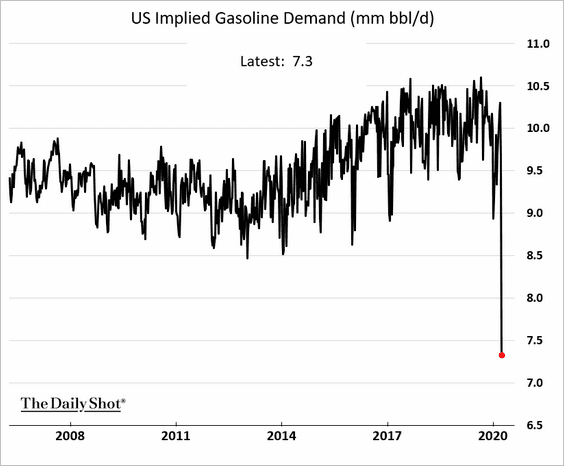
The decline in gasoline demand has been unprecedented.
——————–
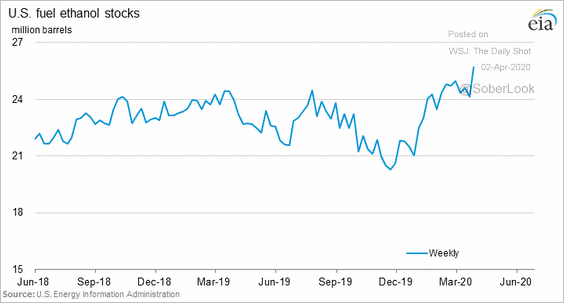
4. US ethanol inventories keep climbing.
Equities
1. Stocks started the quarter on a weak note.
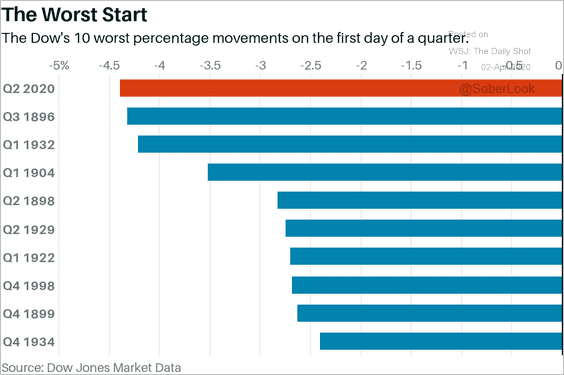 Source: @barronsonline
2. The recent updates to EPS projections paint a grim picture of earnings growth globally.
 Source: @LizAnnSonders, @SocieteGenerale
Here is Goldman’s estimate for earnings-per-share (EPS) and dividends-per-share (DPS).
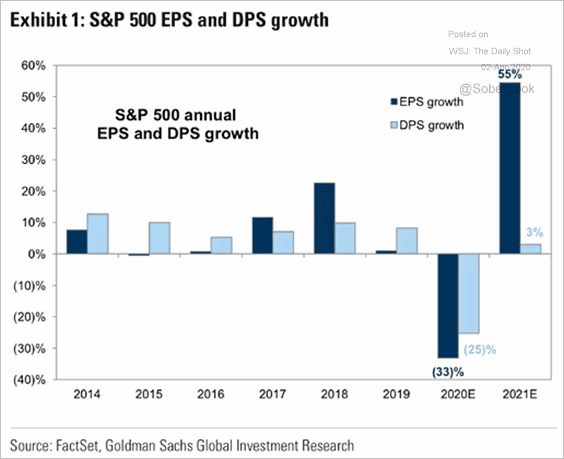 Source: @ISABELNET_SA, @GoldmanSachs
——————–
3. High-dividend shares have been underperforming.
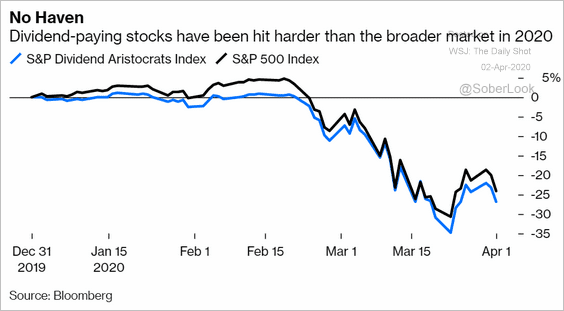 Source: @BobOnMarkets, @bopinion Read full article
4. Active managers who outperform the benchmark over three years rarely outperform in the subsequent period.
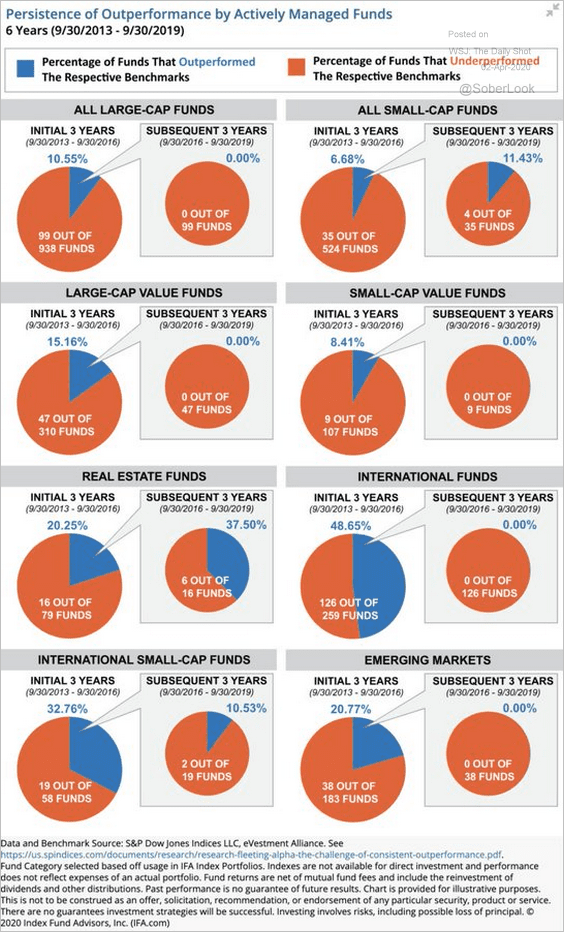 Source: IFA.com, @aguirrepujol
5. The average endowment could see a reversal of almost one full year of returns.
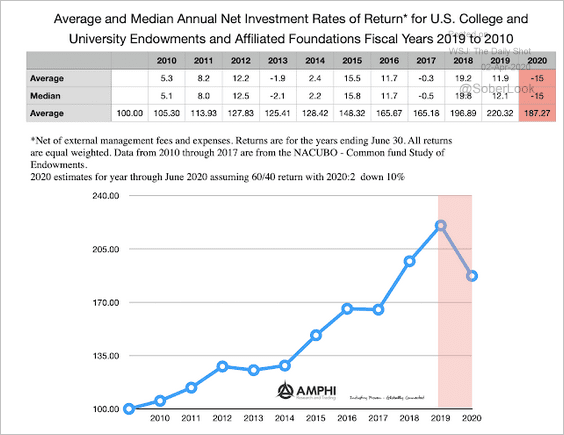 Source: AMPHI Research & Trading Read full article
Credit
1. Implied default rates have risen above 2008 levels for multiple sectors.
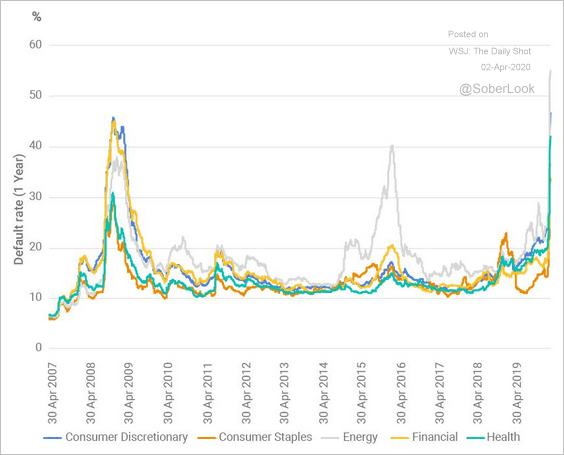 Source: MSCI Read full article
The volatility of implied default rates surged as the epidemic worsened, indicating greater market uncertainty.
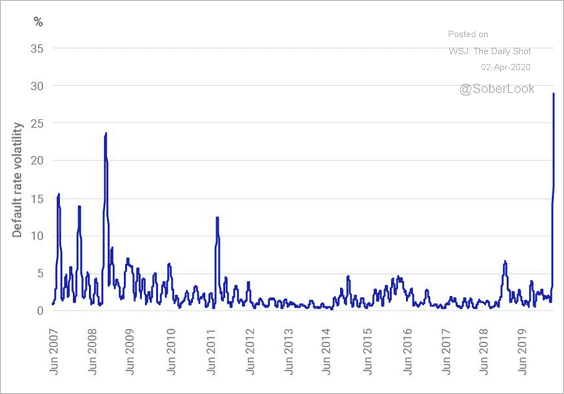 Source: MSCI Read full article
——————–
2. This chart depicts the average probability of default as well as recent trends in credit quality across major industries.
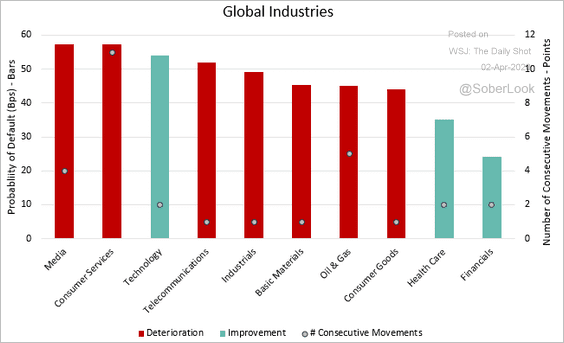 Source: Credit Benchmark Read full article
3. Russell 2,000 small-cap firms have seen their leverage ratios expand in this cycle.
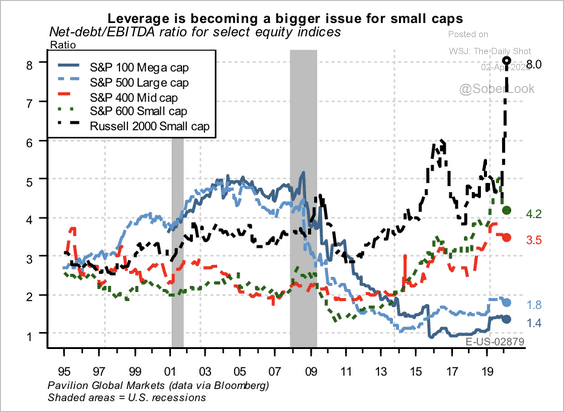 Source: Pavilion Global Markets
4. Moody’s expects states’ special tax revenue (see overview) to weaken as coronavirus slows economic growth and travel. Here are the 15 states that make up 75% of Moody’s special tax ratings.
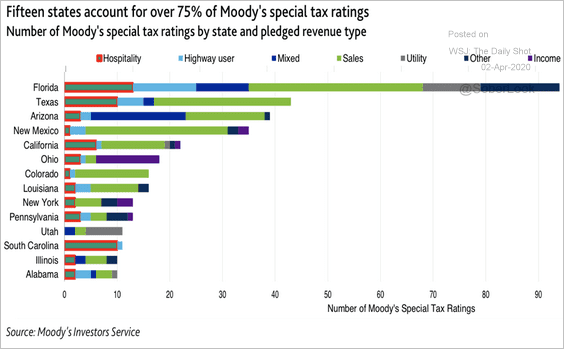 Source: Moody’s Investors Service
Rates
1. Treasuries held in custody at the Fed declined sharply as foreign institutions sold US debt to raise dollars for domestic needs. That’s why the Fed launched the repo facility (#2 here) with other central banks which will allow them to raise dollars by pledging Treasury holdings as collateral.
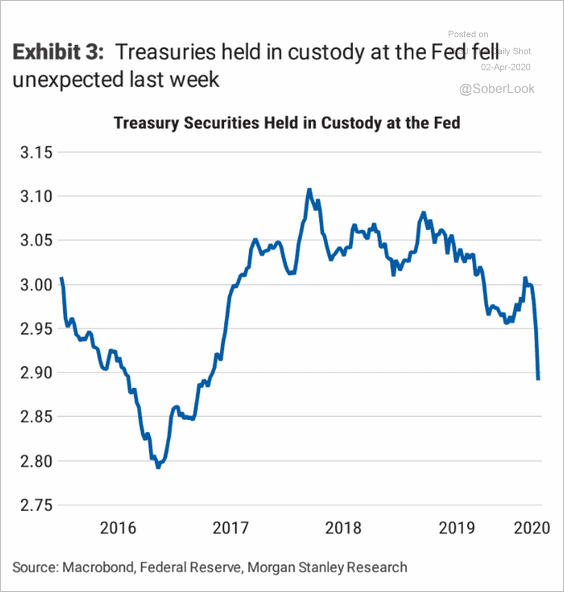 Source: Morgan Stanley Research
2. Bets against Treasuries fell to multi-year lows.
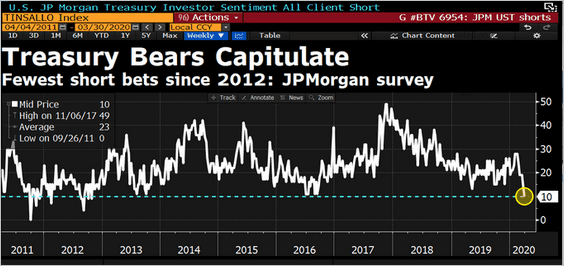 Source: @lisaabramowicz1, @daniburgz, @BloombergTV
3. The US 30yr mortgage rate has decoupled from the 10yr Treasury yield.
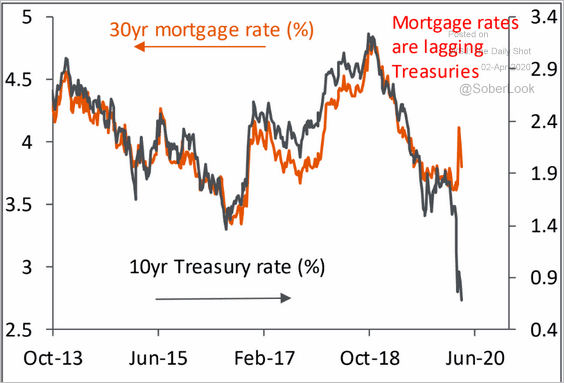 Source: Piper Sandler
——————–
Food for Thought
1. Venture capital financing by region:
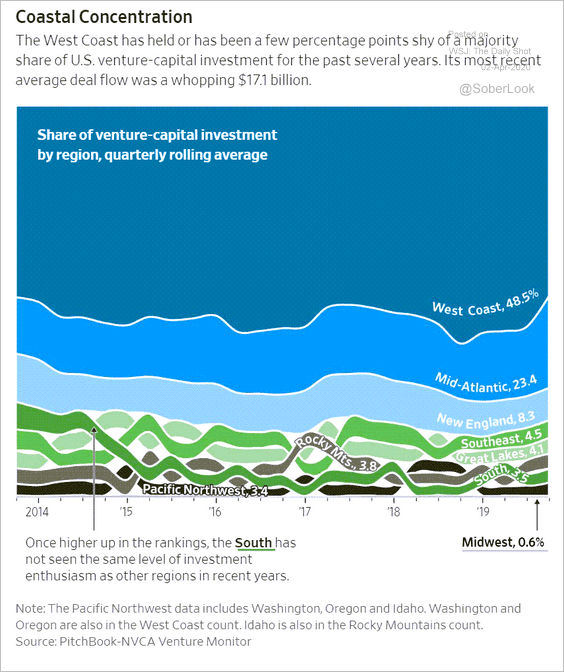 Source: @WSJ Read full article
2. The worst states for corruption:
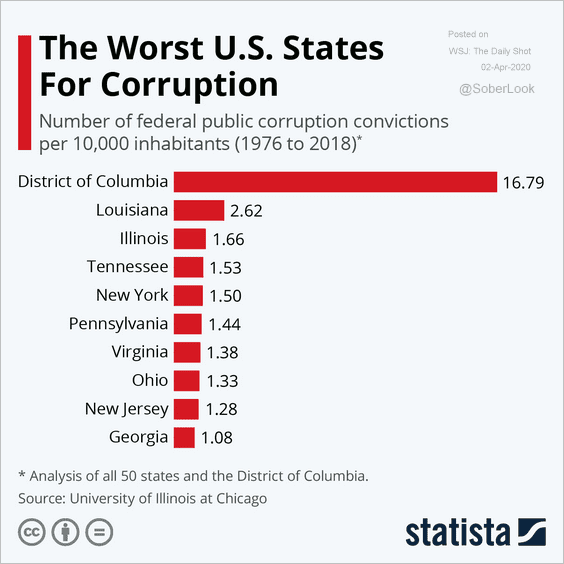 Source: Statista
3. Share of men and women across different occupations:
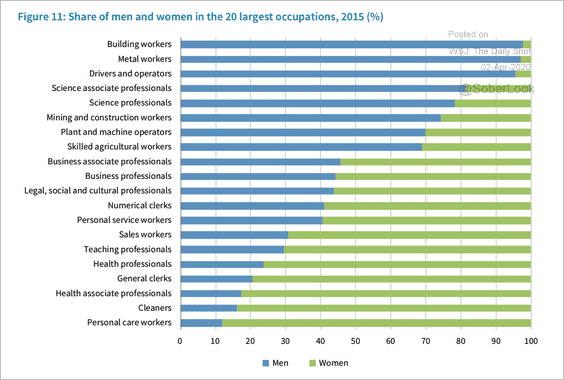 Source: European Foundation for the Improvement of Living and Working Conditions Read full article
4. College enrollment changes by major:
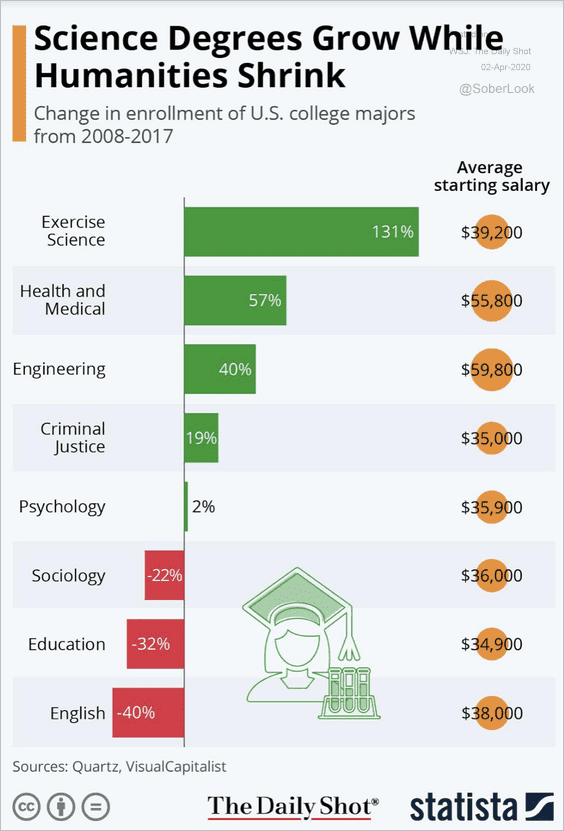 Source: Statista
5. Donations to Democratic candidates in tech and financial services:
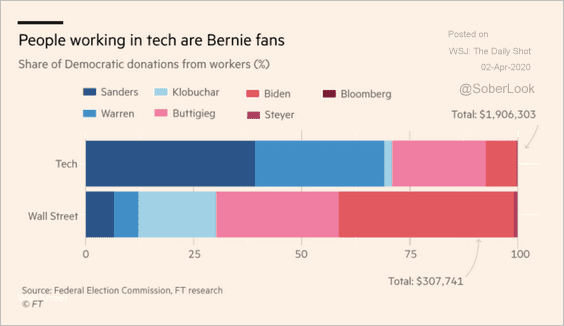 Source: @financialtimes Read full article
6. Where construction is exempt from “nonessential” business closures:
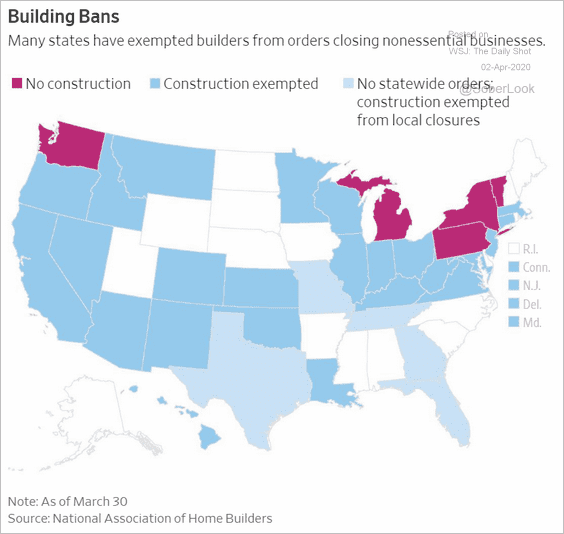 Source: @WSJ Read full article
7. Who has been stockpiling the most for the quarantine?
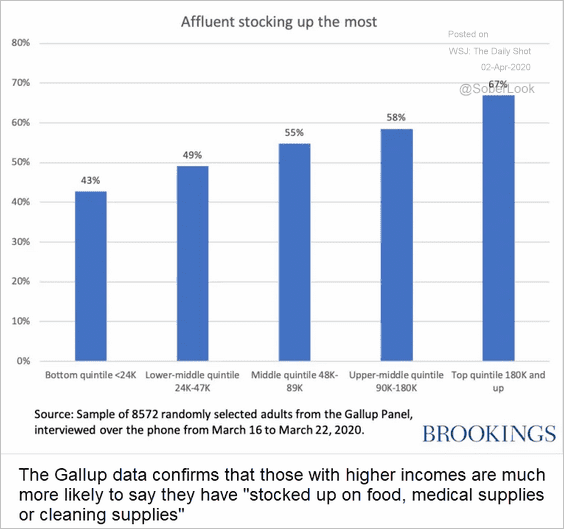 Source: The Brookings Institution Read full article
How much does it cost to stockpile food?
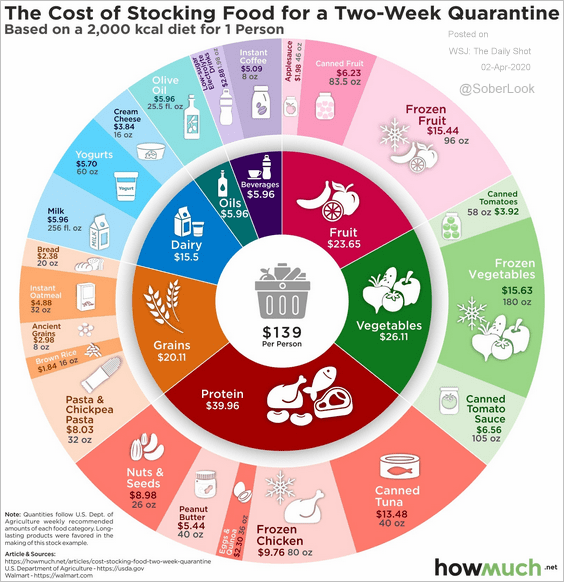 Source: @howmuch_net Read full article
——————–
8. New York City ER visits:
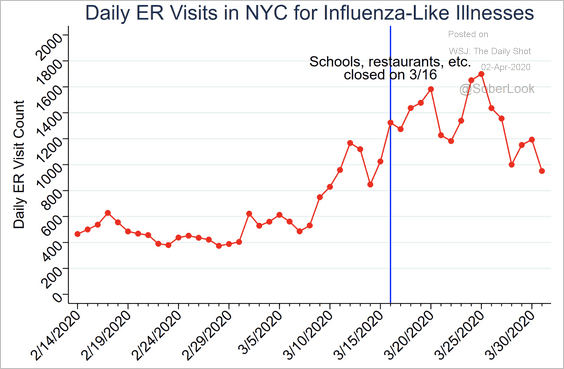 Source: @peterbergman_
9. Changes in online interest in selected products:
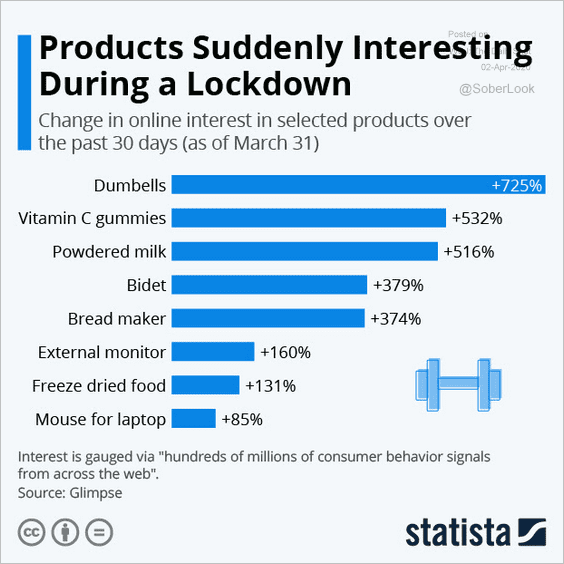 Source: Statista
——————–