
The Daily Shot: 03-Apr-20
• The United States
• The Eurozone
• Europe
• Asia – Pacific
• China
• Emerging Markets
• Commodities
• Energy
• Equities
• Rates
• Food for Thought
The United States
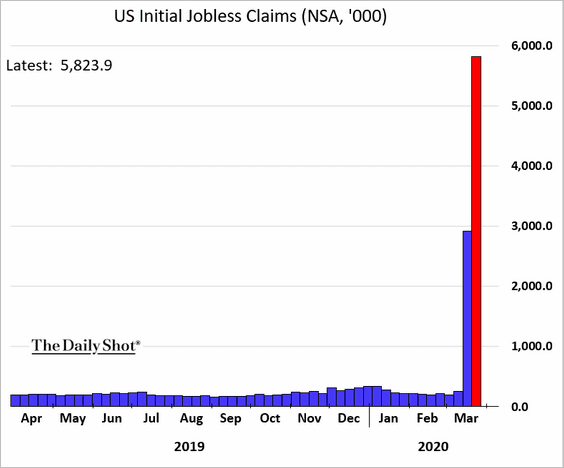
1. Let’s begin with the labor market, which has experienced unprecedented deterioration in recent weeks.
• Initial unemployment claims hit a new weekly record, bringing the total filings over the past two weeks close to ten million.
– This chart shows new jobless claims by state (for comparison, here is the same graph from the previous week).
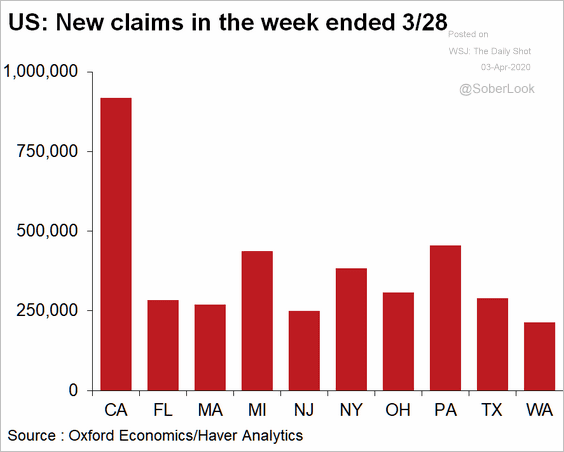 Source: Oxford Economics
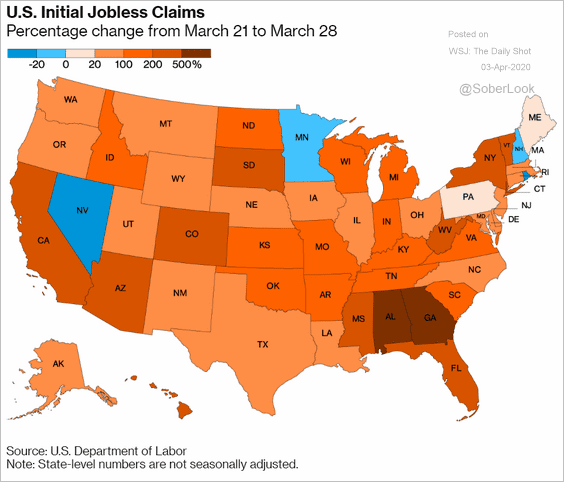
– And this map shows the percent changes in claims by state.
 Source: @markets Read full article
• What should we expect from today’s nonfarm payrolls report?
The most pessimistic forecast shows payrolls declining by four million last month.
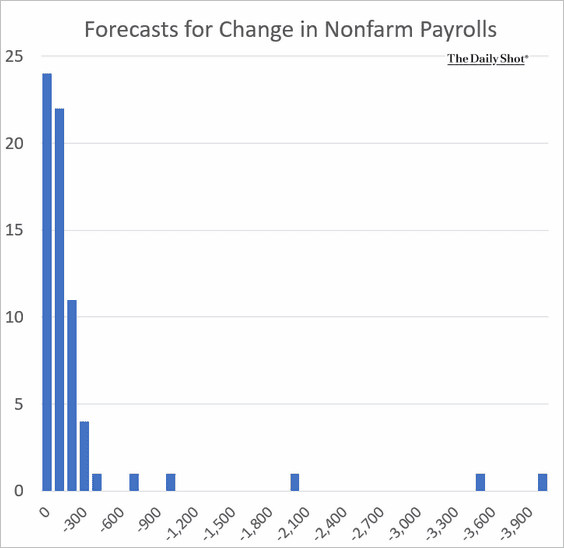 Source: @TheTerminal
Below is one from Morgan Stanley.
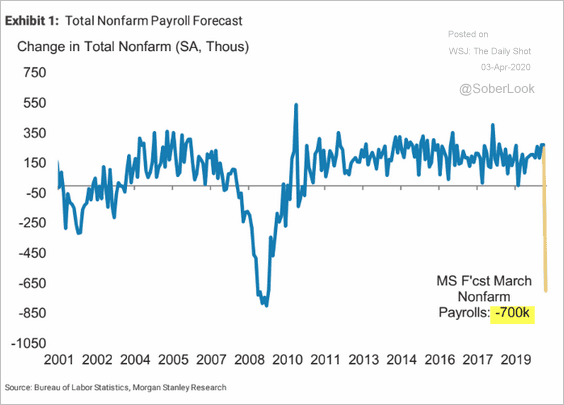 Source: Morgan Stanley Research
And here are the unemployment rate projections over the next three months from Nordea.
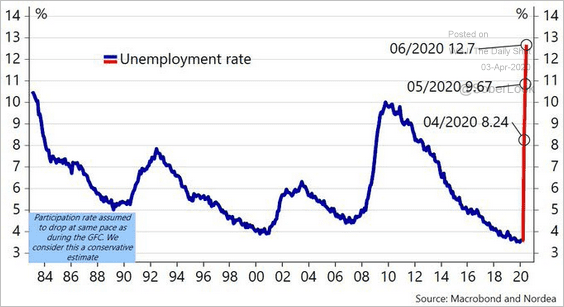 Source: @meremortenlund
Economists also expect a significant decline in the number of hours worked.
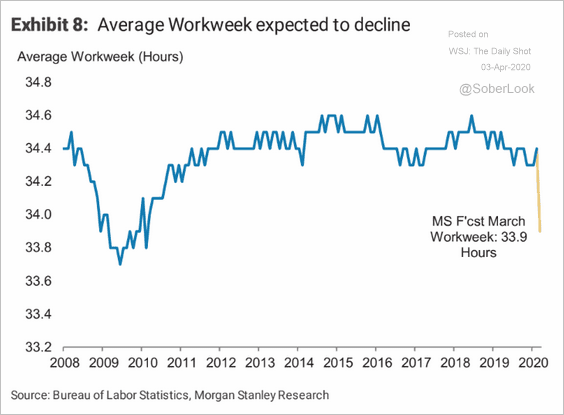 Source: Morgan Stanley Research
——————–
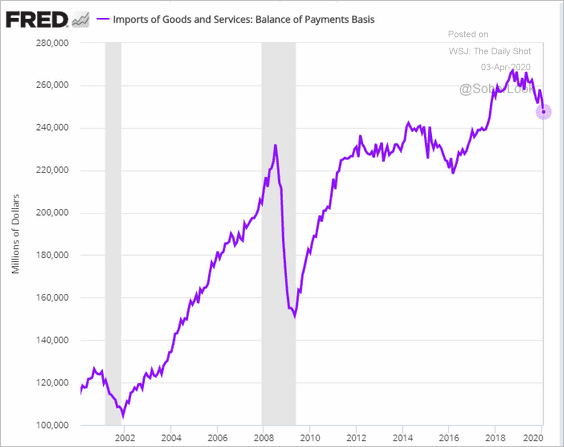
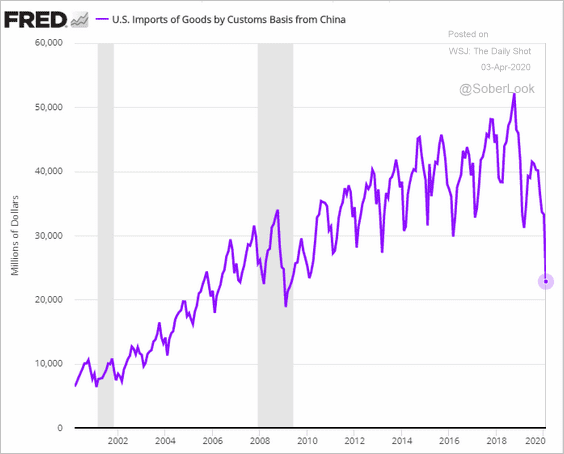
2. The trade deficit narrowed in February as imports slumped (second chart below).
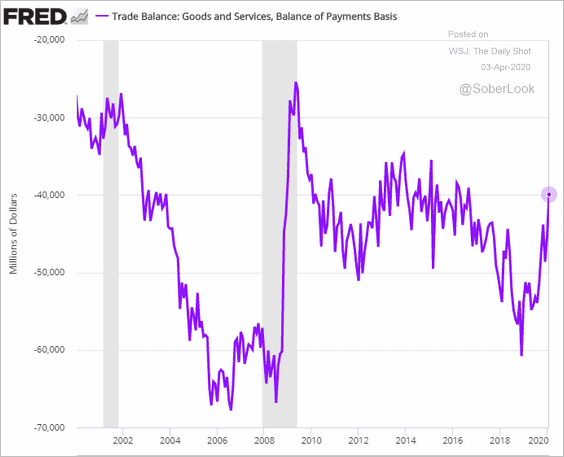
US imports from China hit the lowest level in a decade.
——————–
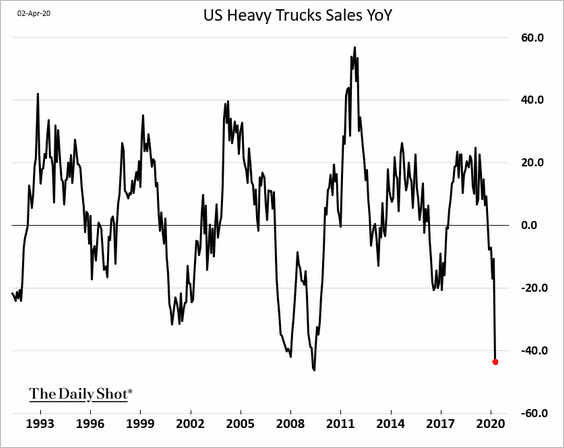
3. Heavy truck sales are down 43% from a year ago.
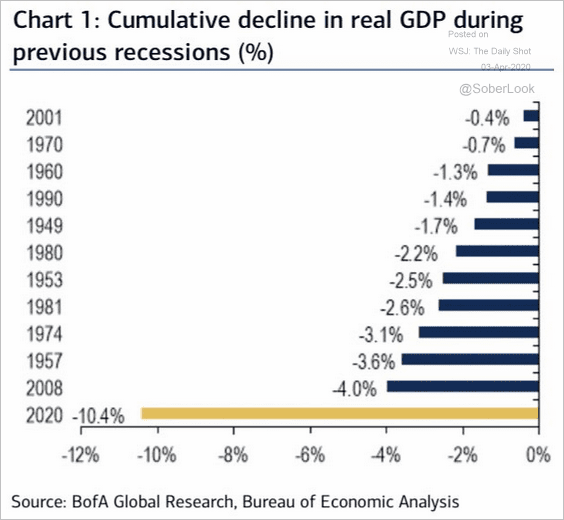
4. Bank of America now sees the GDP contracting by over 10% for the whole year.
 Source: BofA Merrill Lynch Global Research
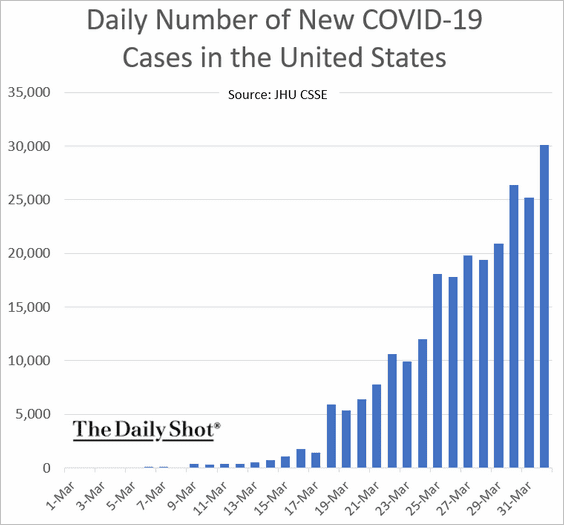
5. The daily number of new US coronavirus infections continues to climb.
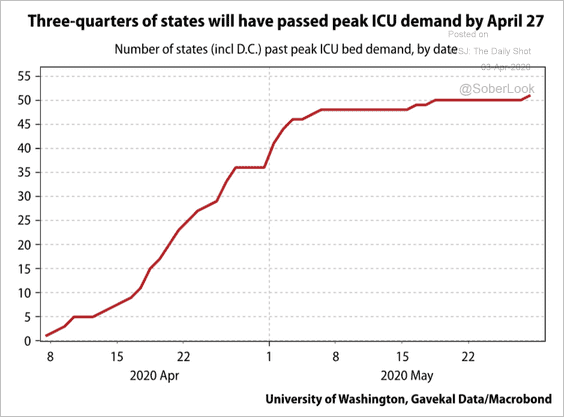
Analysts still expect new cases to peak within a couple of weeks. According to Gavekal and the University of Washington, “three-quarters of states will have passed peak ICU demand by April 27th.”
 Source: Gavekal
The Eurozone
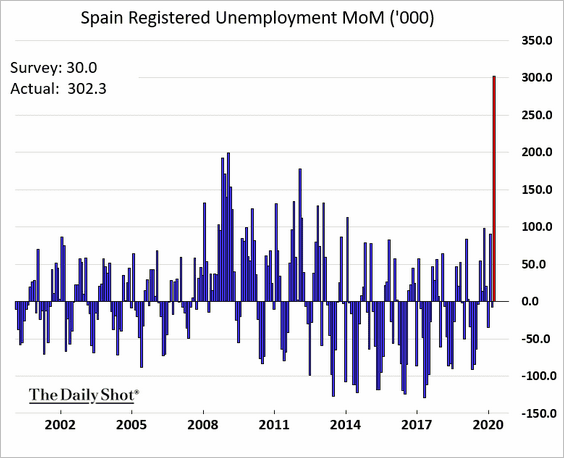
1. Spain’s unemployment spiked.
2. The number of new infections in Italy is gradually trending lower.
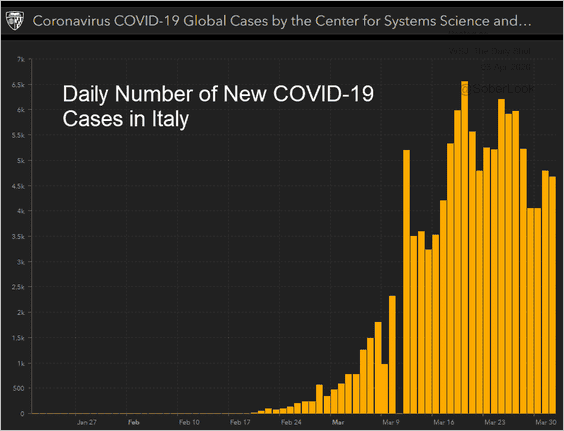 Source: JHU CSSE
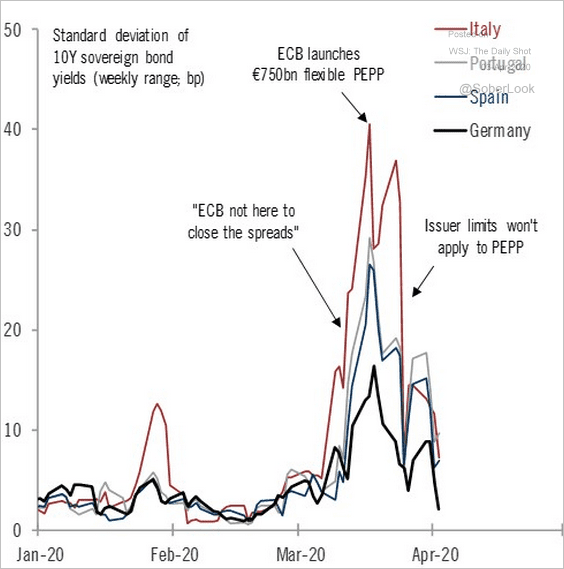
3. The ECB has been very effective in pushing bond yields down.
 Source: @fwred
4. How much fiscal and monetary stimulus are the Eurozone’s largest economies getting?
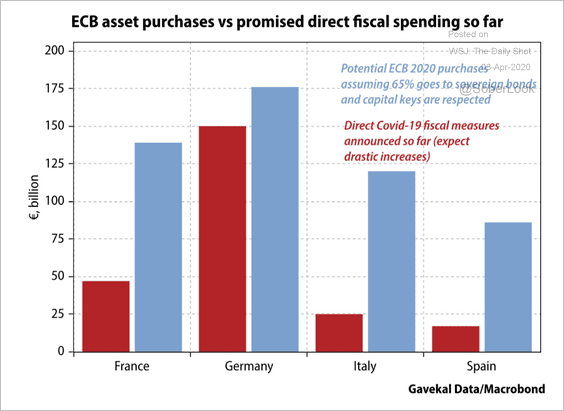 Source: Gavekal
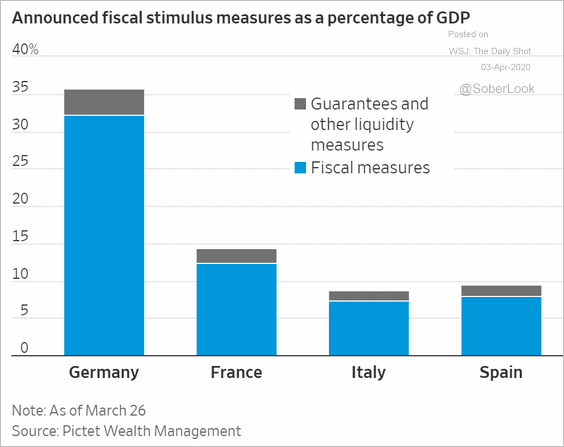 Source: @WSJ Read full article
Europe
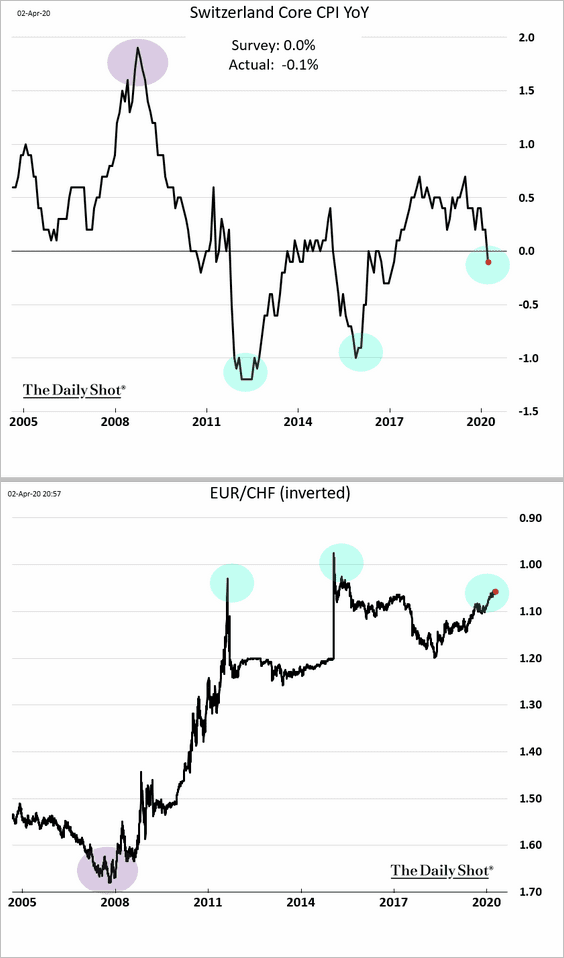
1. Switzerland is in deflation again as the Swiss franc (second chart) continues to strengthen.
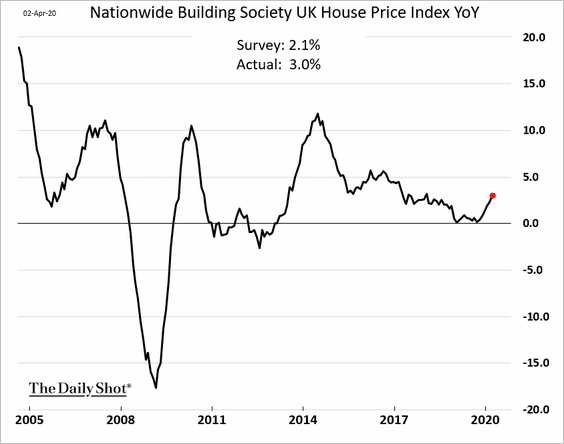
2. Home price appreciation in the UK has been rebounding. However, it’s hard to imagine a scenario in which this trend continues.
3. Should Europe temporarily boost taxes on fuel as prices fall?
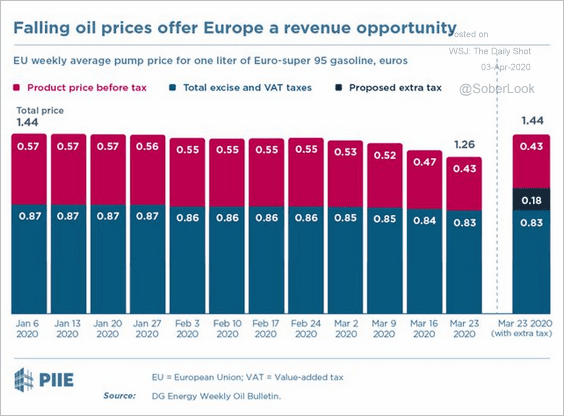 Source: @adam_tooze, @jfkirkegaard Read full article
Asia – Pacific
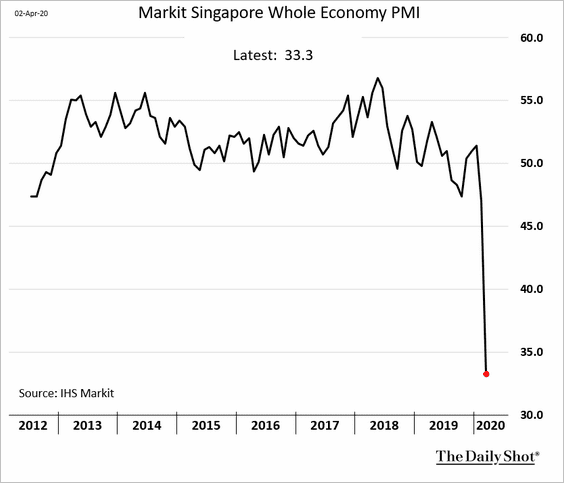
1. Singapore’s economy hit a bump.
2. Has the number of new cases in Australia peaked?
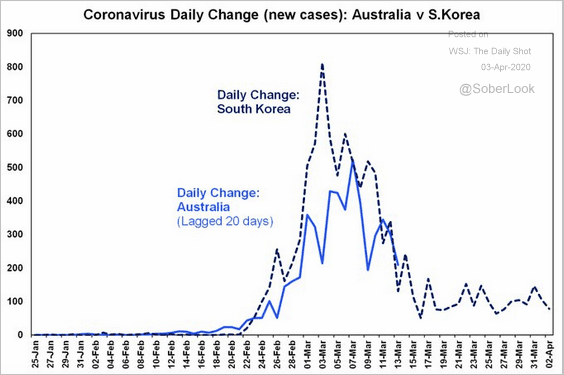 Source: @ShaneOliverAMP
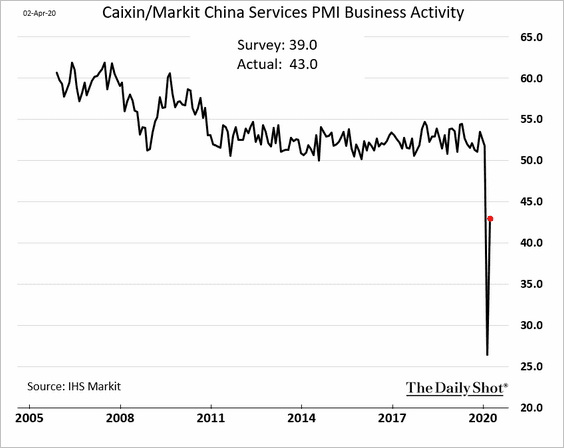
China
1. The PMI report from Markit shows China’s service-sector business activity still in decline (PMI < 50), but the rate of contraction has moderated.
2. The labor market faces substantial headwinds.
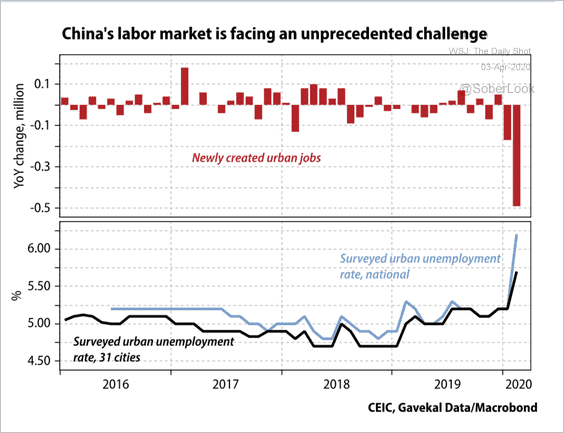 Source: Gavekal
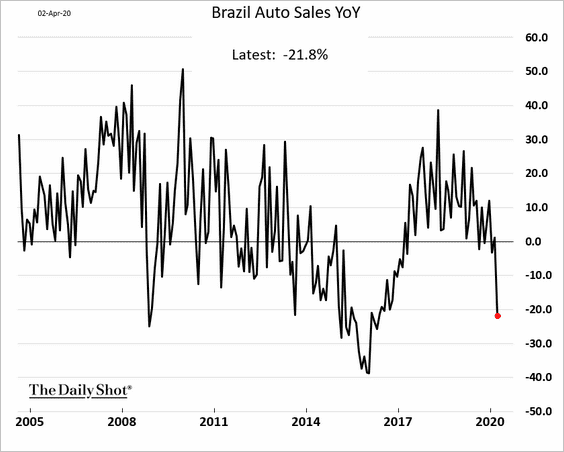
Emerging Markets
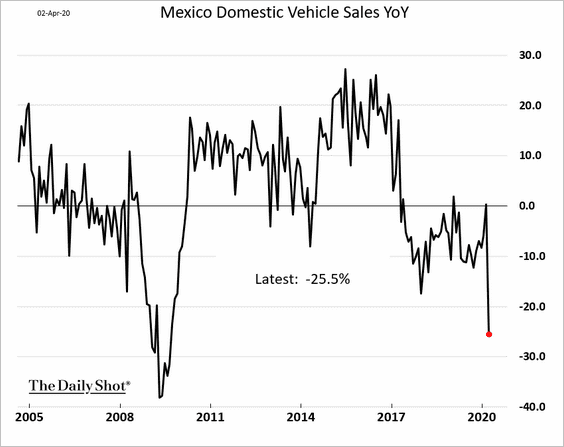
1. Automobile sales in Latin America are plummeting.
• Brazil:
• Mexico:
——————–
2. Year-to-date, Latin American and EMEA countries have posted much steeper equity price declines versus developed markets.
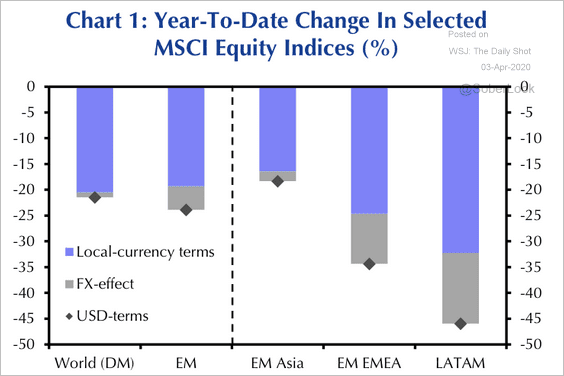 Source: Capital Economics
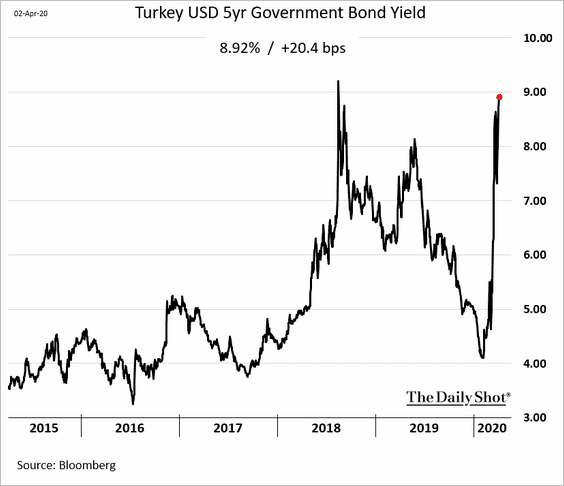
3. Turkish dollar-denominated bonds are under pressure.
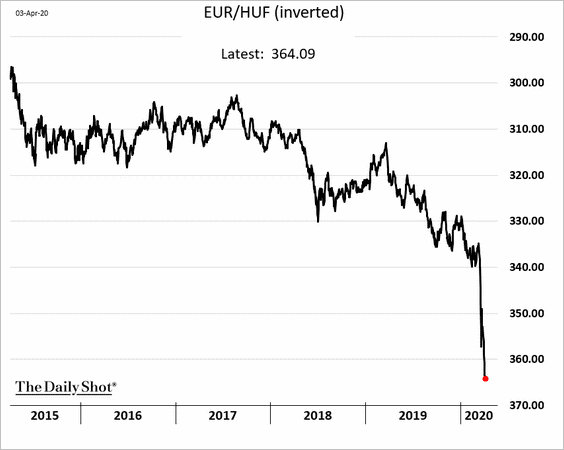
4. Viktor Orban’s move to cement his authoritarian rule is spooking investors.
 Source: BBC Read full article
Here is the Hungarian forint (vs. the euro).
——————–
5. Outbreaks in major EM countries outside of Asia are in their earlier stages and haven’t peaked just yet.
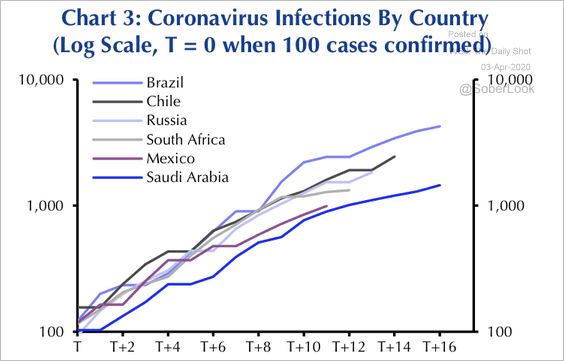 Source: Capital Economics
6. The declines in EM equities and currencies appear stretched.
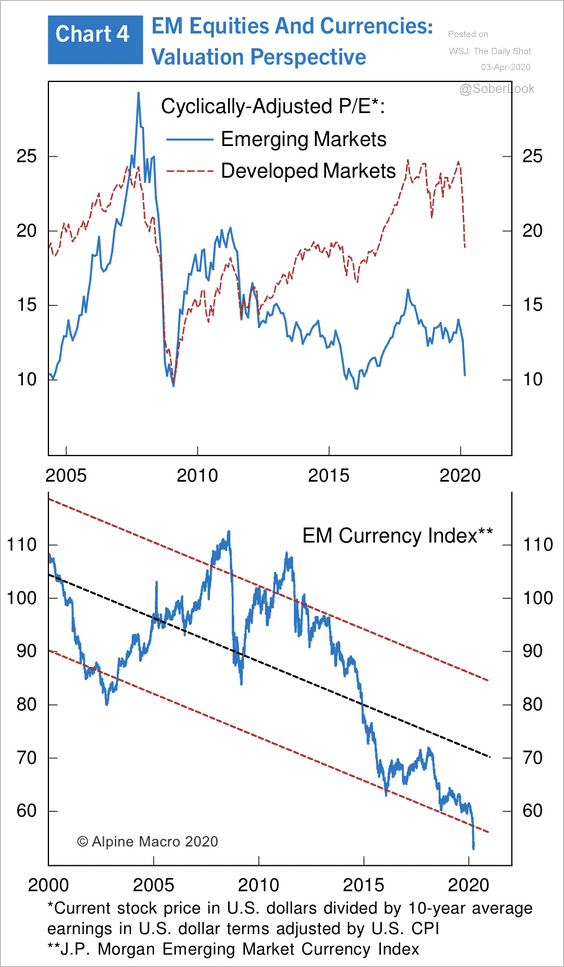 Source: Alpine Macro
Here is a ranking of currency valuations, according to Alpine Macro.
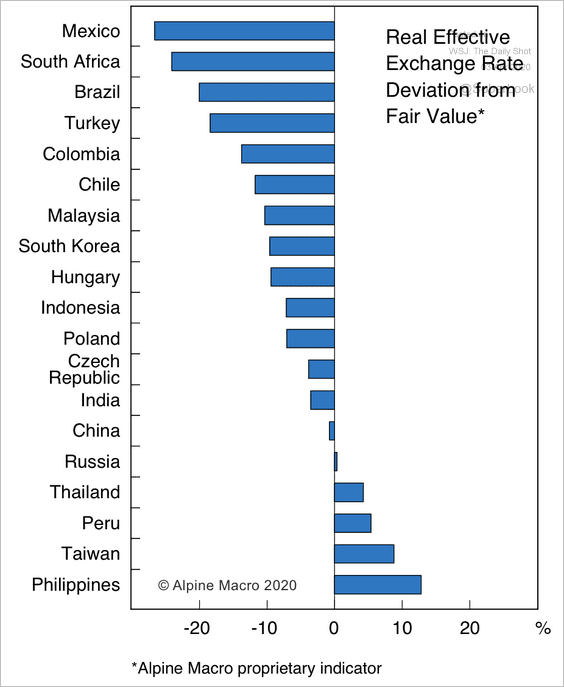 Source: Alpine Macro
Commodities
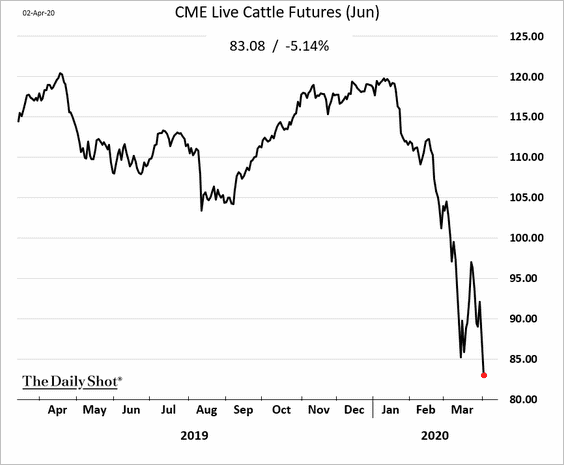
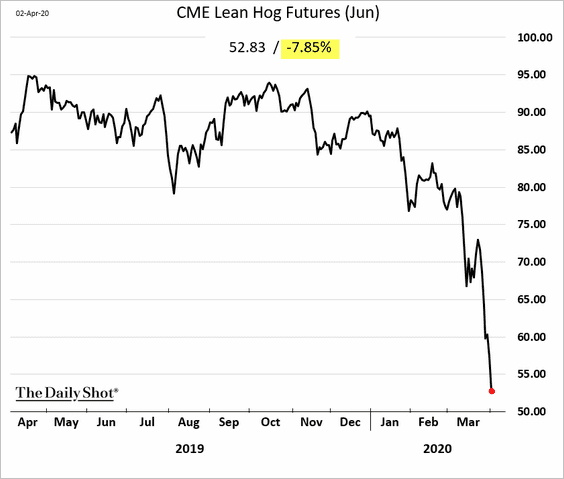
US livestock prices have cratered.
 Source: Reuters Read full article
Energy
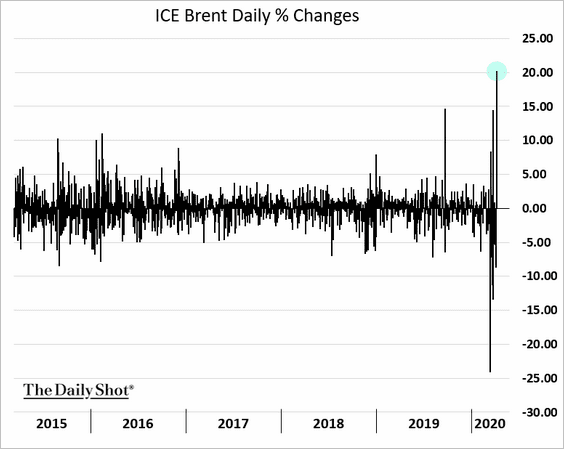
1. Thursday was a good day for crude oil.
2. Previous extremes in the oil price contango have marked bottoms.
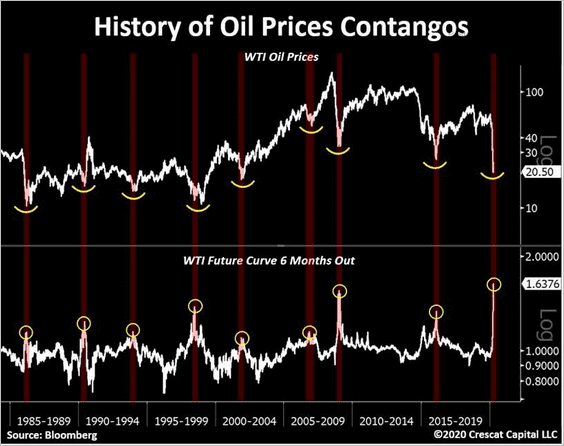 Source: @TaviCosta
Equities
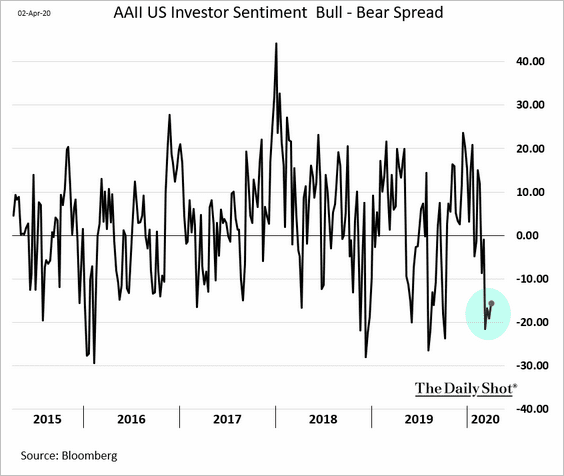
1. The AAII investor sentiment indicator still hasn’t signaled full capitulation.
2. Much of the equity market deleveraging appears to be over.
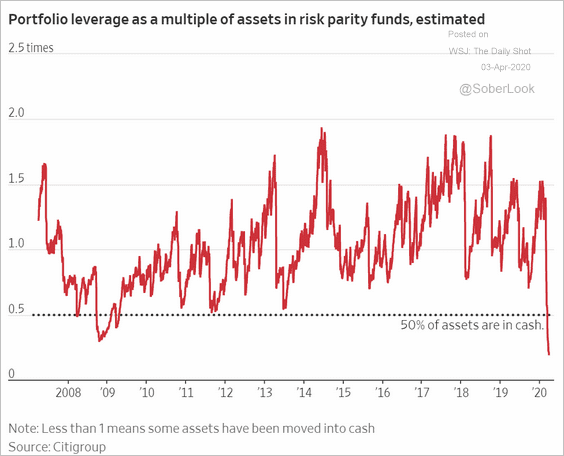 Source: @WSJ Read full article
3. Indications of panic selling could signal a low, according to SunTrust.
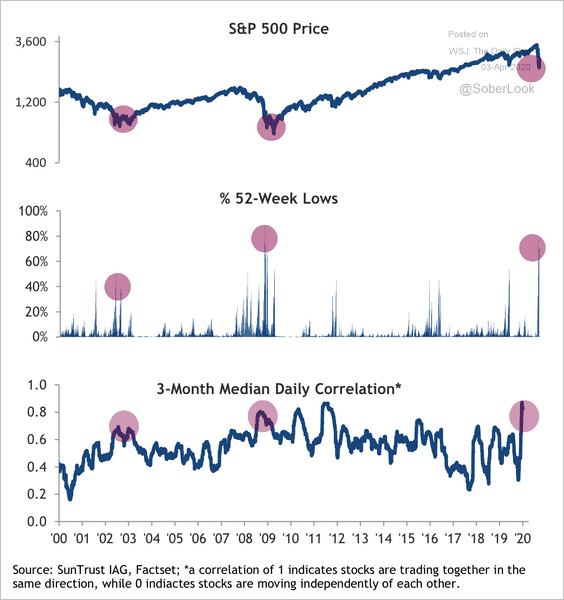 Source: SunTrust Private Wealth Management
4. Not enough volatility? Why not put some leverage on the most volatile sector?
5. Goldman’s base case is a 33% decline in the S&P 500 earnings-per-share this year.
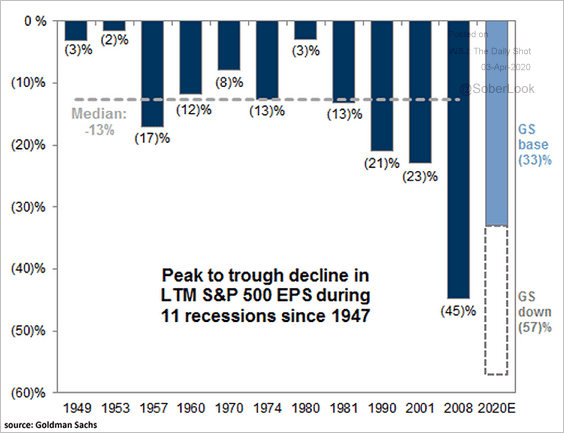 Source: @ISABELNET_SA, @GoldmanSachs
6. How correlated are corporate earnings to the GDP?
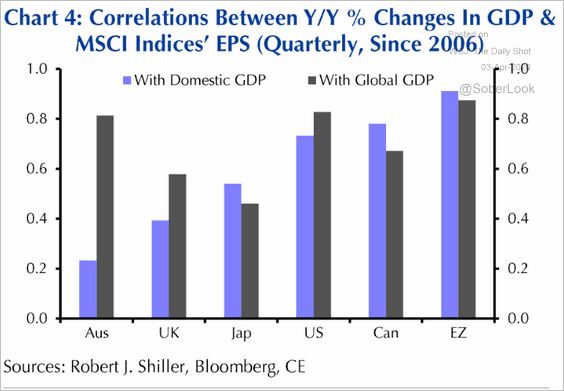 Source: Capital Economics
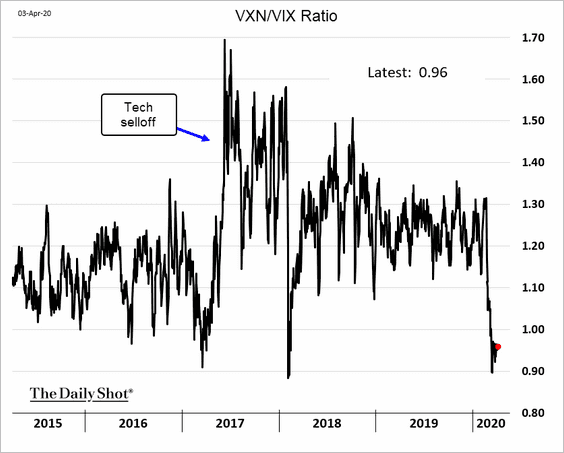
7. The Nasdaq 100 VIX-equivalent index (VXN) has been below VIX for days. The market perceives tech to be less volatile than the S&P 500.
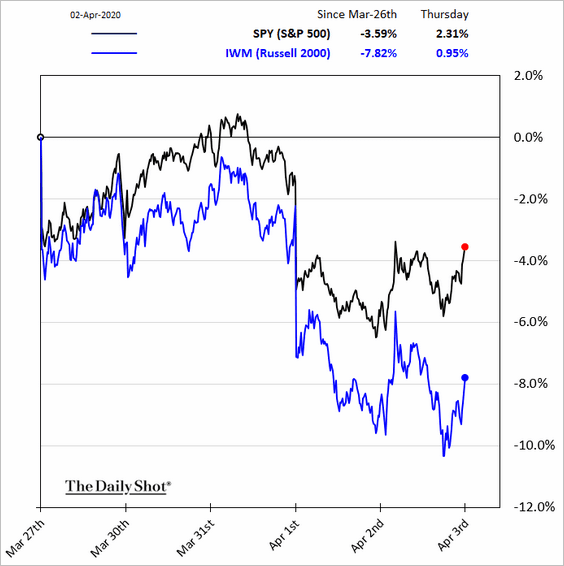
8. Next, we have some style/factor performance charts (last five business days).
• Small caps:
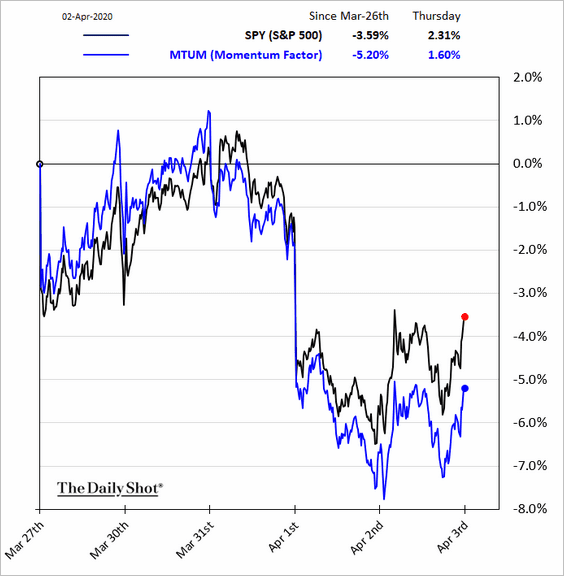
• Momentum:
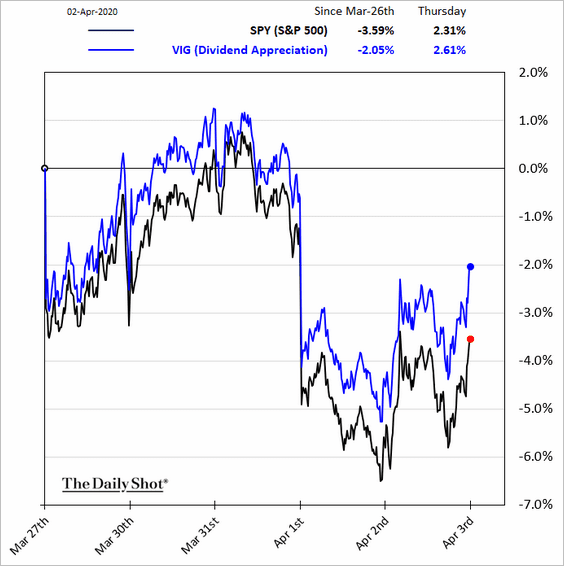
• Dividend appreciation:
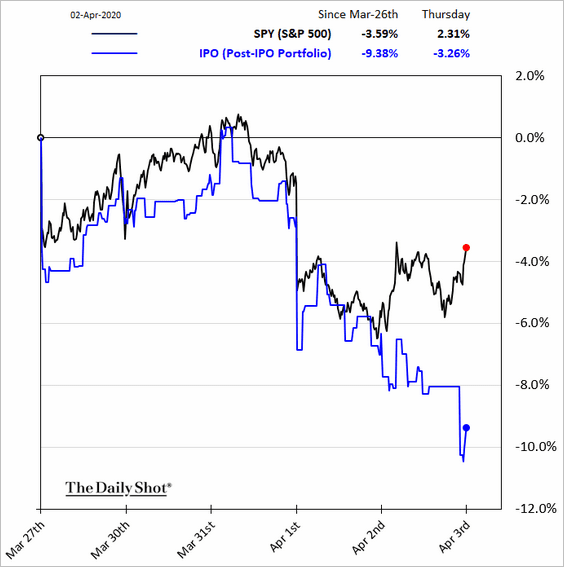
• Post-IPO stocks:
——————–
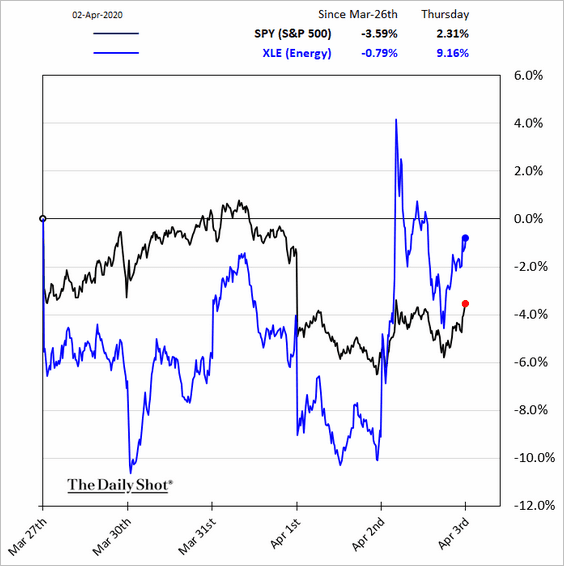
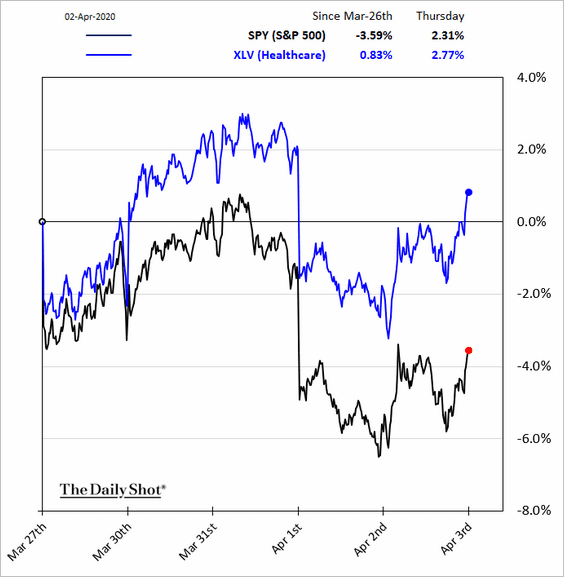
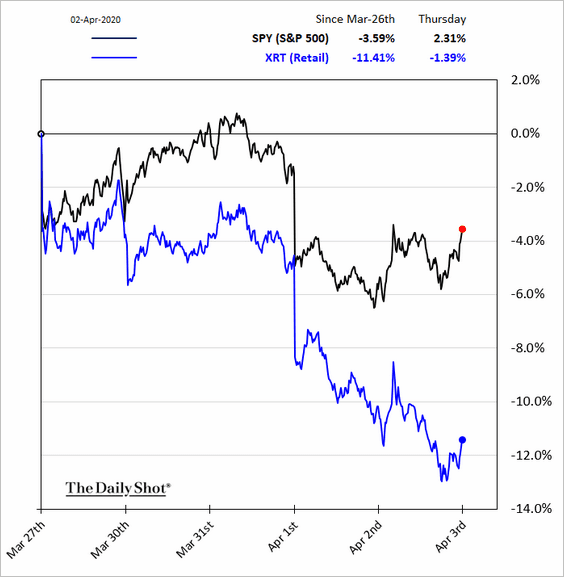
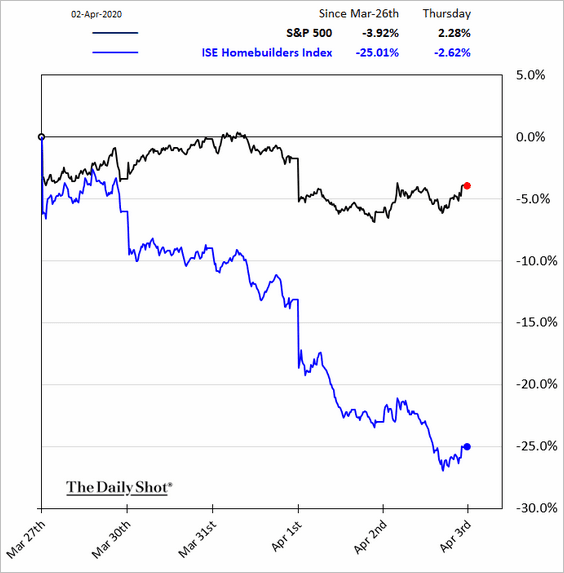
8. Finally, here are some sector performance updates.
• Energy:
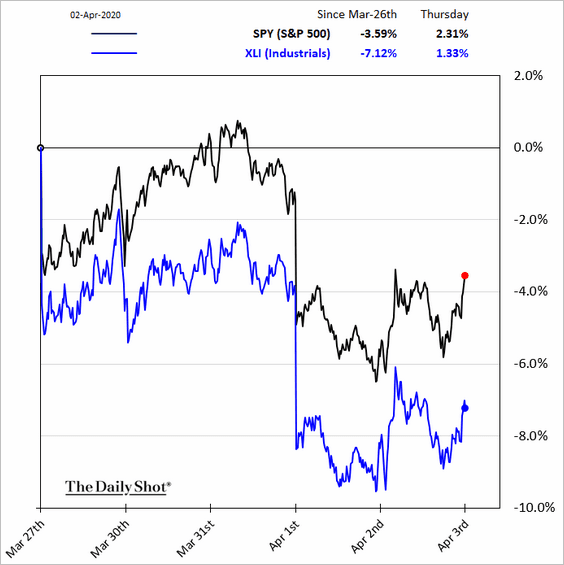
• Industrials:
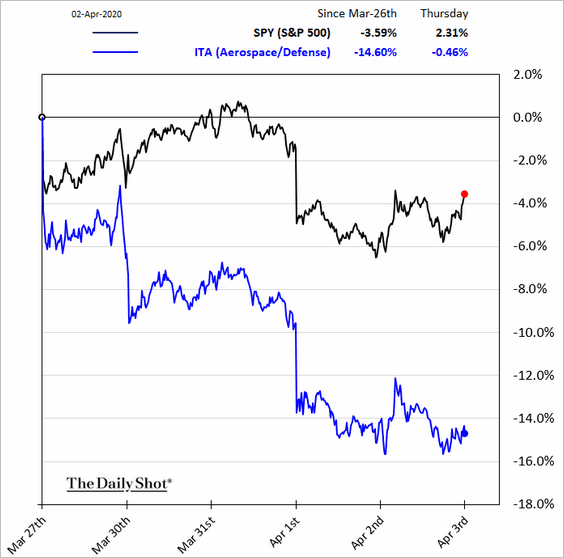
• Aerospace/defense:
• Healthcare:
• Retail:
• Homebuilders:
• Banks:
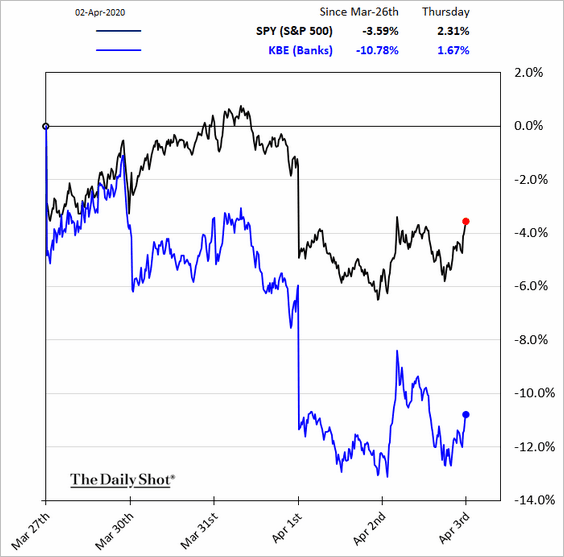
Bank stocks appear to be relatively cheap.
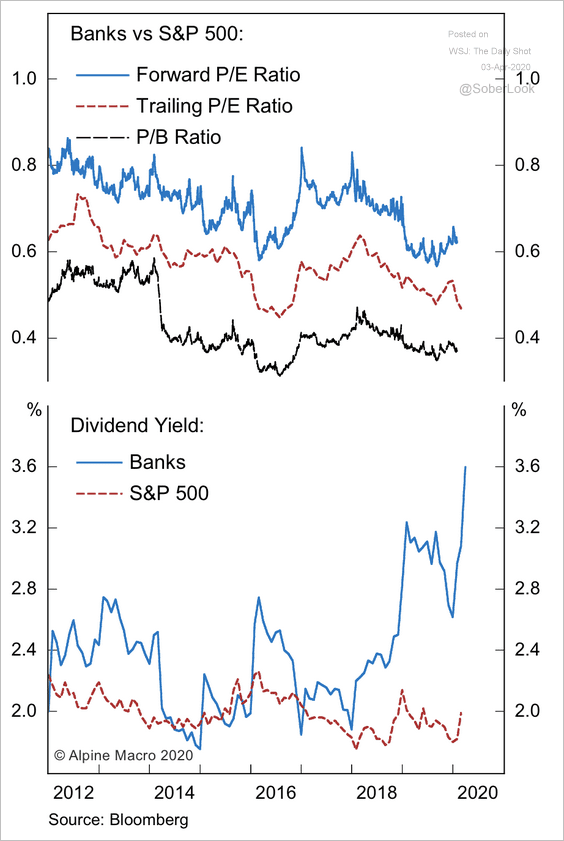 Source: Alpine Macro
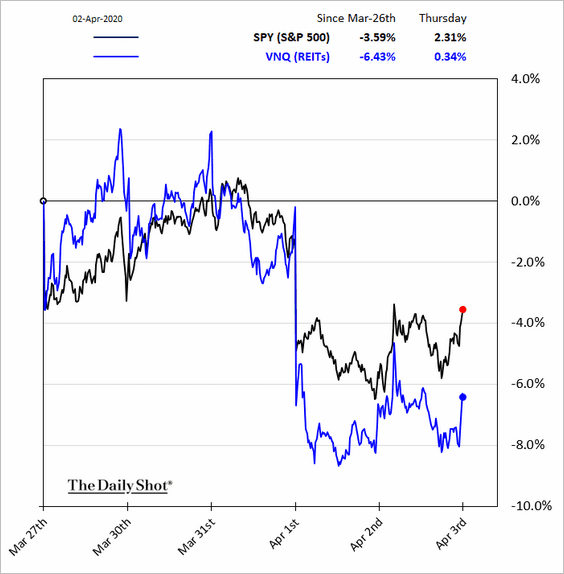
• REITs:
Here is a mortgage REIT called Redwood Trust (see story).
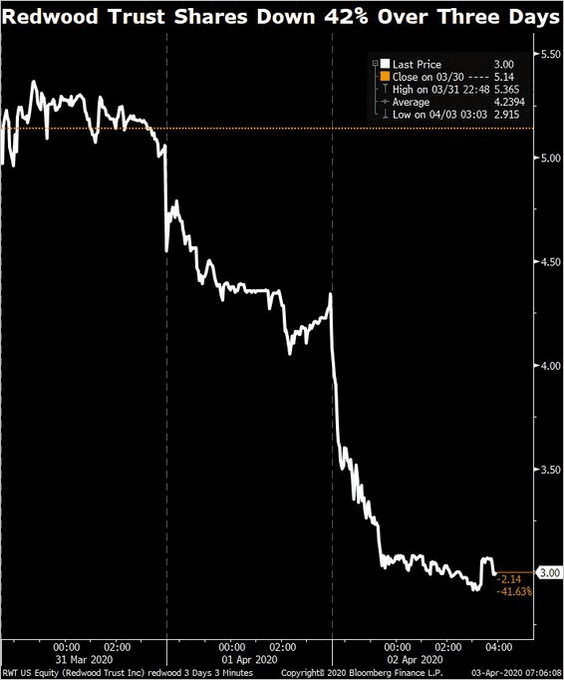 Source: @tracyalloway
Rates
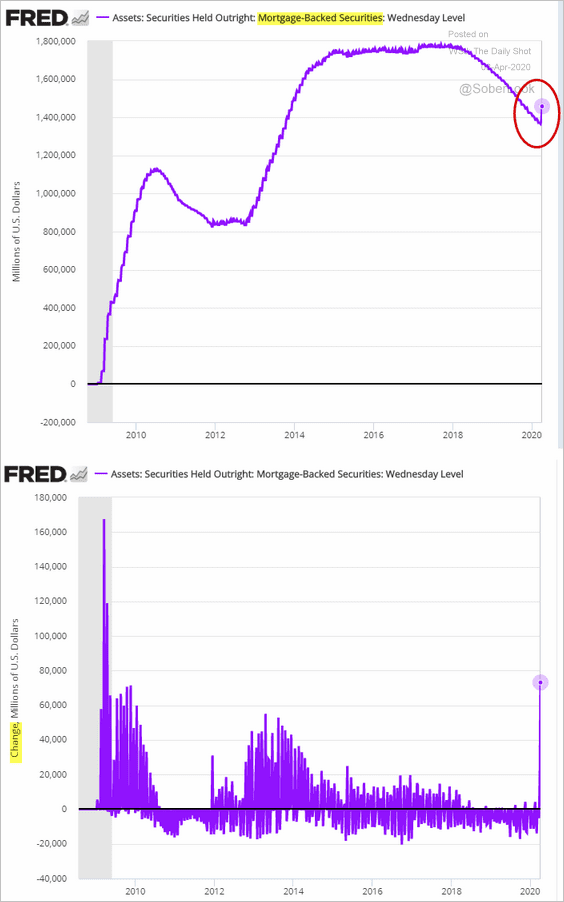
1. The Fed’s balance sheet continues to climb at an unprecedented rate as the central bank buys Treasuries and agency MBS.
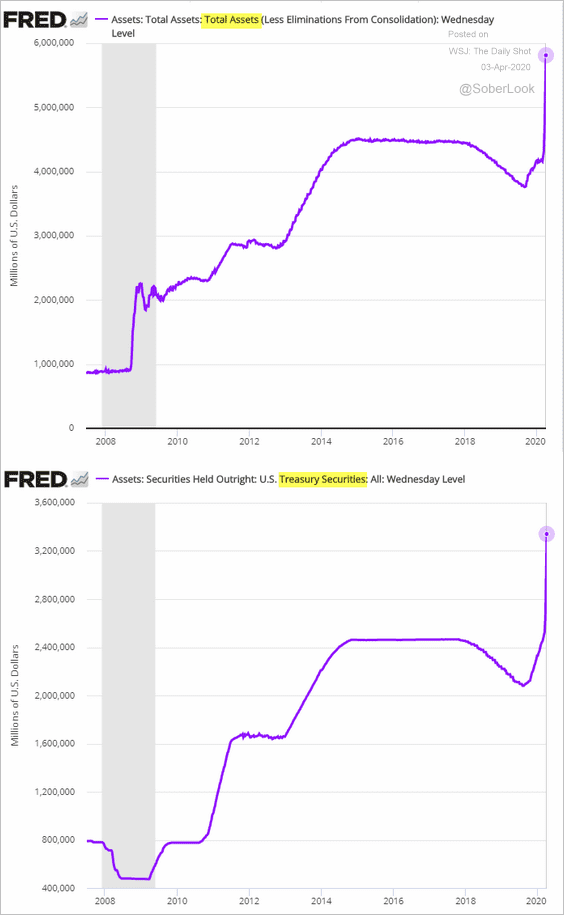
• The second chart below shows the net weekly purchases of MBS bonds.
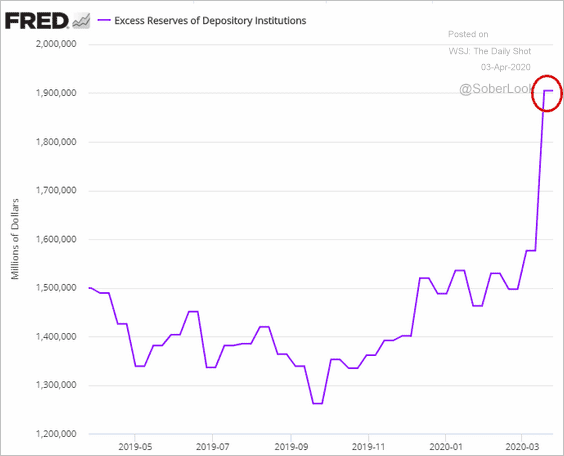
• Despite the massive balance sheet expansion, reserves didn’t rise this week. Part of the reason is the spike in the amount of cash the Treasury is holding with the Fed (see chart).
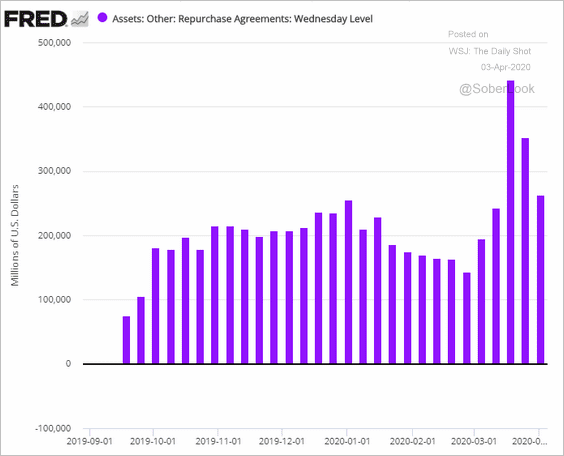
• The repo financing demand has eased again.
——————–
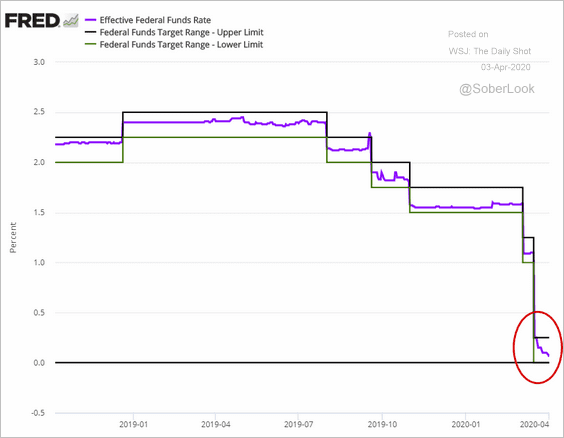
2. Elevated reserve levels have sent the fed funds rate toward its lower bound (it’s now six basis points).
3. The Fed’s QE accelerated the expansion in the money supply.
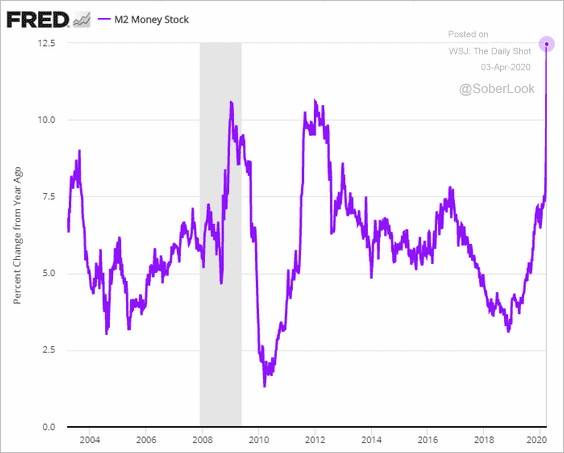
Below is an illustration of how the central bank’s securities purchases boost the money supply (from Longview Economics).
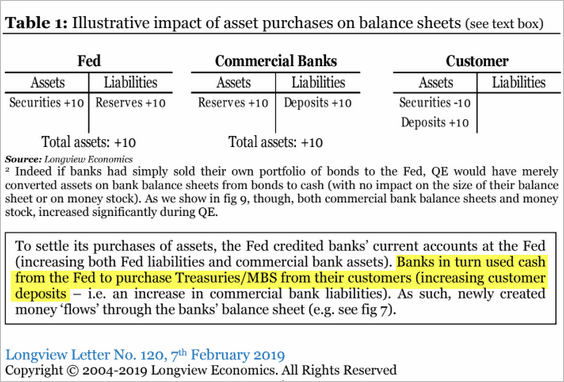 Source: Longview Economics
——————–
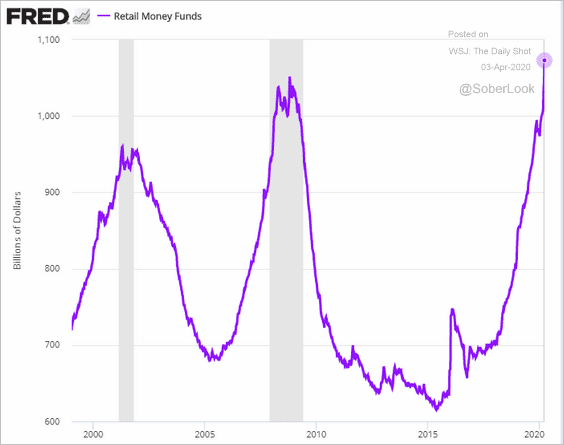
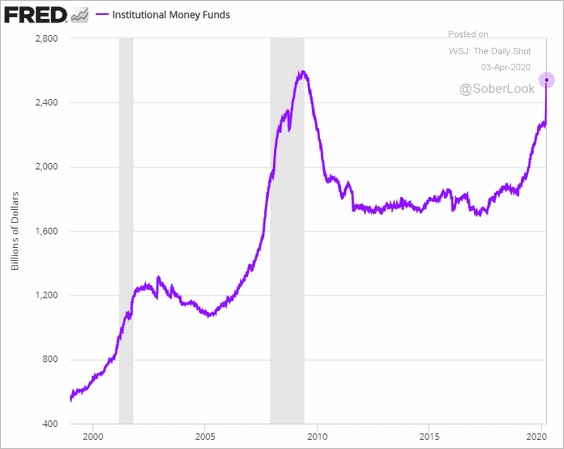
4. Retail money market fund balances hit a new record, and institutional holdings (second chart) are also near the previous peak.
——————–
5. The Fed and money market funds will absorb most of this year’s increase in Treasury issuance.
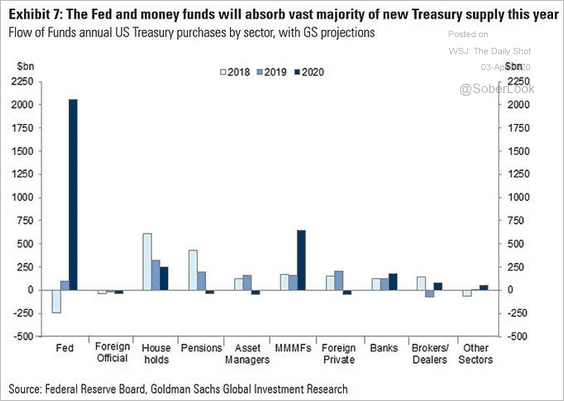 Source: @ISABELNET_SA, @GoldmanSachs
6. Mortgage rates (y-axis) remain disconnected from Treasury yields (x-axis).
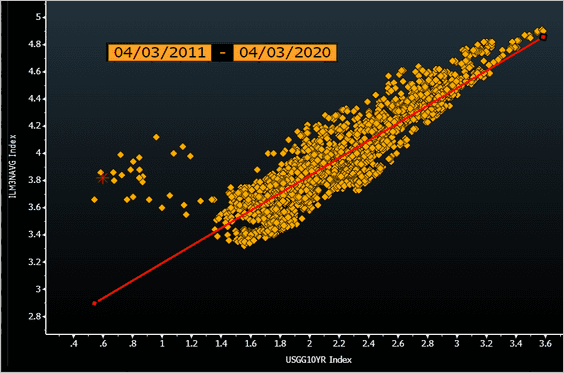 Source: @TheTerminal
7. The iShares TIPS Bond ETF (TIP) is at an extreme low versus the iShares 20+ Year Treasury Bond ETF (TLT).
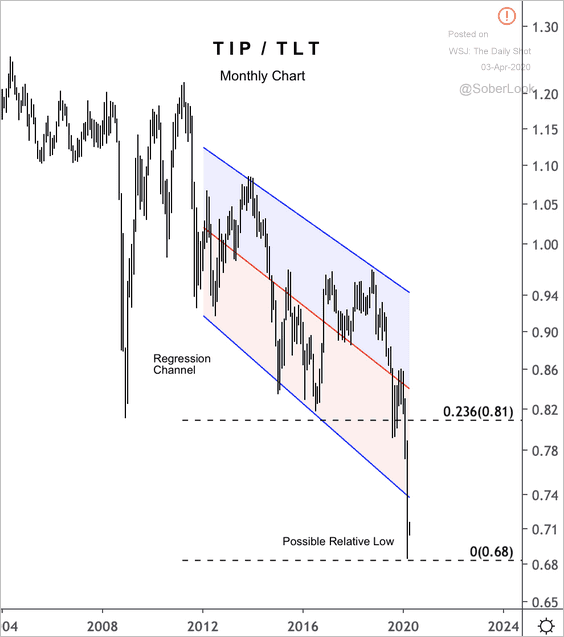 Source: @DantesOutlook
——————–
Food for Thought
1. Young adults living with their parents:
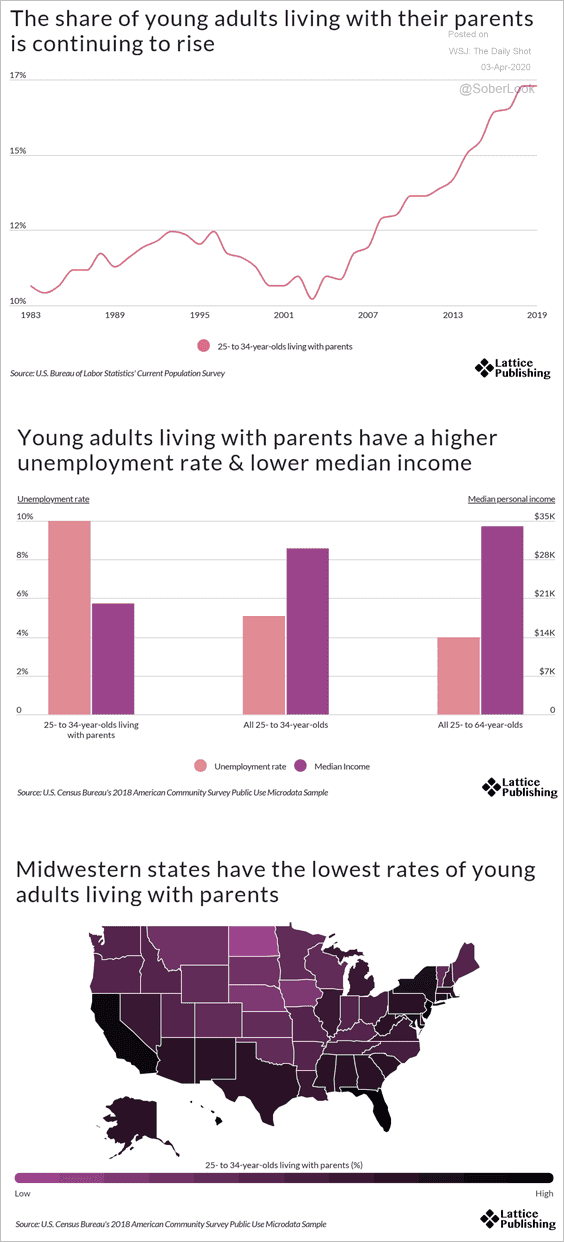 Source: Lattice Publishing
2. The 2002-2006 housing boom and the growth in subprime lending occurred in different areas of the country.
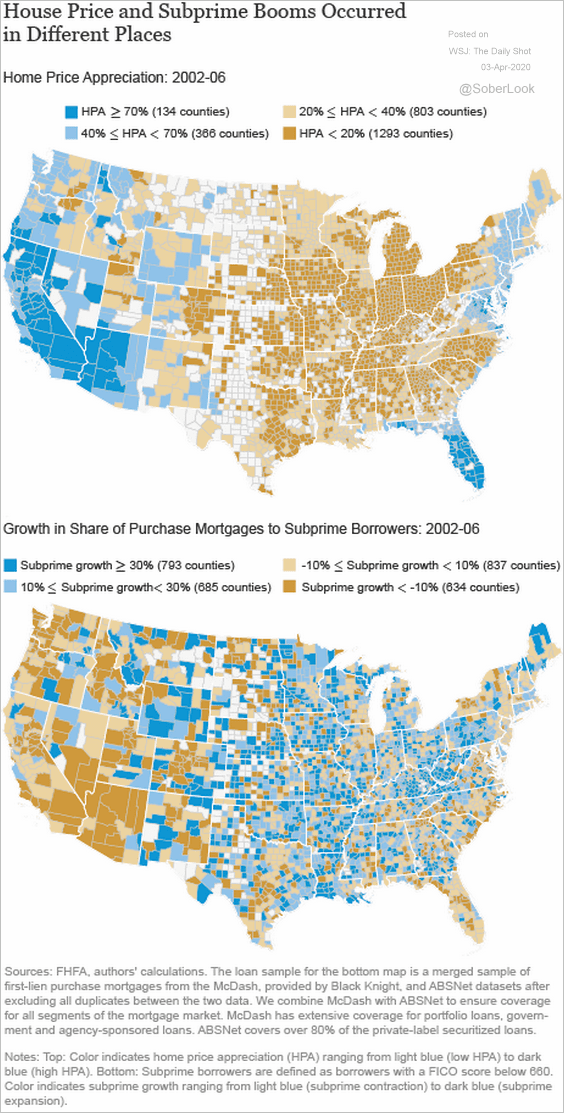 Source: Liberty Street Economics Read full article
3. Foreign-born voters in the US:
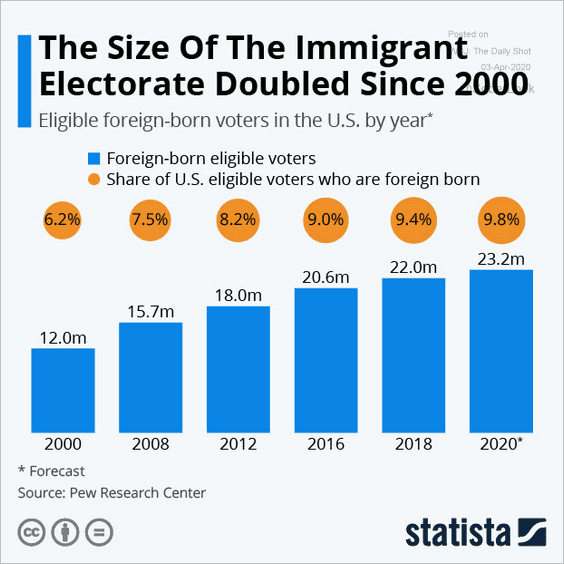 Source: Statista
4. Obesity rates:
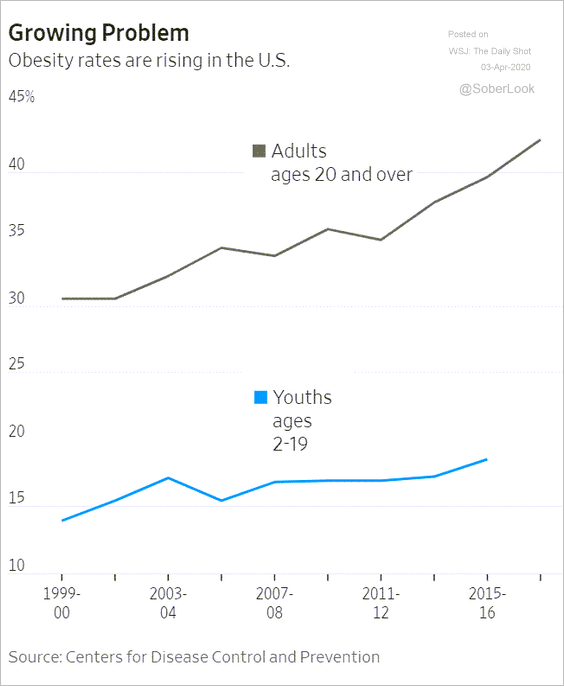 Source: @WSJ Read full article
5. Opioid overdoses by age:
 Source: Expert Insurance Reviews Read full article
6. Coronavirus testing percentages:
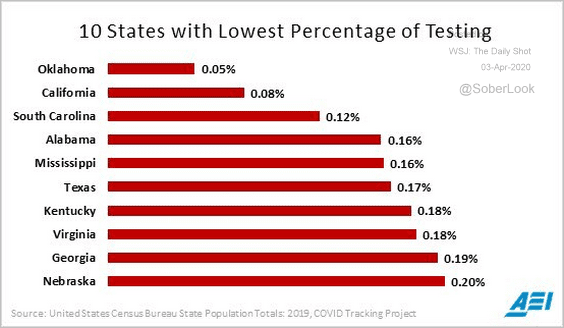 Source: @ScottGottliebMD
7. COVID-19 patients hospitalized:
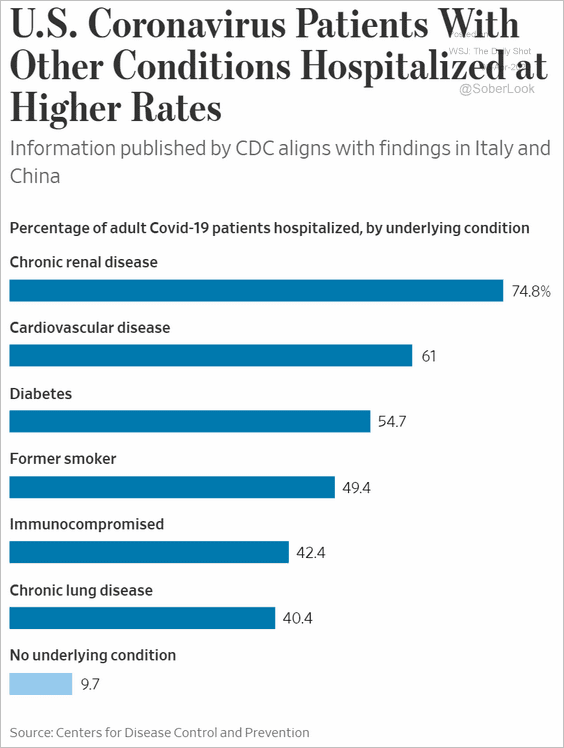 Source: @WSJ Read full article
8. Sydney’s experience with the Spanish flu:
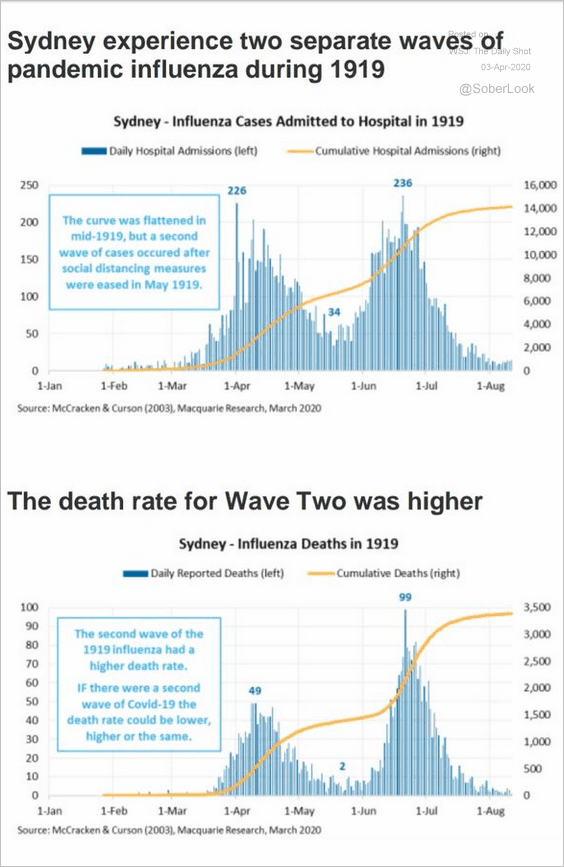 Source: Macquarie , @Scutty
9. Who is planning to use more cannabis and CBD?
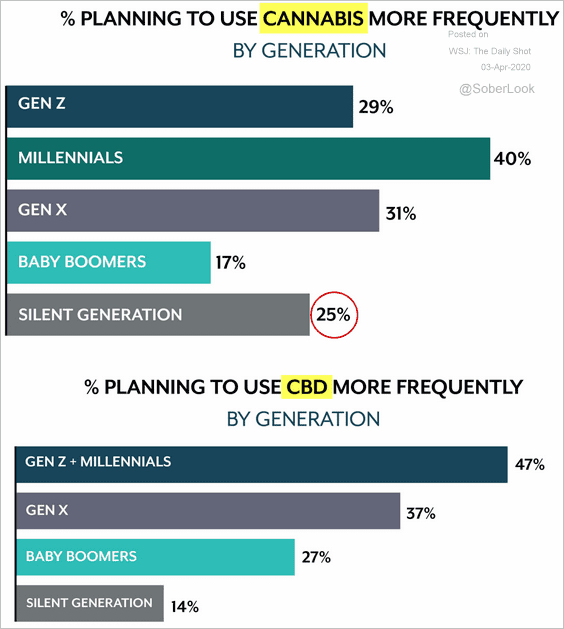 Source: Brightfield Group
——————–
Have a great weekend!