
The Daily Shot: 14-Apr-20
• The United States
• The United Kingdom
• The Eurozone
• Australia
• China
• Emerging Markets
• Commodities
• Energy
• Equities
• Credit
• Global Developments
• Food for Thought
The United States
1. Let’s begin with some data on small businesses in the US.
• There are 20.7 million firms with fewer than 500 workers.
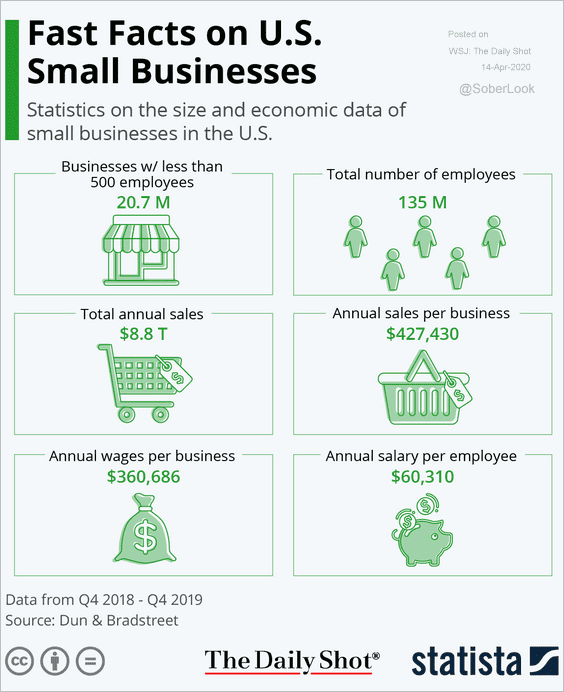 Source: Statista
• Workers’ hours at small firms are down over 60% from a year ago.
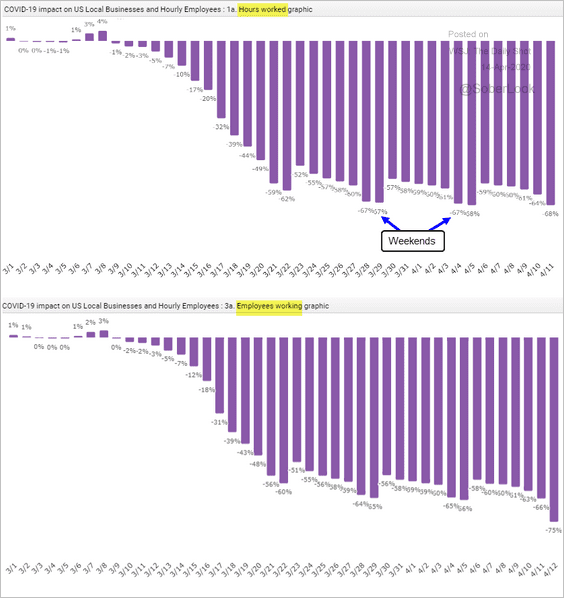 Source: Homebase
• The clock is ticking for many small businesses.
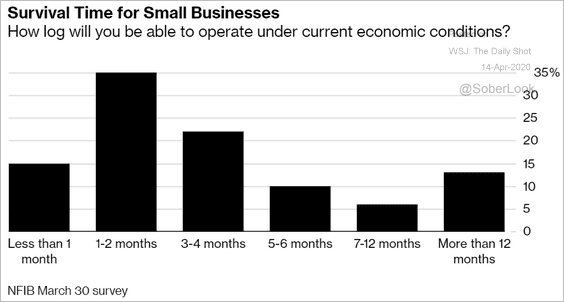 Source: @business Read full article
——————–
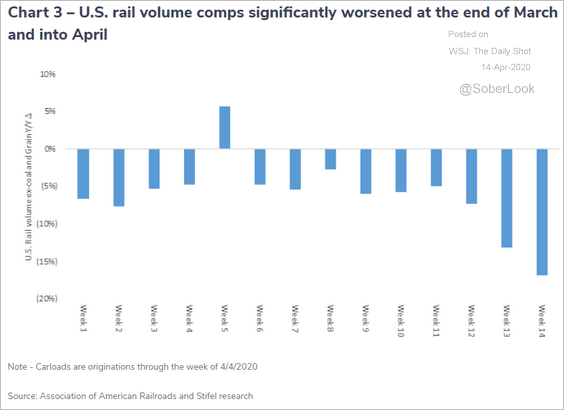
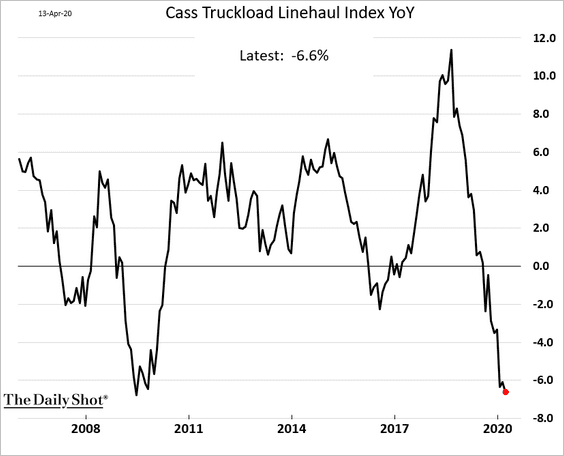
2. Freight recession continues to deepen.
• Freight shipments and expenditures (year-over-year):
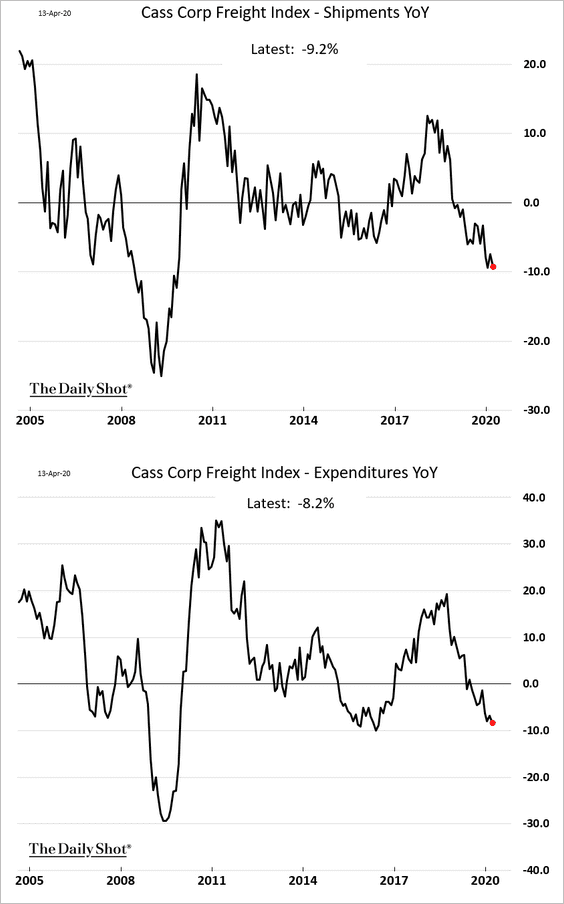 Source: Cass Information Systems
• Rail volume:
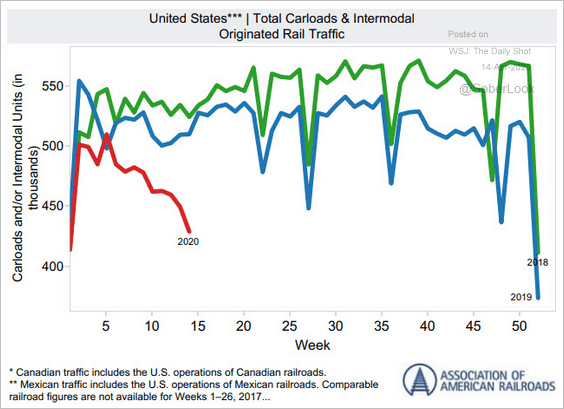 Source: The Association of American Railroads
 Source: Cass Information Systems
• The Cass Truckload Linehaul Index:
——————–
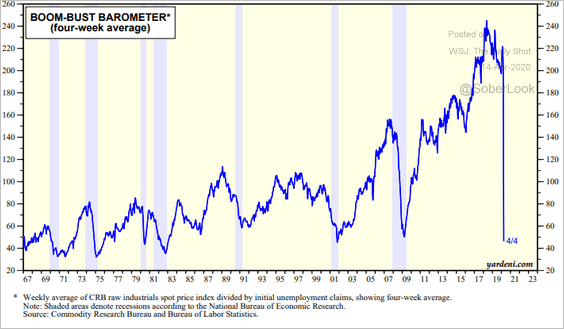
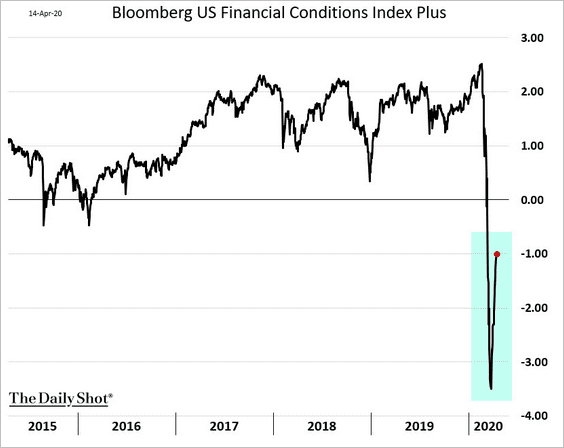
3. Other indicators also point to a massive contraction in business activity.
• Steel production:
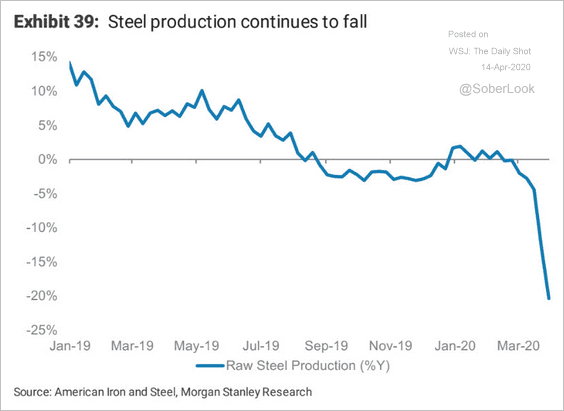 Source: Morgan Stanley Research
• The Yardeni Research Boom-Bust Barometer:
 Source: Yardeni Research
However, financial conditions appear to be easing.
——————–
4. Consumption has been contracting rapidly as households’ financial situation deteriorates.
• Survey of households:
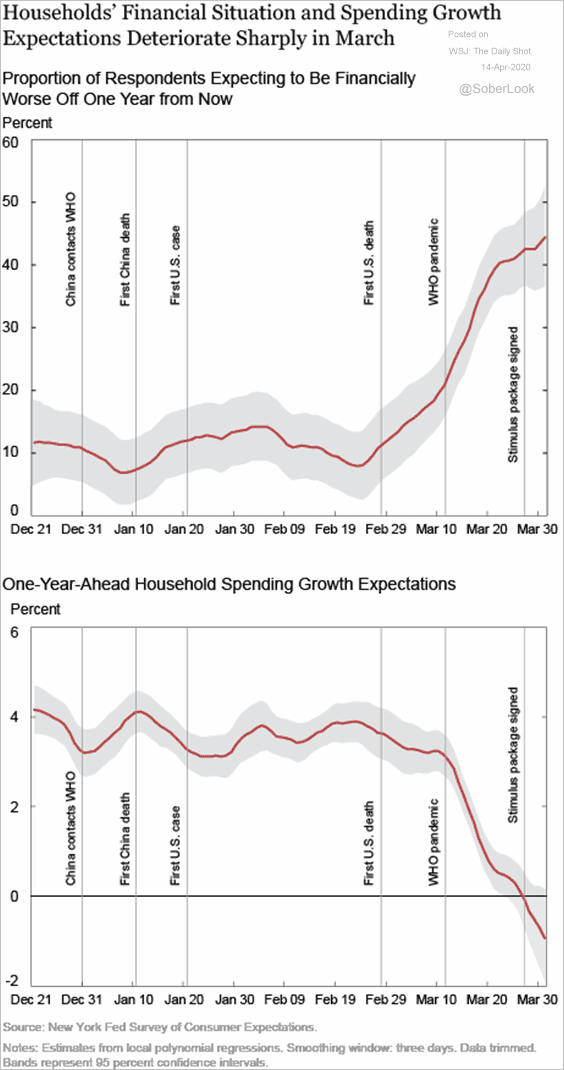 Source: Liberty Street Economics Read full article
• Morgan Stanley’s retail sales tracker:
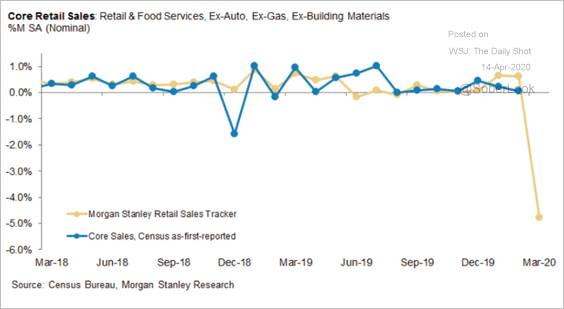 Source: Morgan Stanley Research
——————–
5. With the consumer retrenching, the GDP contraction is expected to be massive.
• Estimates from Capital Economics:
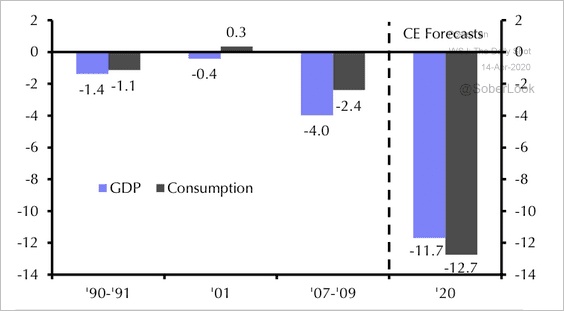 Source: Capital Economics
• The GDP trajectory forecast from Deutsche Bank:
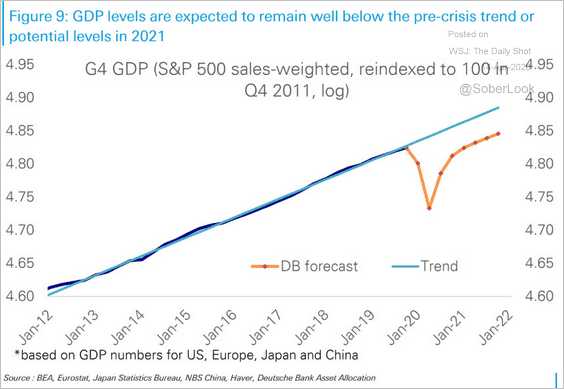 Source: Deutsche Bank Research
• The expected shape of the recession (based on the BofA Global Fund Manager Survey):
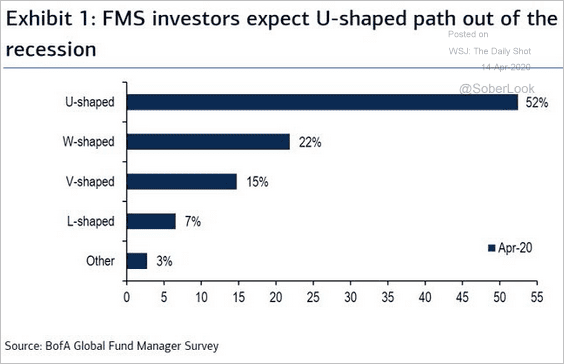 Source: @Callum_Thomas
How long do US recessions last?
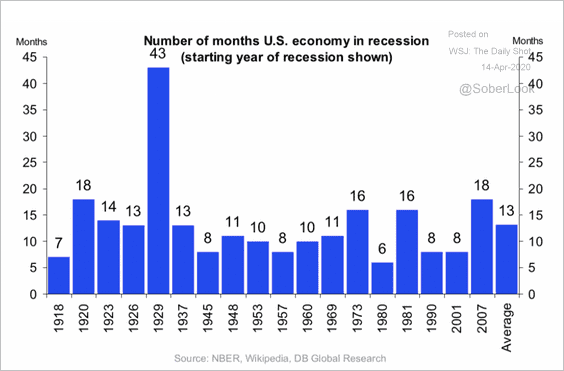 Source: Deutsche Bank Research
——————–
6. The budget deficit widened further in March.
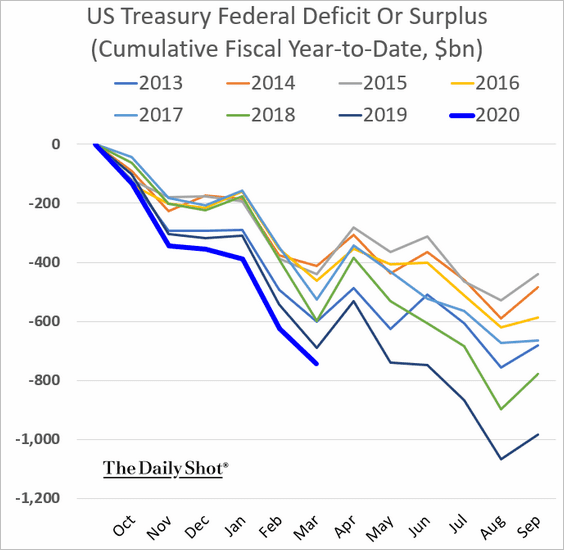
But last month’s increase was just the tip of the iceberg. The budget gap is expected to exceed WW-II levels this quarter, according to Nomura.
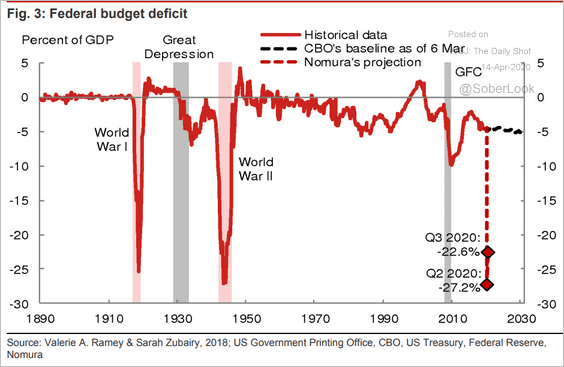 Source: Nomura Securities
Below is an estimate from Fitch for the full year.
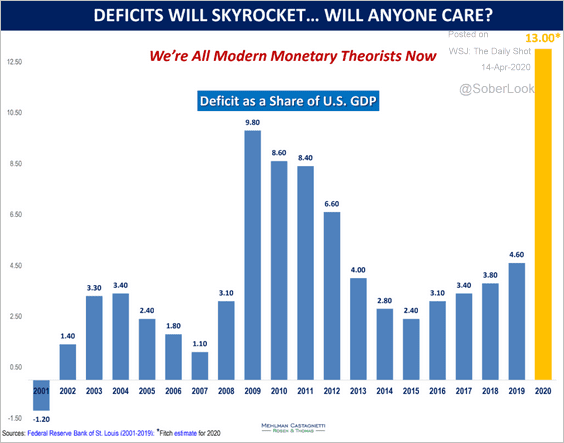 Source: Mehlman Castagnetti Rosen & Thomas Read full article
Here is how the latest US fiscal stimulus compares to other economies (% of GDP).
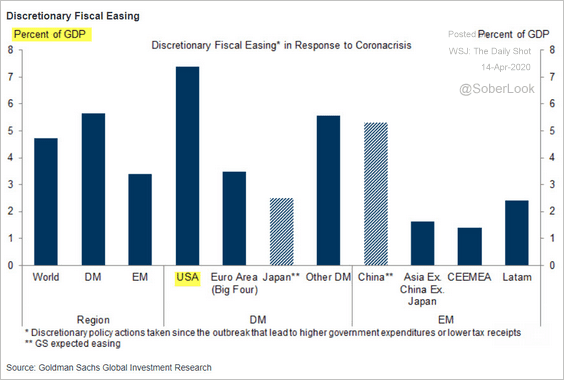 Source: Goldman Sachs
——————–
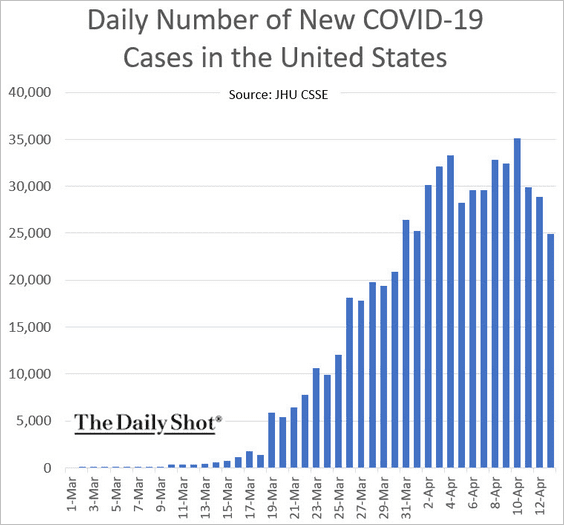
7. The number of new coronavirus cases in the US has peaked.
The United Kingdom
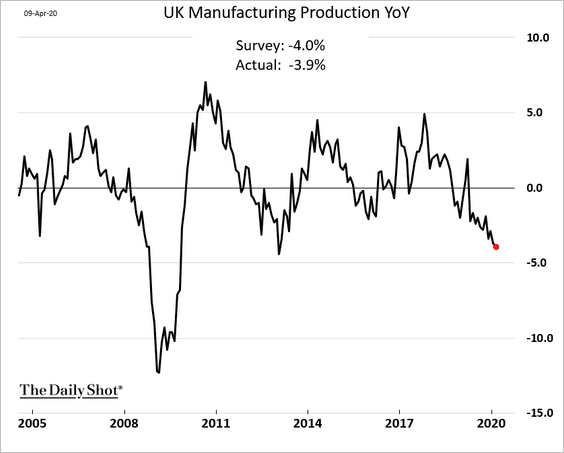
1. Factory output was already slowing going into the crisis. February production was down 3.9% from the previous year.
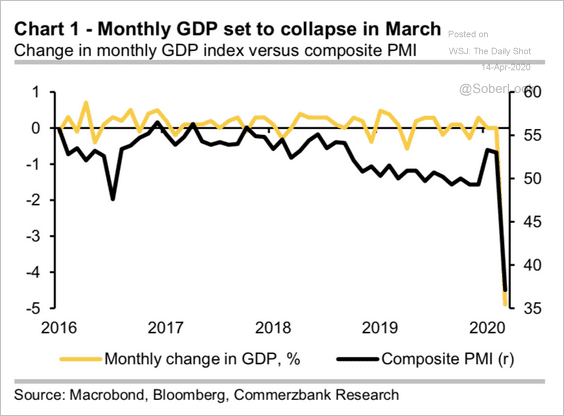
2. The PMI measures point to a sharp contraction in the GDP in March.
 Source: Commerzbank Research
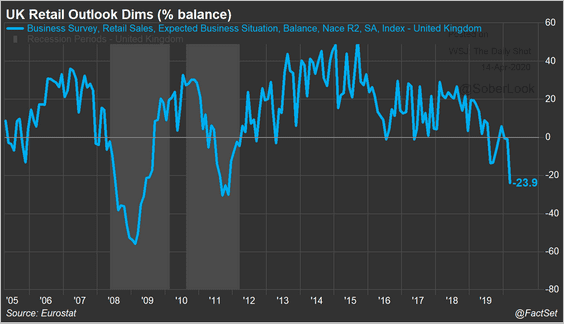
3. Retail sales have been crashing.
 Source: @FactSet Read full article
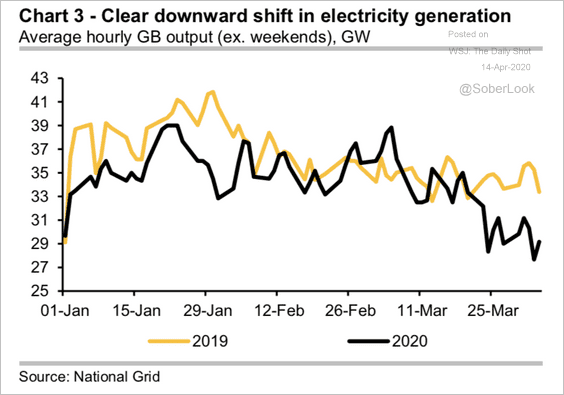
4. Electricity usage is now well below last year’s levels.
 Source: Commerzbank Research
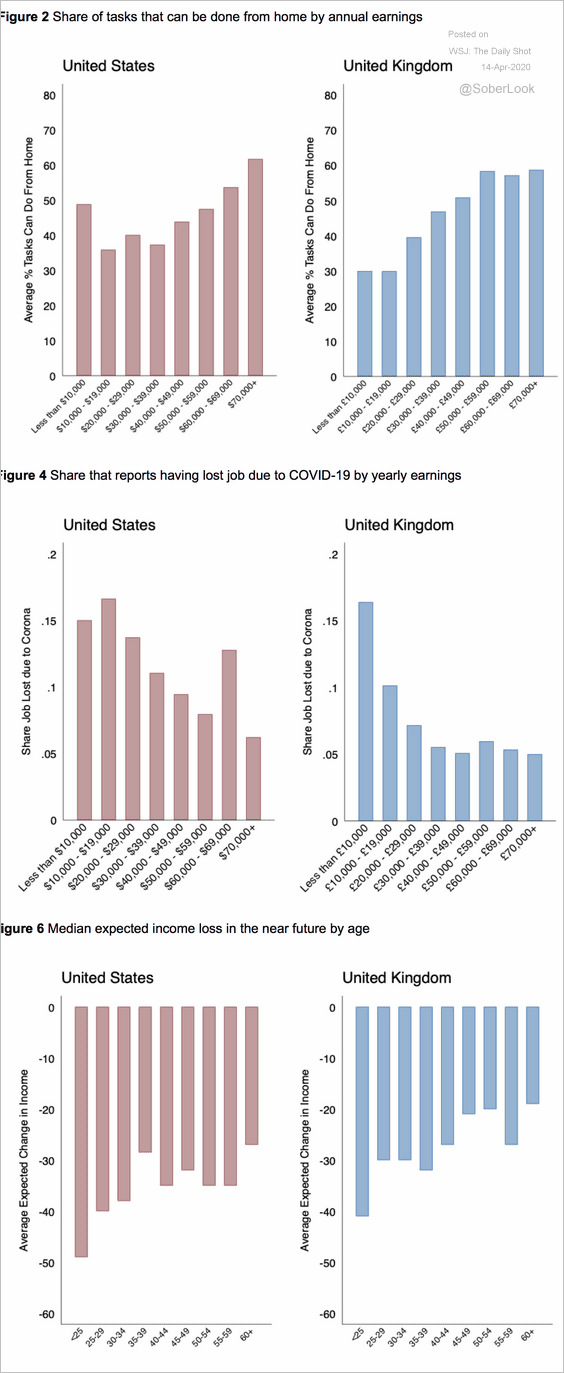
5. How are Britons doing relative to US counterparts?
 Source: @WSJ Read full article
The Eurozone
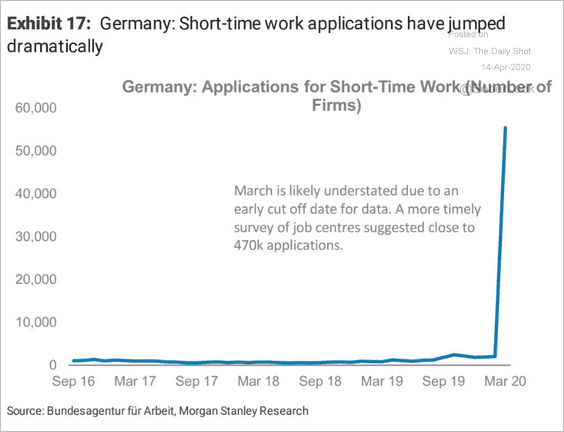
1. Germany’s applications for “short-time work” (see story) have spiked.
 Source: Morgan Stanley Research
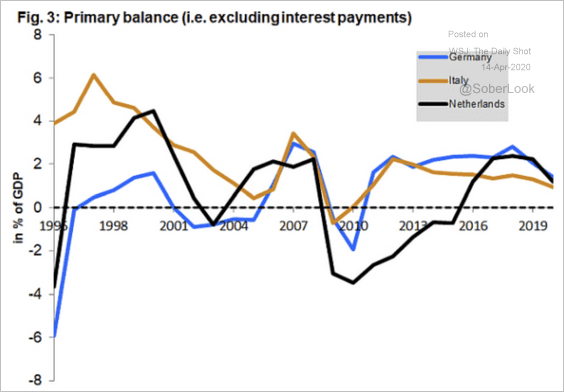
2. Since 1995, the Italian state has posted a primary surplus in 24 out of 25 years. 2009 was the only exception so far, but 2020 is likely to be another.
 Source: The Vienna Institute for International Economic Studies Read full article
3. The Eurozone GDP contraction will depend on the length of the lockdown.
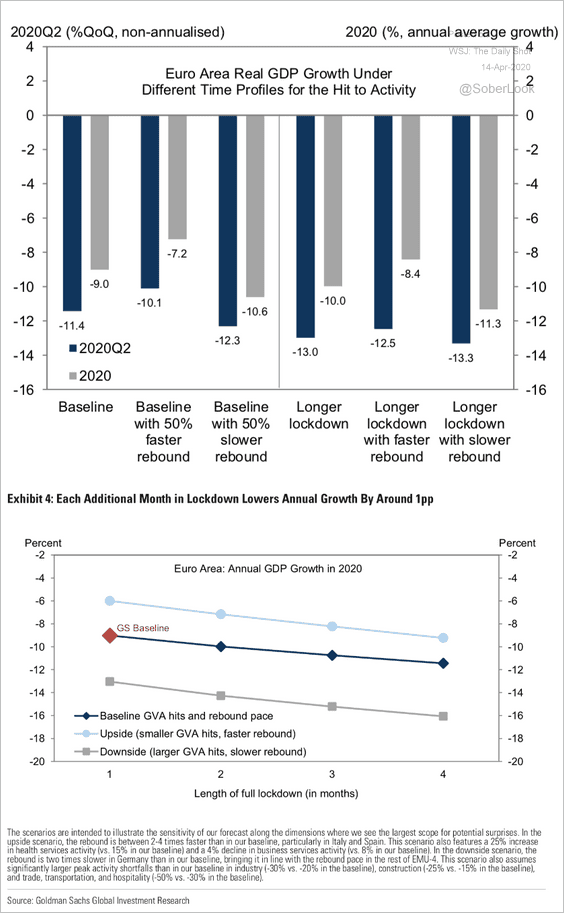 Source: Goldman Sachs
Australia
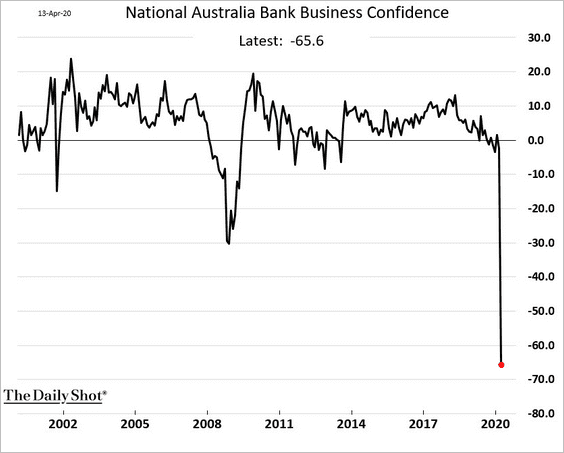
1. Business confidence has collapsed.
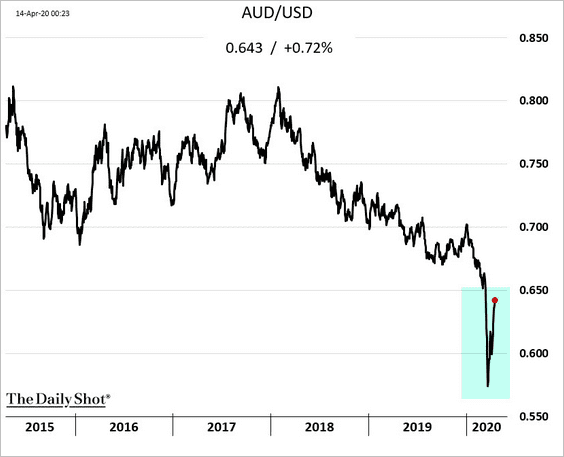
2. The Aussie dollar has been rebounding as global risk appetite improves.
China
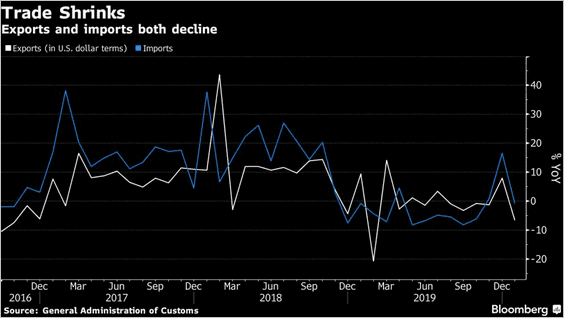
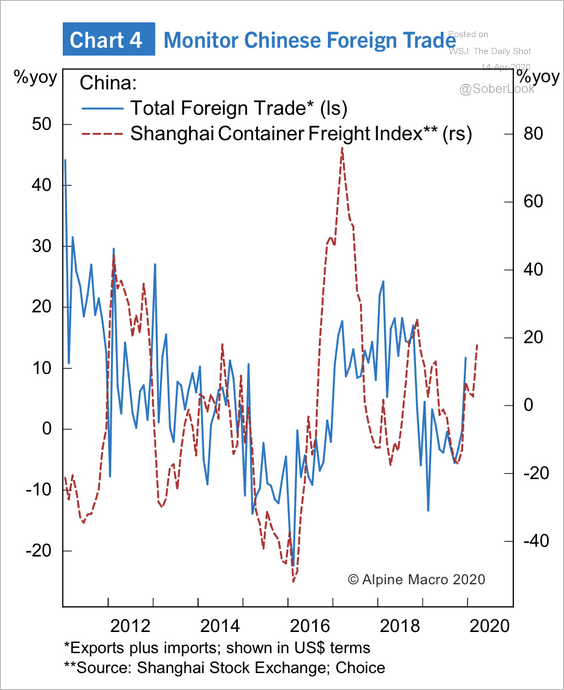
1. The decline in exports last month wasn’t as severe as economists were predicting.
 Source: @markets Read full article
The Shanghai container freight index, which historically correlates with China’s total foreign trade, has been recovering.
 Source: Alpine Macro
——————–
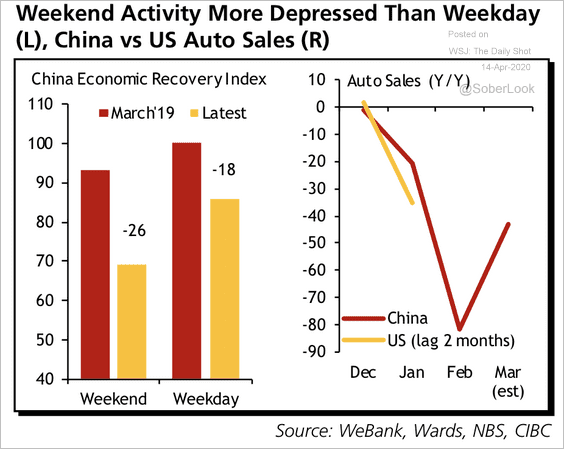
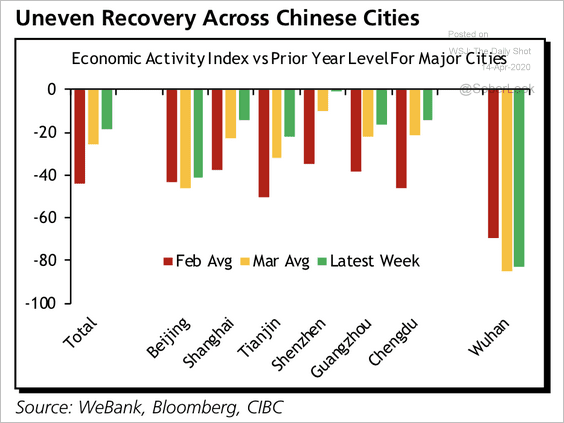
2. Economic activity is still below last year’s levels.
 Source: CIBC Capital Markets
Not all cities are recovering at the same pace.
 Source: CIBC Capital Markets
——————–
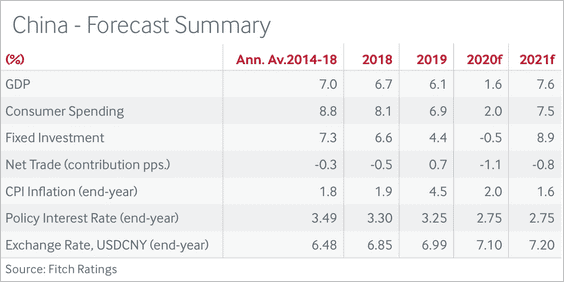
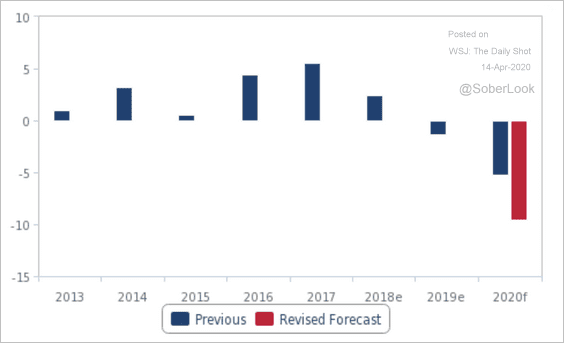
3. This table shows the latest economic forecasts from Fitch.
 Source: Fitch Solutions Macro Research
4. Cyclical stocks are no longer outperforming defensive stocks.
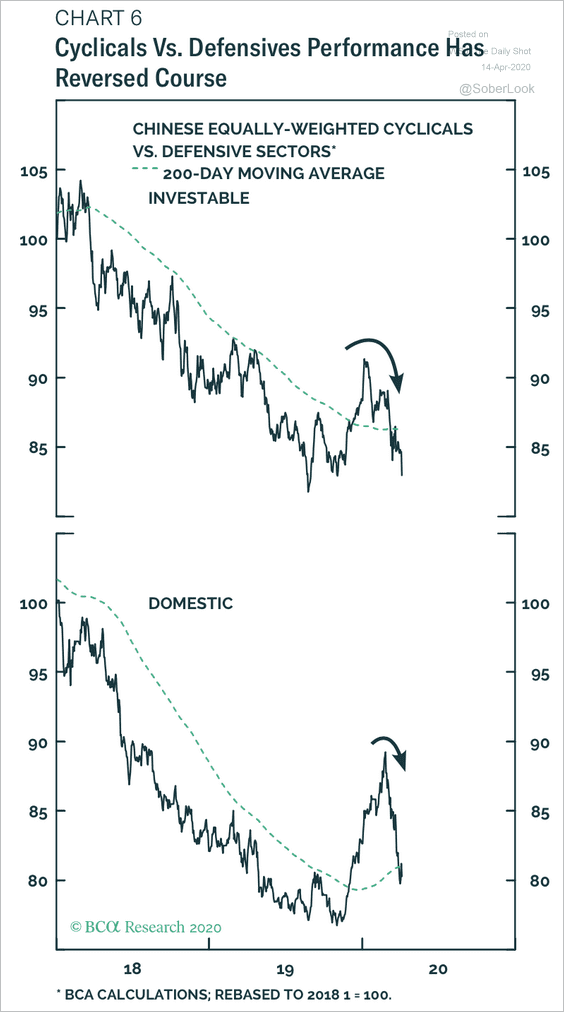 Source: BCA Research
5. Fitch expects Hong Kong’s fiscal deficit to widen further (more stimulus is likely). The chart below shows the budget balance as a percent of GDP.
 Source: Fitch Solutions Macro Research
Emerging Markets
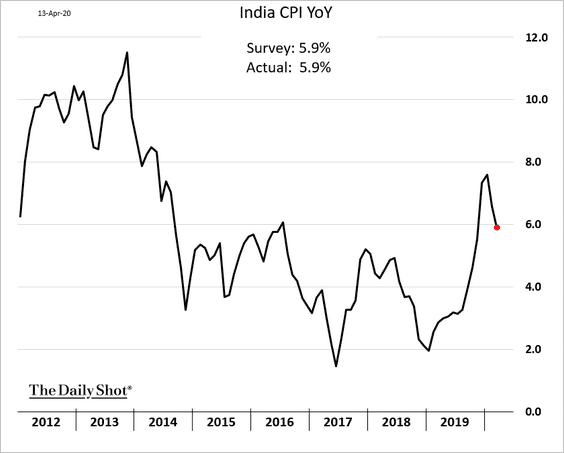
1. India’s CPI is moderating as food prices stabilize.
2. EM currencies have been falling broadly over the past few years versus the dollar (two charts).
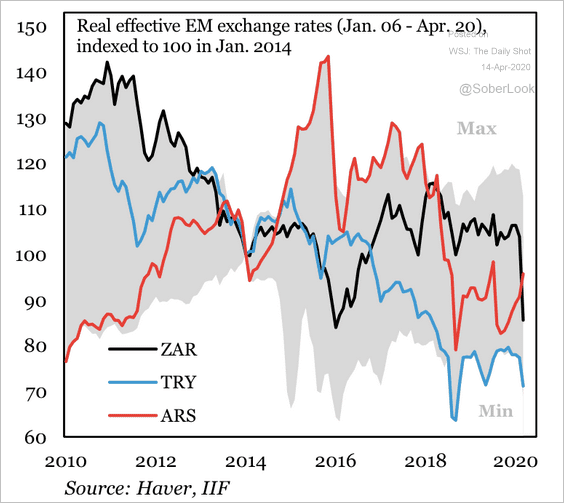 Source: IIF
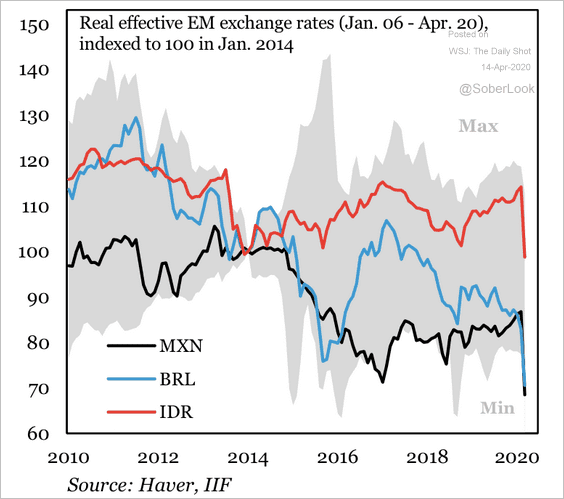 Source: IIF
——————–
3. Mexico’s and Brazil’s manufacturing activity (PMI) trends diverged a year ago.
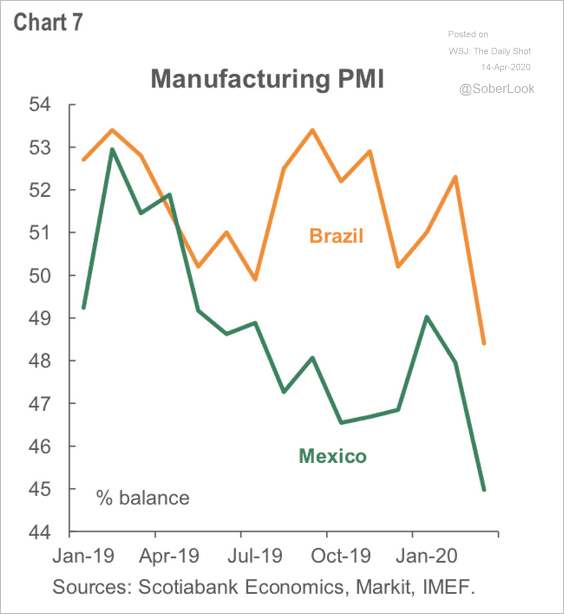 Source: Scotiabank Economics
4. This chart shows Scotiabank’s GDP forecasts for LatAm economies.
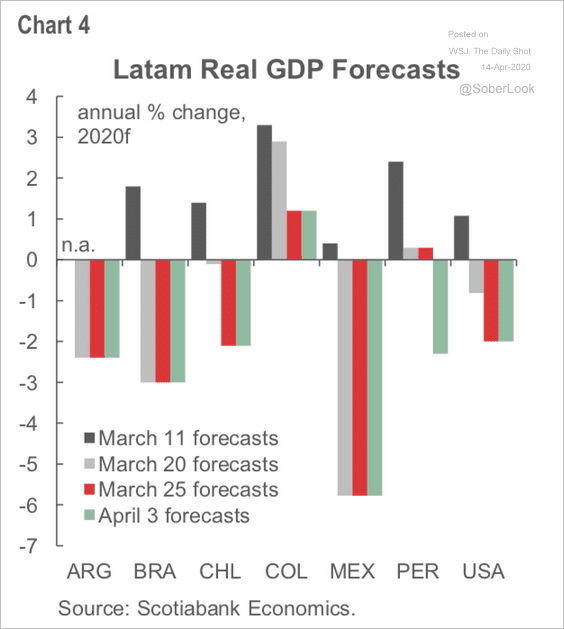 Source: Scotiabank Economics
And here is the EM GDP forecast from IIF.
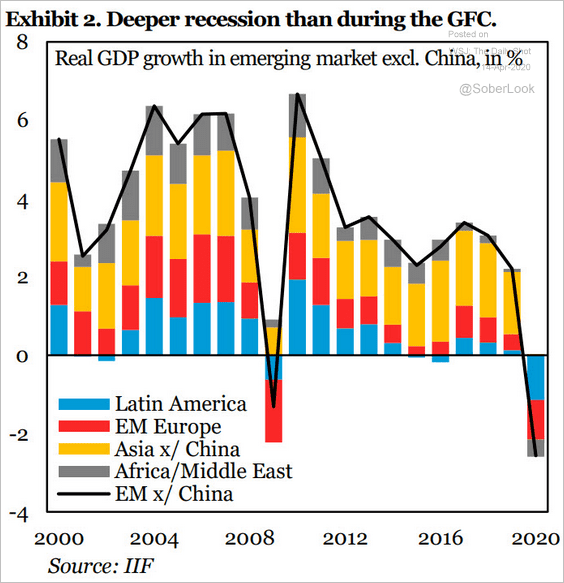 Source: IIF
——————–
5. Next, we have the year-to-date performance of EM local-currency sovereign bonds.
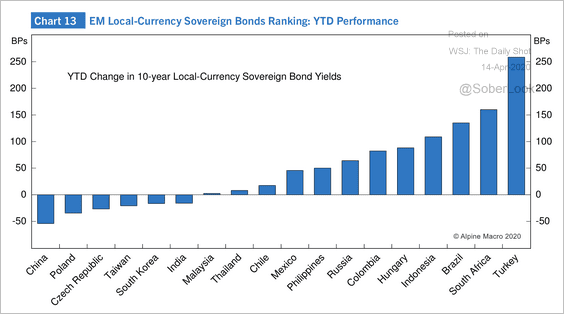 Source: Alpine Macro
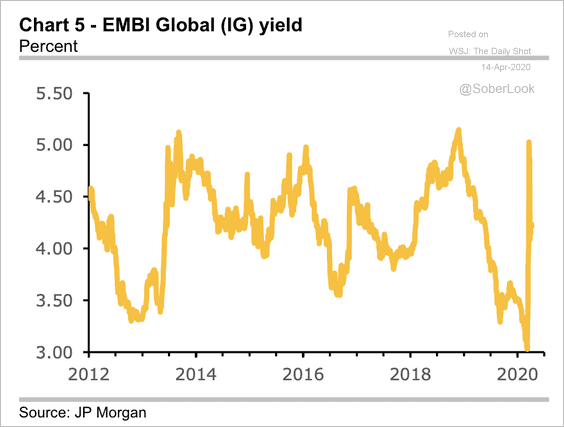
6. JP Morgan’s spread indicators for dollar debt of EM economies have shot up to levels not seen since the financial crisis.
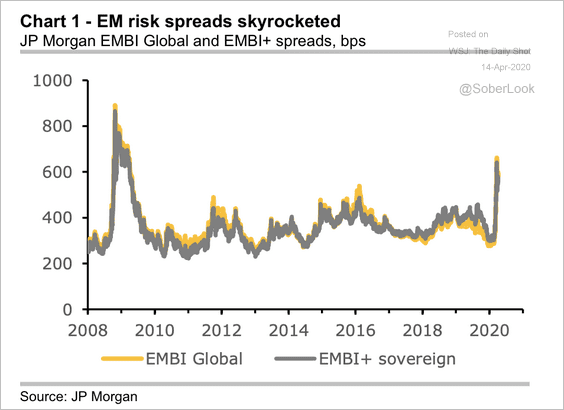 Source: JP Morgan
EM sovereign debt yields were at extremely low levels before the current crisis, which implies that a debt moratorium is less painful for creditors, according to JP Morgan. Read about the case for a moratorium on EM debt here.
 Source: JP Morgan
——————–
7. Sovereign credit downgrades have picked up momentum.
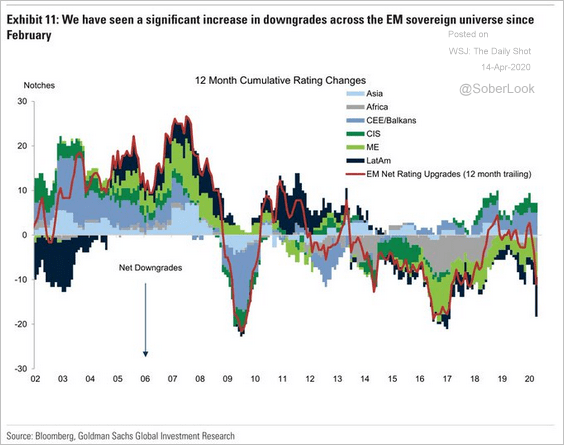 Source: Goldman Sachs, @TayTayLLP
Commodities
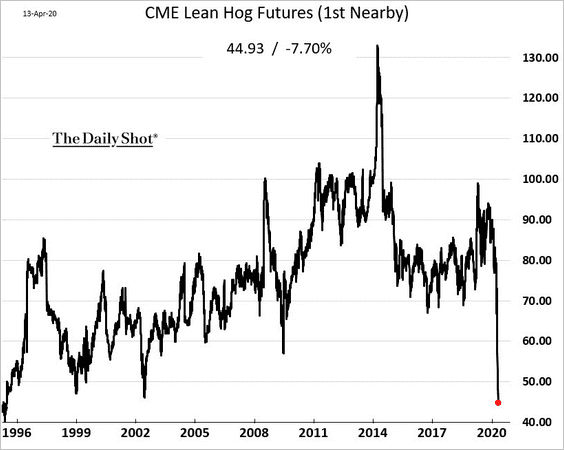
1. Gold hit the highest level since 2012.
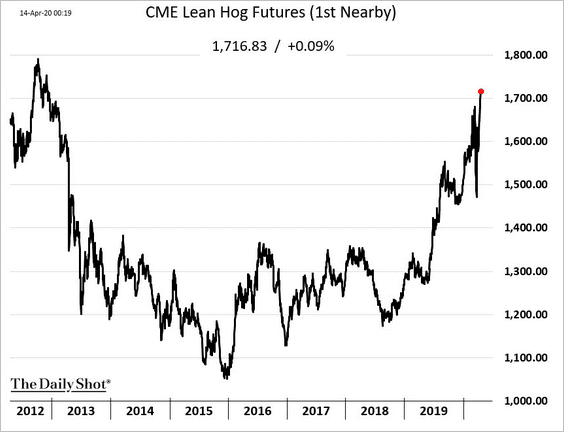
2. Lean hog futures (see overview) closed below $0.45/lb for the first time since 1995, as the Smithfield pork processing plant closed due to COVID-19.
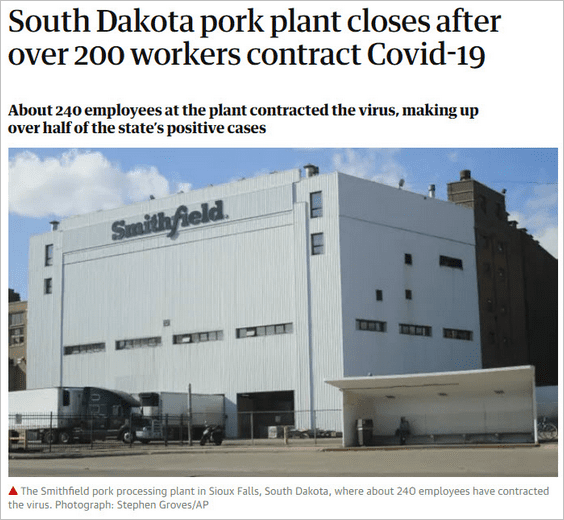 Source: The Guardian Read full article
——————–
3. Hoarding and export restrictions keep rice prices elevated.
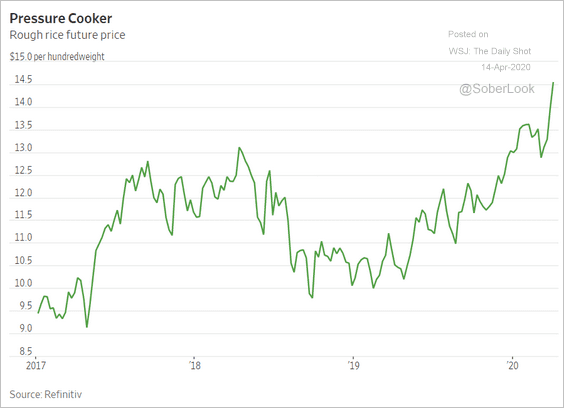 Source: @WSJ Read full article
Energy
1. The Brent contango widened after the OPEC+ deal, as the market focuses on the current oversupply.
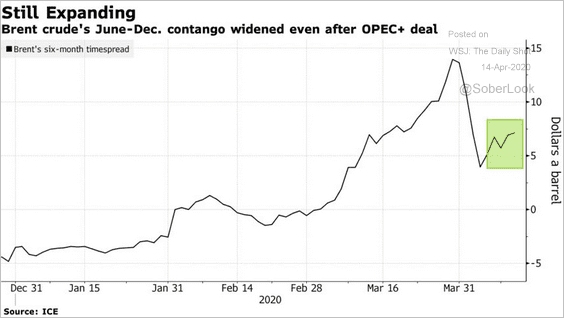 Source: @markets Read full article
2. Below are the average US breakeven oil prices needed to drill new wells or to cover operating expenses for existing wells.
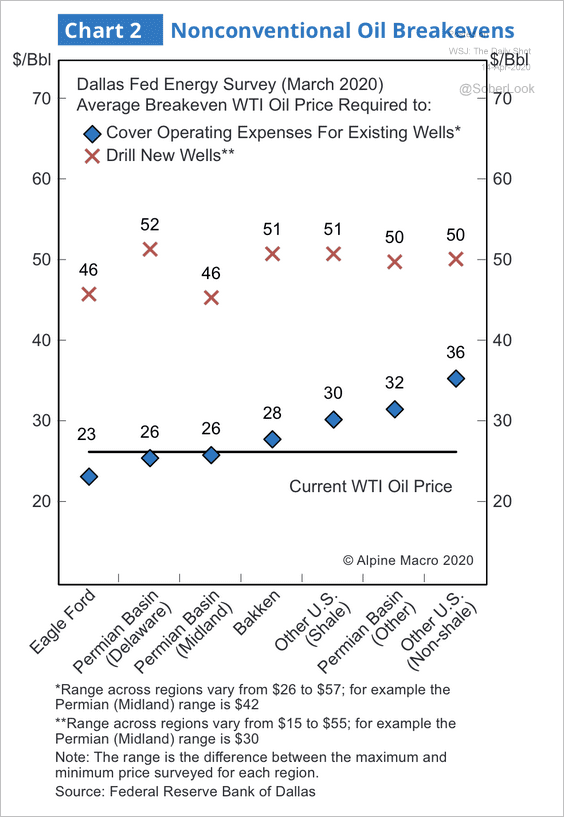 Source: Alpine Macro
3. Here is why gasoline demand has collapsed.
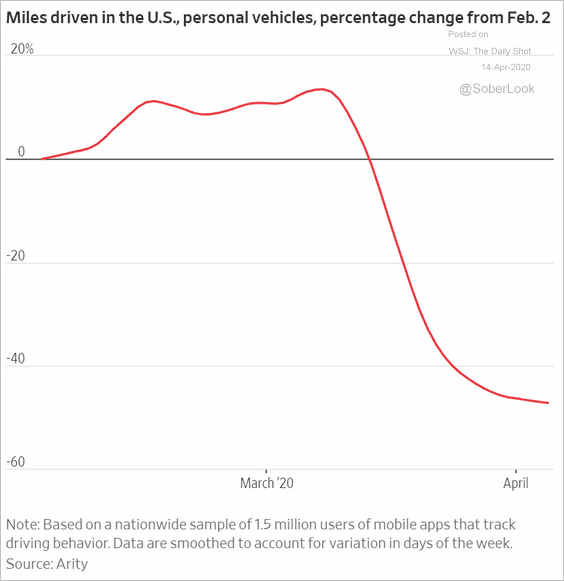 Source: @WSJ Read full article
Equities
1. Nobody expects companies to return cash to investors at this point.
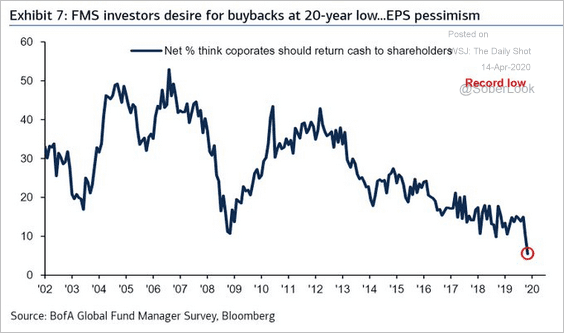 Source: BofAML, @Callum_Thomas
Companies that engaged in substantial share buybacks in the past continue to underperform.
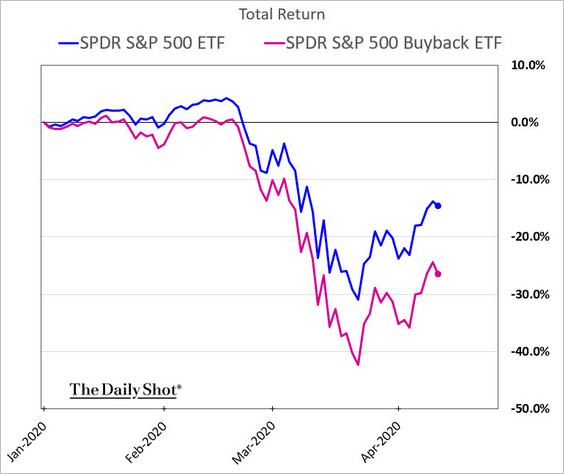
——————–
2. The “fair value” of the S&P 500 is 20% below the latest price, according to Saxo Bank.
 Source: Peter Garnry, Saxo Bank Read full article
3. How does the 2020 bear market compare to cyclical bear markets since 1900?
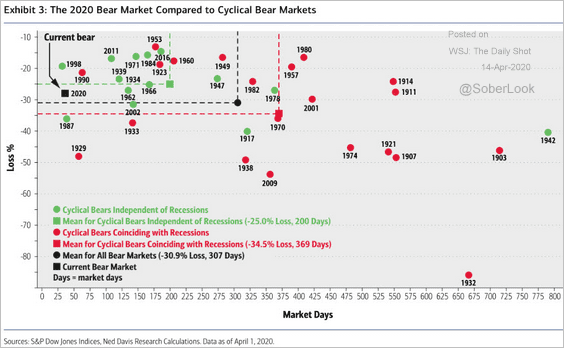 Source: BofA Merrill Lynch Global Research
4. Insiders have been buying.
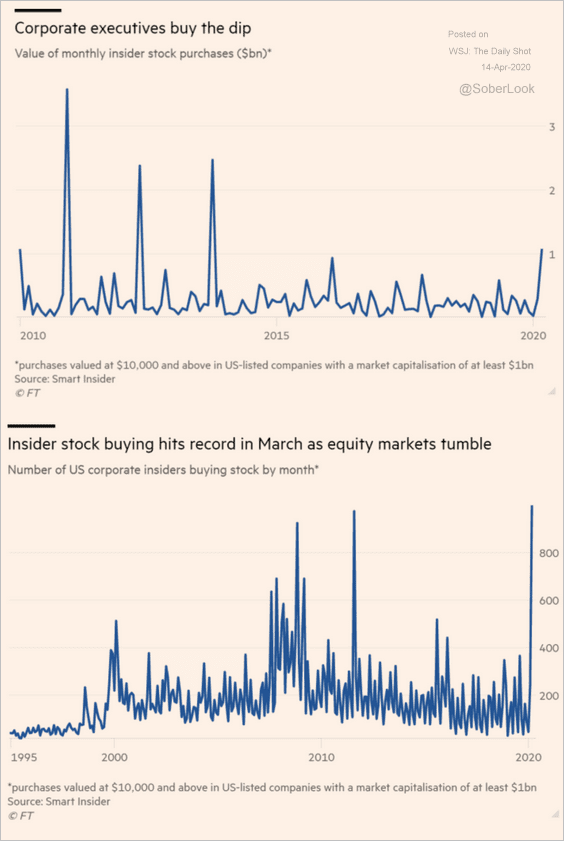 Source: @financialtimes Read full article
5. Here is how global fund managers are positioned.
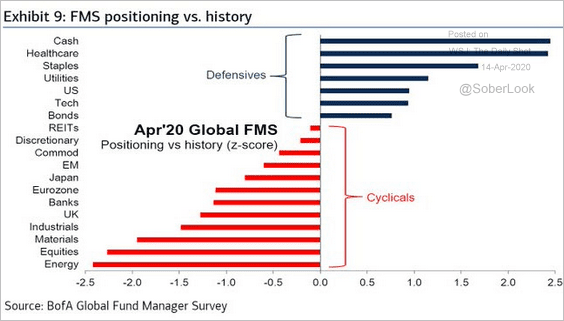 Source: BofAML, @Callum_Thomas
Credit
1. Bank provisions are expected to rise.
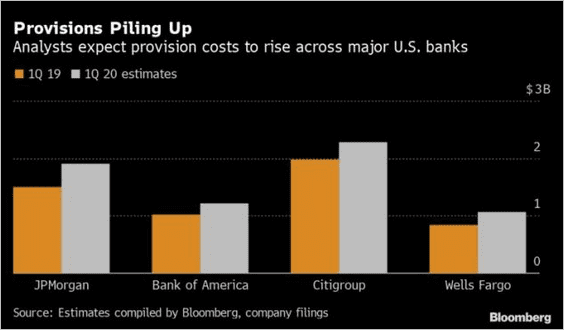 Source: Bloomberg Law Read full article
But the US banking system is operating with considerably less leverage than it did in the 1980s and 1990s.
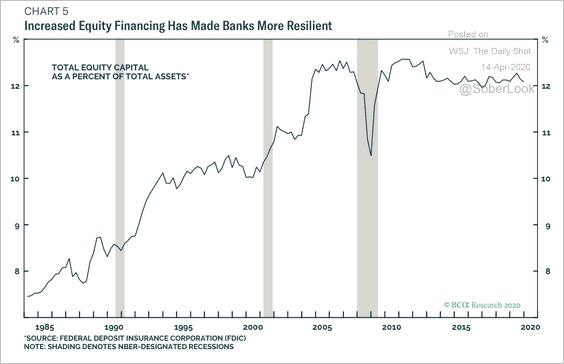 Source: BCA Research
——————–
2. BDC assets experienced tremendous growth over the past decade.
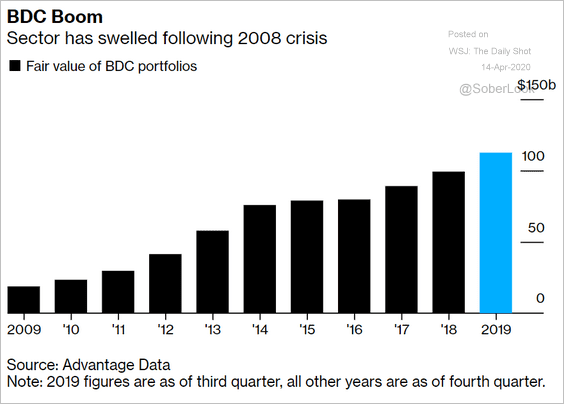 Source: @markets Read full article
3. 10% to 20% of the CLOs rated by Moody’s are highly vulnerable to the current crisis.
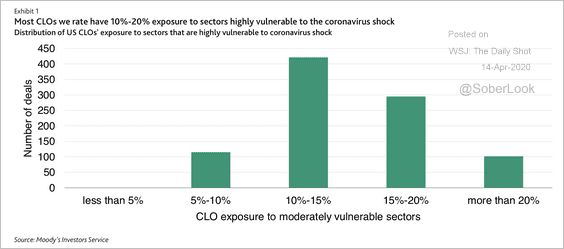 Source: Moody’s Investors Service
4. Many energy and consumer investment-grade companies have a high probability of being classified as high-yield, according to Arbor Data Science.
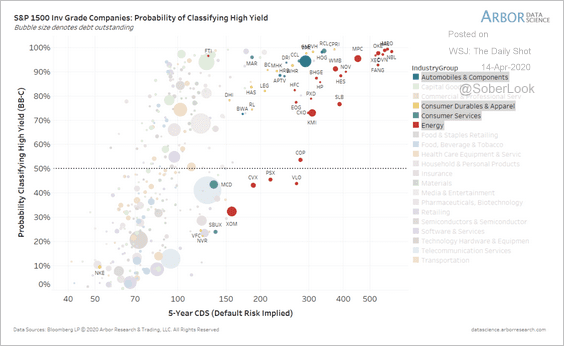 Source: Arbor Research & Trading
Global Developments
1. JP Morgan expects at least a $5.5 trillion loss in global output.
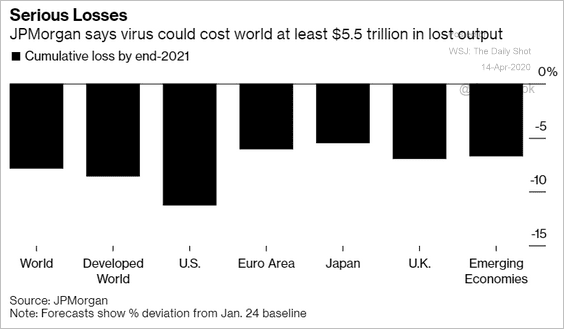 Source: @markets Read full article
High-frequency data point to an extreme contraction in economic activity.
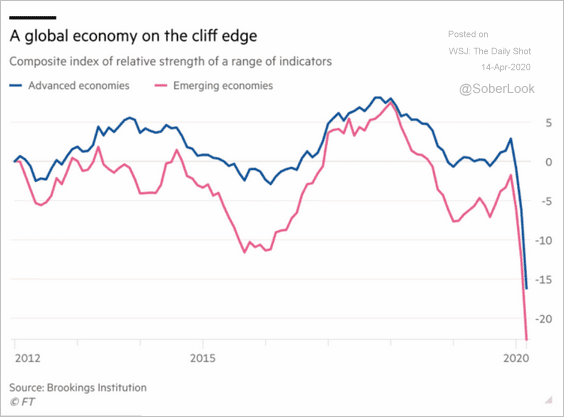 Source: @financialtimes Read full article
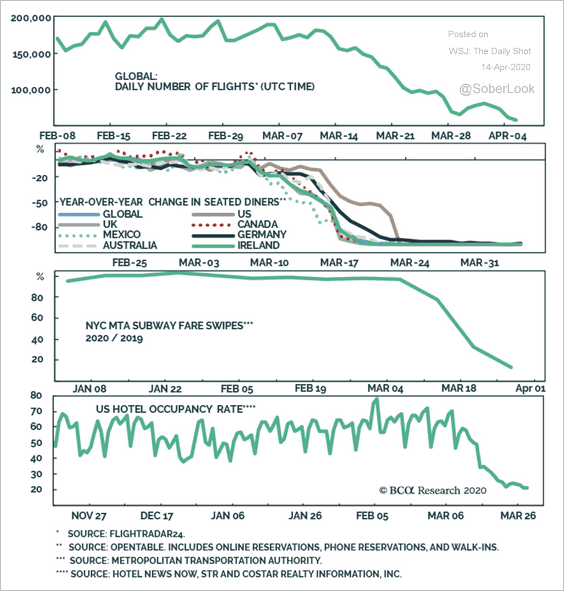 Source: BCA Research
——————–
2. Next, we have a couple of scenarios for global trade.
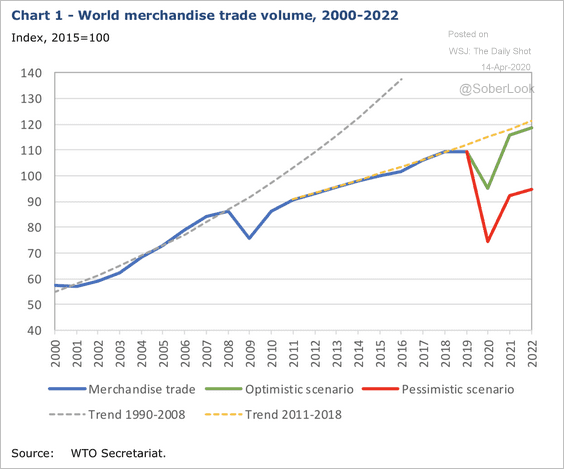 Source: WTO Read full article
3. Based on Google search trends, consumers have lost interest in autos, apparel, and home furnishings but are paying a bit more attention to electronics and home appliances.
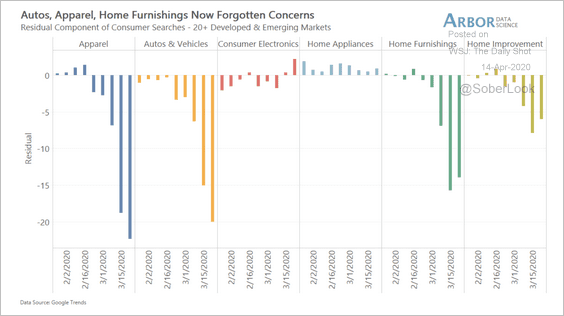 Source: Arbor Research & Trading
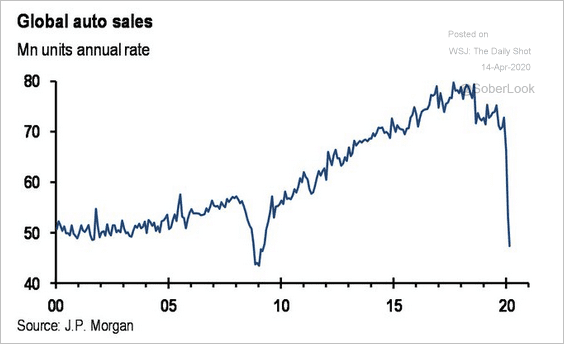
This chart shows global auto sales.
 Source: @carlquintanilla, JP Morgan
——————–
Food for Thought
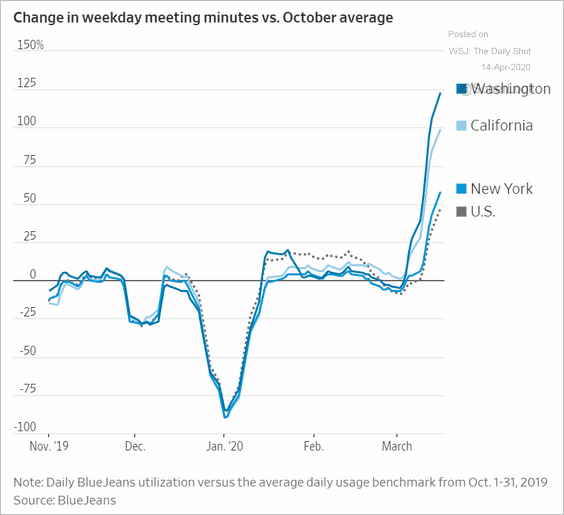
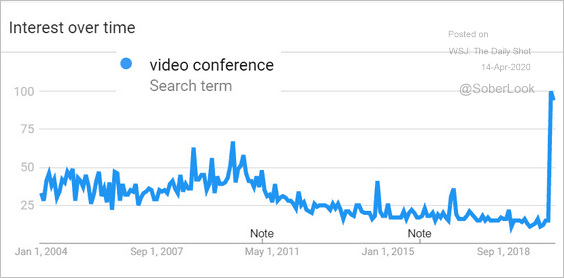
1. Video conferencing:
 Source: @WSJ Read full article
Google search activity for “video conference” (since 2004):
 Source: Google Trends
——————–
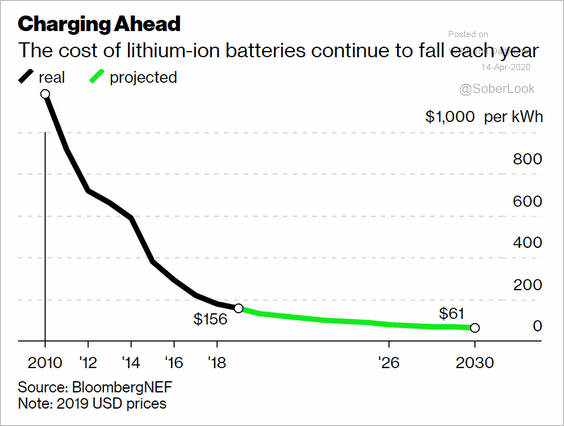
2. Lithium-ion battery costs:
 Source: @business Read full article
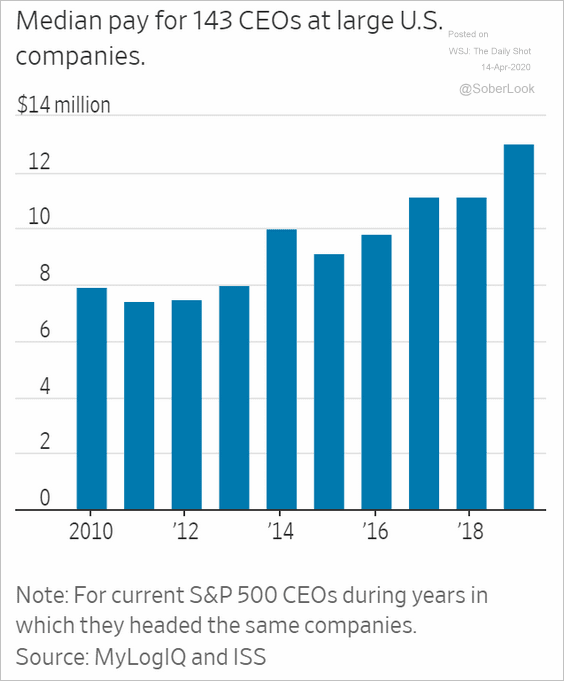
3. CEO pay at large US firms:
 Source: @WSJ Read full article
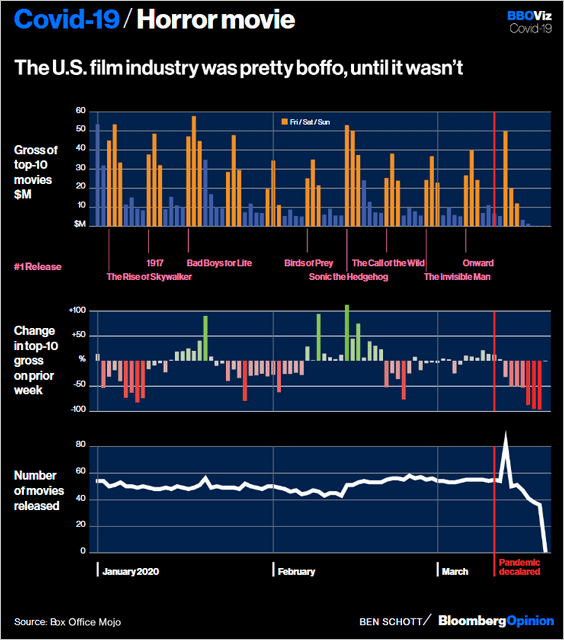
4. The US film industry:
 Source: @bopinion Read full article
5. Seniors living alone:
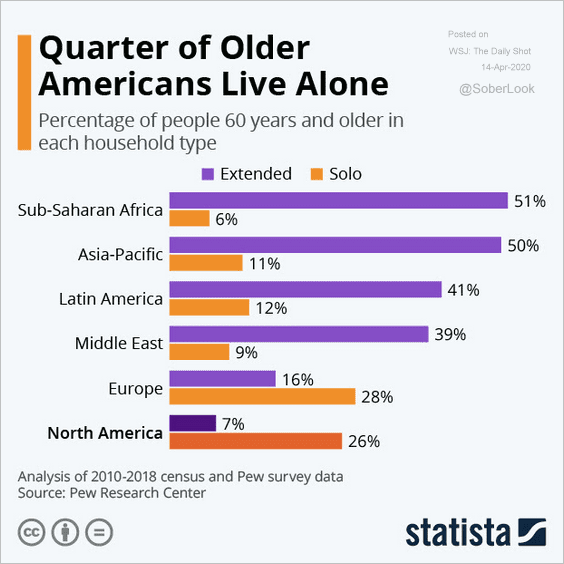 Source: Statista
6. Support for governors:
 Source: @WSJ Read full article
7. Views on the US economy:
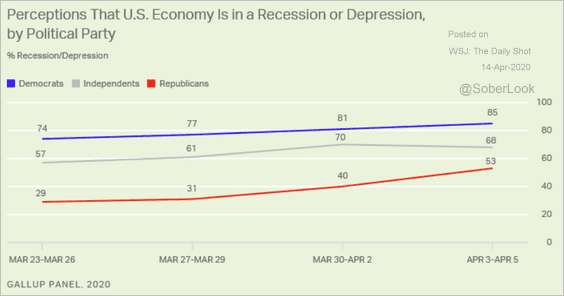 Source: Gallup Read full article
8. Alcohol-induced deaths:
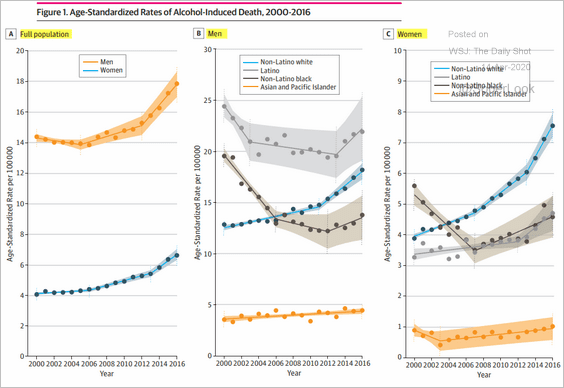 Source: @PotResearch, JAMA Network Read full article
9. Threats to freedoms?
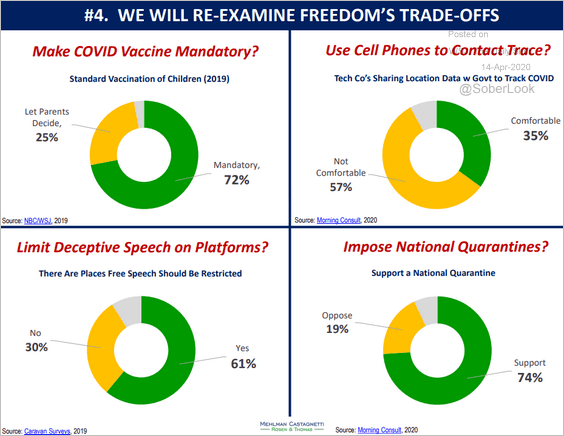 Source: Mehlman Castagnetti Rosen & Thomas Read full article
10. Interest in baking:
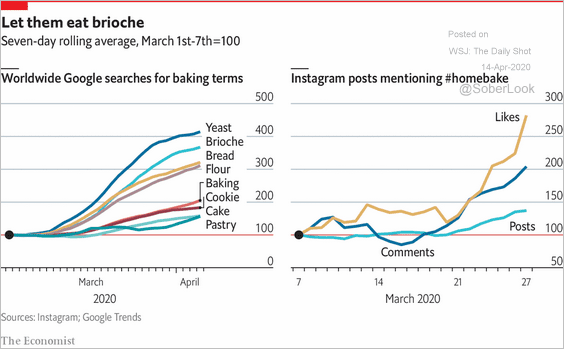 Source: The Economist Read full article
——————–