
The Daily Shot: 16-Apr-20
• Energy
• Commodities
• Equities
• Credit
• Rates
• Emerging Markets
• China
• Asia – Pacific
• Canada
• The United States
• Global Developments
• Food for Thought
Energy
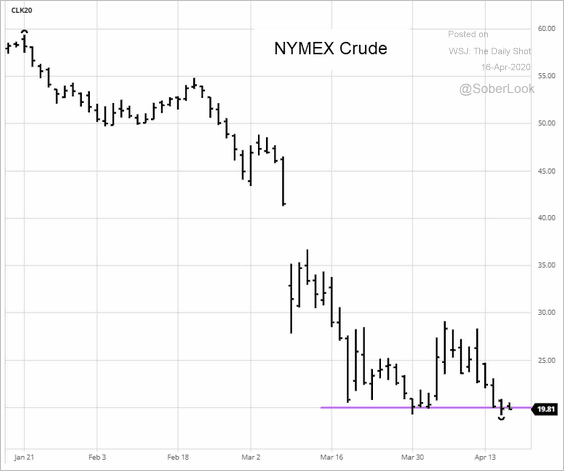
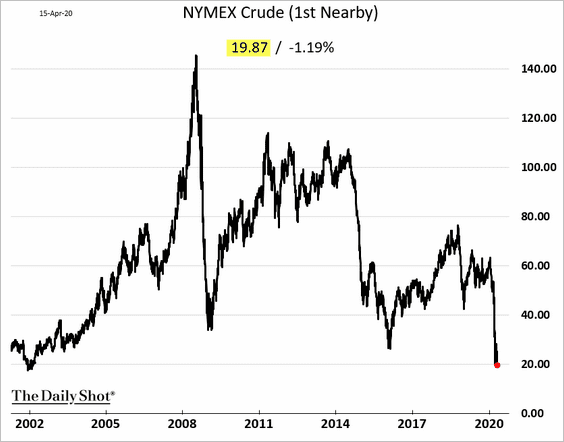
1. US crude oil futures are testing the $20/bbl support again, trading near the lowest level since 2002. The market remains skeptical about the recently announced production cuts.
 Source: barchart.com
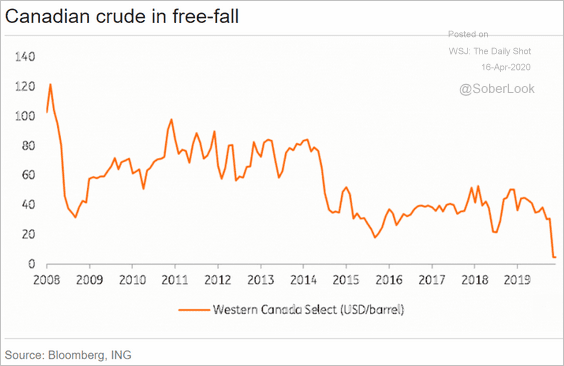
Here is Canadian crude.
 Source: ING
——————–
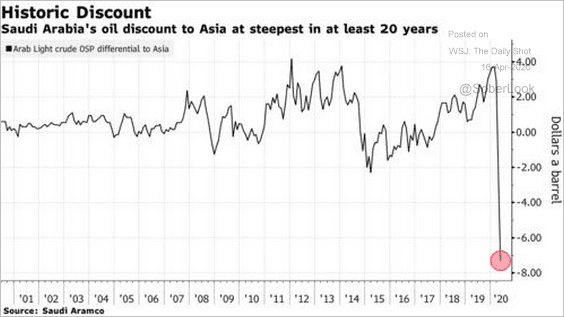
2. With global producers agreeing to cut output, will the Saudis ease their crude oil discount?
 Source: @markets Read full article
3. US petroleum products demand continues to fall.
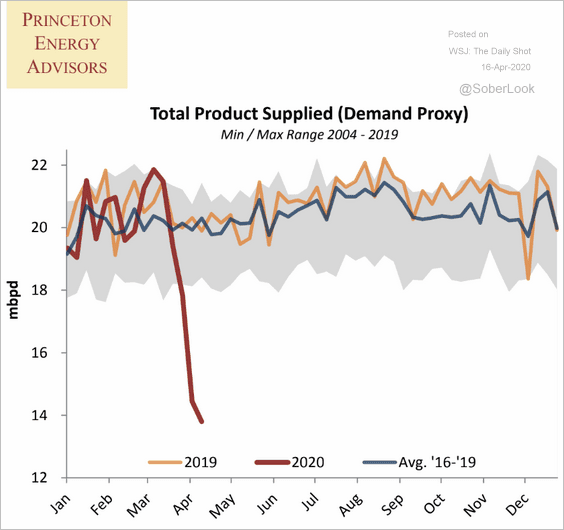 Source: Princeton Energy Advisors
However, gasoline demand seems to have bottomed.
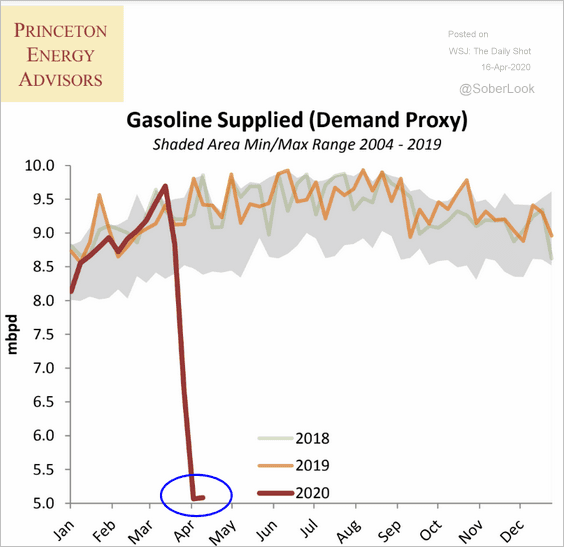 Source: Princeton Energy Advisors
——————–
4. Refinery inputs keep moving lower.
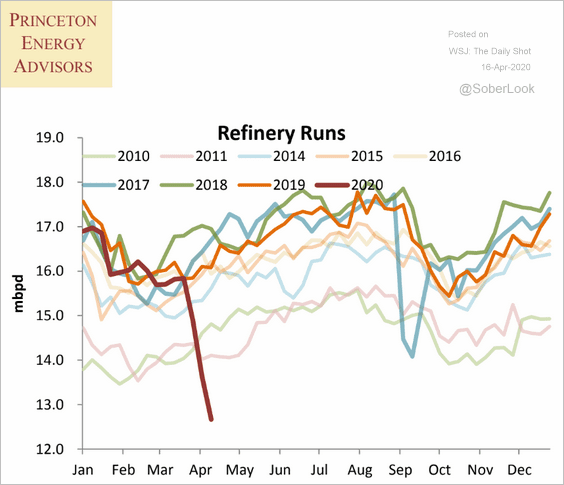 Source: Princeton Energy Advisors
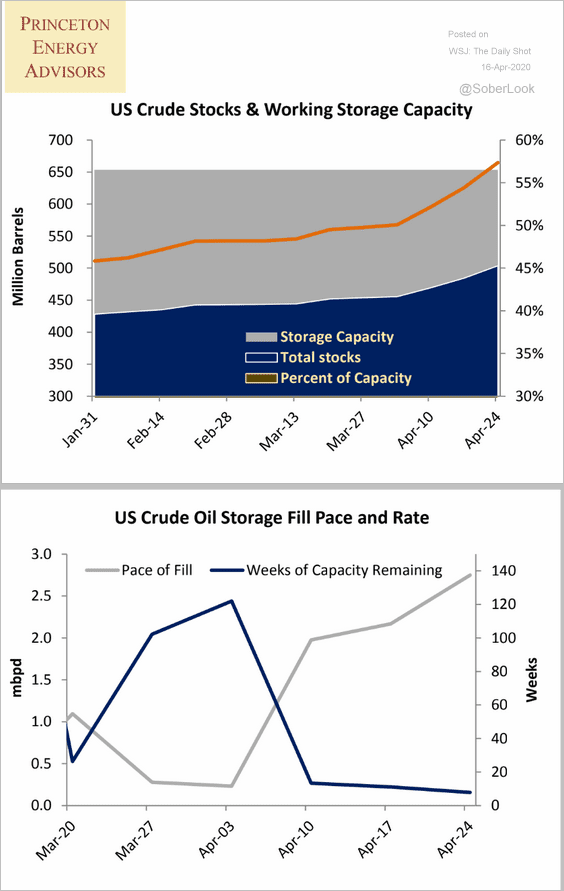
5. The charts below show US crude oil and gasoline inventories, measured in days of supply.
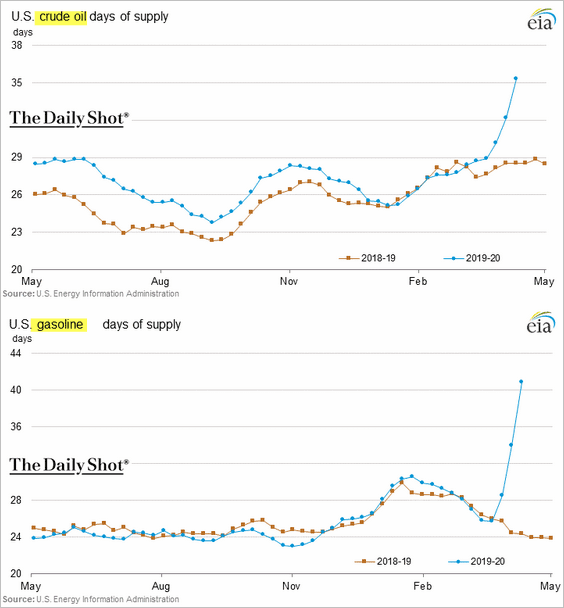
Crude oil storage facilities are getting filled quickly.
 Source: Princeton Energy Advisors
——————–
6. The slump in global liquids production this year will be unprecedented.
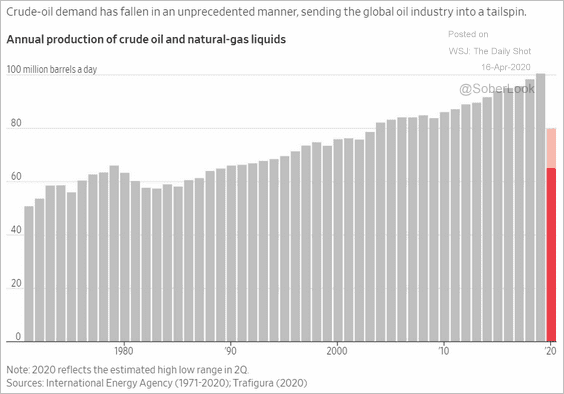 Source: @WSJ Read full article
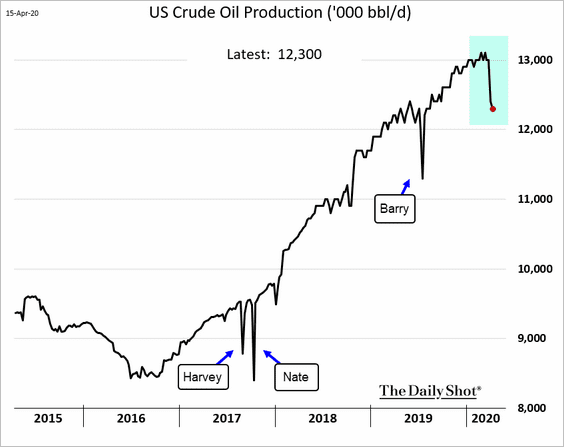
In the US, the output decline has just started.
Commodities
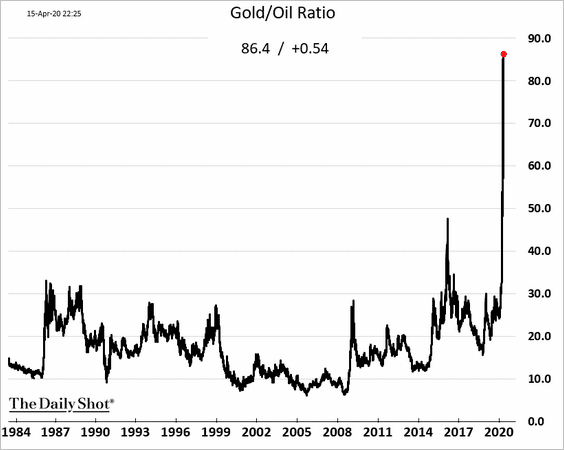
1. The gold-to-oil ratio continues to rise.
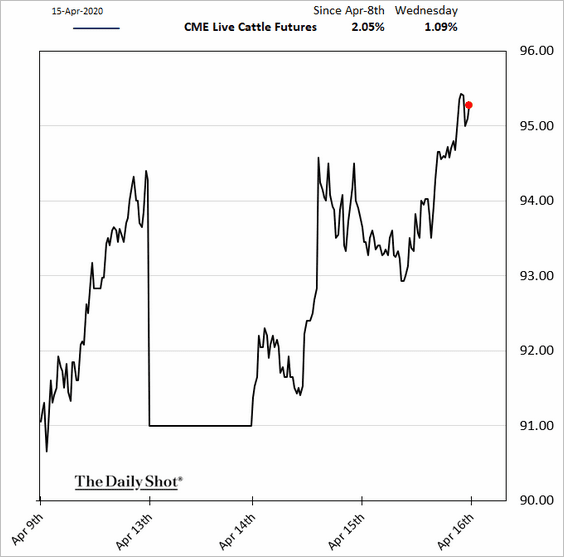
2. The US government may end up buying meat and milk products.
 Source: Reuters Read full article
Livestock futures have stabilized.
Equities
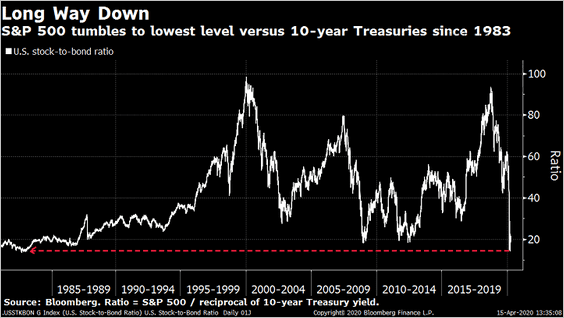
1. The S&P 500 reached its lowest level versus 10-year Treasuries since 1983.
 Source: @TheOneDave
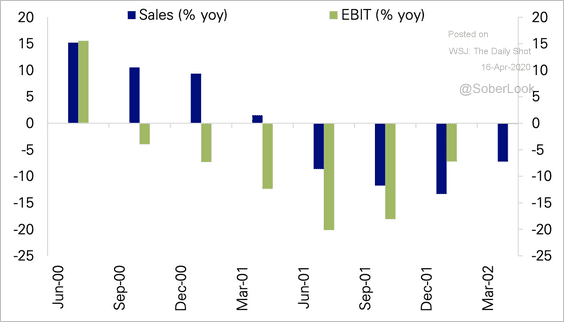
2. Earnings growth slowed well before sales growth in past recessions (such as in 2001), according to Deutsche Bank.
 Source: Deutsche Bank Research
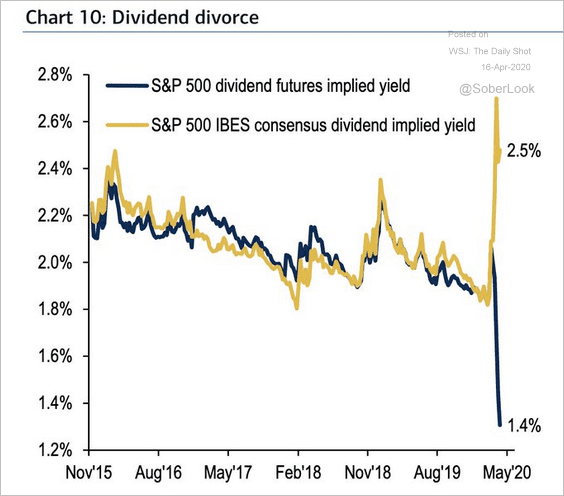
3. Dividend futures have diverged from consensus dividend yield estimates.
 Source: BofA Merrill Lynch Global Research, @RobinWigg
4. Discount brokers saw a massive increase in trading volumes this year.
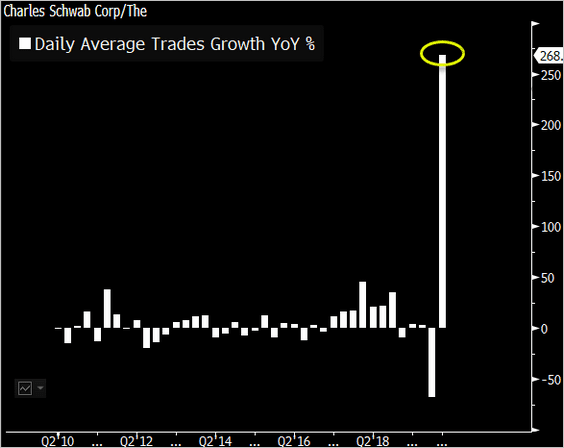 Source: @EricBalchunas, @mbarna6
5. Small caps’ proportion of the total US market is near multi-decade lows.
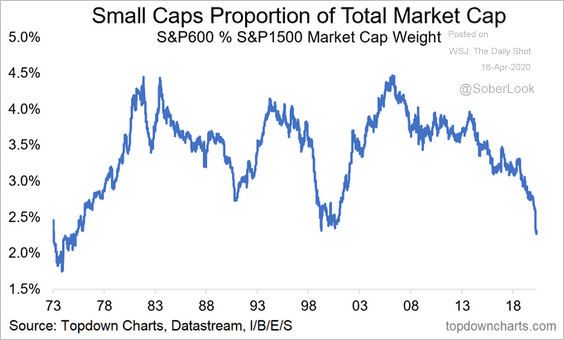 Source: @topdowncharts Read full article
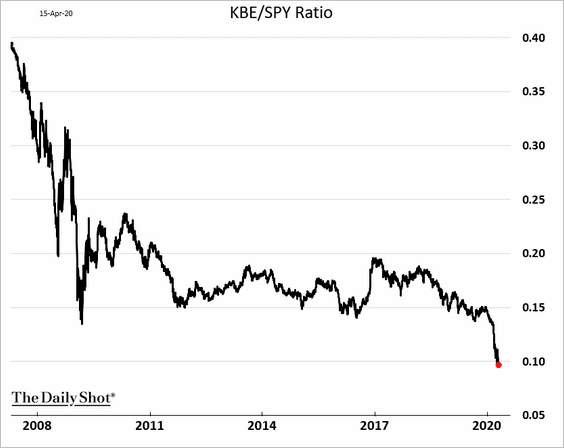
6. Banks continue to underperform. This chart shows the ratio of the SPDR banks ETF to the S&P 500 ETF.
Credit
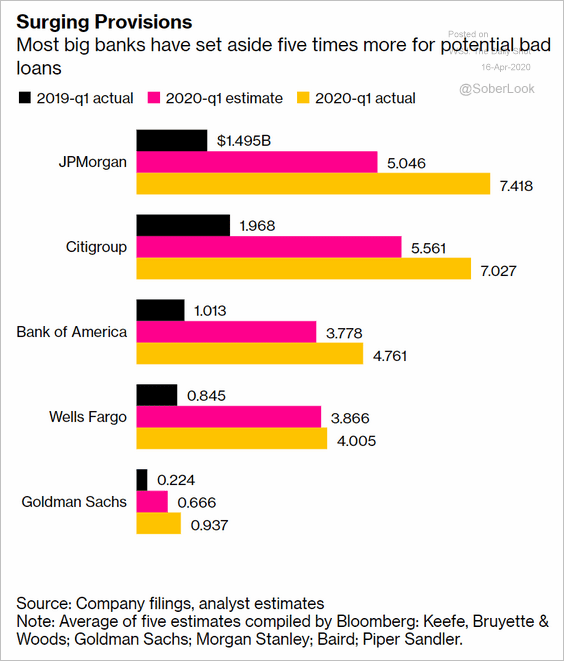
1. US banks’ credit loss provisions are piling up.
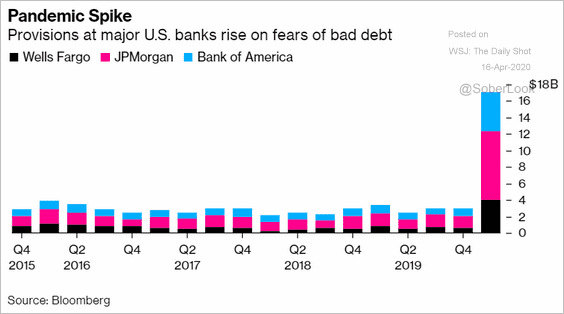 Source: @business Read full article
 Source: @markets Read full article
——————–
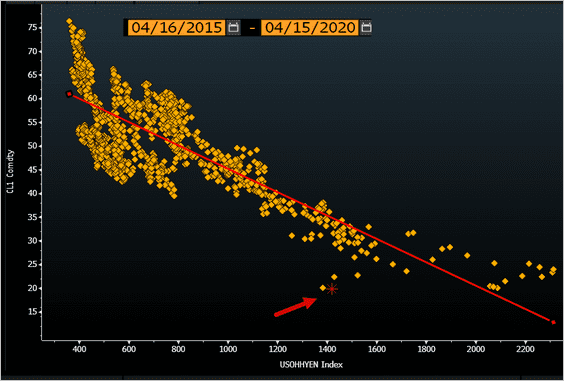
2. Are energy-sector bond spreads too tight? The scatterplot below shows the US crude oil price (y-axis) vs. energy high-yield spreads (x-axis).
 Source: @TheTerminal
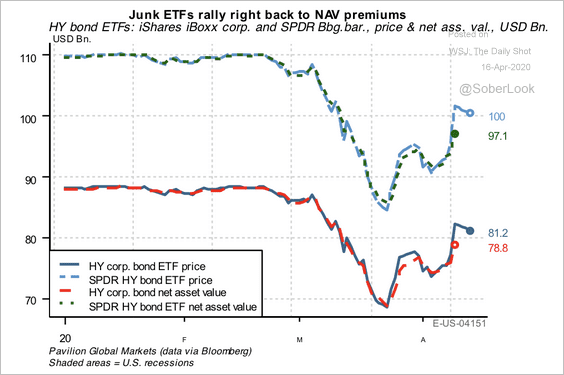
3. Junk bond ETFs now trade at a premium to their net asset values (NAV).
 Source: Pavilion Global Markets
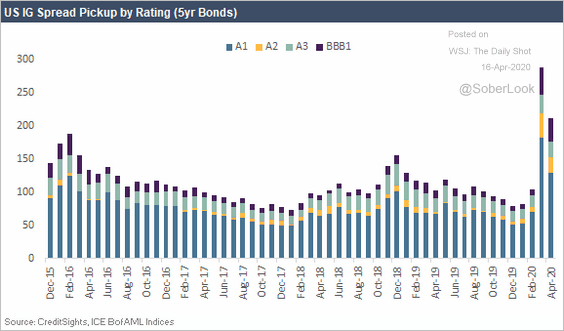
4. This chart shows investment-grade spreads by rating.
 Source: CreditSights
5. ABS spreads have narrowed significantly, suggesting that the Fed’s Term Asset-Backed Securities Loan Facility (TALF) is already having an impact.
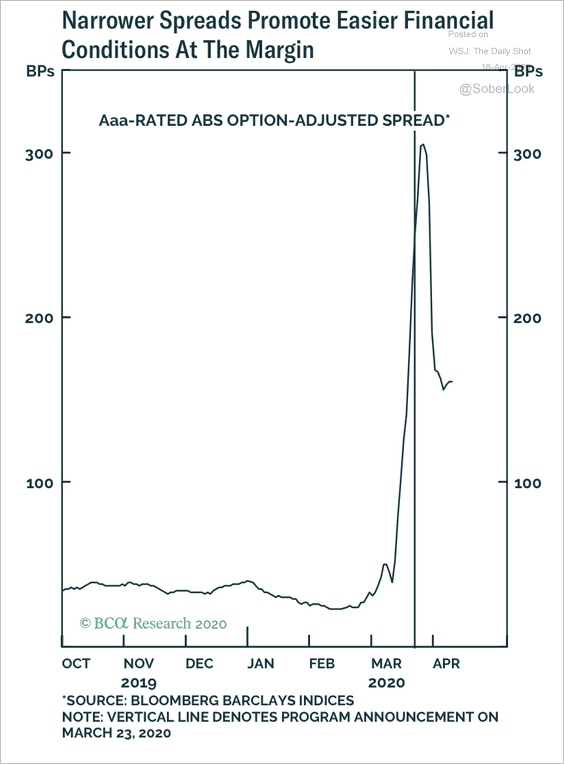 Source: BCA Research
AAA-rated commercial mortgage-backed securities (CMBS) are also TALF-eligible (see story).
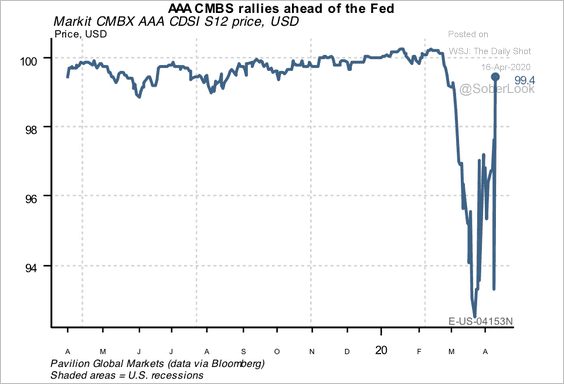 Source: Pavilion Global Markets
——————–
6. The spread between the current-coupon agency MBS and the 10-year Treasury yield has tightened, but mortgage rates still don’t fully reflect the improvement.
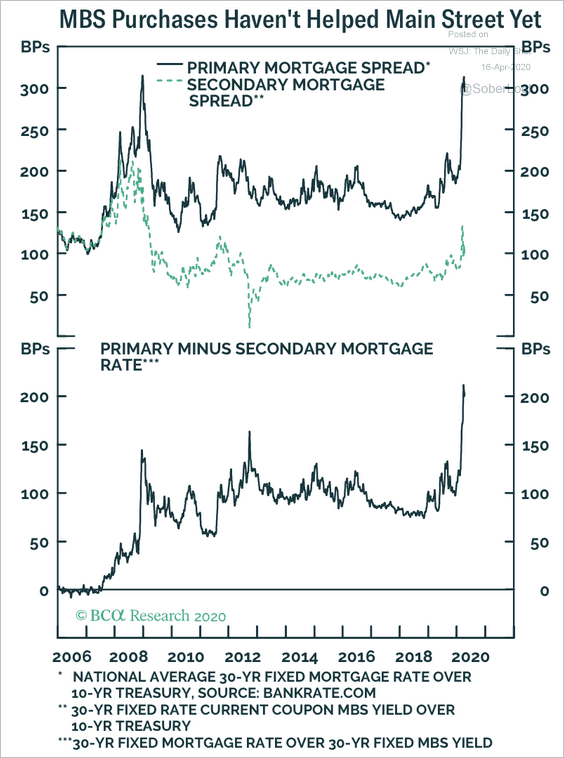 Source: BCA Research
Rates
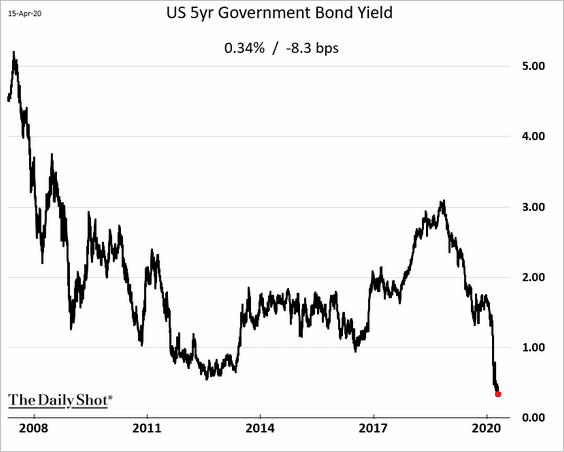
1. The 5-year Treasury yield hit a record low.
2. Foreign holdings of Treasury securities continue to climb.
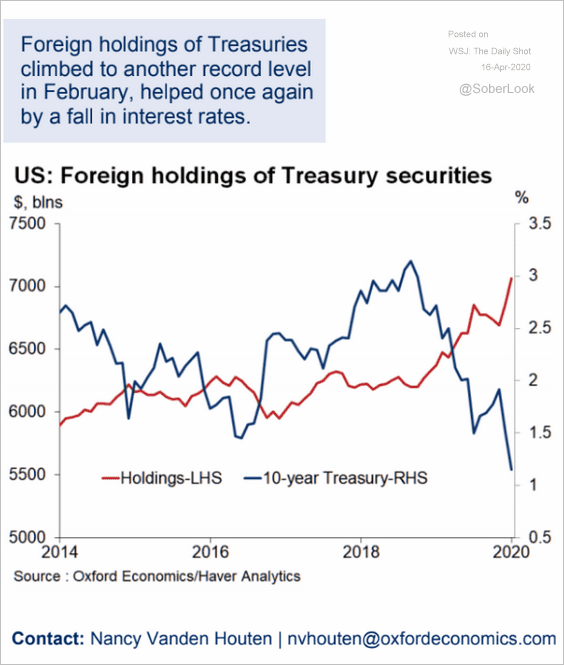 Source: Oxford Economics
3. Central banks are cutting rates at a record pace.
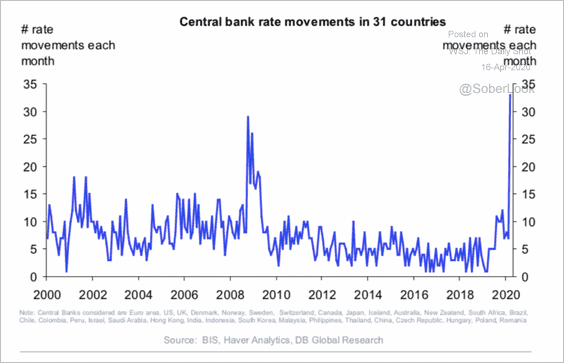 Source: Deutsche Bank Research
Emerging Markets
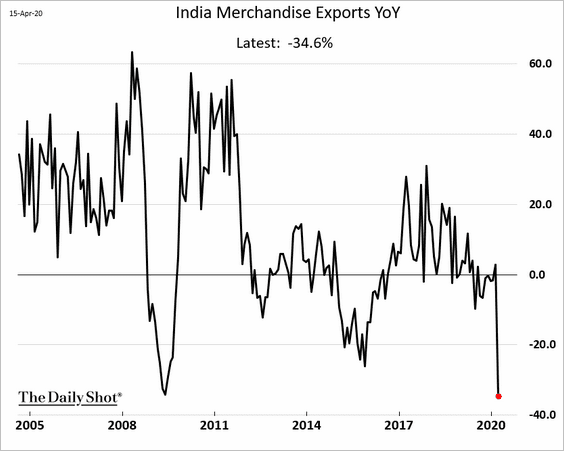
1. India’s exports tumbled in March.
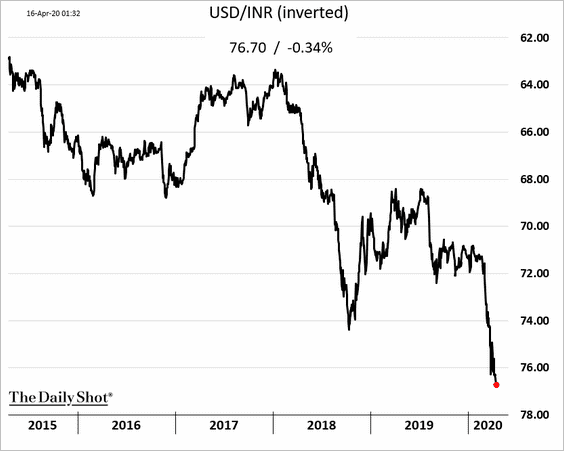
The rupee keeps drifting lower.
——————–
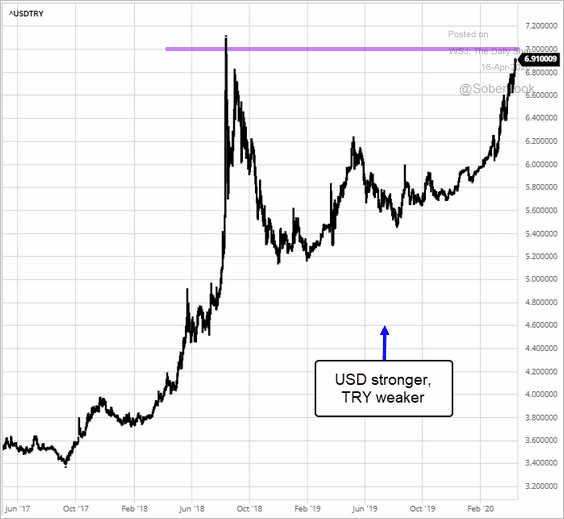
2. Dollar-lira is about to test resistance at 7.0, as Turkey’s currency continues to weaken.
 Source: barchart.com
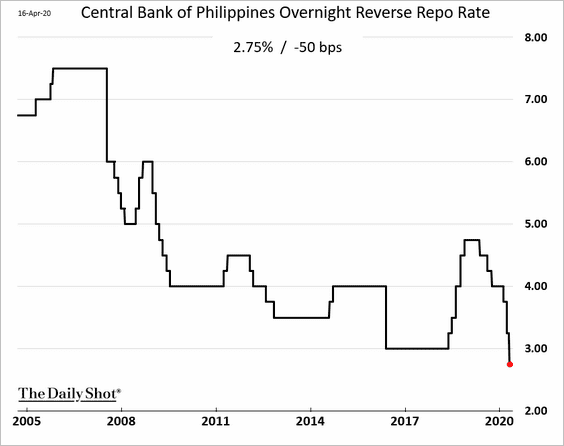
3. The Philippine central bank unexpectedly cut rates again.
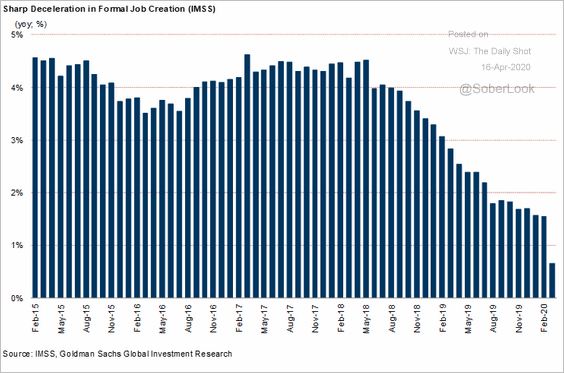
4. Next, we have some updates on Mexico.
• Job creation has been slowing.
 Source: Goldman Sachs
• Remittances are expected to decline sharply over the next couple of years.
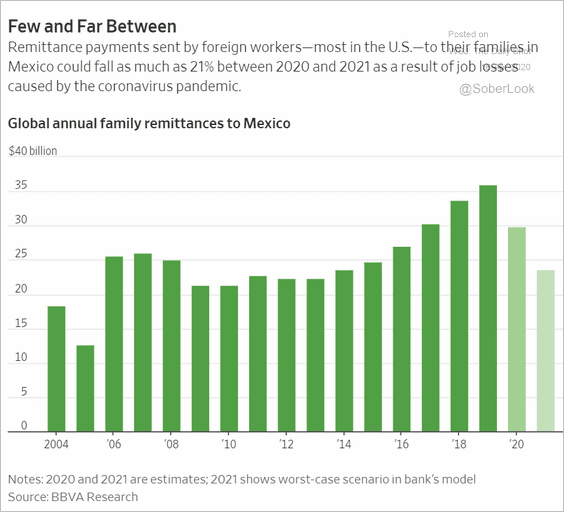 Source: @WSJ Read full article
——————–
5. LatAm government deficits will increase substantially this year.
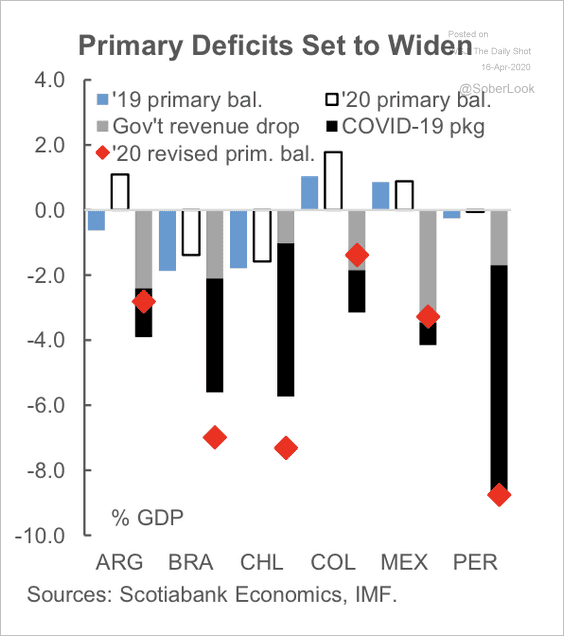 Source: Scotiabank Economics
Sovereign credit default swap spreads have widened.
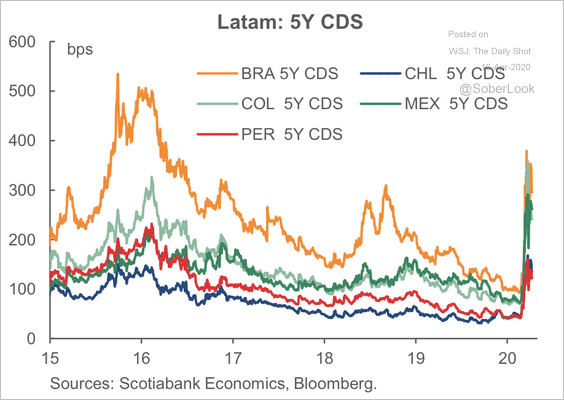 Source: Scotiabank Economics
——————–
6. Some EM economies have yet to see peak levels of new coronavirus cases.
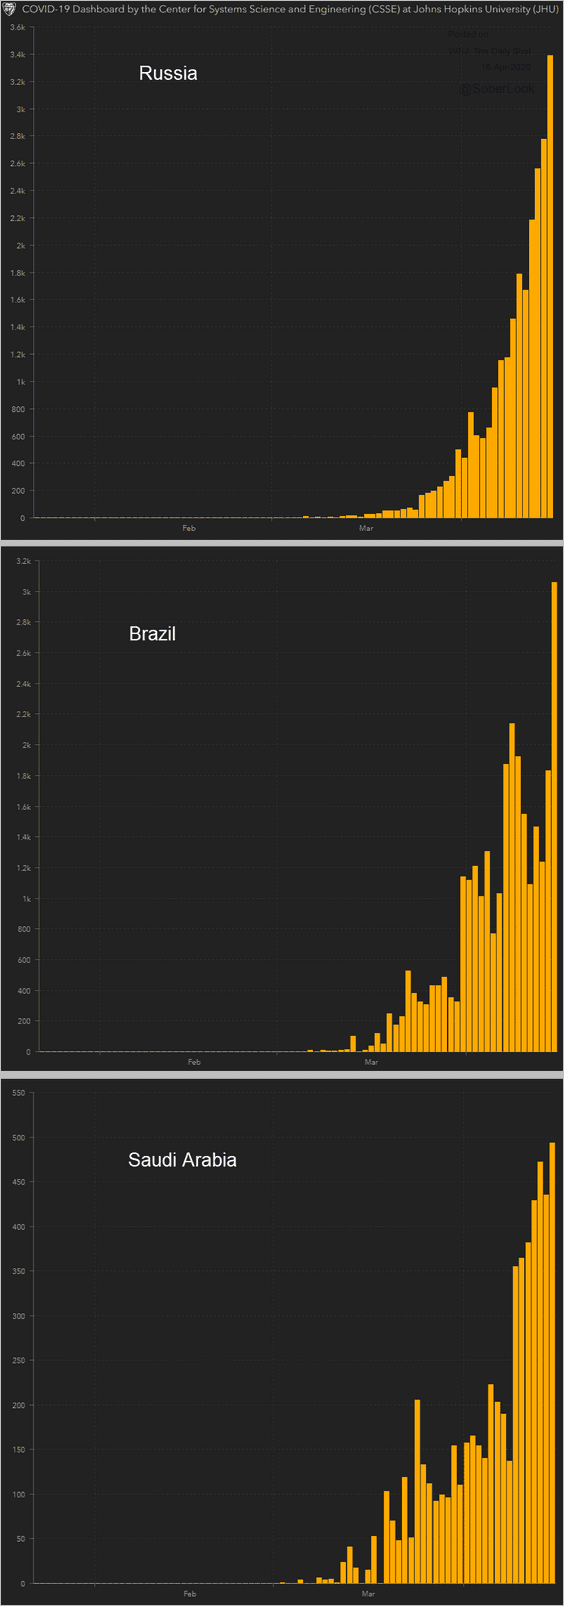 Source: JHU CSSE
Returning to “normal” by June? Unlikely.
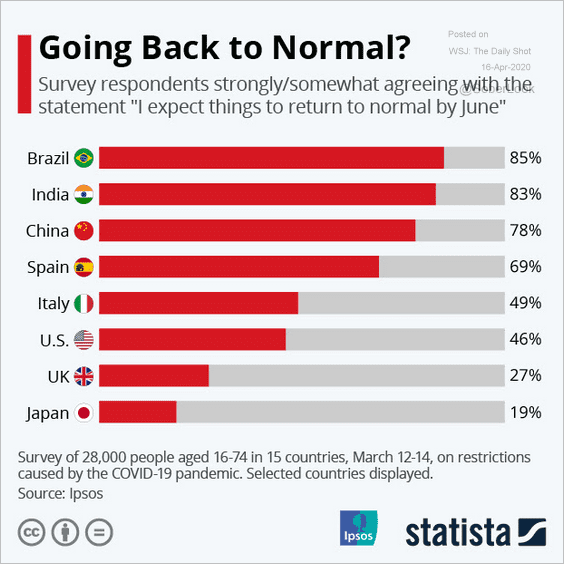 Source: Statista
China
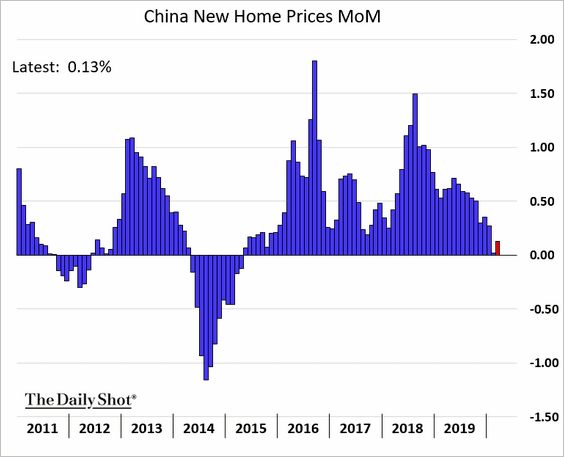
1. Home prices ticked higher last month.
2. The trade surplus has been narrowing.
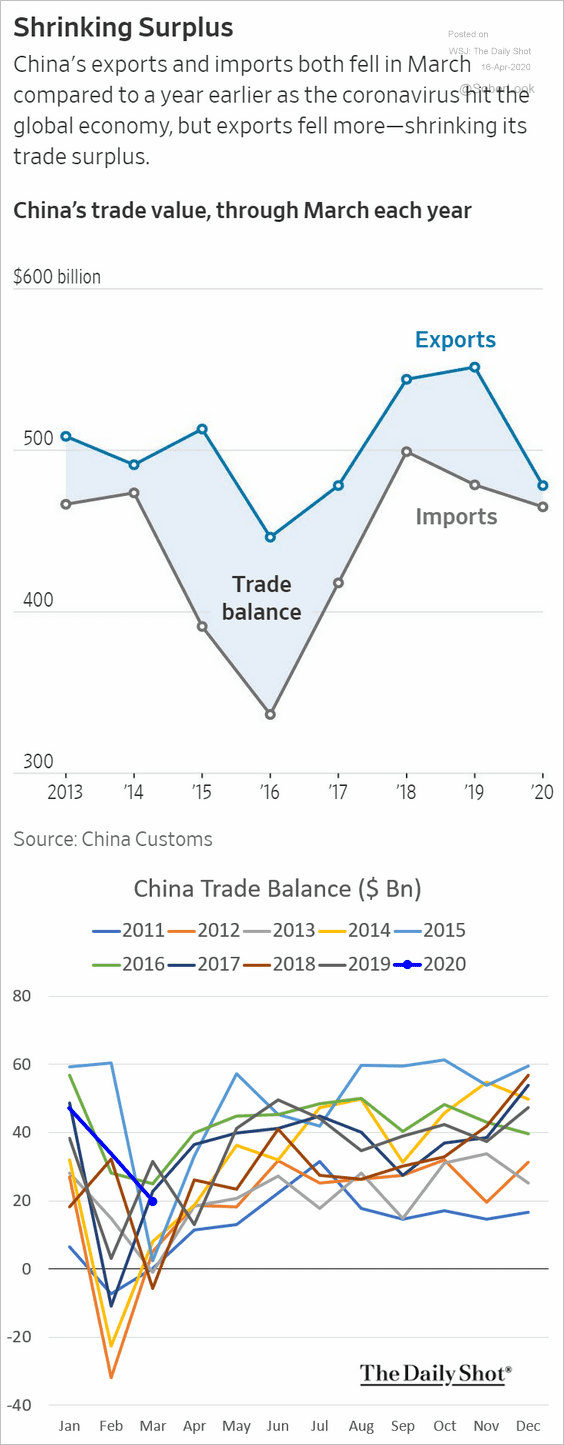 Source: @WSJ Read full article
3. Cement shipments and steel rebar consumption are back to normal (two charts).
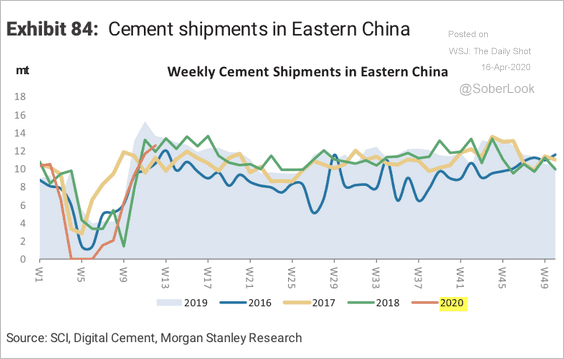 Source: Morgan Stanley Research
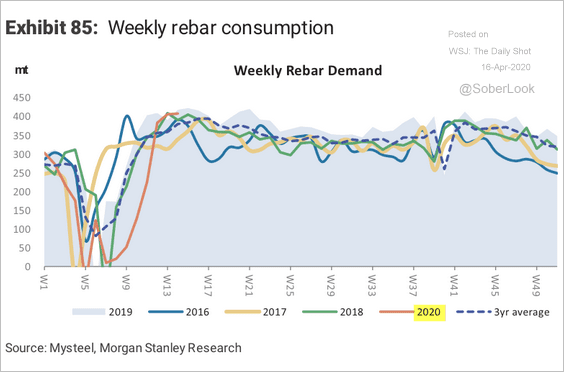 Source: Morgan Stanley Research
Asia – Pacific
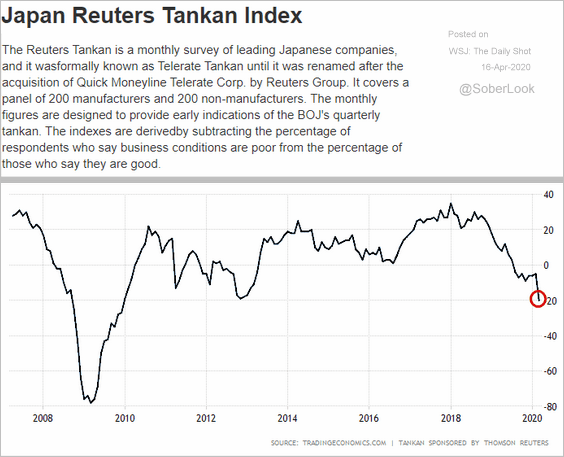
1. Japan’s Reuters Tankan business sentiment indicator slumps to the lowest level in a decade.
 Source: Tradingeconomics.com, Investing.com (text)
 Source: Reuters Read full article
——————–
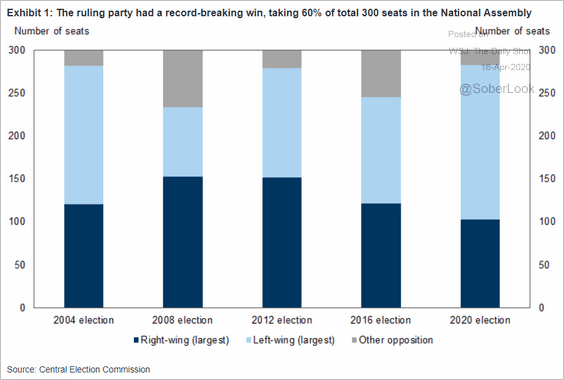
2. South Korea’s ruling party took 60% of the 300 seats in the National Assembly – a record.
 Source: Goldman Sachs
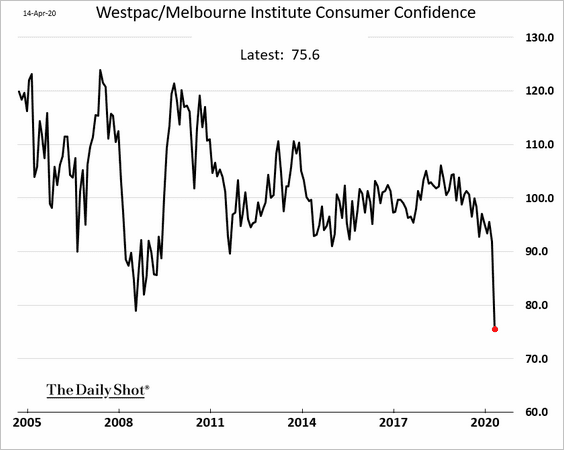
3. Next, we have some updates on Australia.
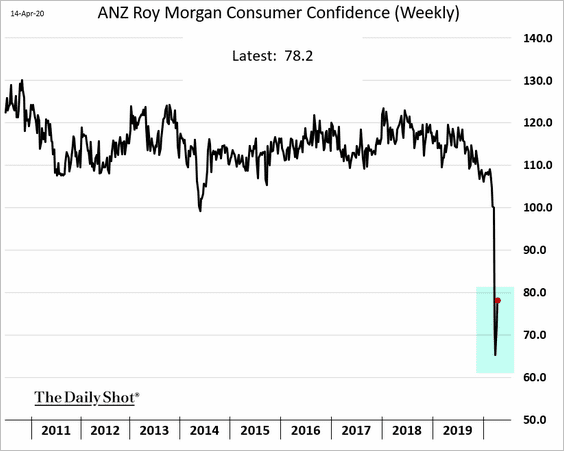
• Consumer sentiment has deteriorated to unprecedented levels.
However, the weekly indicator shows a rebound.
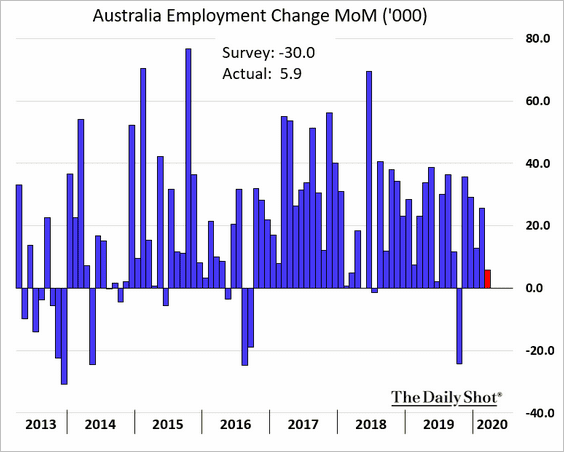
• The March employment report surprised to the upside.
Here is the unemployment rate.
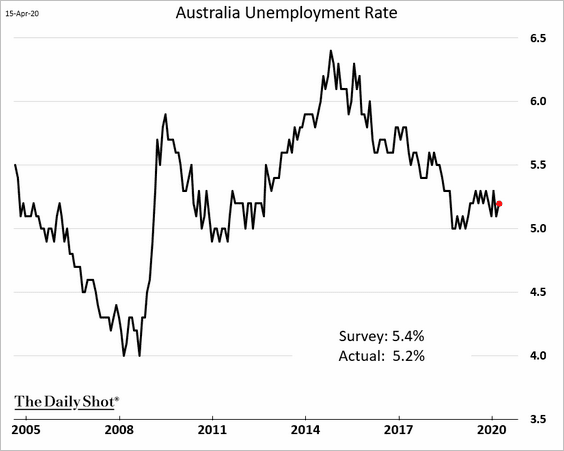
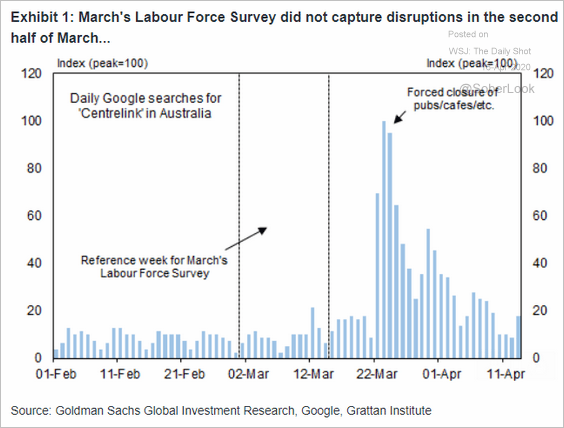
However, the labor market measurements took place in the first half of March, before the pandemic-related disruptions.
 Source: Goldman Sachs
Canada
1. Existing home sales tumbled last month.

 Source: @markets Read full article
——————–
2. The BoC has ramped up asset purchases.
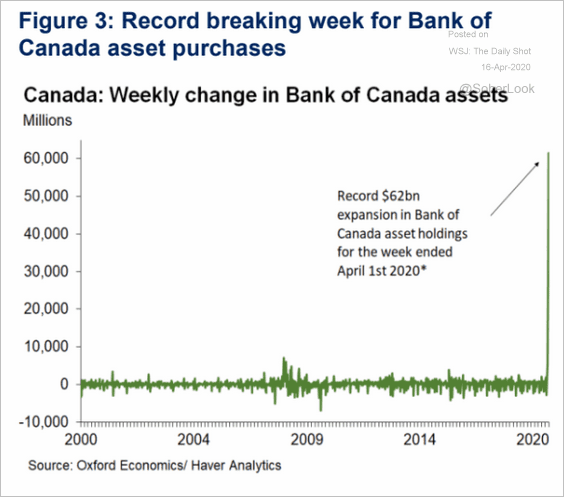 Source: Oxford Economics
The United States
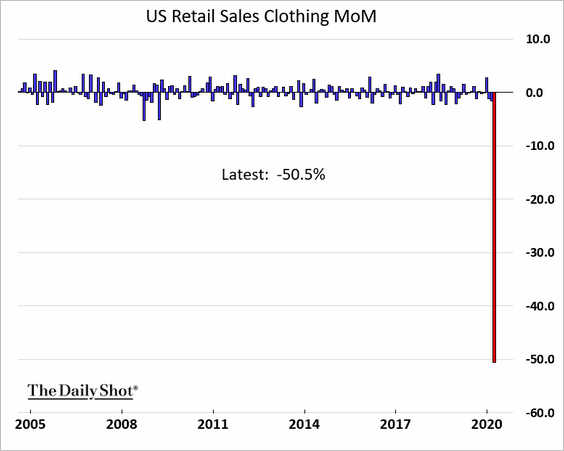
1. Retail sales plunged in March.
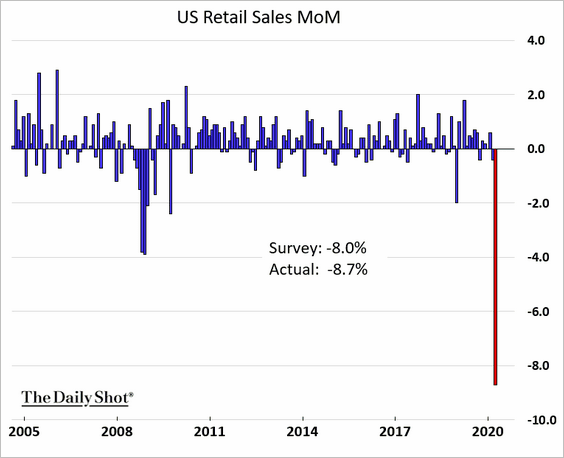
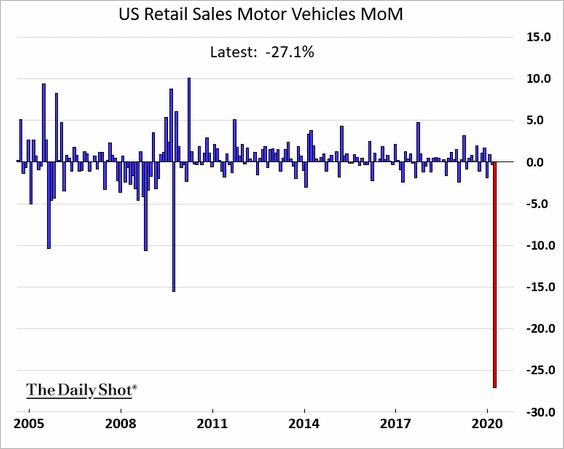
Here are some of the hardest-hit sectors.
• Car sales:
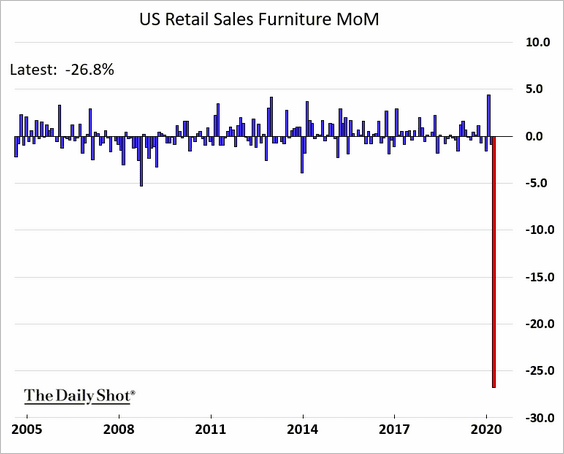
• Furniture:
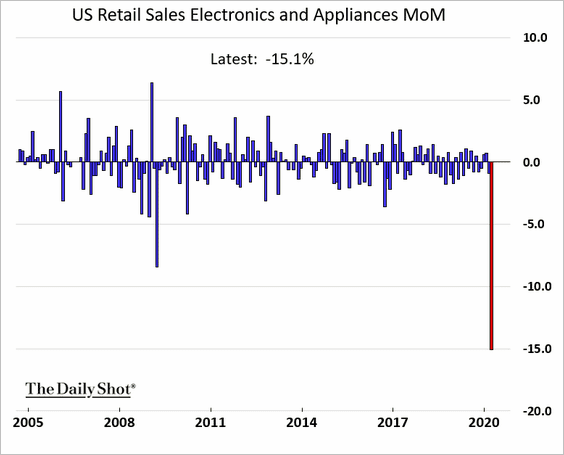
• Appliances:
• Clothing (down 50%):
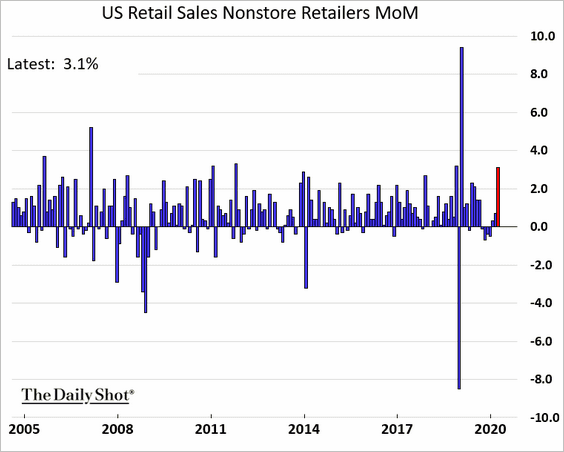
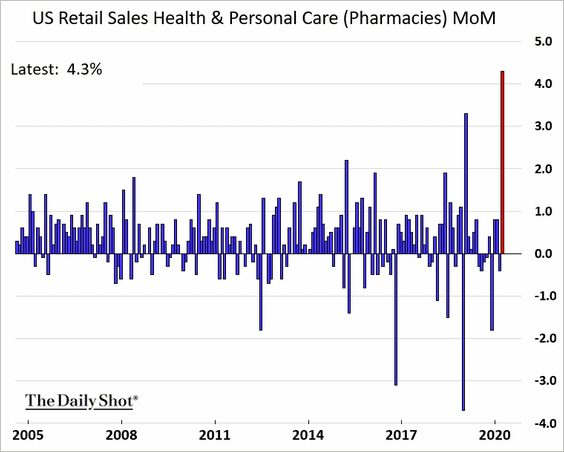
But there were some winners.
• Online retail:
• Pharmacies:
• Grocery stores:
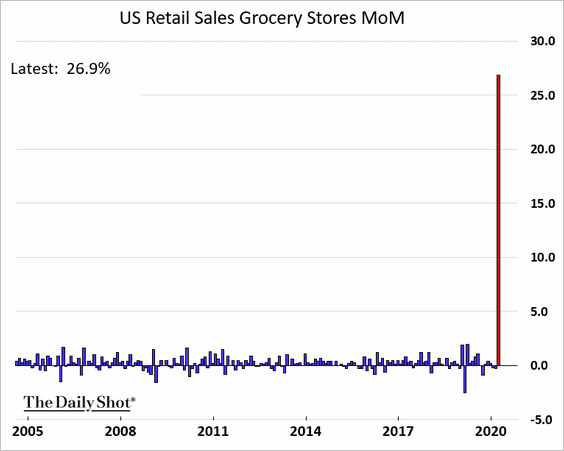
The huge increase in grocery store sales was driven by hoarding as well as restaurant closures.
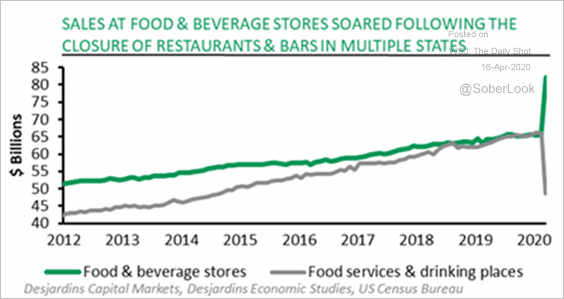 Source: Desjardins
——————–
2. Next, we have some updates on the housing market.
• Mortage applications to purchase a home are declining but have not collapsed.
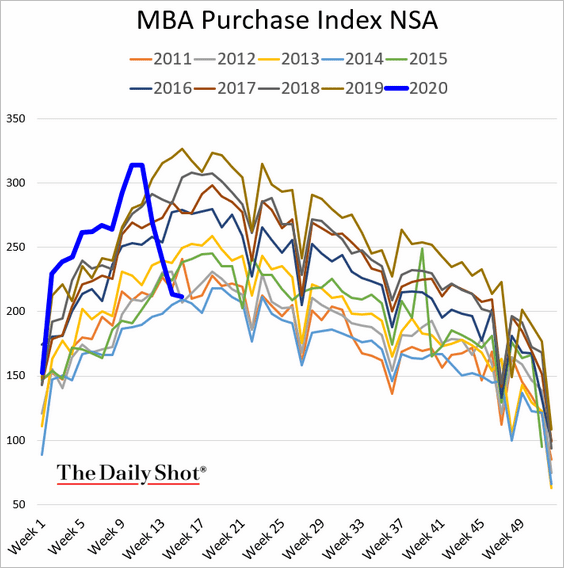
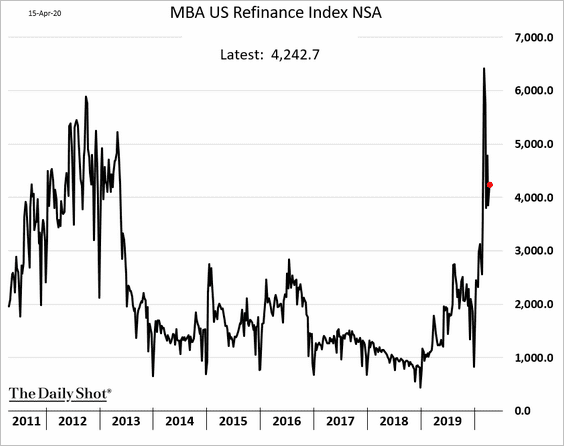
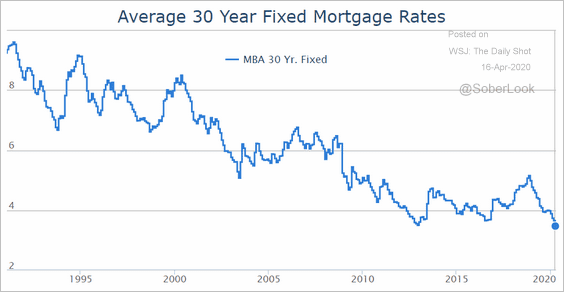
Refi applications remain elevated as mortgage rates hover near record lows (second chart).
 Source: Mortgage News Daily
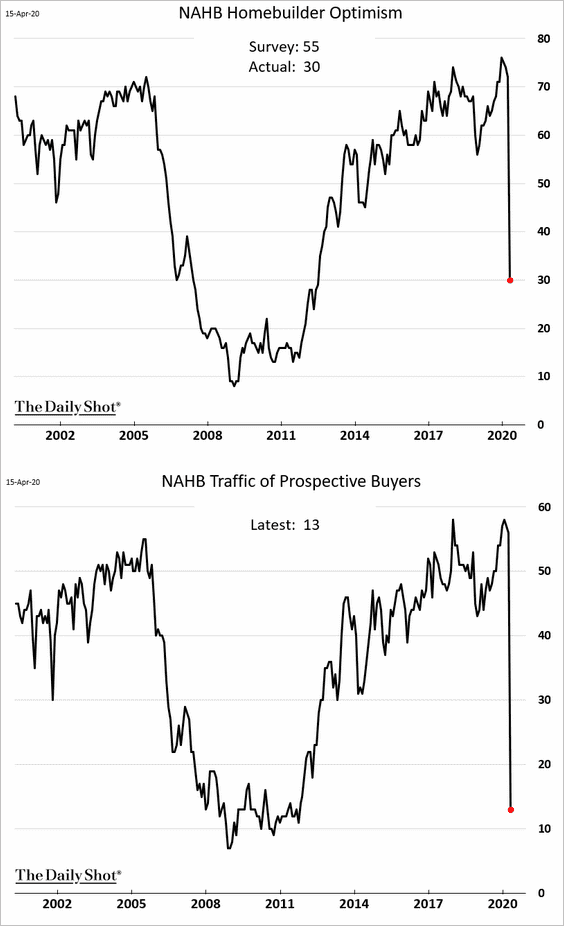
• Homebuilder sentiment plummetted this month.
——————–
3. Industrial production crashed in March, with factory output registering the worst decline since WW-II.
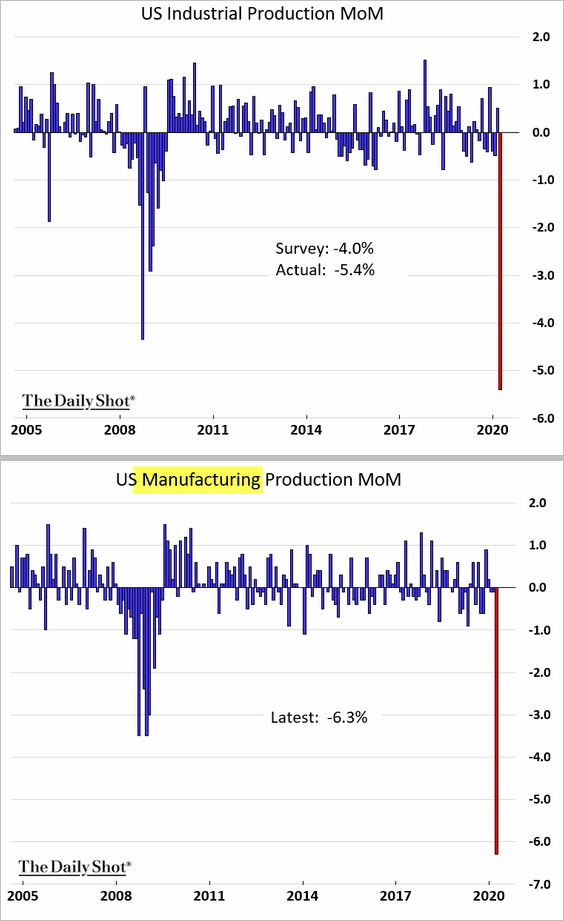
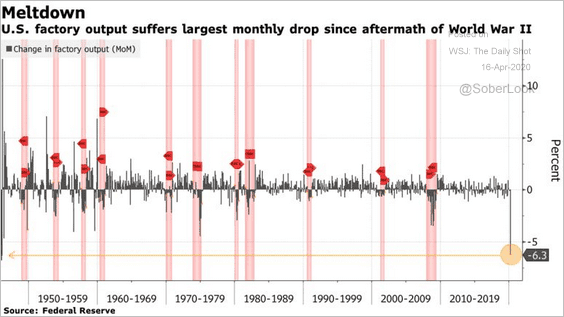 Source: @markets Read full article
——————–
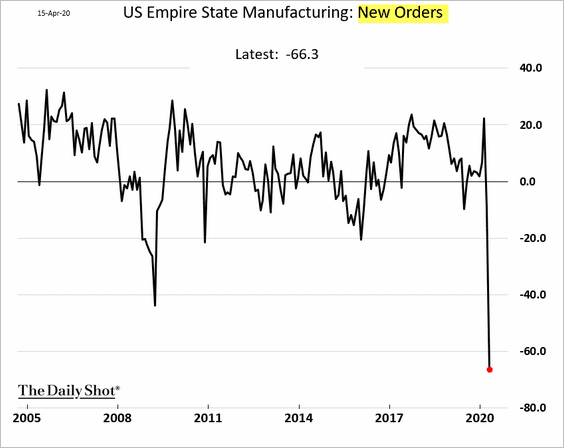
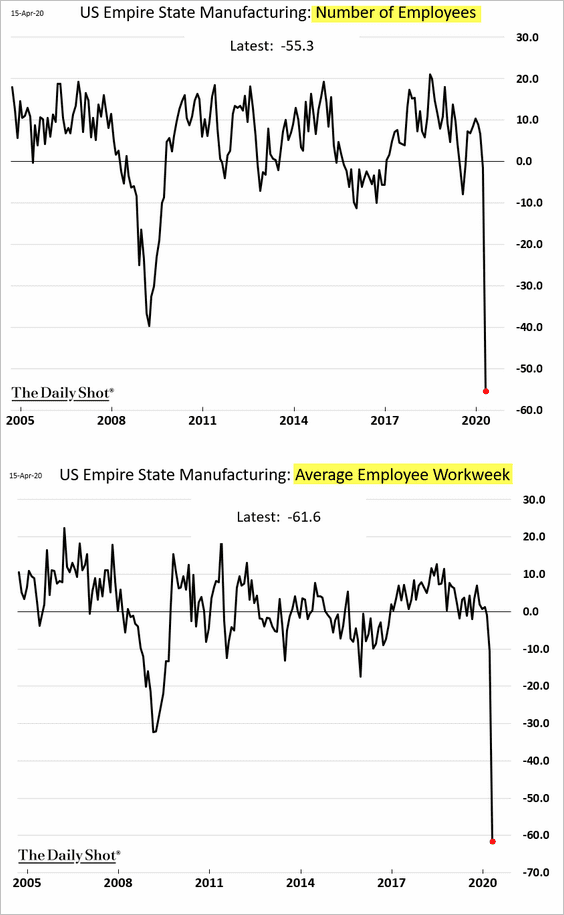
4. Manufacturing activity went from bad to worse in April. The NY Fed’s report (Empire State Manufacturing) showed factories shutting down.
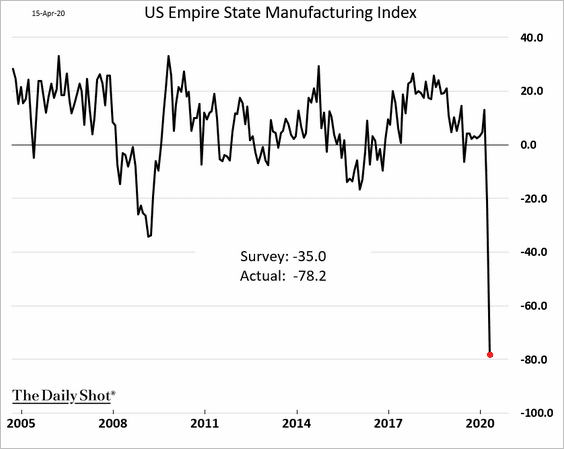
• New orders:
• Employment:
——————–
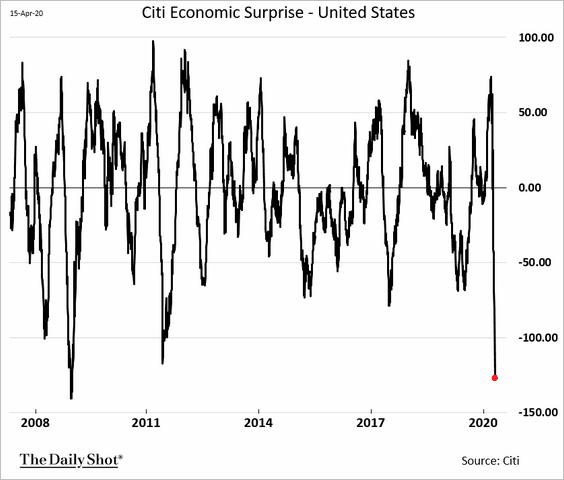
5. The Citi Economic Surprise Index hit the lowest level since 2008.
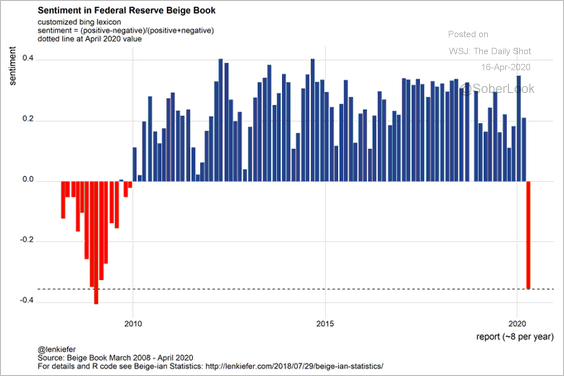
6. The Fed’s Beige Book showed business activity plunging.
 Source: @lenkiefer
7. Next, we have some updates on the labor markets.
• How many more Americans filed for unemployment last week? Estimates vary from 2 to 8 million.
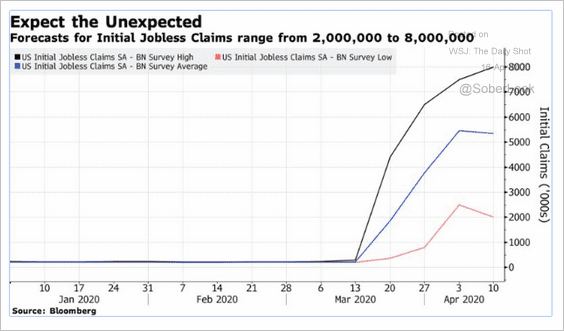 Source: @johnauthers, @bopinion Read full article
Most analysts think that new unemployment claims have peaked. Here is Morgan Stanley’s forecast.
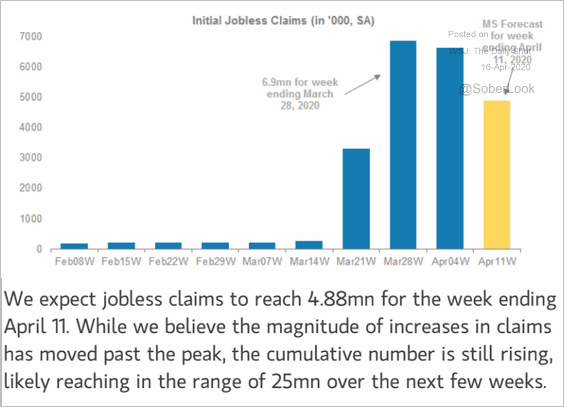 Source: Morgan Stanley Research
Google search analysis from Pantheon Macroeconomics supports that view.
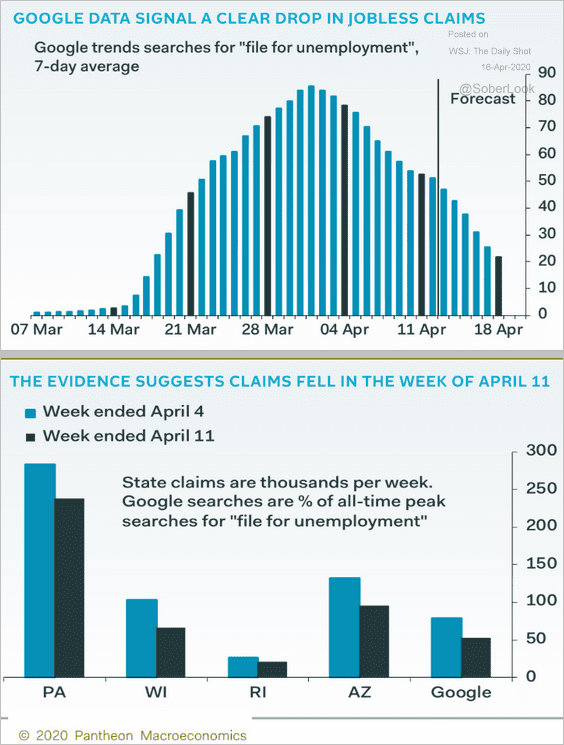 Source: Pantheon Macroeconomics
• Which firms have been hiring during the lockdowns?
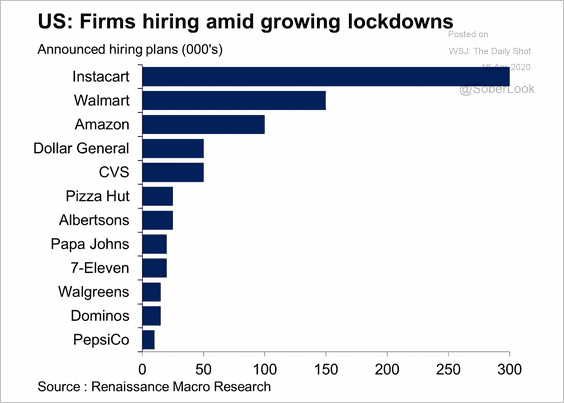 Source: Oxford Economics
——————–
8. Has consumer sentiment bottomed?
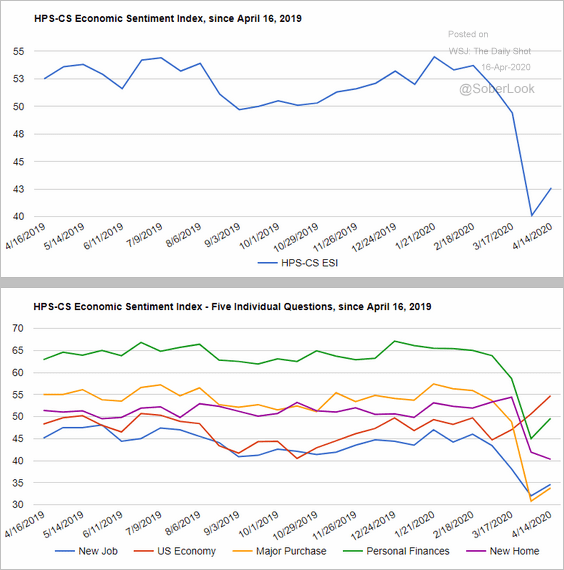 Source: @HPS_CS Read full article
9. New coronavirus cases in the US are running two weeks behind Italy.
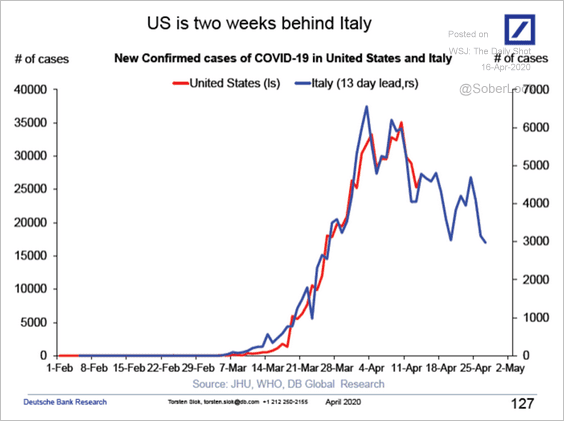 Source: Deutsche Bank Research
Global Developments
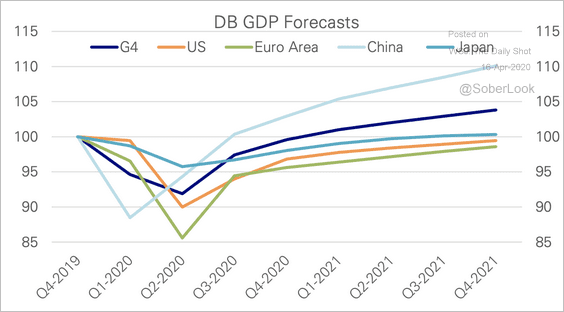
1. The IMF sees a sharp contraction in the GDP this year, followed by a rebound in 2021.
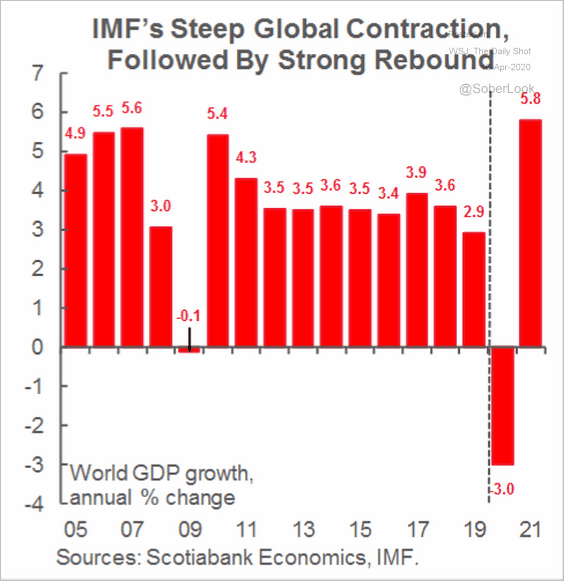 Source: Scotiabank Economics
 Source: IMF Read full article
Deutsche Bank’s baseline view is for a record plunge in Q1 and Q2 GDP, followed by a rebound beginning in Q3. It will take about a full year to return to 2019 levels.
 Source: Deutsche Bank Research
——————–
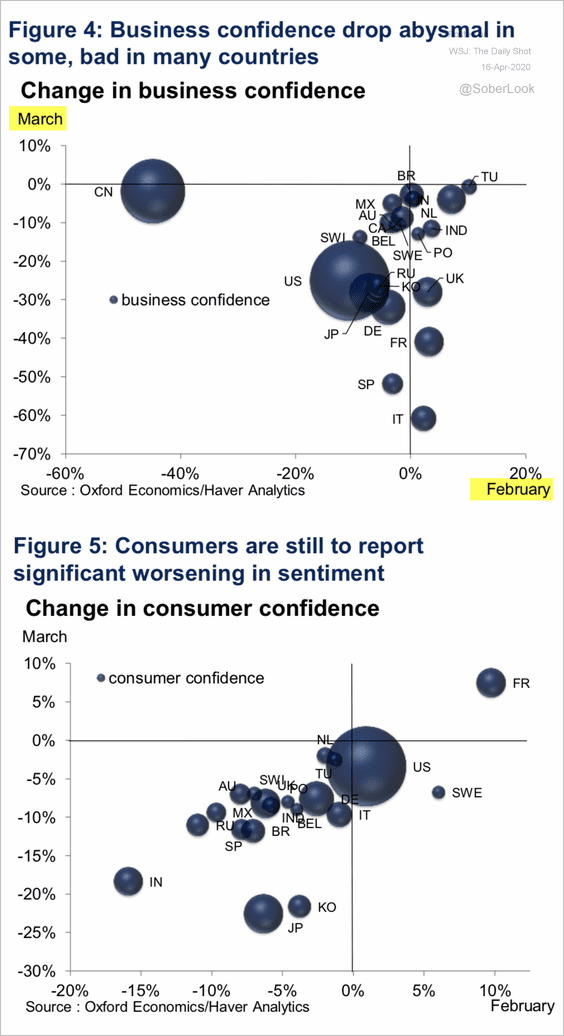
2. How has business and consumer sentiment changed between February and March?
 Source: Oxford Economics
——————–
Food for Thought
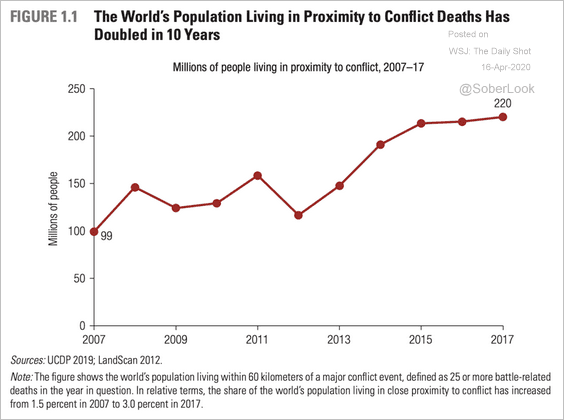
1. Displaced people around the world:
 Source: World Bank
 Source: World Bank
——————–
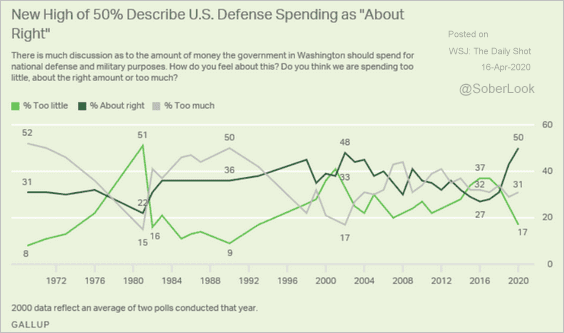
2. Views on US defense spending:
 Source: Gallup Read full article
3. WHO funding sources:
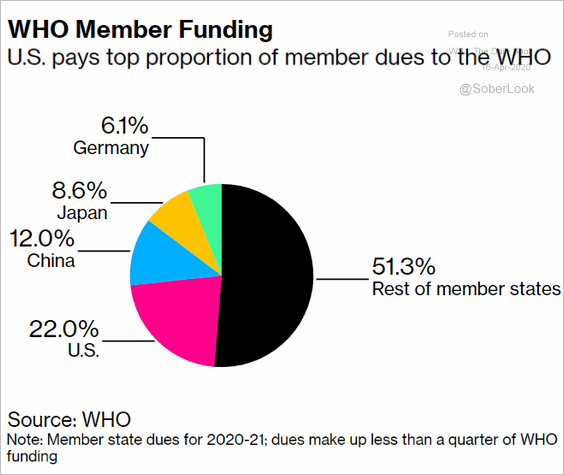 Source: @bpolitics Read full article
4. Voting by mail:
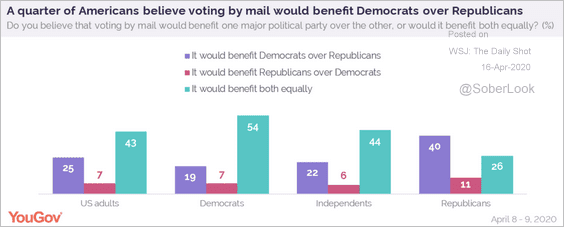 Source: @YouGovUS Read full article
5. Who can decide to lift restrictions?
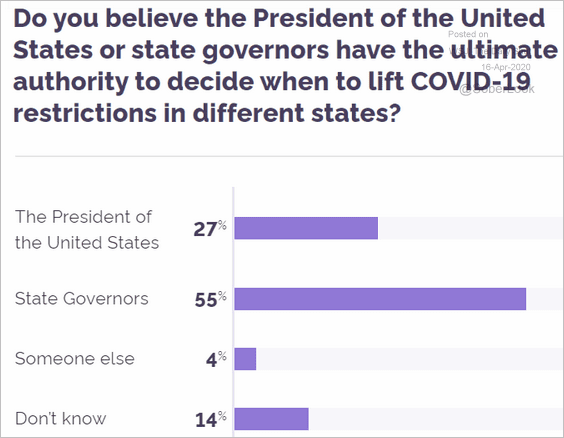 Source: YouGov Read full article
6. Improvements in air quality:
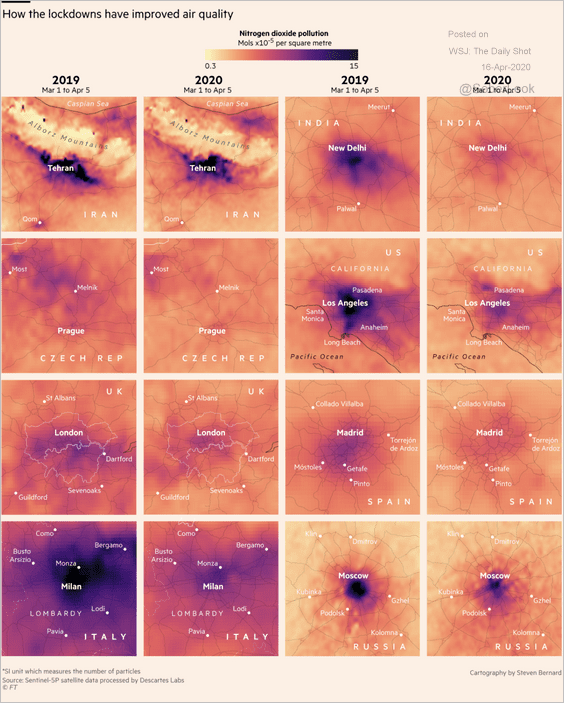 Source: @financialtimes Read full article
7. Flu vs. COVID-19:
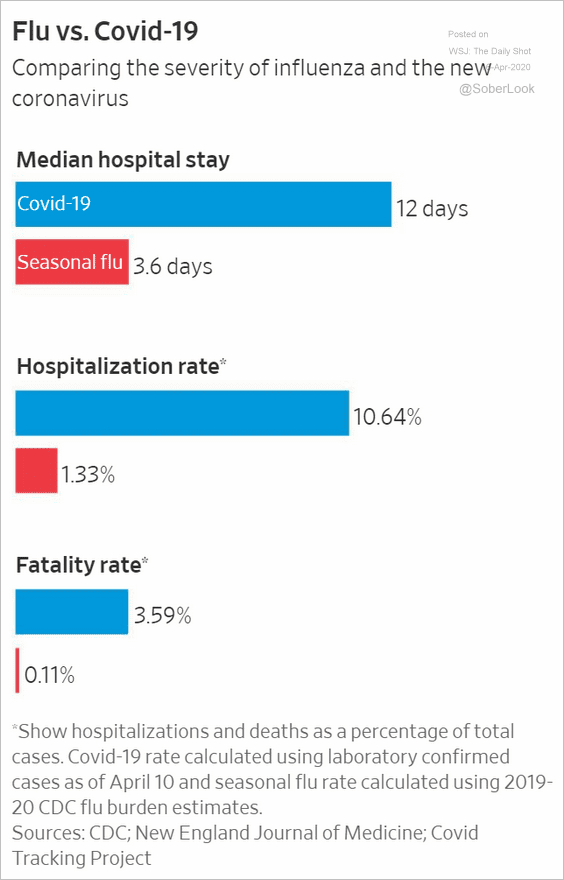 Source: @WSJ Read full article
8. Resuming normal activities:
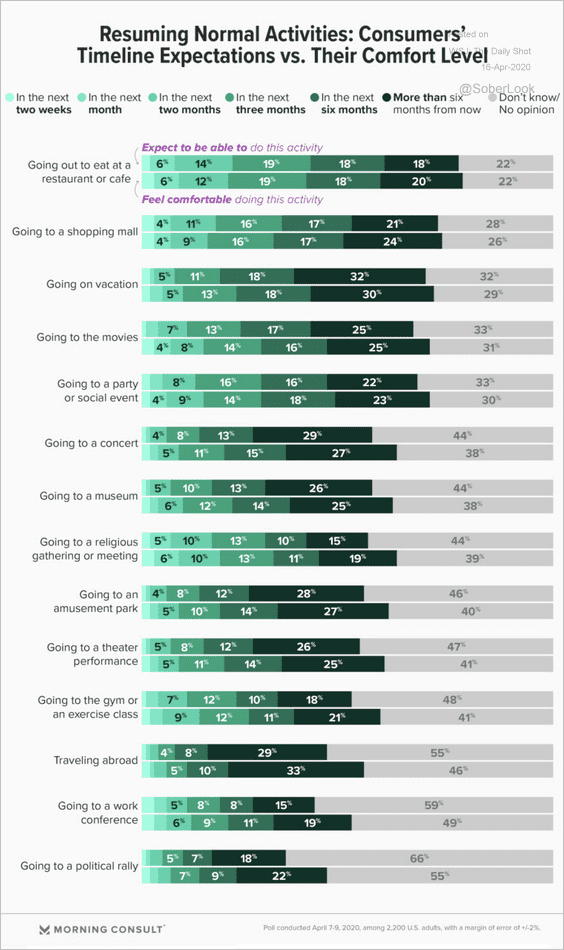 Source: Morning Consult Read full article
9. Most popular flavors:
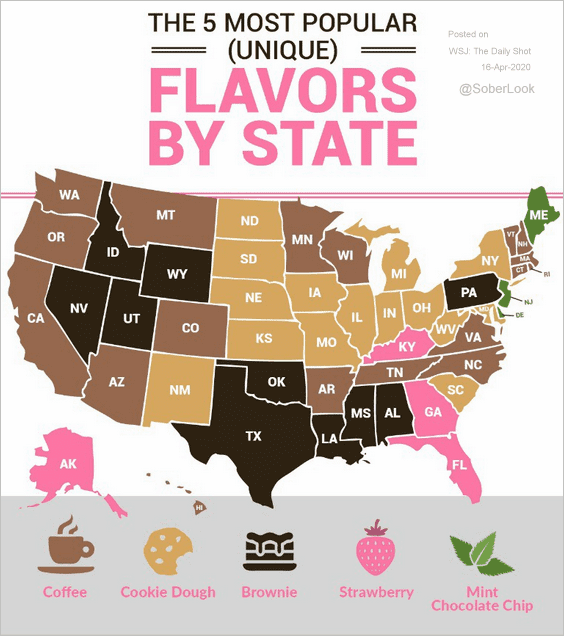 Source: Frozen Dessert Supplies Read full article
——————–