
The Daily Shot: 17-Apr-20
• The United States
• The Eurozone
• Asia – Pacific
• China
• Emerging Markets
• Commodities
• Energy
• Equities
• Credit
• Rates
• Global Developments
• Food for Thought
The United States
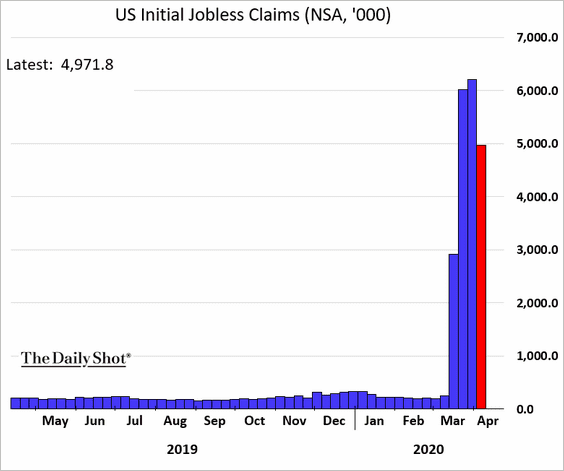
1. Let’s begin with the labor market.
• Another five million Americans filed for unemployment last week. Moreover, Good Friday probably delayed some applications which will show up in this week’s numbers.
 Source:
 Source: Oxford Economics
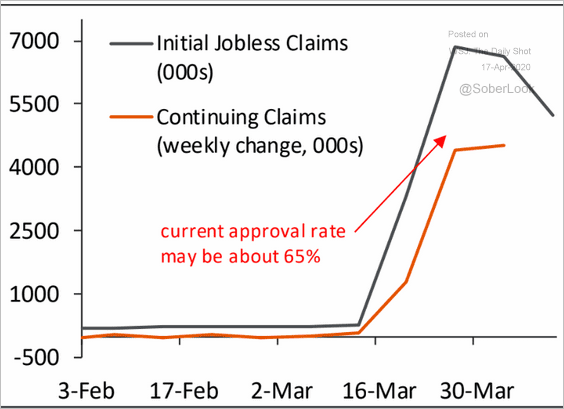
It’s important to note that many applications are rejected, which has created a gap between the initial and continuing jobless claims. This trend will result in a lower than expected unemployment rate but a significant increase in the number of Americans leaving the labor force (similar to 2008/09). Here is a quote from Piper Sandler.
Given the difference between initial jobless claims and the weekly change in the continuing claims numbers (bottom figure), we estimate that the current approval rate for benefits may be about 65%. As of last week, there were 11.9 million Americans receiving benefits, and if we add 65% of the 5.25 million that applied for benefits this week, the “official” unemployment rate may be closer to 13%.
 Source: Piper Sandler
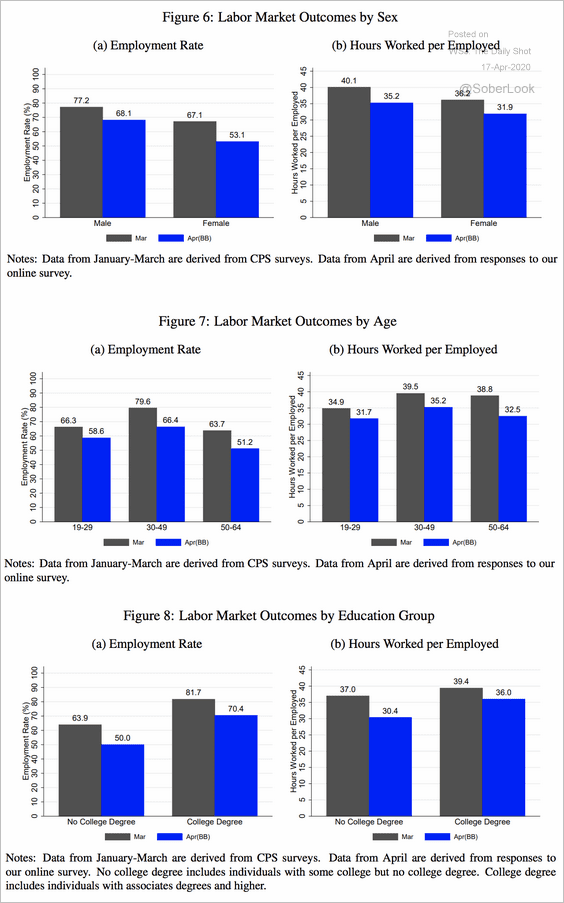
• An independent survey (Alexander Bick and Adam Blandin) conducted during the week of March 29 – April 4 suggests that the unemployment rate is around 20%.
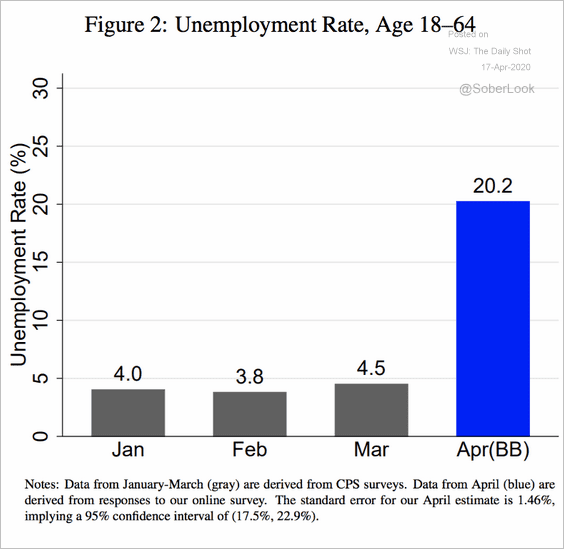 Source: Bick and Blandin’s survey Read full article
• The charts below provide some details on employment in March vs. April.
 Source: Bick and Blandin’s survey Read full article
——————–
2. Bloomberg’s consumer comfort indicator points to further deterioration in sentiment. But the levels remain well above the 2008 lows.
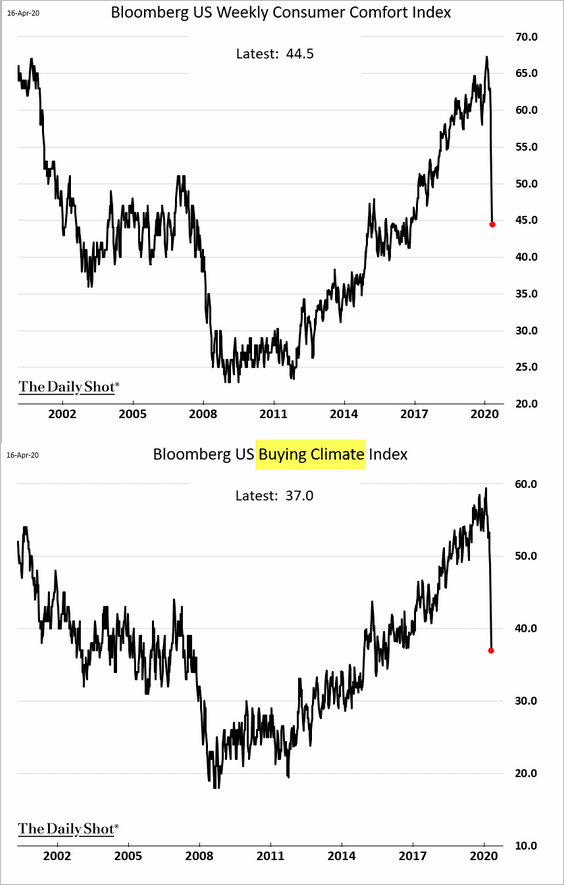
Part of the reason is that household balance sheets were much healthier going into this downturn than what we saw before the financial crisis.
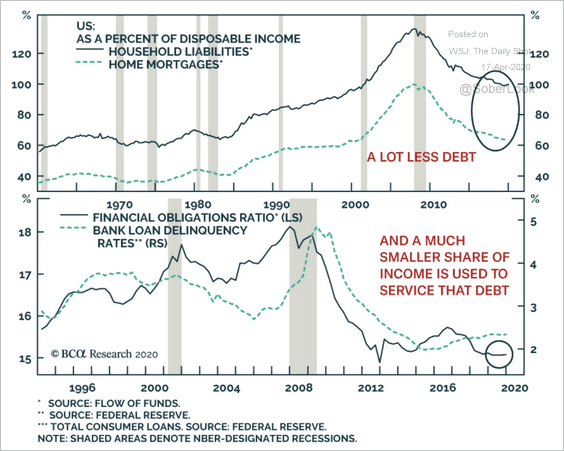 Source: BCA Research
——————–
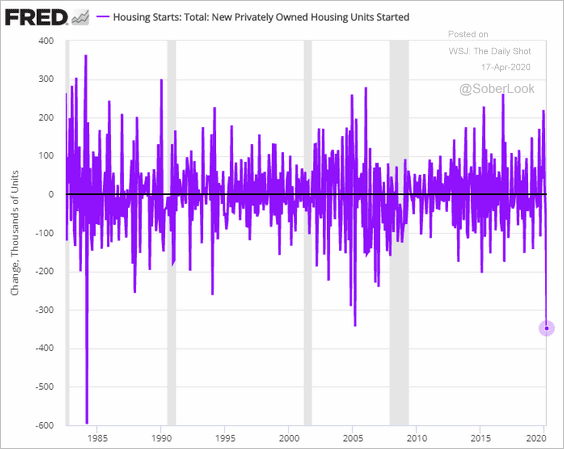
3. Residential construction took a hit in March, and further declines are expected.
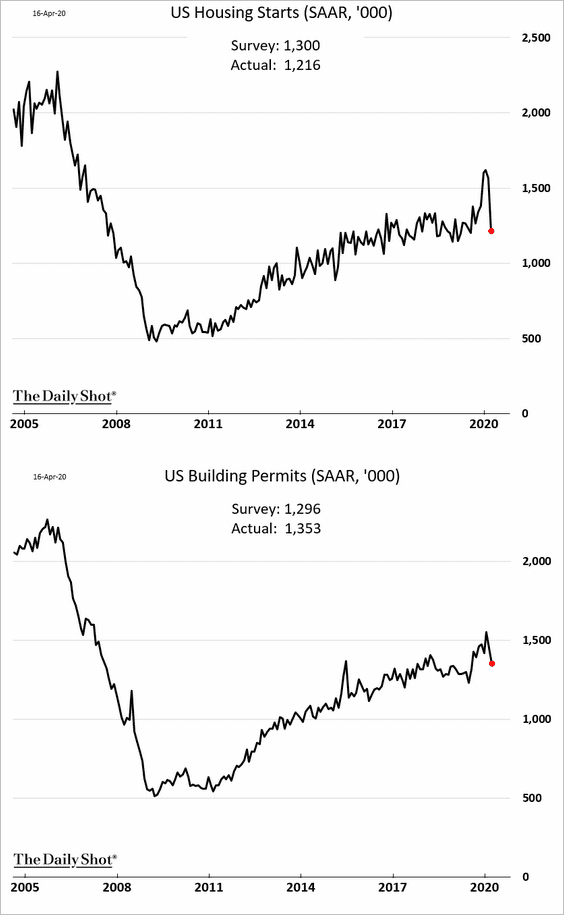
The monthly drop in housing starts was the largest since 1984.
——————–
4. The SBA already ran out of funds designated for the Paycheck Protection Program (PPP). Hundreds of thousands of qualifying small firms have been left out of the program.
 Source: CNBC Read full article
The charts below show how PPP was allocated.
• By state:
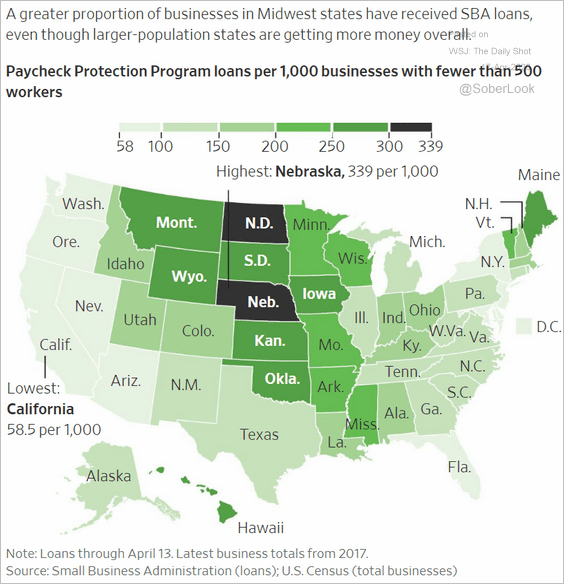 Source: @WSJ Read full article
• By loan size:
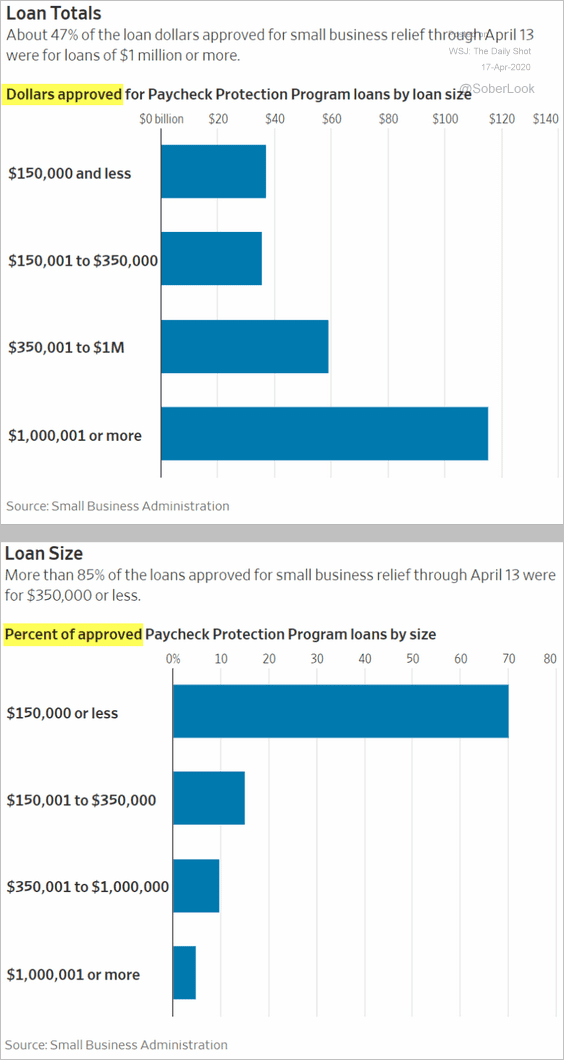 Source: @WSJ Read full article
• By industry:
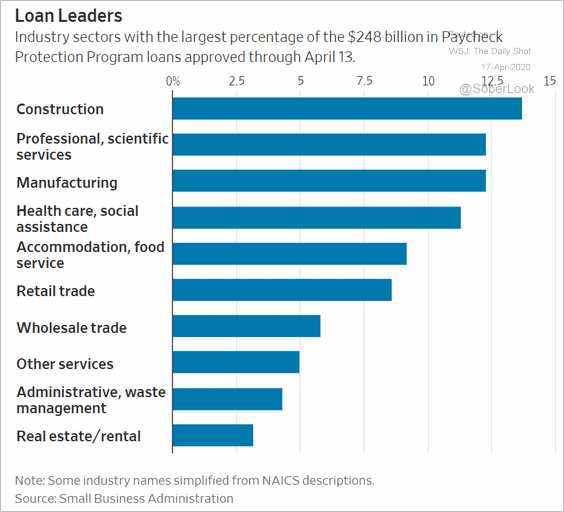 Source: @WSJ Read full article
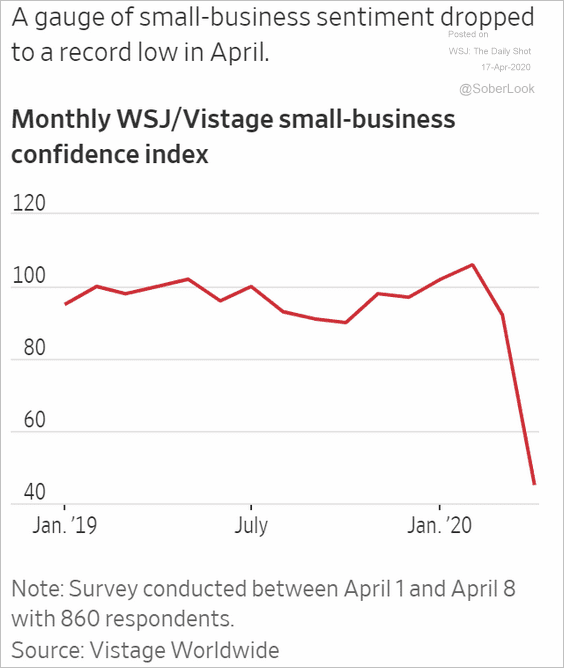
Meanwhile, small-business sentiment continues to deteriorate.
 Source: @WSJ Read full article
——————–
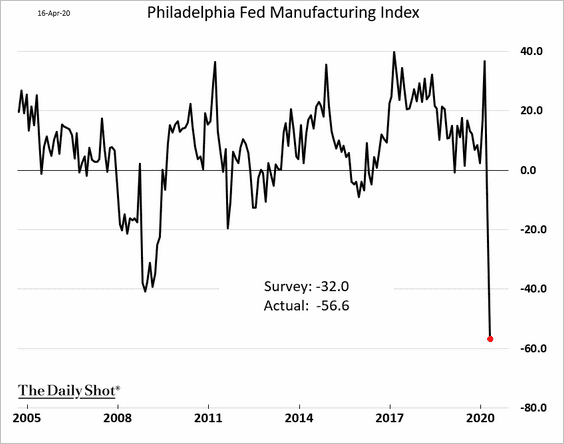
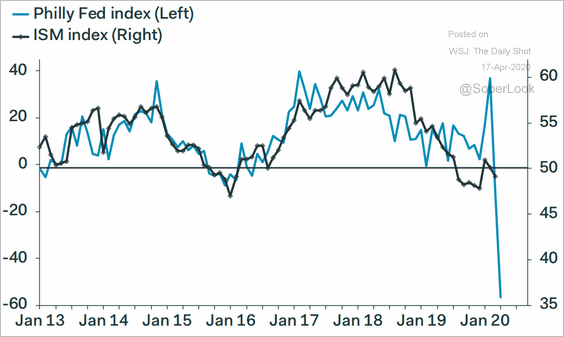
5. The Philly Fed’s manufacturing report showed factories shutting down across the region this month (similar to the NY Fed’s report – #4 here).
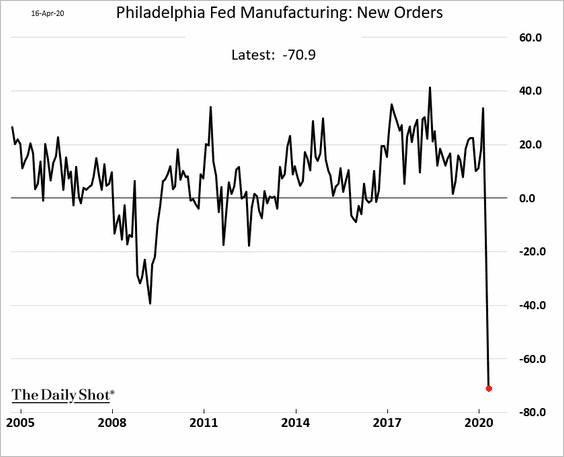
New orders collapsed.
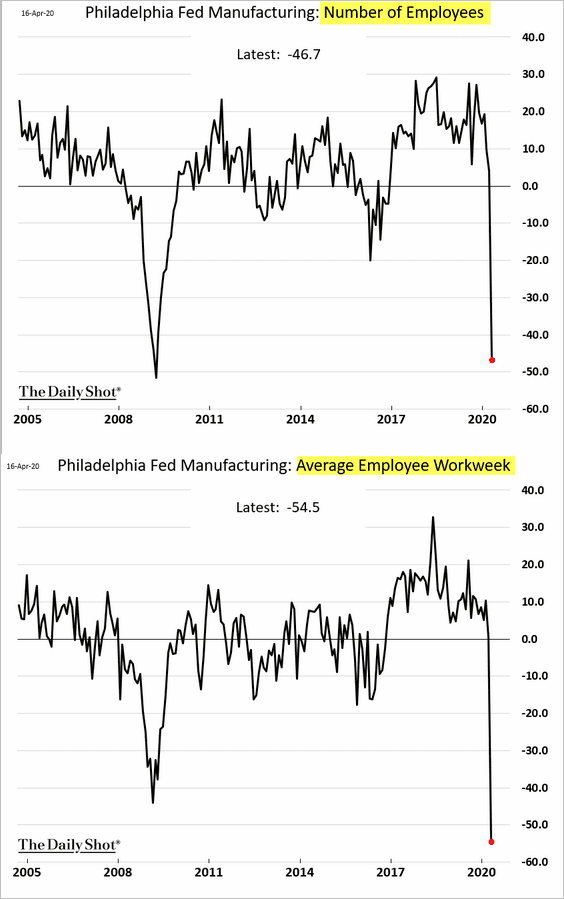
The region is experiencing massive layoffs, furloughs, and unprecedented cuts in workers’ hours.
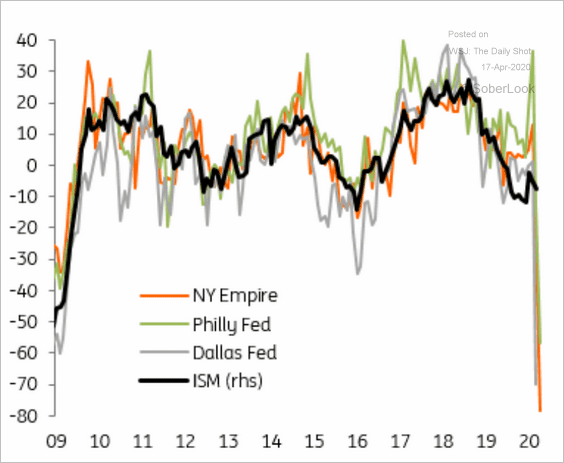
The regional Fed surveys don’t bode well for the manufacturing sector at the national level (ISM).
 Source: Pantheon Macroeconomics
 Source: ING
——————–
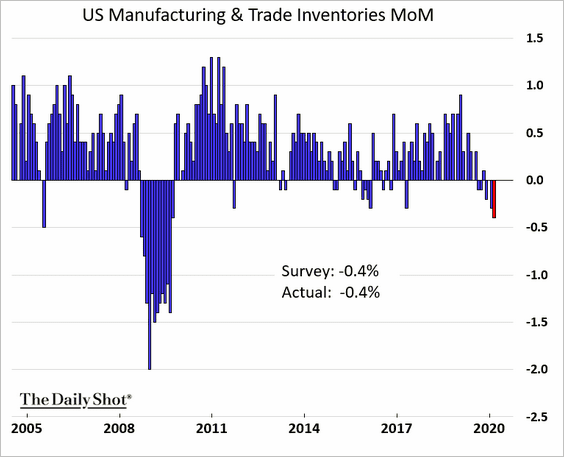
6. Businesses were cutting inventories back in February.
The wholesale inventory-to-sales ratio (red line below) started to fall after reaching an extreme high.
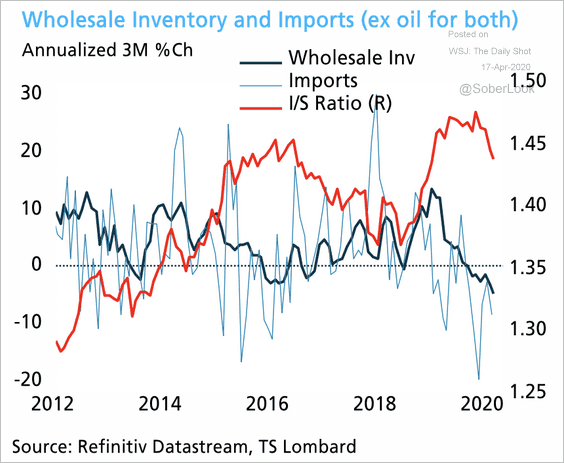 Source: TS Lombard
The Eurozone
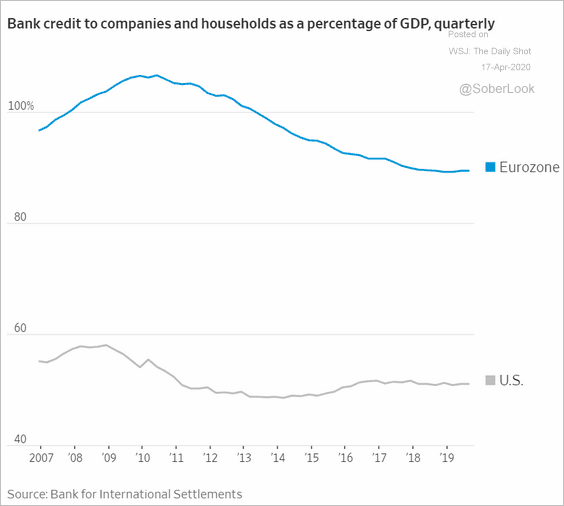
1. Euro-area firms and households depend much more on banks for credit than their US counterparts (there is more reliance on securitization and capital markets in the US).
 Source: @WSJ Read full article
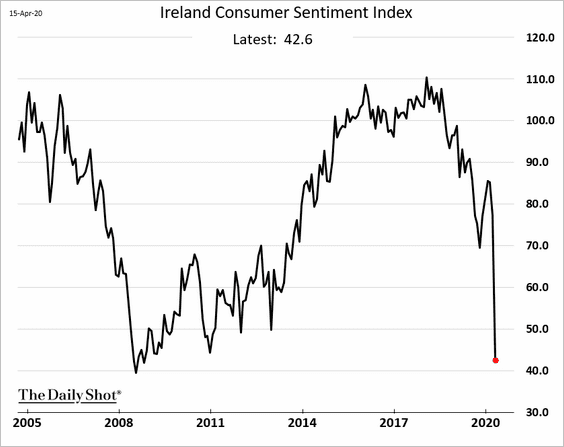
2. Irish consumer confidence tumbled this month.
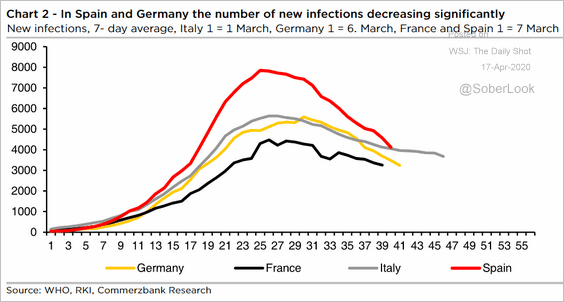
3. The number of new coronavirus cases in the Eurozone has peaked.
 Source: Commerzbank Research
Asia – Pacific
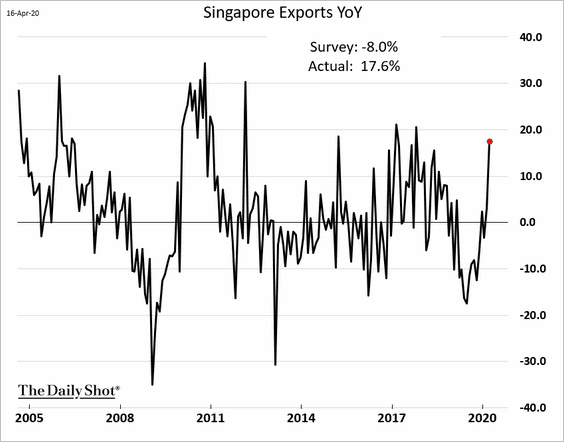
1. Singapore’s March exports surprised to the upside, boosted by a surge in gold shipments.
 Source: The Straits Times Read full article
——————–
2. Asian shares are rebounding this month, but are still broadly negative year-to-date.
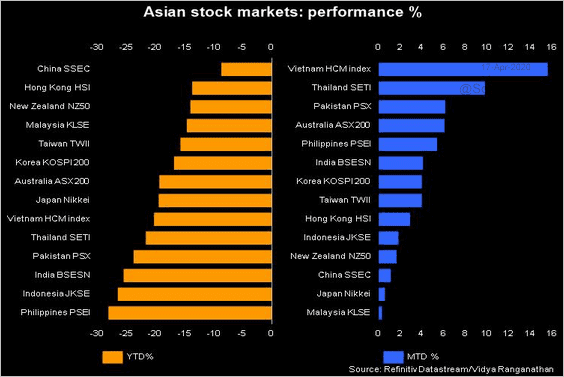 Source: @Refinitiv
China
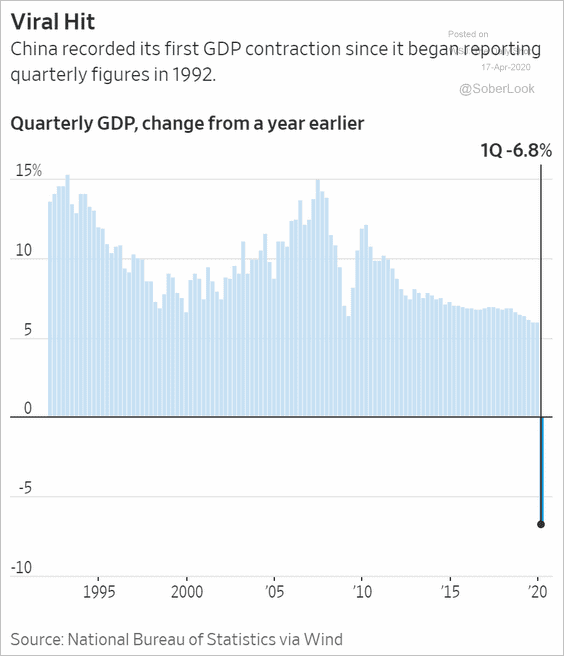
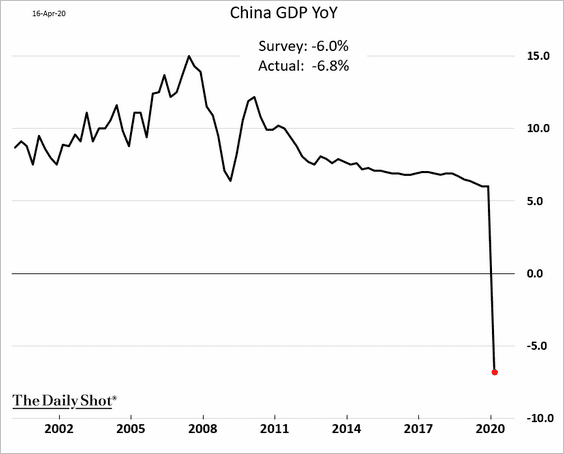
1. China recorded its first negative GDP quarter since reporting began in 1992.
 Source: @WSJ Read full article
Below is the year-over-year GDP growth.
——————–
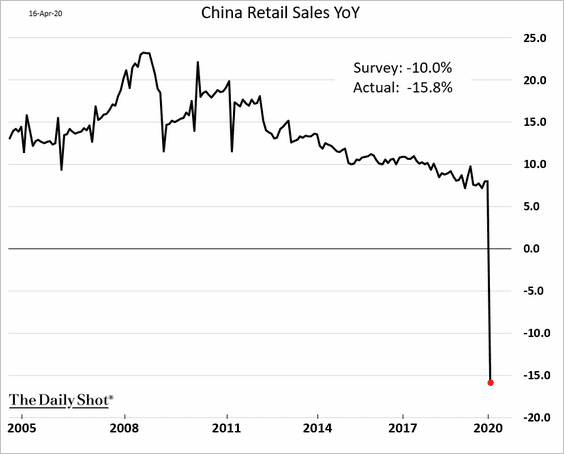
2. The March decline in industrial production wasn’t as severe as economists had expected.
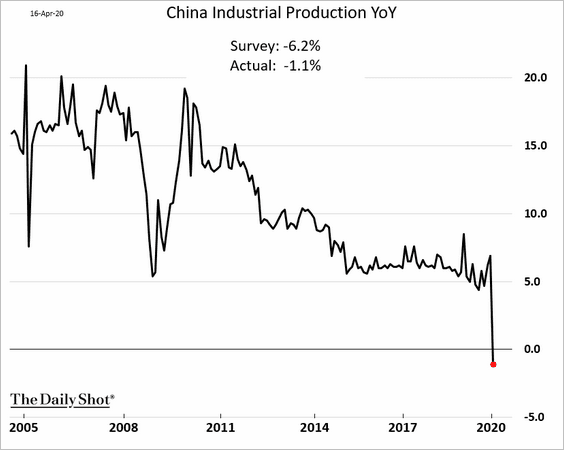
But retail sales were down almost 16% from the same time last year.
——————–
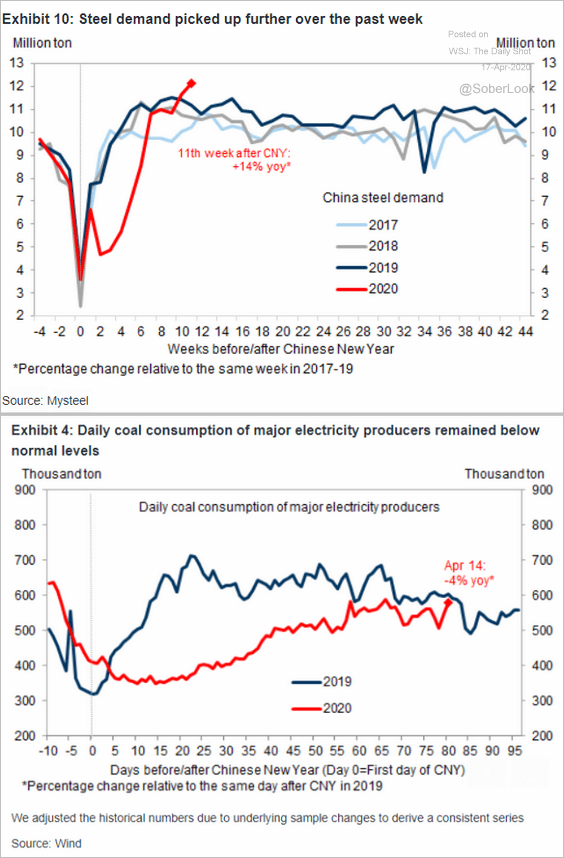
3. Industrial activity is recovering.
• Steel and coal demand:
 Source: Goldman Sachs
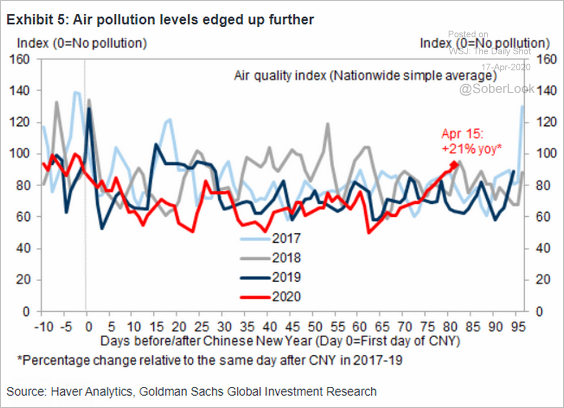
• Air pollution:
 Source: Goldman Sachs
• Goldman’s industrial activity tracker:
![]() Source: Goldman Sachs
Source: Goldman Sachs
——————–
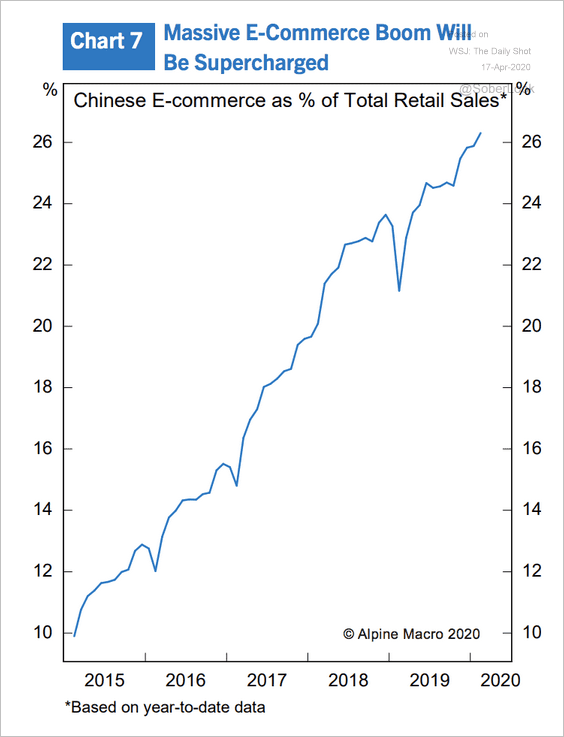
4. E-commerce will see further gains in market share due to the pandemic.
 Source: Alpine Macro
5. Beijing is concerned about the “second wave.”
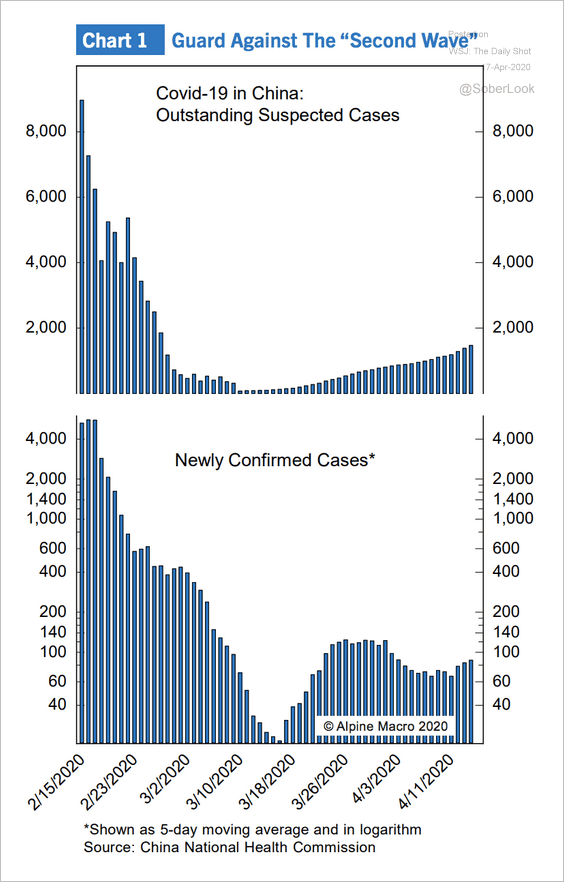 Source: Alpine Macro
6. China’s yield curve continues to steepen.
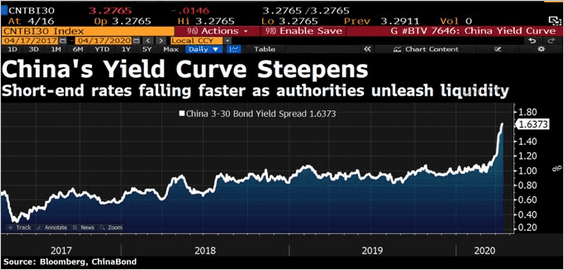 Source: @DavidInglesTV
Emerging Markets
1. India’s GDP growth could slow to less than 2%, according to TS Lombard.
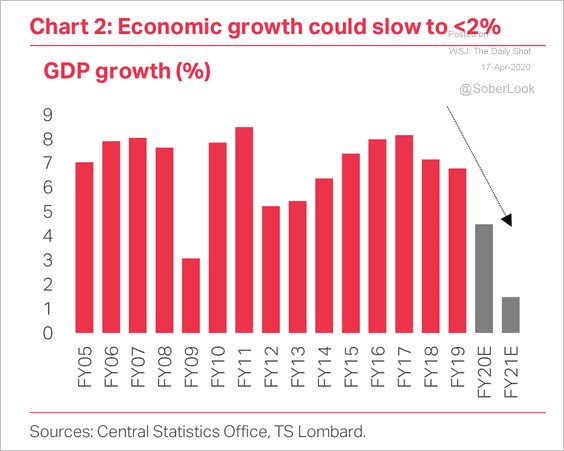 Source: TS Lombard
Vehicle sales in India have plunged.
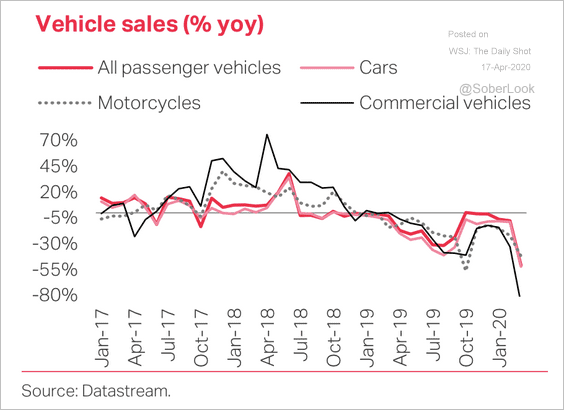 Source: TS Lombard
——————–
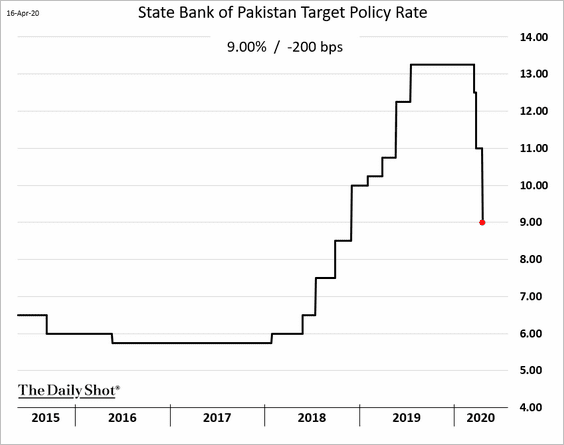
2. Pakistan’s central bank cut rates again.
3. Philippines stock prices broke support relative to the MSCI EM Index.
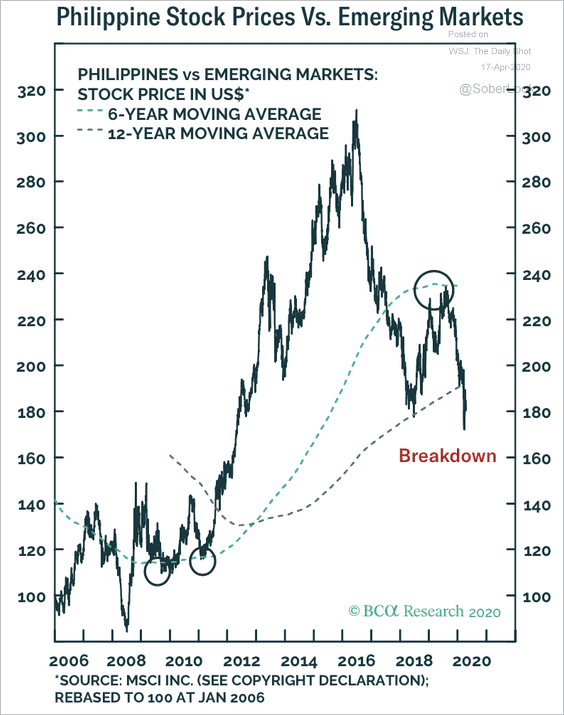 Source: BCA Research
However, Thai stocks are holding support.
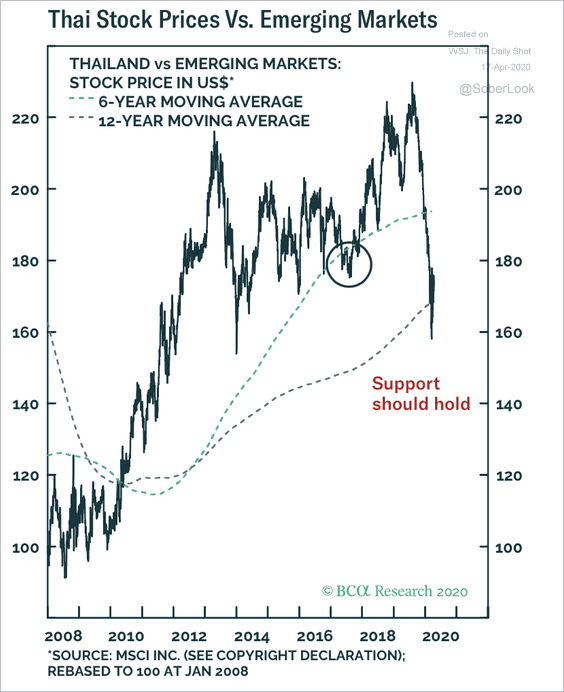 Source: BCA Research
——————–
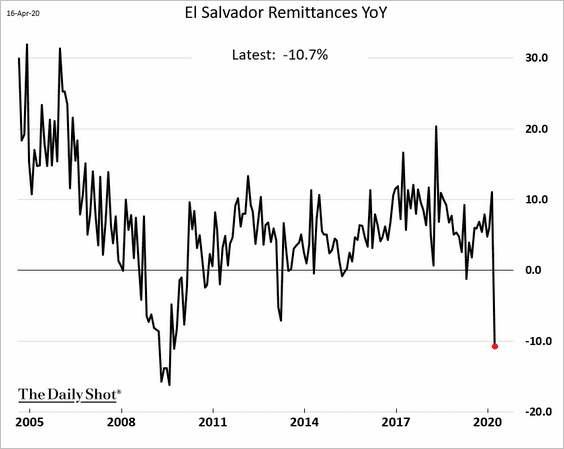
4. Many developing nations have been relying on remittances from family members working abroad. But the pandemic severely curtailed these cash flows. This chart shows remittances to El Salvador.
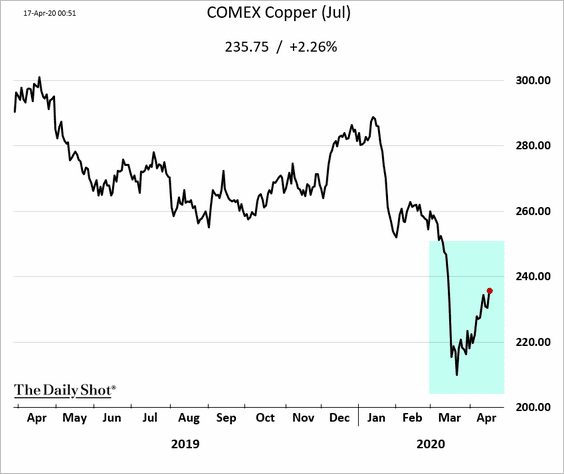
Commodities
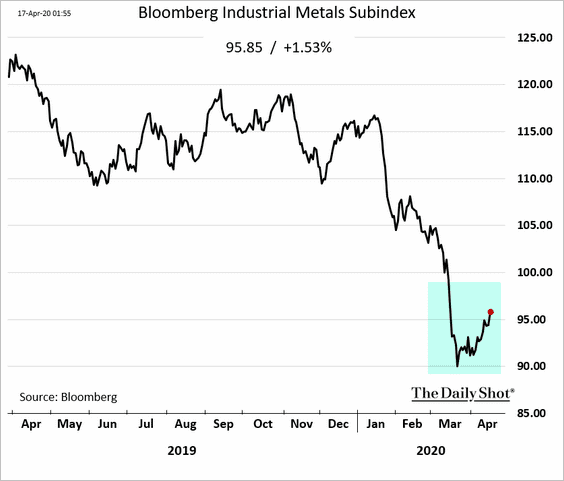
1. Copper is rebounding.
Here is Bloomberg’s industrial metals index.
——————–
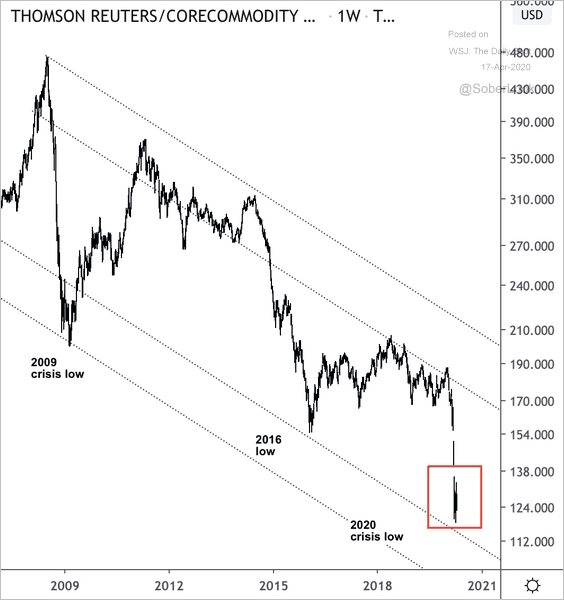
2. The Thomson Reuters CoreCommodity CRB Index hit extreme lows this year.
 Source: @DantesOutlook
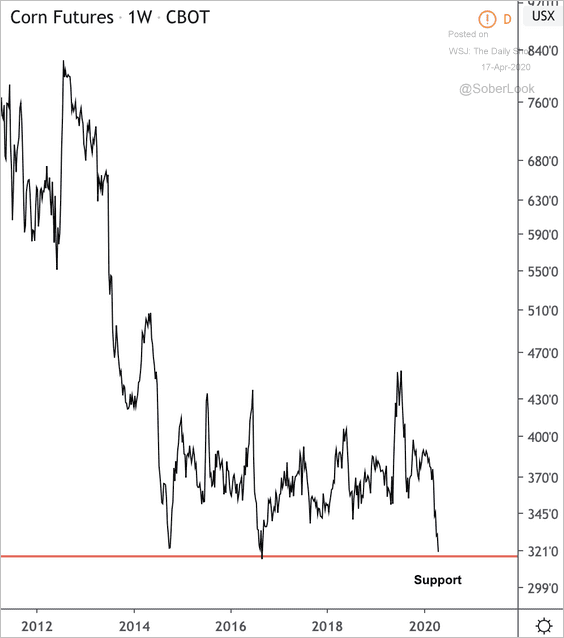
3. Will US corn futures hold support?
 Source: @DantesOutlook
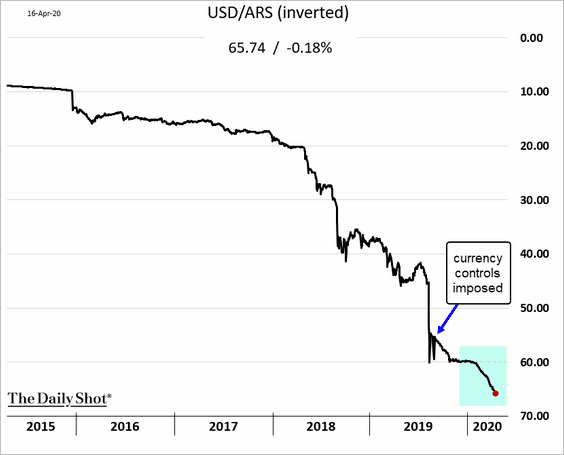
By the way, the Argentine corn harvest is moving forward rapidly, while the government continues to devalue the peso (second chart below). Both trends don’t bode well for US corn prices.
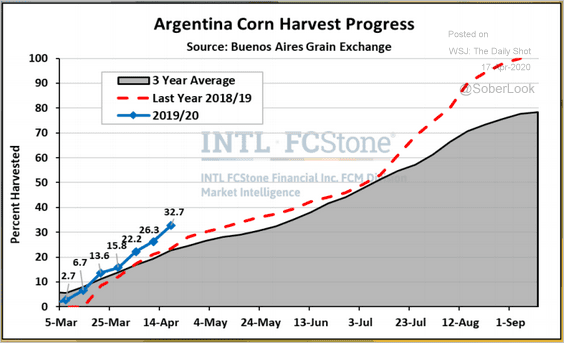 Source: @ArlanFF101
Energy
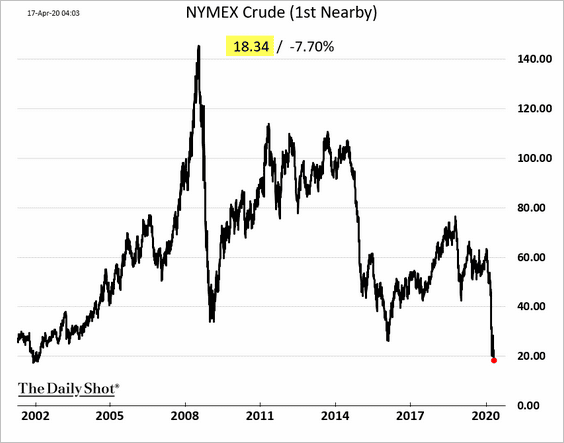
1. US crude oil broke the $20 support, trading below $19 for the first time since early 2002.
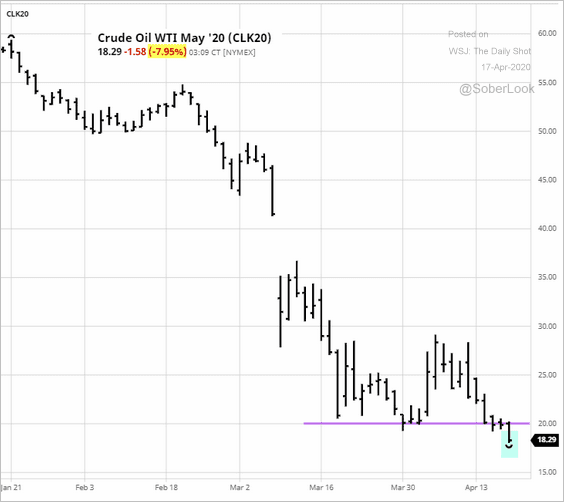 Source: barchart.com
——————–
2. Here’s how WTI crude oil futures performed after similar sell-offs in the past.
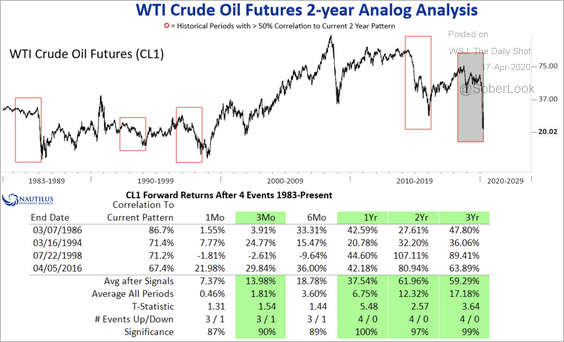 Source: @NautilusCap
3. The next chart shows an estimated attribution of the decline in prices.
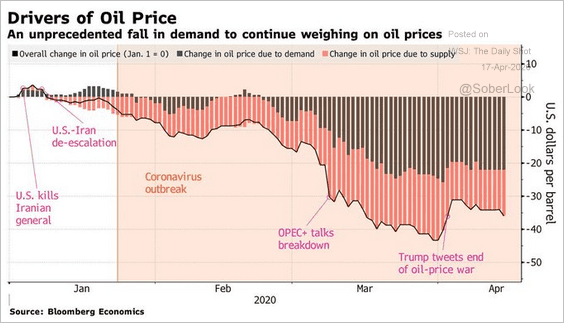 Source: @business Read full article
3. This year’s plunge in global oil demand will be unprecedented.
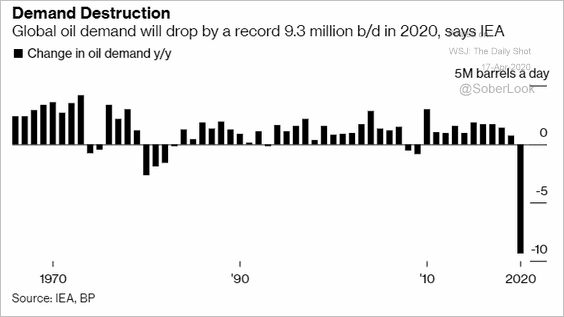 Source: @business Read full article
4. US net crude oil imports remain near multi-year lows.
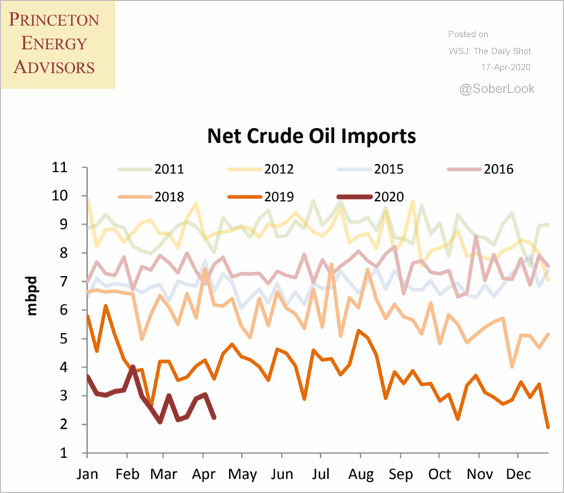 Source: Princeton Energy Advisors
5. Gasoline has significantly underperformed diesel.
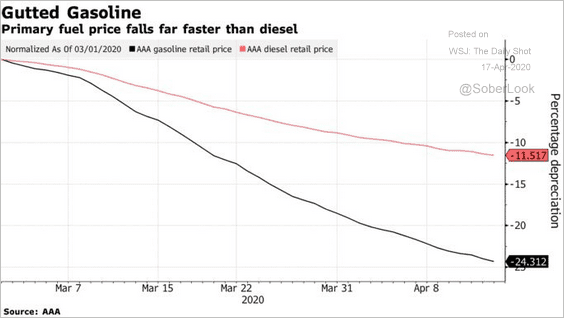 Source: @markets Read full article
Equities
1. Stock futures are up sharply …
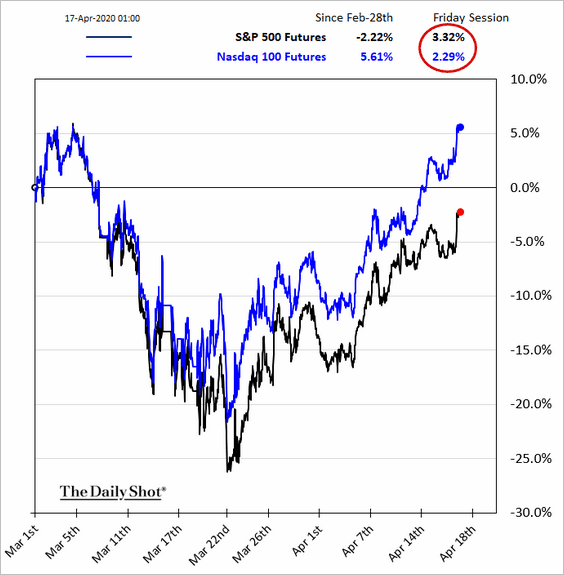
… on plans to begin reopening the economy, …
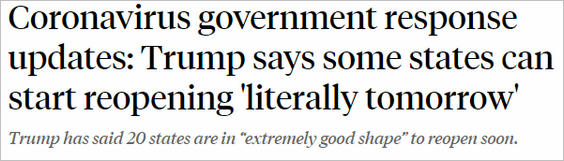 Source: ABC News Read full article
… and promising data on Gilead’s coronavirus treatment.
 Source: CNN Read full article
——————–
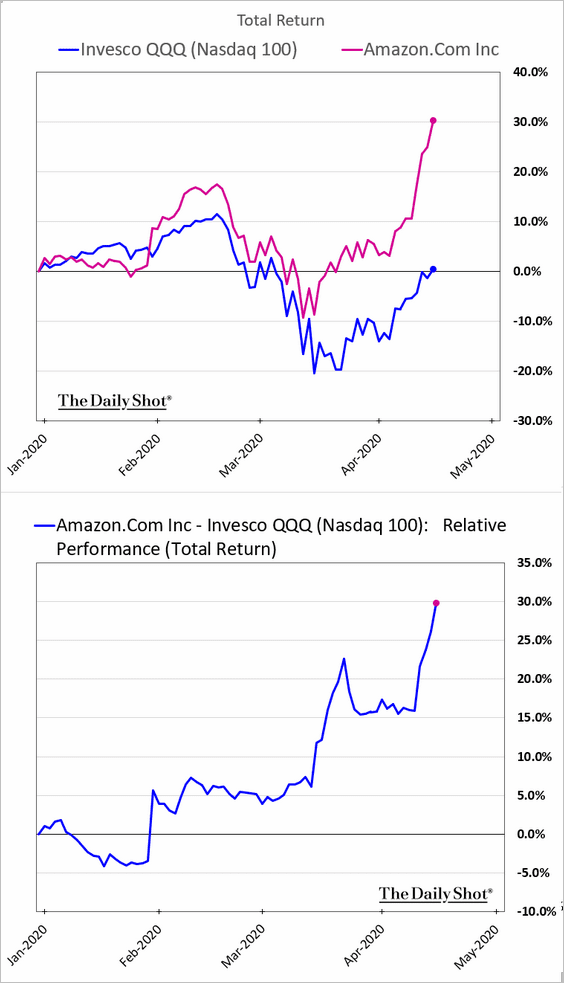
2. Nasdaq 100 (QQQ) is now up on the year, …
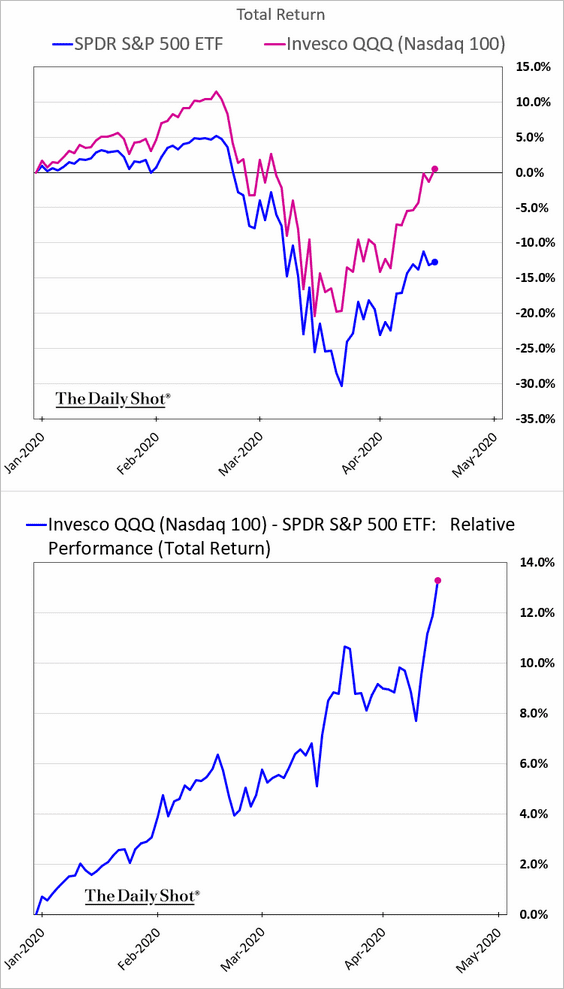
… with Amazon being the main driver of this outperformance.
——————–
3. Market recoveries tend to be driven by multiple expansion.
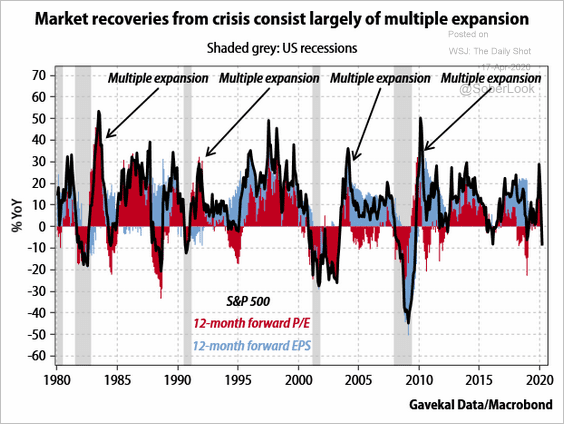 Source: Gavekal
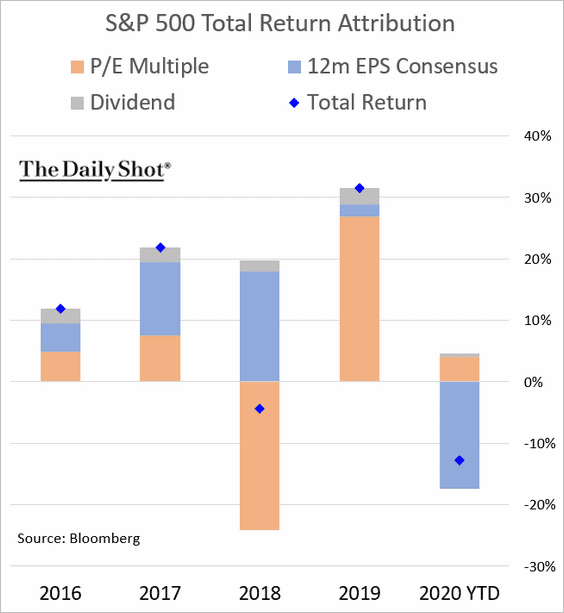
Below is the year-to-date S&P 500 performance attribution.
——————–
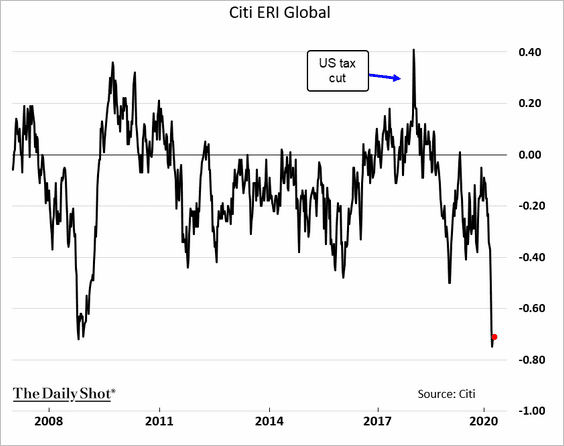
4. Here is Citi’s earnings revisions indicator, which measures the number of equity analyst upgrades vs. downgrades.
 Source:
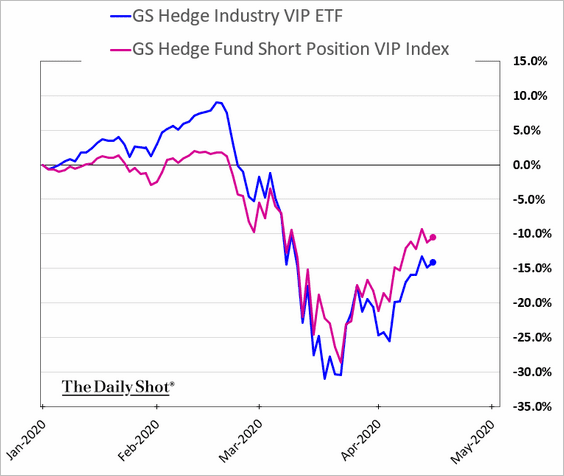
5. Stocks that hedge funds have been shorting are outperforming their long bets.
6. The era of buybacks is over.
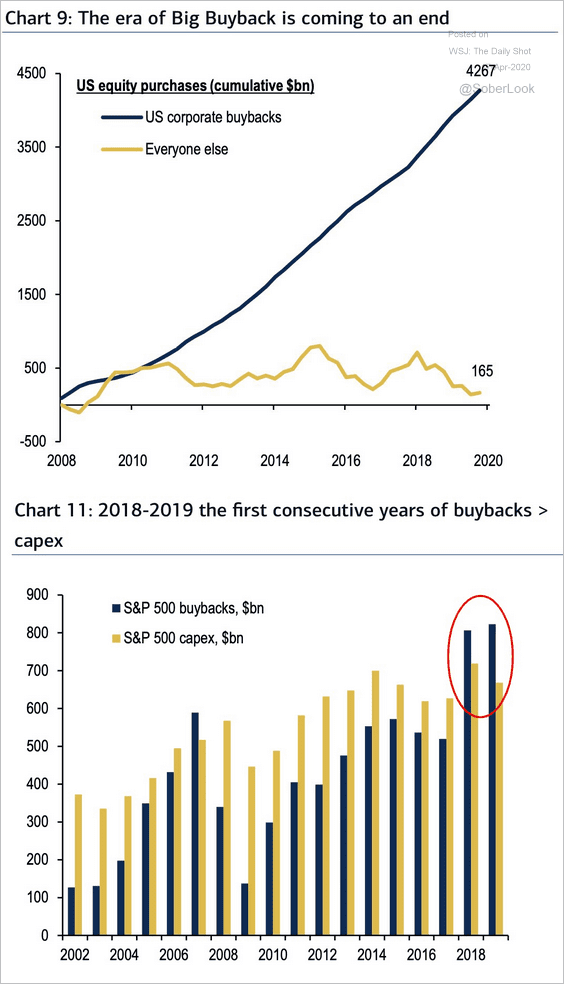 Source: BofA Merrill Lynch Global Research, @RobinWigg
Credit
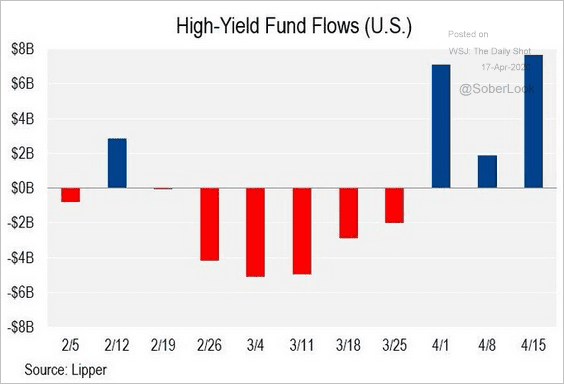
1. High-yield funds are enjoying massive capital inflows amid the Fed’s support for corporate debt.
 Source: @lcdnews
2. The US speculative-grade default rate could end the year at 13.4% and edge higher to 14.4% by the end of March 2021, according to Moody’s.
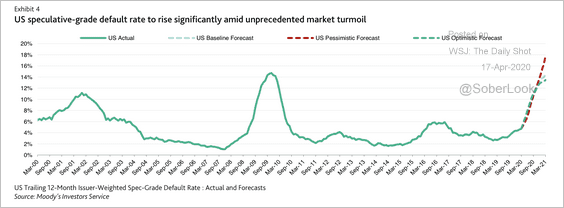 Source: Moody’s Investors Service
3. Consumer loan delinquencies in the US are about to spike.
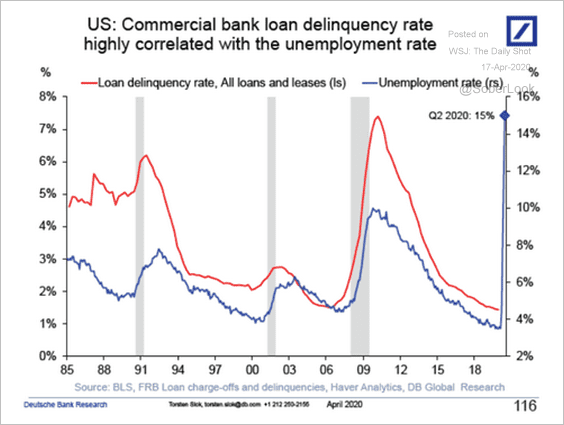 Source: Deutsche Bank Research
Rates
1. Here is Oxford Economics’ forecast for the Fed’s balance sheet.
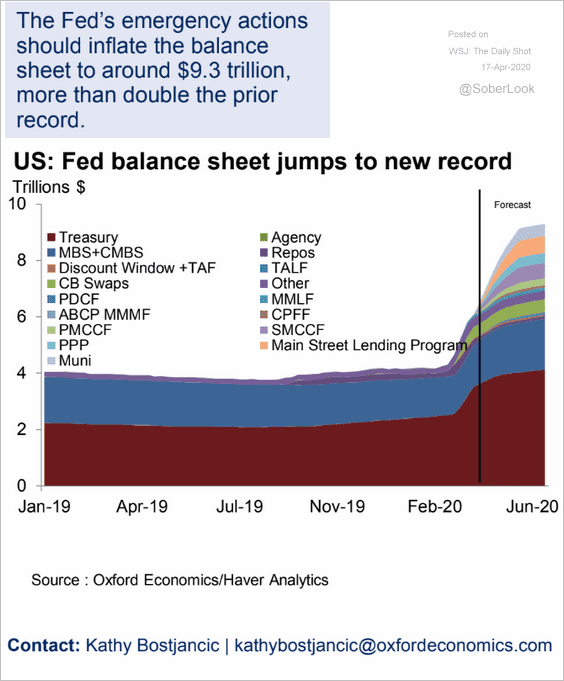 Source: Oxford Economics
The Fed’s demand for Treasuries will far outstrip the new supply.
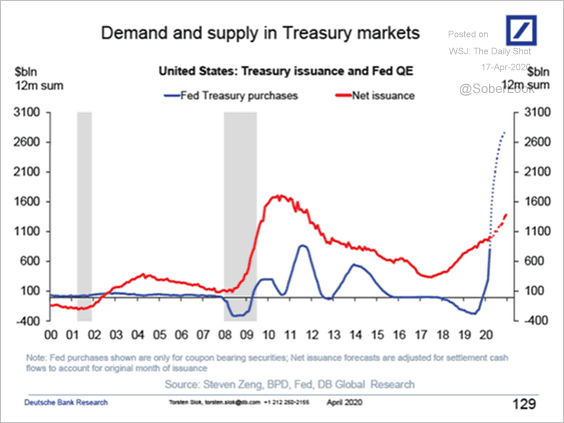 Source: Deutsche Bank Research
——————–
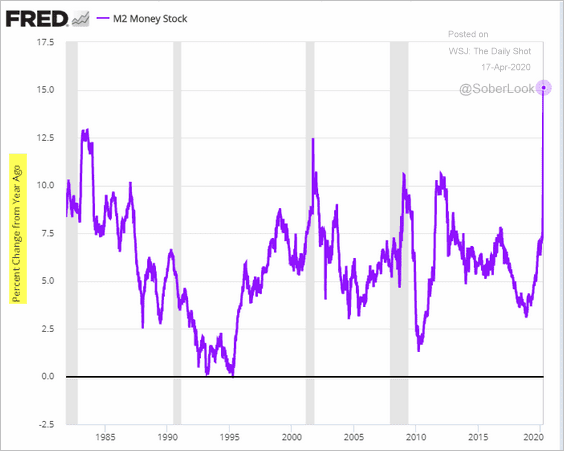
2. The US broad money supply is now over 15% higher vs. the same time last year (a record yearly increase).
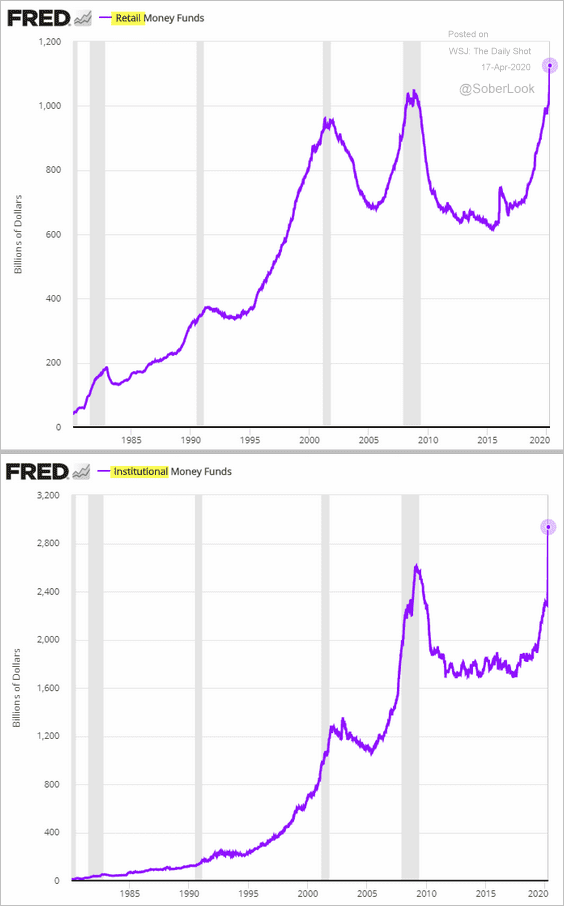
3. Money market funds’ assets under management continue to hit record highs.
Global Developments
1. The US dollar’s gains against EM currencies have been impressive.
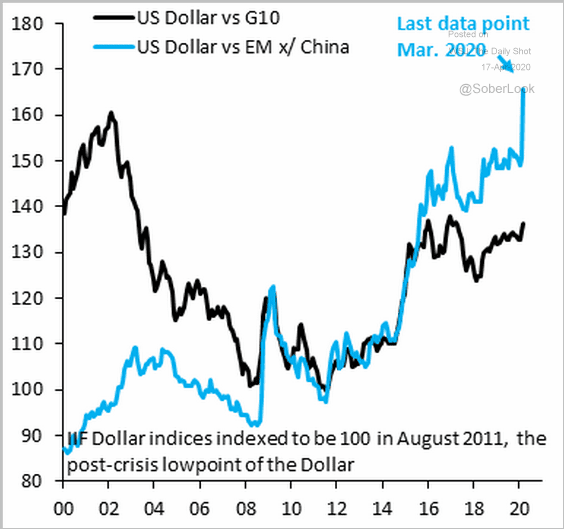 Source: @RobinBrooksIIF
The dollar is at long-term resistance.
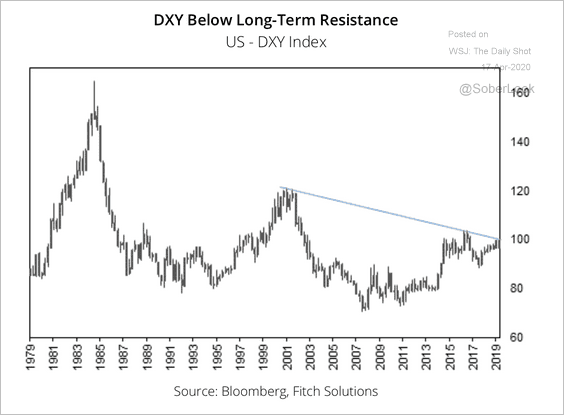 Source: Fitch Solutions Macro Research
——————–
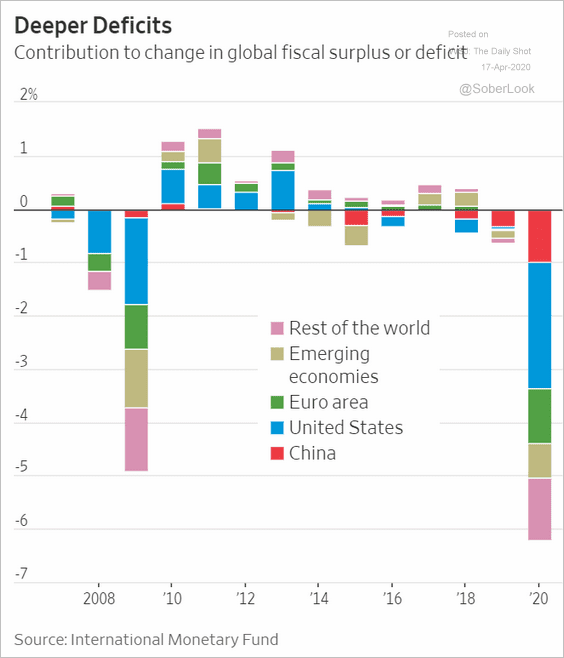
2. Global fiscal deficits will hit a new record this year.
 Source: @WSJ Read full article
——————–
Food for Thought
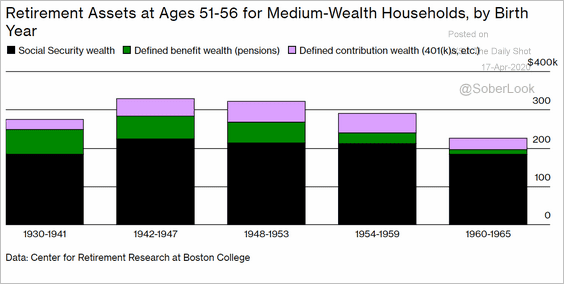
1. Retirement assets by generation at ages 51-56:
 Source: @BW Read full article
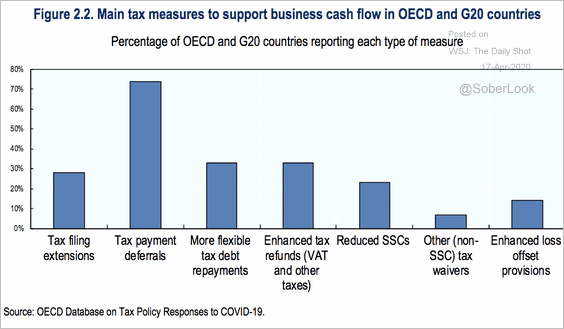
2. Global tax measures in response to the pandemic:
 Source: OECD Read full article
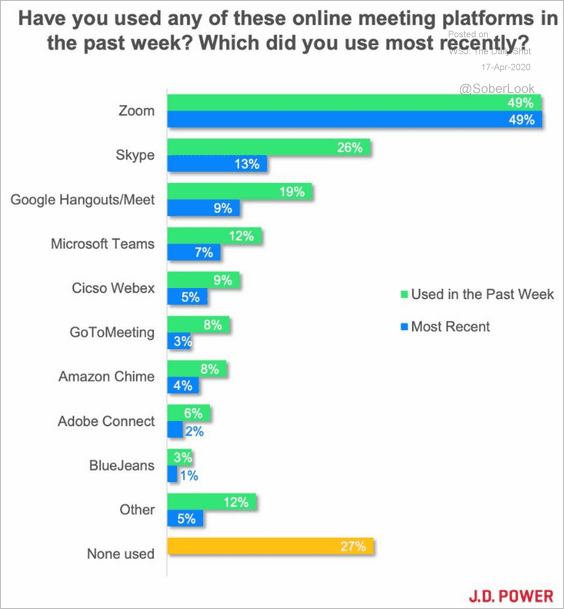
3. Online meeting platforms:
 Source: @JDPower, @Zoom_us
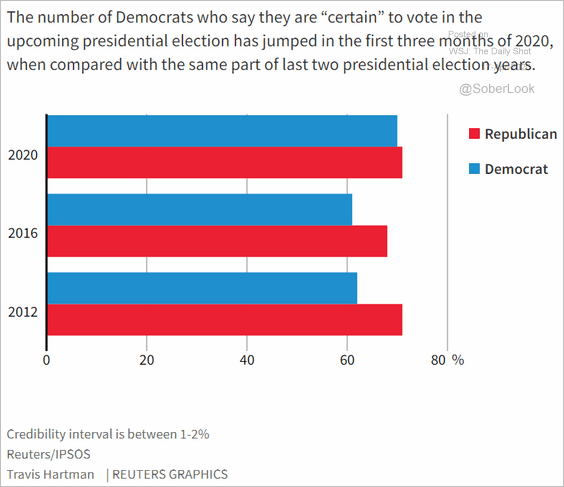
4. Who is “certain” to vote in November?
 Source: Reuters Read full article
5. The unprecedented decline in CO2 emissions this year:
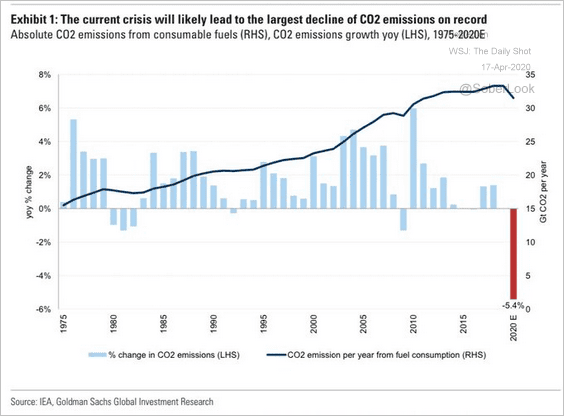 Source: Goldman Sachs, @carlquintanilla
6. Who is wearing face masks?
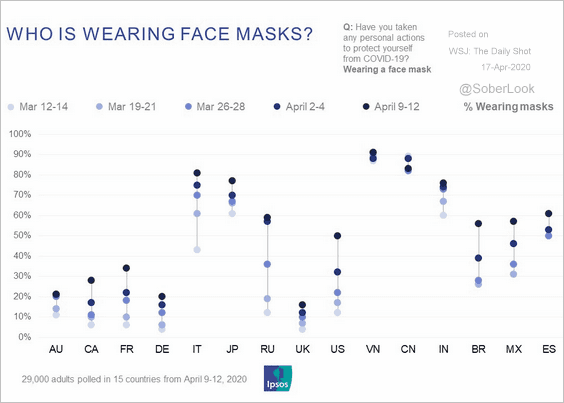 Source: Ipsos Read full article
7. Vaccine development:
 Source: Nature Read full article
8. What percentage of symptomatic coronavirus cases has been reported?
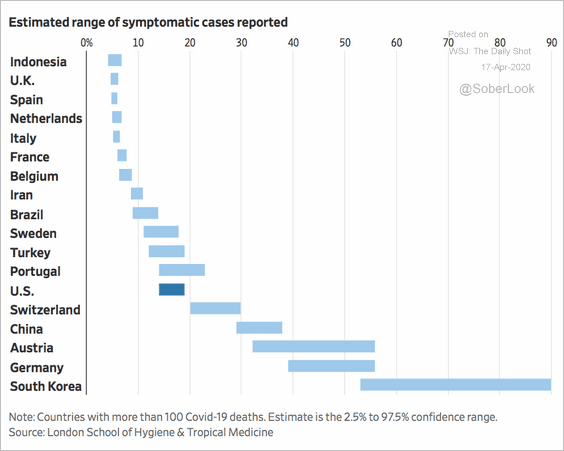 Source: @WSJ Read full article
9. Dressing up pets:
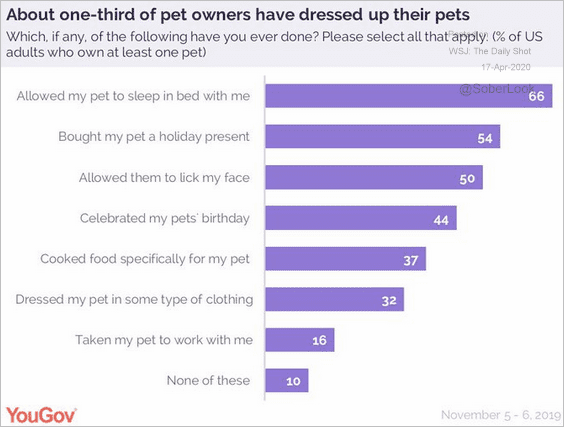 Source: @YouGovUS Read full article
——————–
Have a great weekend!