
The Daily Shot: 22-Apr-20
• Energy
• Equities
• Credit
• Rates
• Emerging Markets
• China
• The Eurozone
• The United Kingdom
• Canada
• The United States
• Food for Thought
Energy
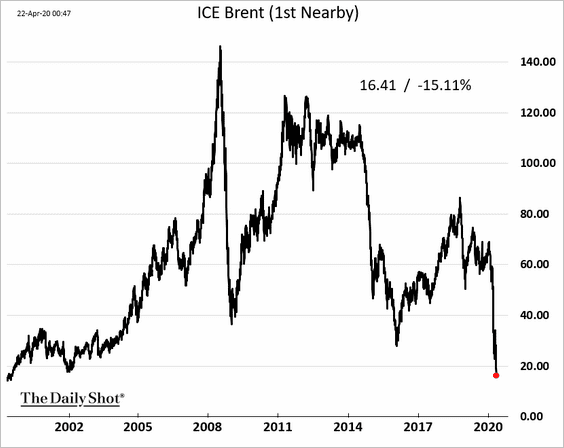
1. The extraordinary rout in crude oil continues as Brent futures dip below $17/bbl, lowest since 1999.
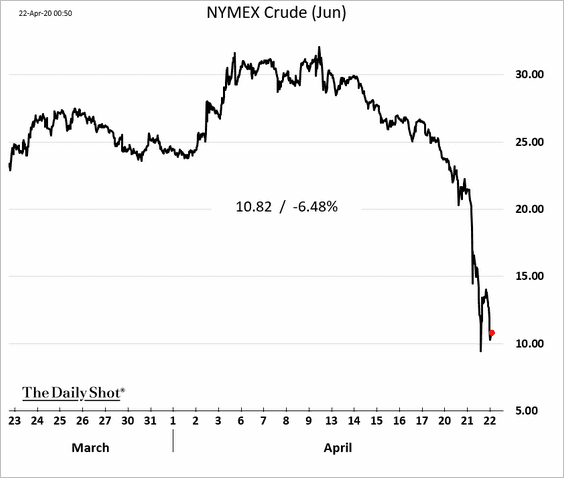
The June US oil futures contract is below $11/bbl.
The oil supply cuts have been lagging demand destruction, resulting in an unprecedented glut.
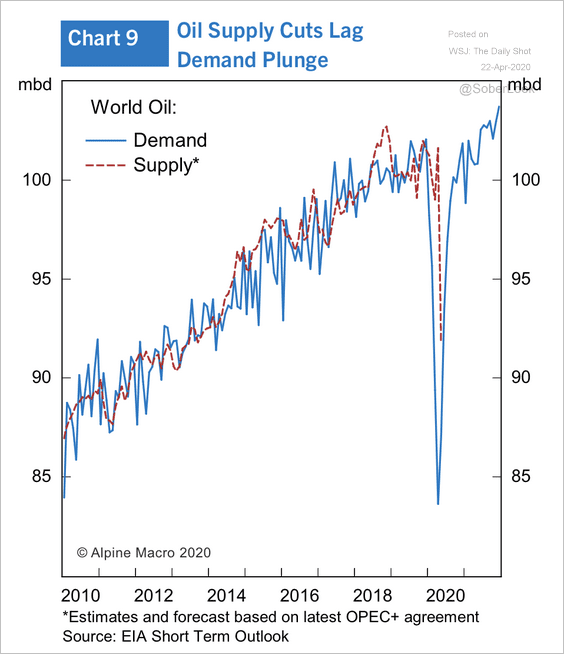 Source: Alpine Macro
——————–
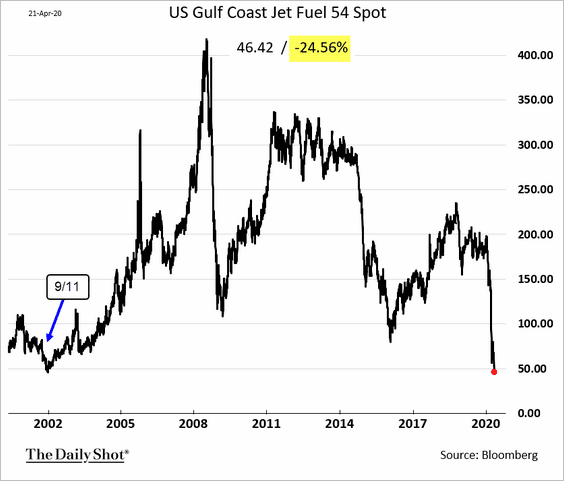
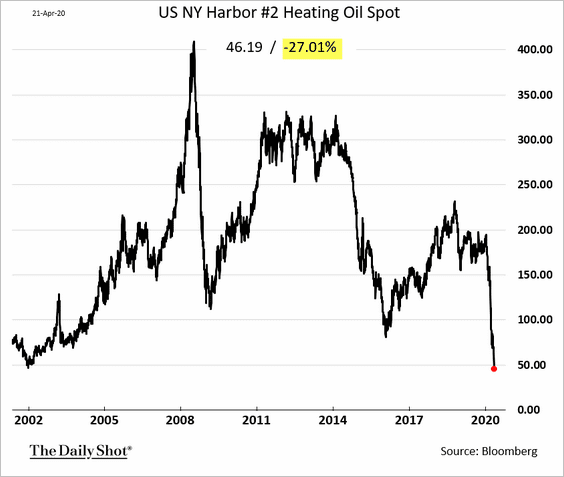
2. US refined products are at the lowest levels since early 2002 (the selloff that followed 9/11).
• Jet fuel:
• Heating oil:
——————–
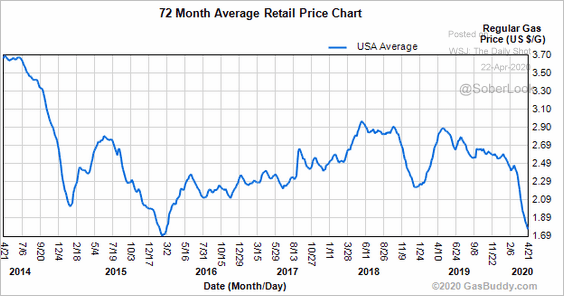
3. Retail gasoline prices have further to fall.
 Source: GasBuddy
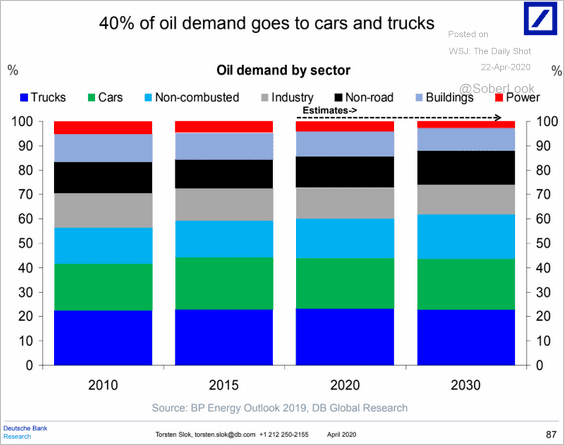
4. 40% of crude oil demand comes from cars and trucks.
 Source: Deutsche Bank Research
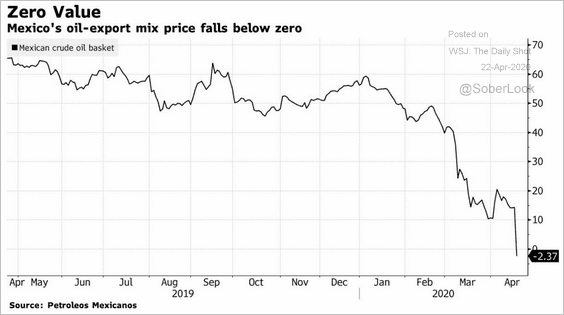
5. The price of Mexico’s crude oil mix used for exports dipped below zero.
 Source: @markets Read full article
6. The number of tankers utilized for floating storage continues to climb.
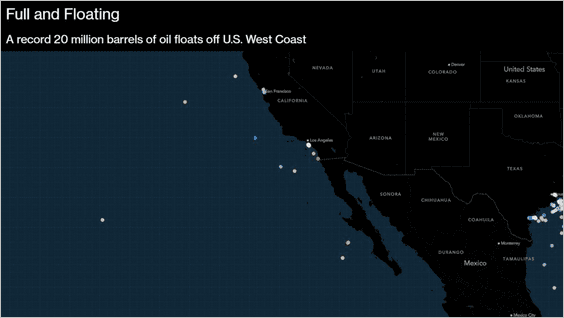 Source: @markets Read full article
7. The number of new US oil wells is expected to dwindle in the months ahead.
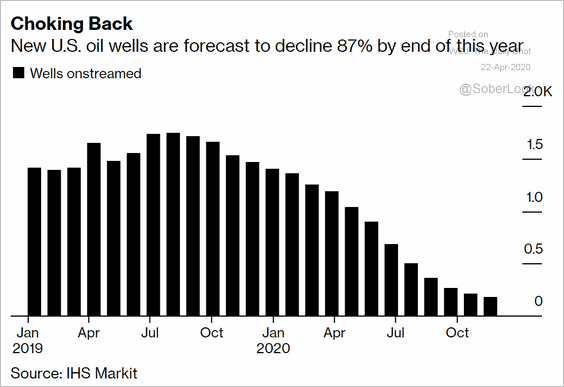 Source: @markets Read full article
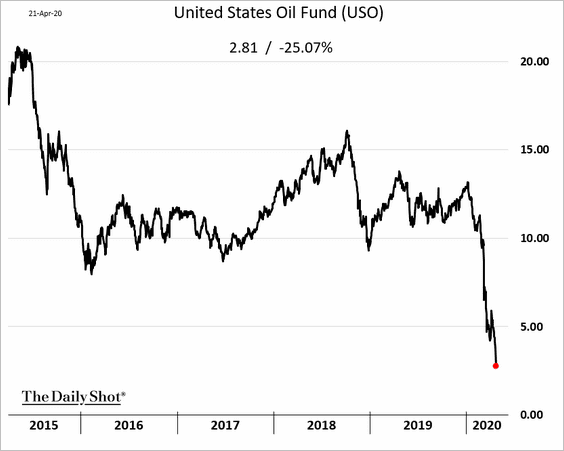
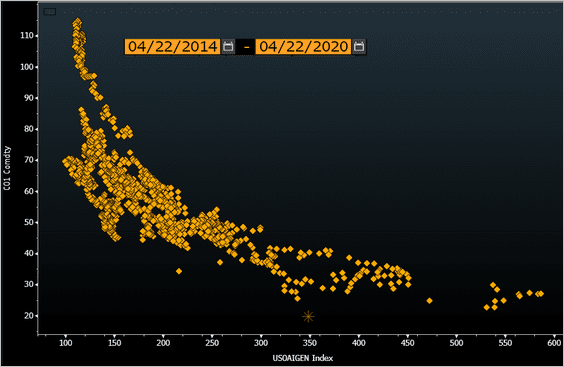
8. USO, the largest oil ETF, tumbled another 25% on Tuesday as the manager tries to keep it from shuttering.
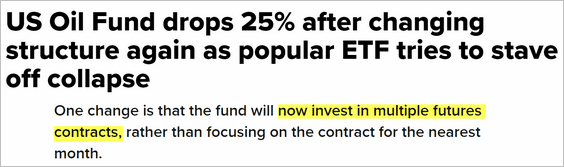 Source: CNBC Read full article
——————–
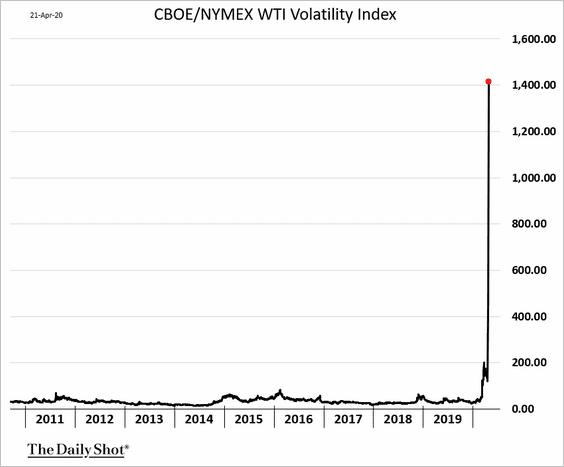
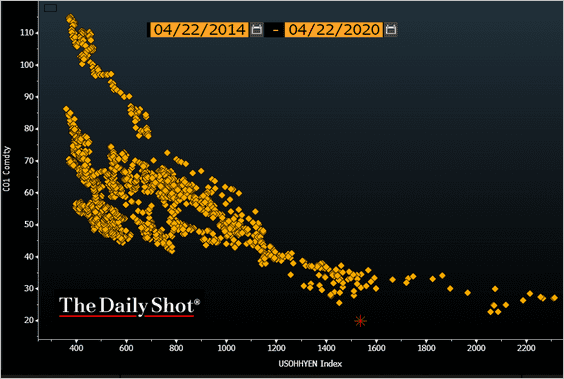
9. The CBOE crude oil volatility index has become meaningless. Volatility models typically assume a lognormal distribution, with prices never going to zero or below. That assumption no longer applies.
 Source: @markets Read full article
Equities
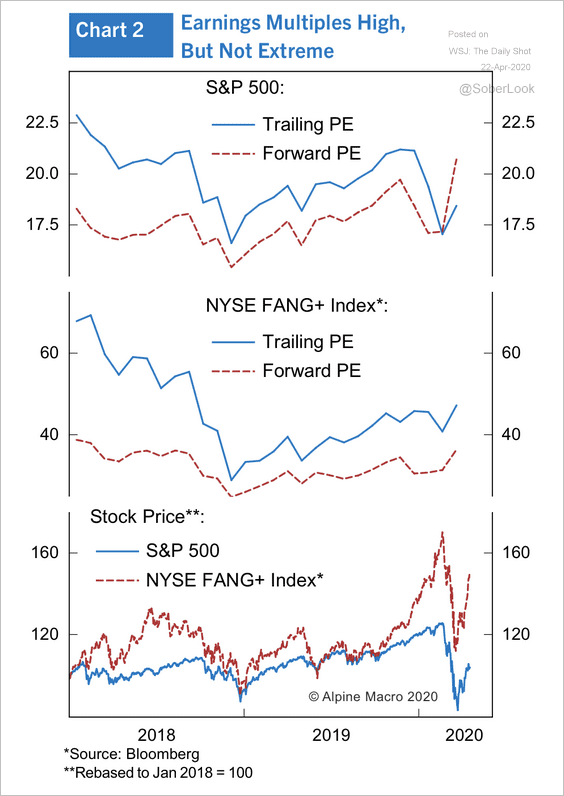
1. According to Alpine Macro, both S&P 500 trailing and forward earnings multiples are no longer cheap, and indiscriminate selling has given way to strong demand for large tech stocks.
 Source: Alpine Macro
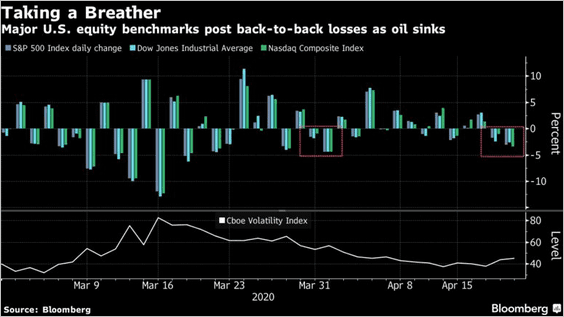
But the rally has stalled this week.
 Source: @markets Read full article
The Nasdaq Composite dipped below the 200-day and 50-day moving averages.
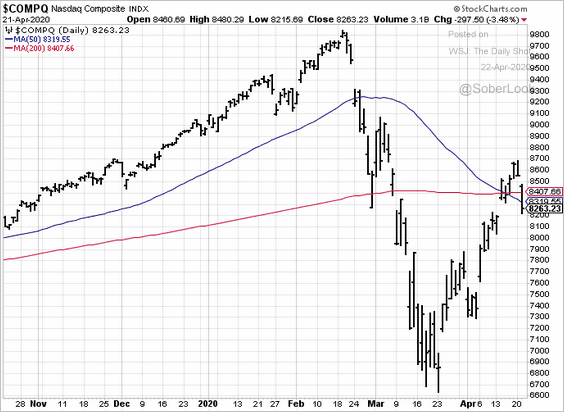 h/t Nancy Moran
——————–
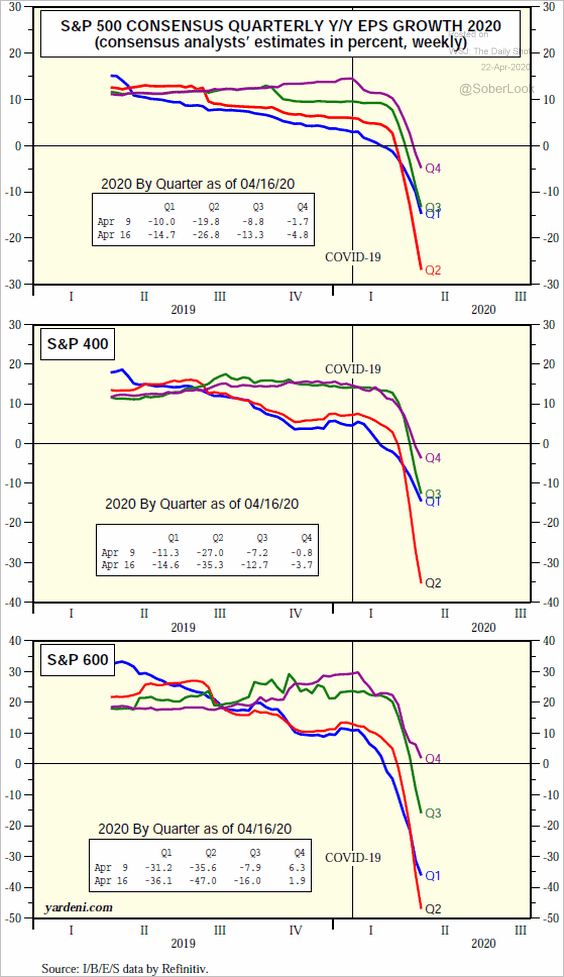
2. The charts below show consensus earnings-per-share (EPS) growth estimates by quarter (S&P 400 = mid-caps, S&P 600 = small-caps).
 Source: Yardeni Research
3. Activist campaigns have slowed.
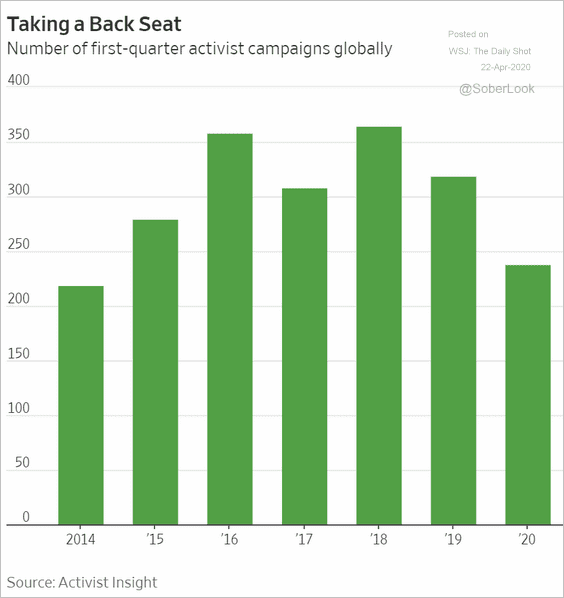 Source: @WSJ Read full article
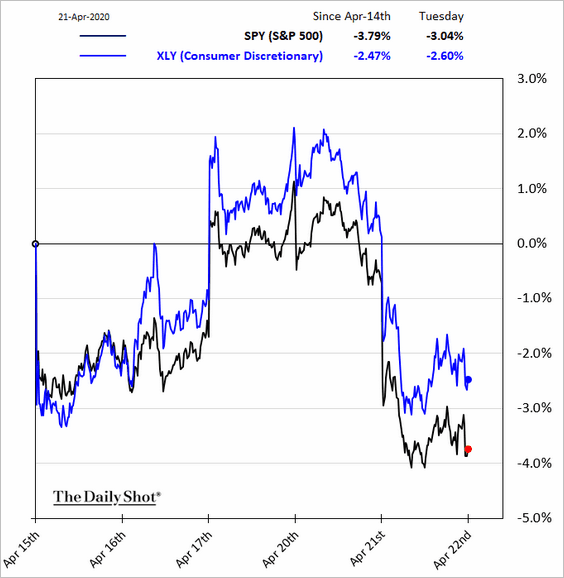
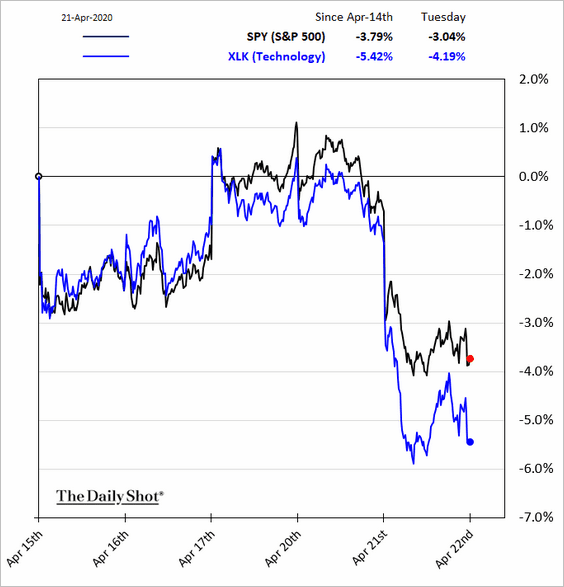
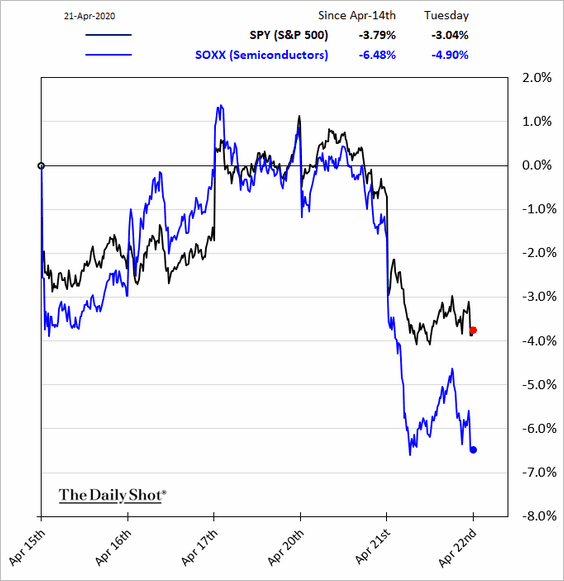
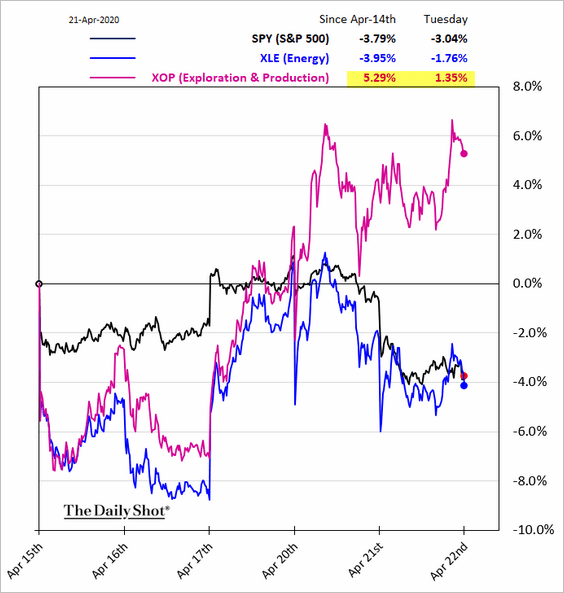
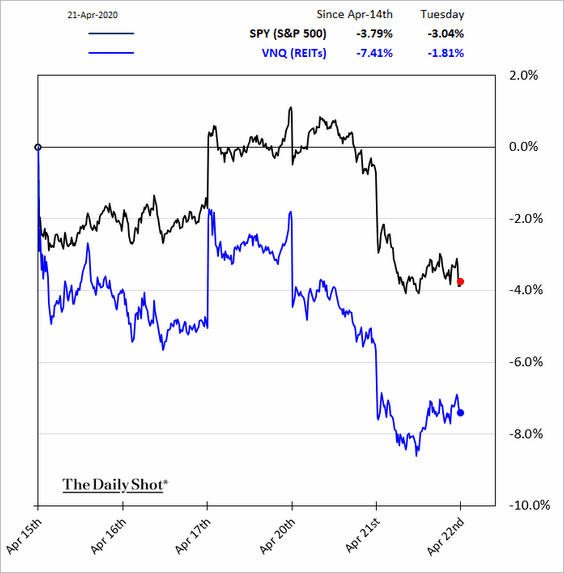
4. Next, we have some sector updates (5-day returns).
• Consumer Discretionary:
• Tech and semiconductors:
• Energy:
• REITs:
Credit
1. Energy-sector corporate bond spreads are much too tight given what has transpired in the oil markets.
• Y-axis = Brent crude; X-axis = energy investment-grade spread:
 Source: @TheTerminal
• Y-axis = Brent crude; X-axis = energy high-yield spread:
 Source: @TheTerminal
——————–
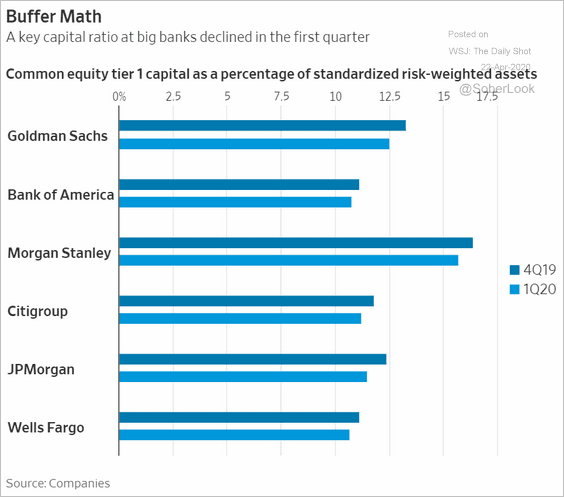
2. US banks’ capital ratios are still relatively healthy.
 Source: @WSJ Read full article
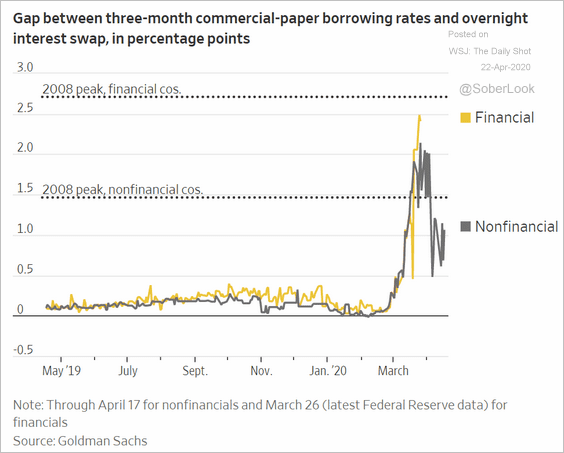
But financial commercial paper spreads have been elevated, …
 Source: @WSJ Read full article
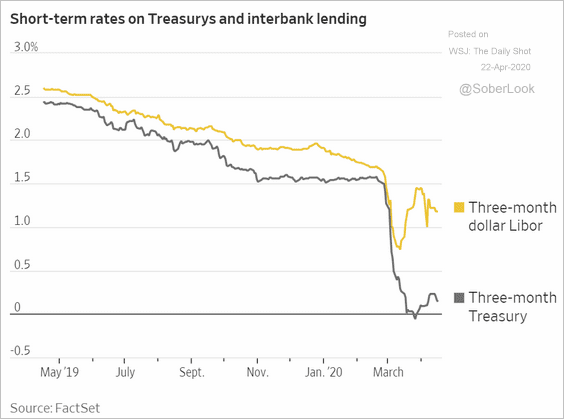
… and so is the TED spread.
 Source: @WSJ Read full article
——————–
3. Syndicated middle market loan issuance remains shattered, with zero volume in March and so far in April.
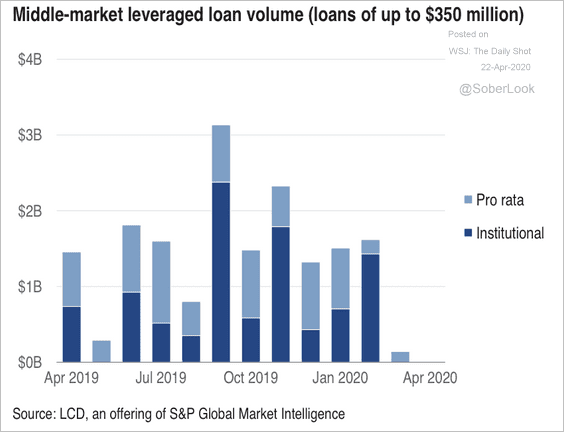 Source: S&P Global Market Intelligence
4. Here is the ratio of positive-to-negative industry outlooks from Moody’s.
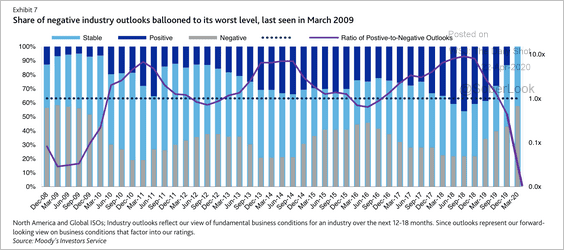 Source: Moody’s Investors Service
5. Finances of a number of states are increasingly stretched.
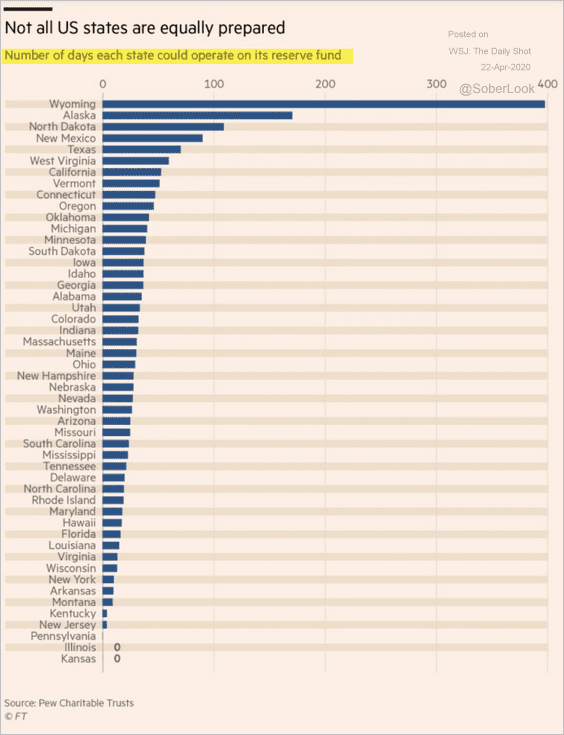 Source: @financialtimes Read full article
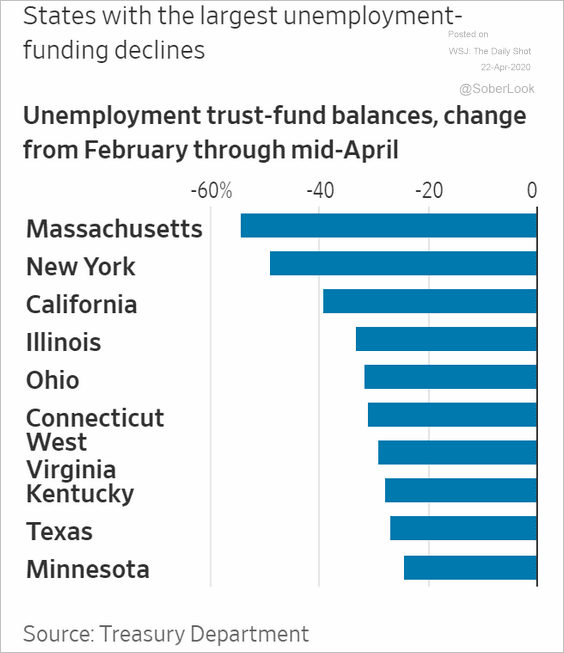 Source: @WSJ Read full article
Rates
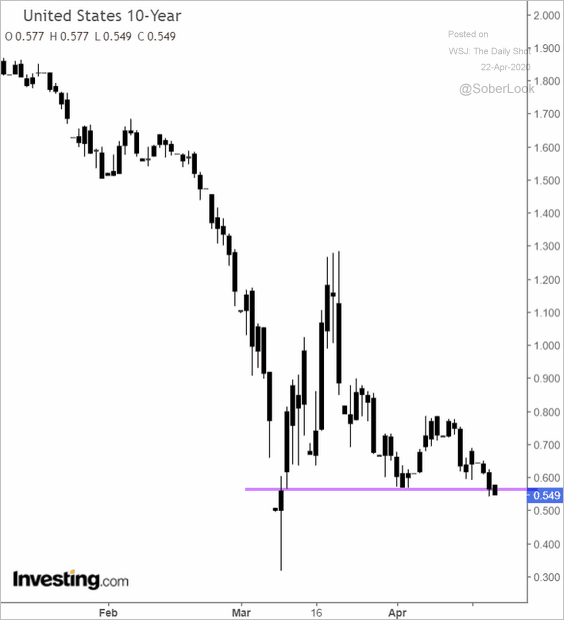
1. The 10yr Treasury yield is below 0.6% again.
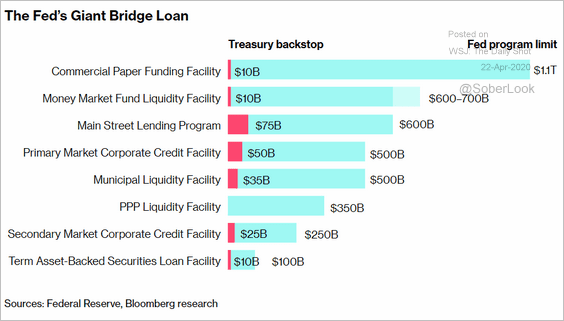
2. Here is a good summary of the Fed’s new stimulus programs.
 Source: @business Read full article
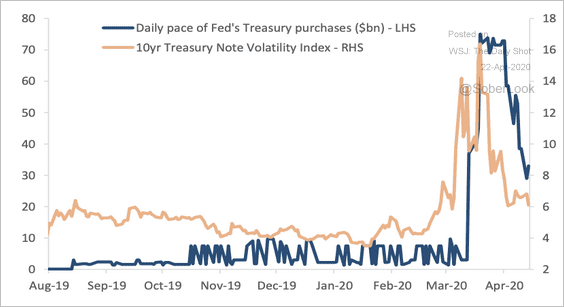
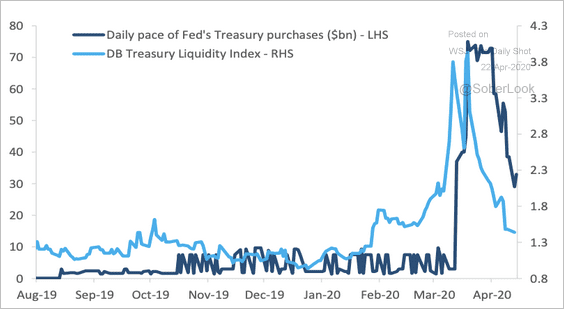
3. Volatility and market liquidity for Treasuries have normalized close to pre-crisis levels (two charts).
 Source: Deutsche Bank Research
 Source: Deutsche Bank Research
Emerging Markets
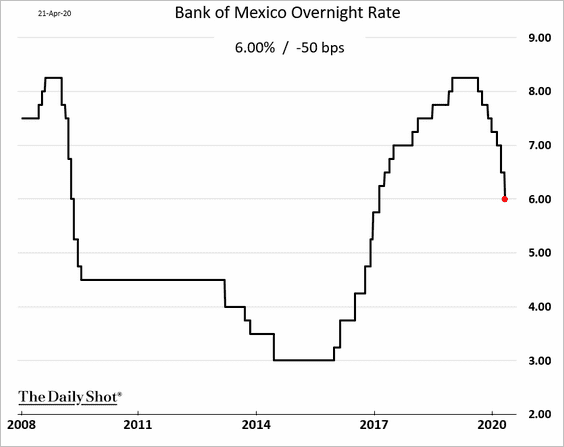
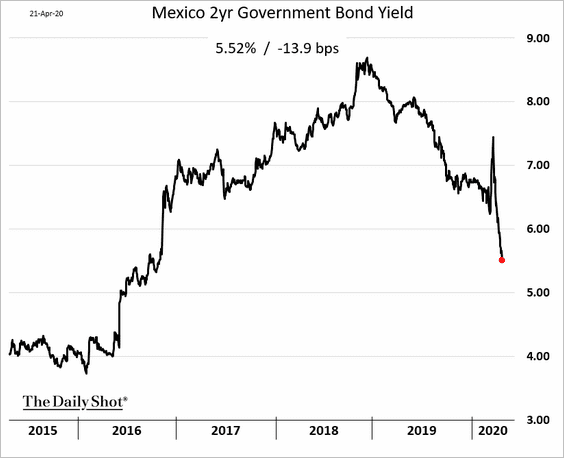
1. Below are some updates on Mexico.
• Banxico cut rates again.
• Short-term bond yields declined sharply.
• But real rates remain elevated.
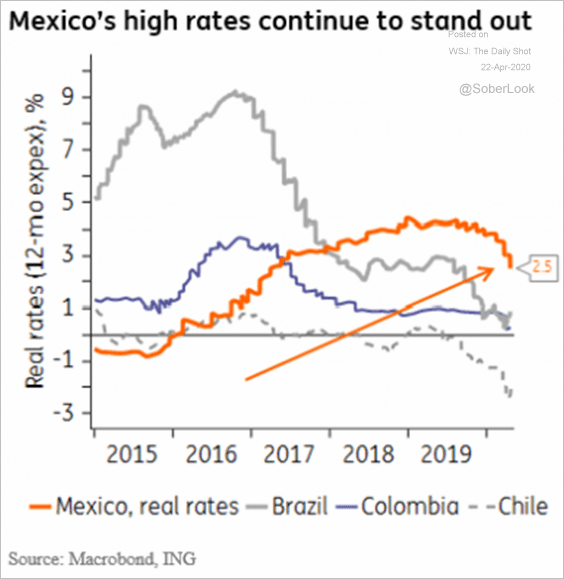 Source: ING
• The central bank doesn’t want to be too aggressive with rate cuts because of concerns about the peso’s weakness (the purple line shows the dollar appreciating against the peso).
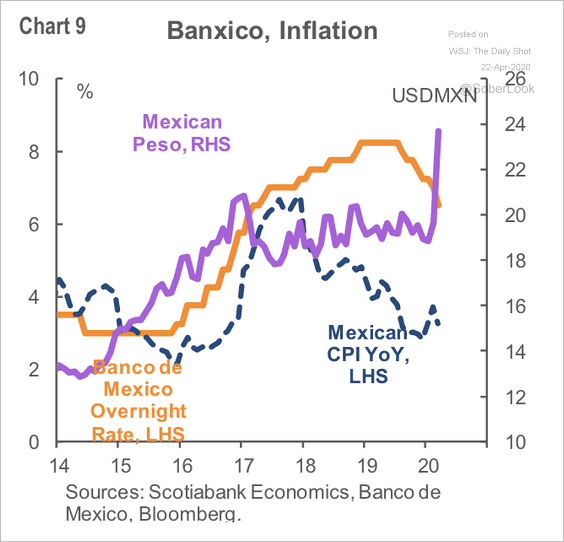 Source: Scotiabank Economics
——————–
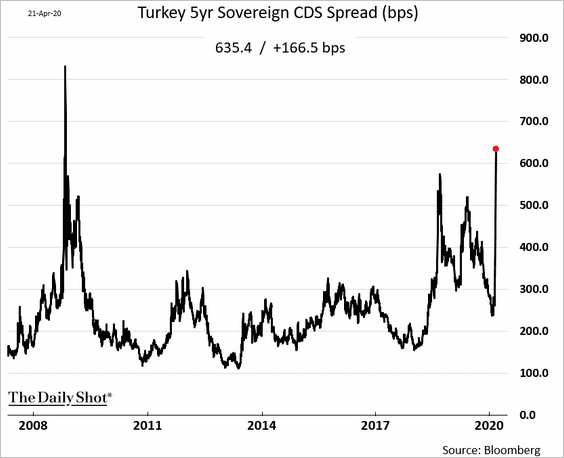
2. Turkey’s sovereign credit default swap spread is above 600 bps for the first time since the financial crisis.
China
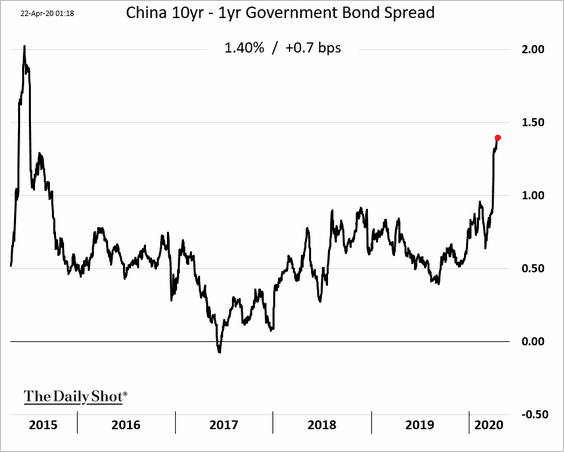
1. The yield curve keeps steepening.
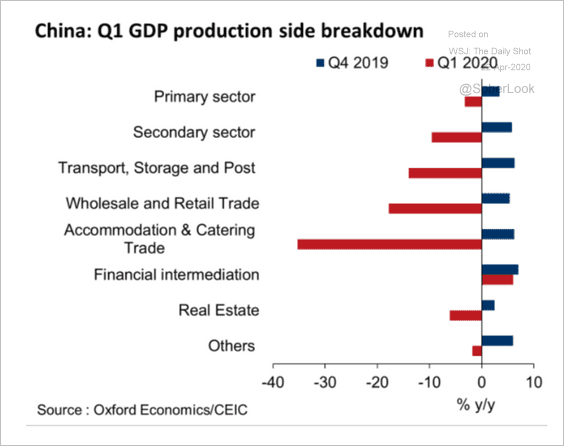
2. Here are the Q1 GDP growth components (vs. Q4).
 Source: Oxford Economics
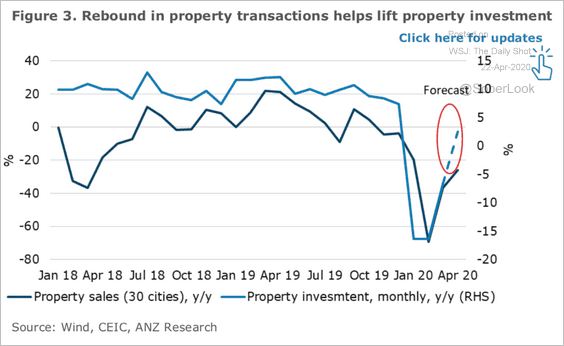
3. Property investment has been rebounding.
 Source: ANZ Research
4. Finally, this chart shows consumer spending expectations.
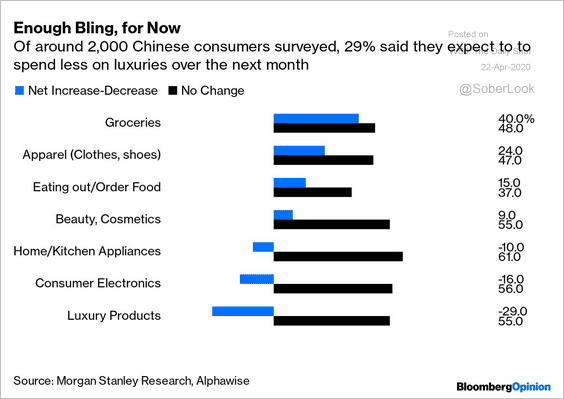 Source: @bopinion Read full article
The Eurozone
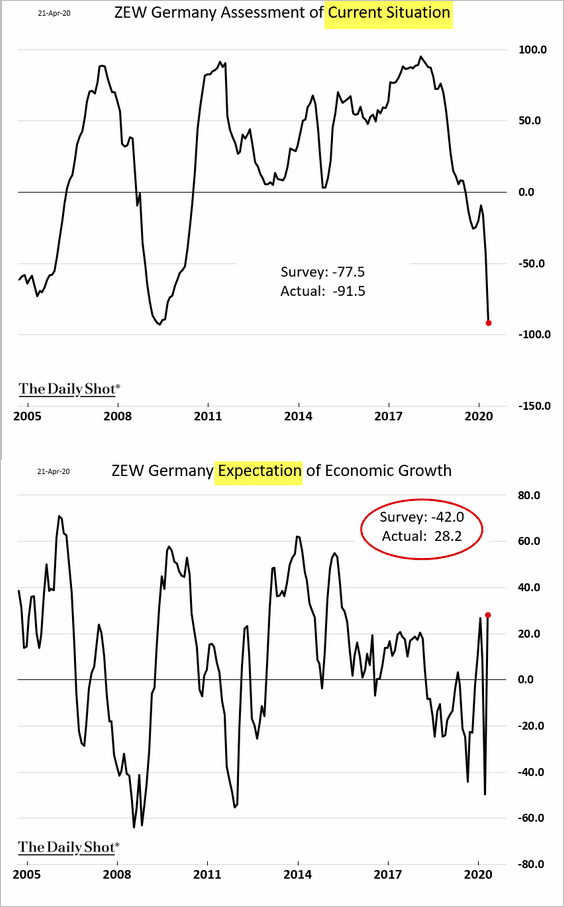
1. Germany’s ZEW expectations index unexpectedly rebounded in April (second chart).
 Source: MarketWatch Read full article
——————–
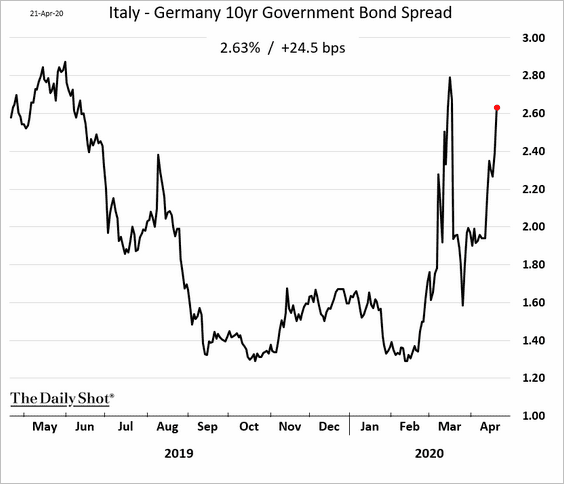
2. Italian bond yields and spreads are climbing again.
 Source: Reuters Read full article
——————–
3. Recently, EUR/USD has been relatively stable, even as bank stocks declined.
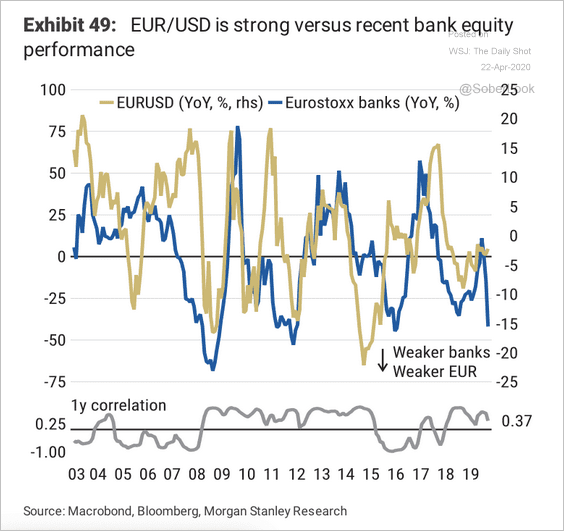 Source: Morgan Stanley Research
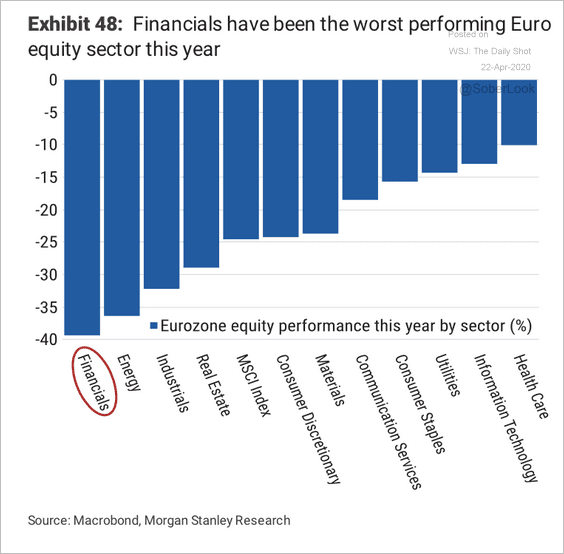
Financials have been the worst-performing sector this year.
 Source: Morgan Stanley Research
The United Kingdom
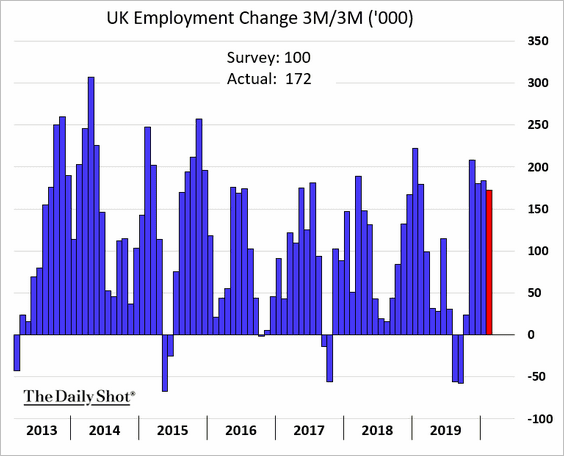
1. Employment was relatively robust in February (before the crisis).
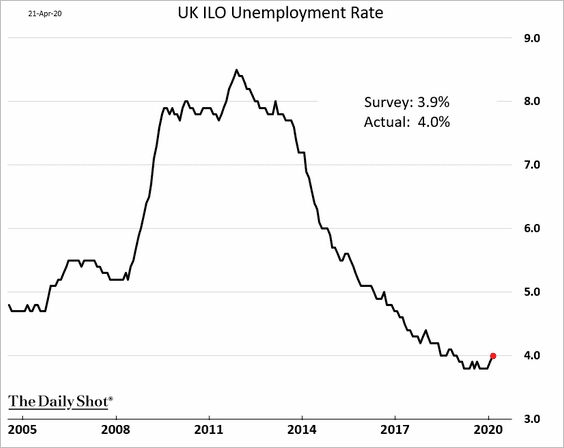
The unemployment rate ticked higher.
——————–
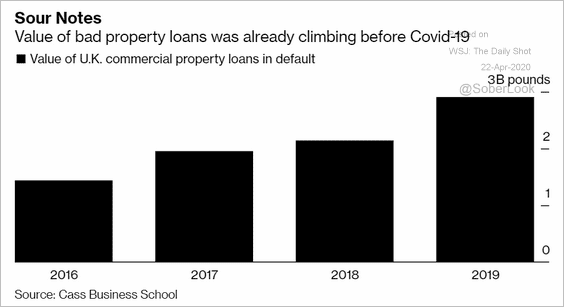
2. Defaulted commercial property debt rose substantially last year. The situation is far worse now.
 Source: @markets Read full article
3. The total number of UK deaths spiked in April.
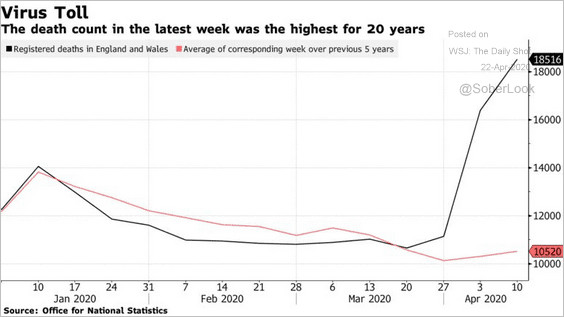 Source: @bpolitics Read full article
Canada
1. Statistics Canada forecasts a 2.6% GDP contraction in the first quarter.
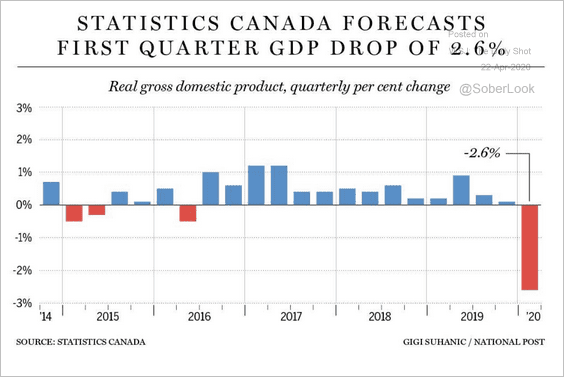 Source: National Post Read full article
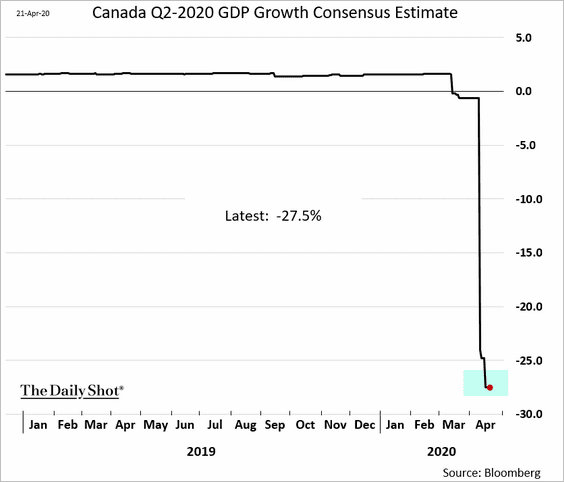
The second-quarter decline is expected to be ten times greater.
——————–
2. The magnitude of S&P/TSX forward price-to-earnings decline is now similar to other episodes of extreme market stress.
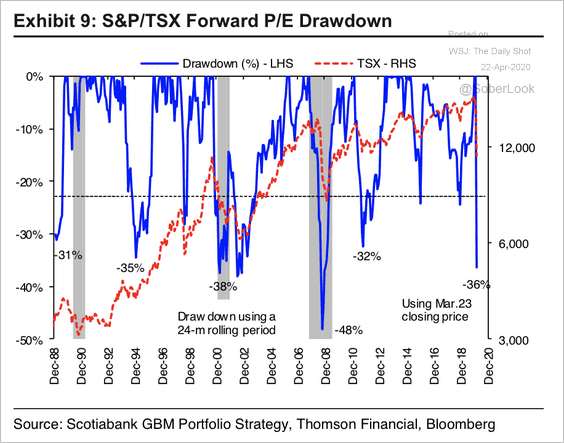 Source: Hugo Ste-Marie, Portfolio & Quantitative Strategy Global Equity Research, Scotia Capital
3. Canada has the most negative real policy rate anywhere.
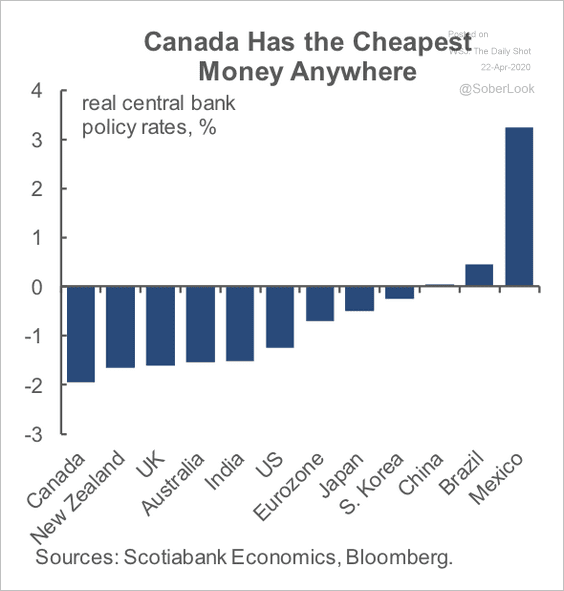 Source: Scotiabank Economics
4. Bankers’ acceptance rates are narrowing toward the overnight policy rate. This is a reflection of the Bank of Canada’s efforts to calm short-term paper markets.
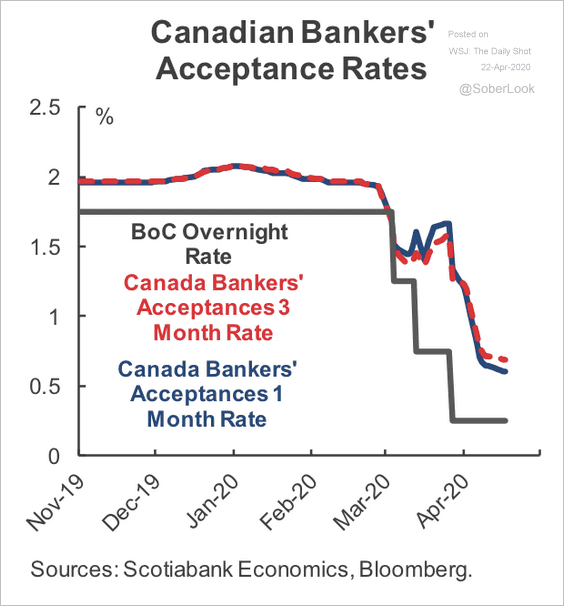 Source: Scotiabank Economics
5. Canada’s labor productivity is lagging the US again.
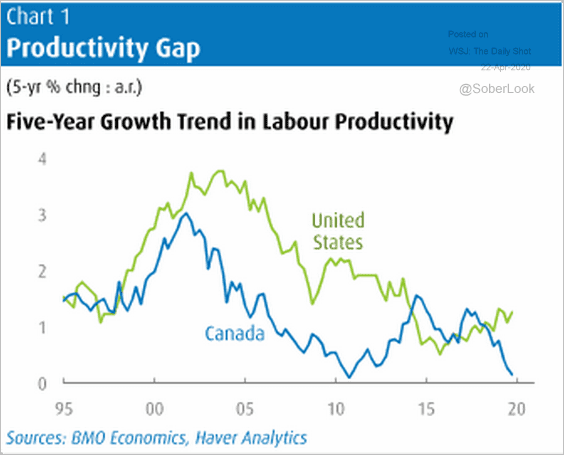 Source: BMO Capital Markets Read full article
The United States
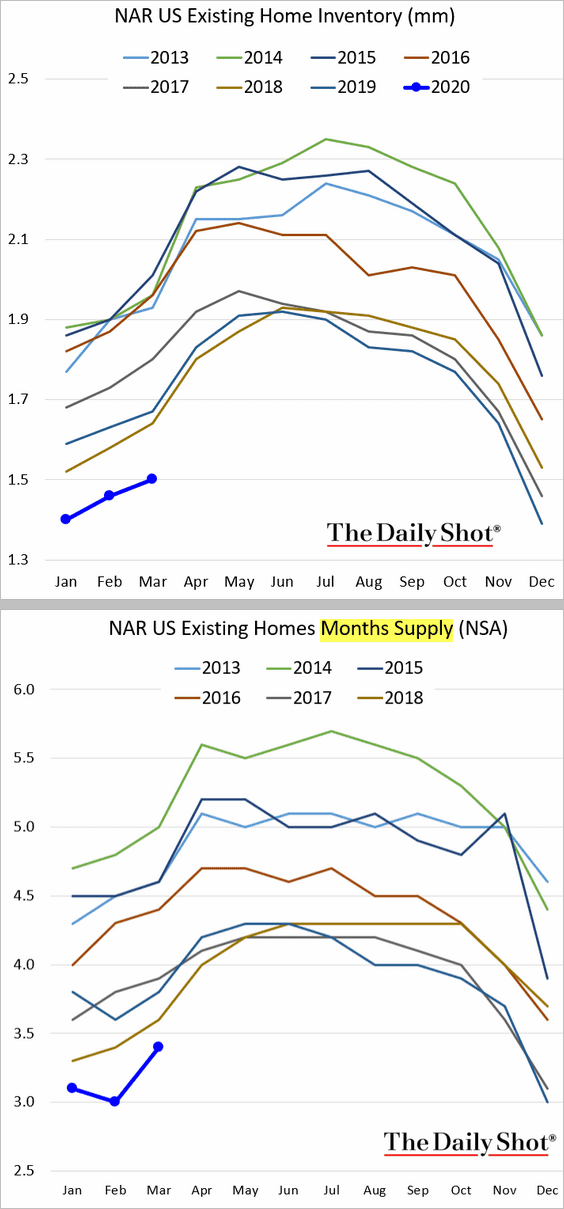
1. Despite the onset of the pandemic, existing home sales were relatively robust in March, running at 2016 levels.
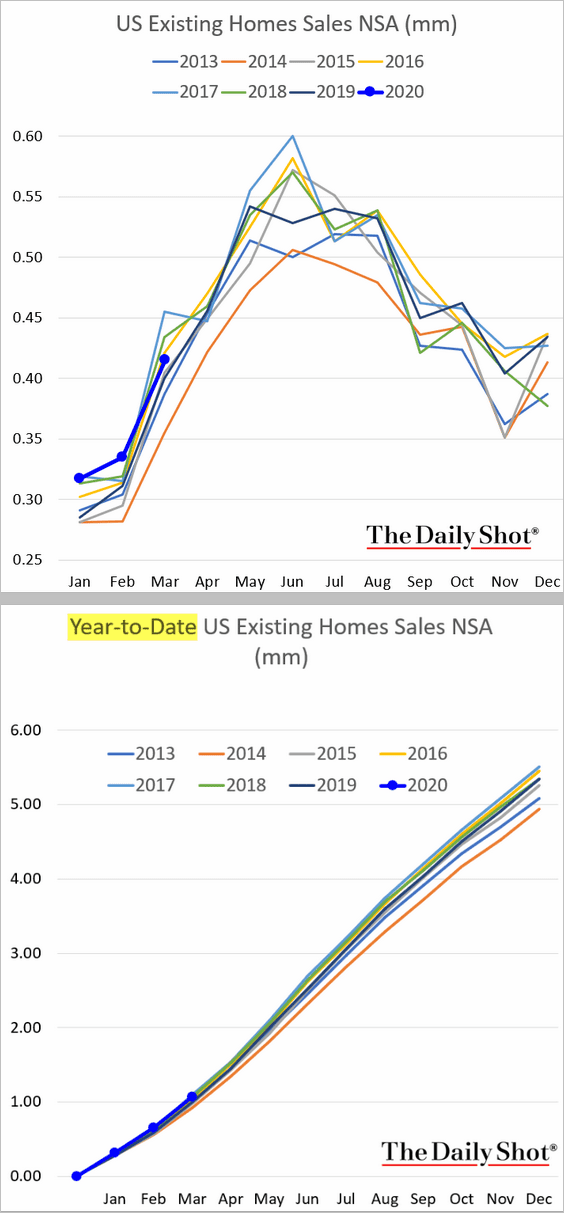
Inventories of homes for sale remained at multi-year lows.
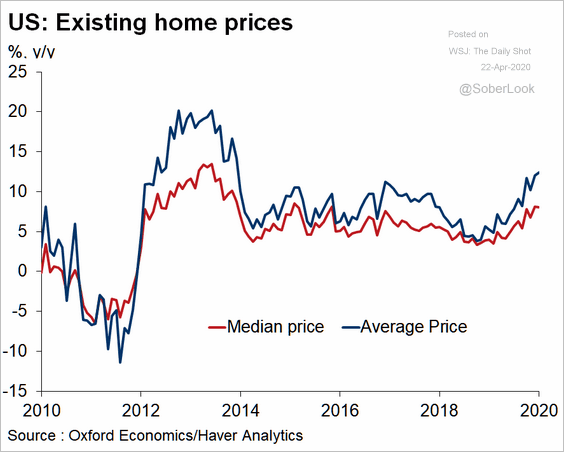
Home prices kept climbing.
 Source: Oxford Economics
——————–
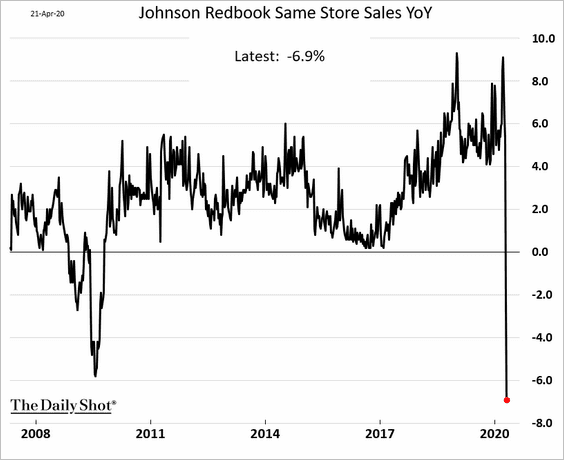
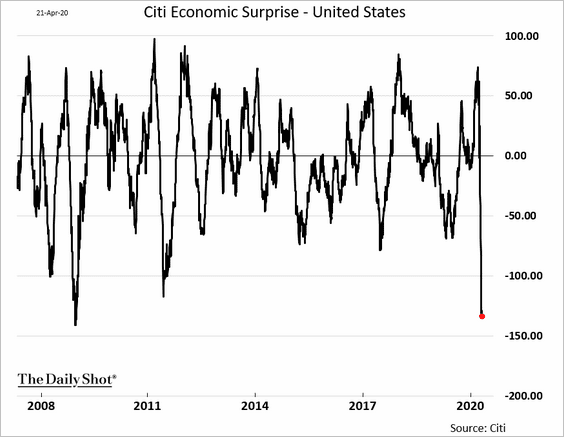
2. High-frequency indicators continue to show extraordinary weakness in economic activity.
• The Johnson Redbook Same-Store Sales index:
• The Citi Economic Surprise Index:
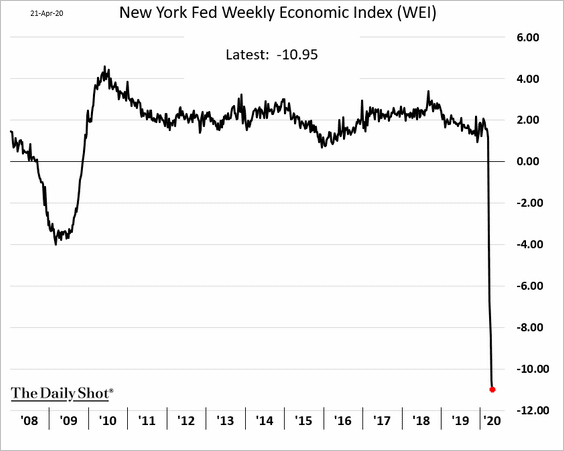
• The NY Fed Economic Indicator (WEI):
——————–
3. Next, we have some updates on household finance.
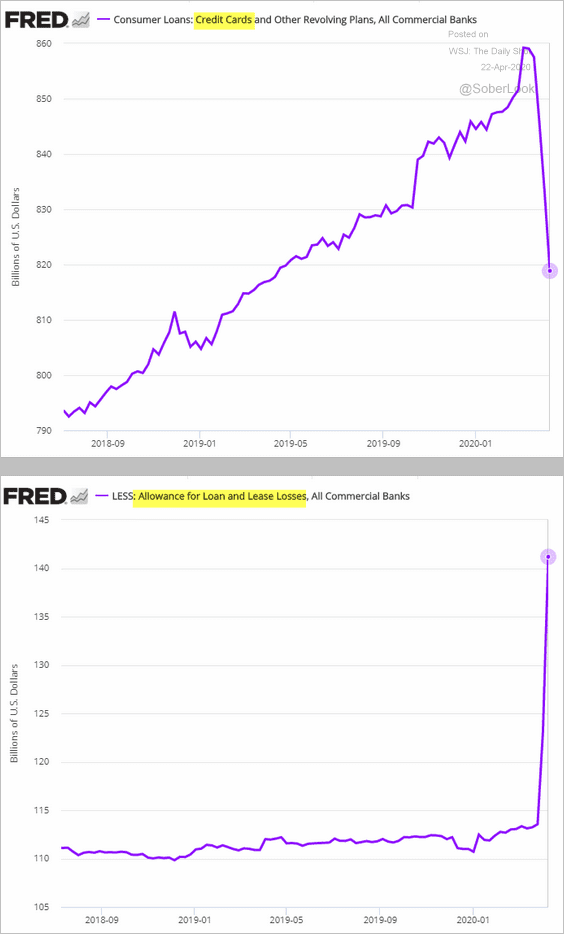
• Banks have lowered the amount of credit card debt on their balance sheets. Much of that reduction showed up as loan loss provisions.
• The percentage of mortgages in forbearance keeps climbing.
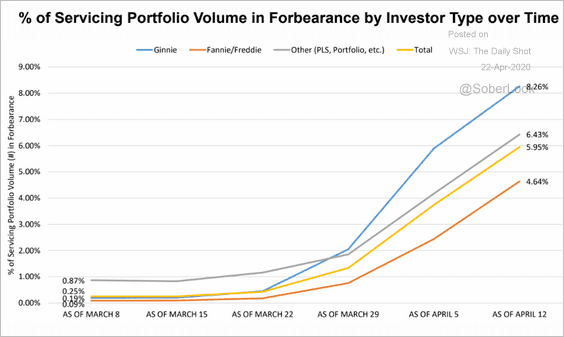 Source: Mortgage Bankers Association
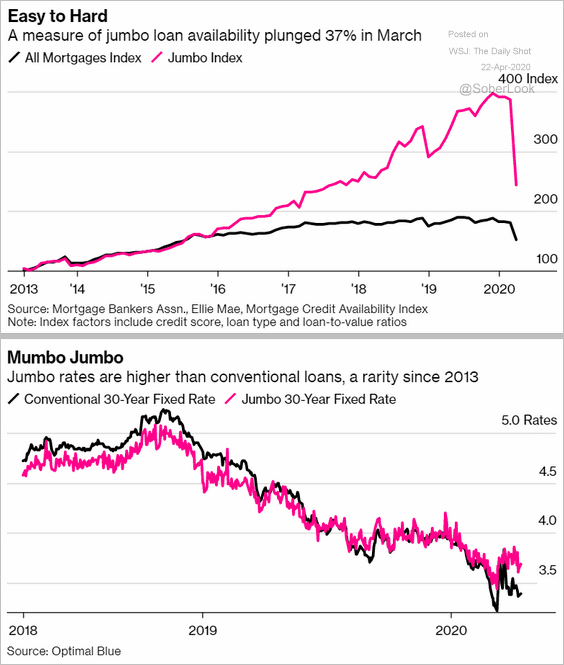
• The jumbo mortgage market is collapsing.
 Source: @luxury Read full article
• Below is the percentage of households unable to meet debt payments.
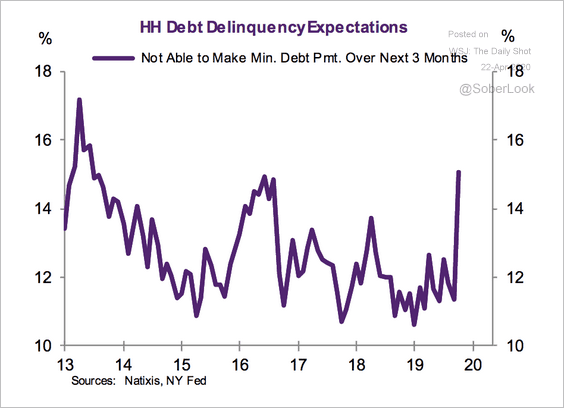 Source: Natixis
• And here is the percentage of tenants who missed their April rent payments.
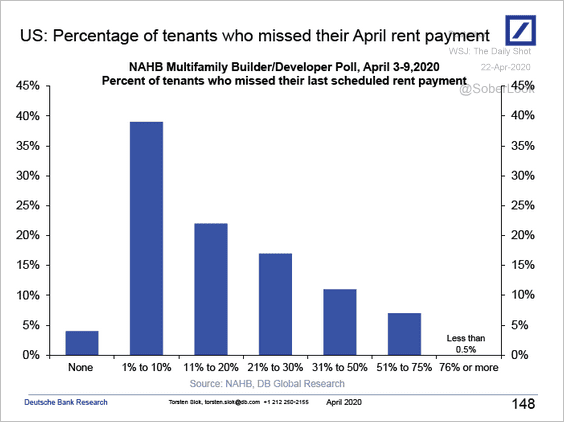 Source: Deutsche Bank Research
——————–
4. The shock to the labor market has been extraordinary.
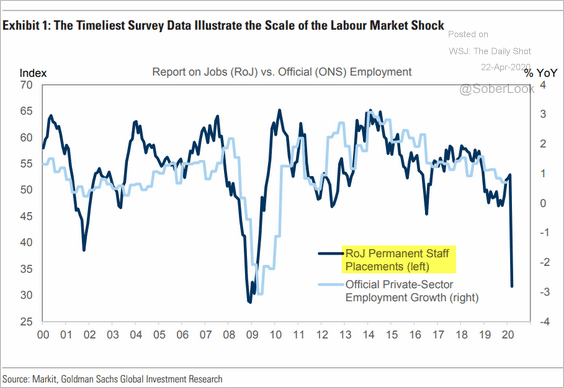 Source: Goldman Sachs
5. Here are the components of the expected $3.8 trillion budget deficit this year.
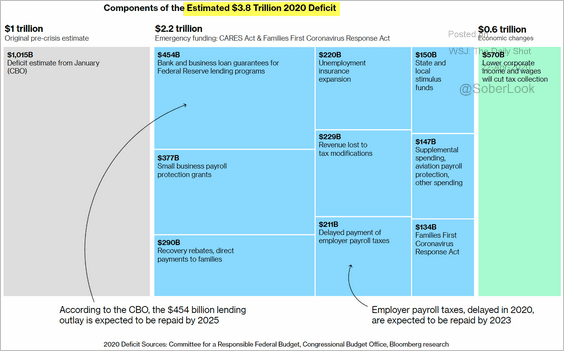 Source: @business Read full article
6. Tightening immigration will result in substantially slower growth in the working-age population, which will create a drag on the US GDP (similar to Japan).
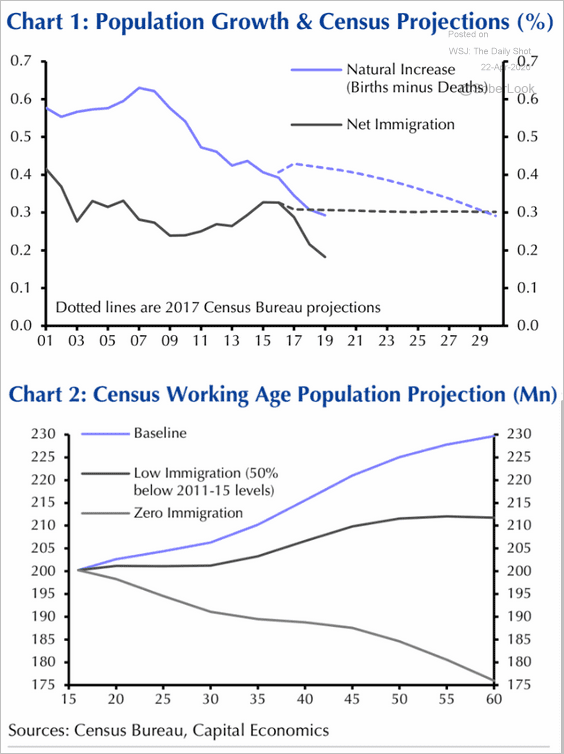 Source: Capital Economics
7. The number of new US coronavirus cases was almost 40,000 on Tuesday, a new record.
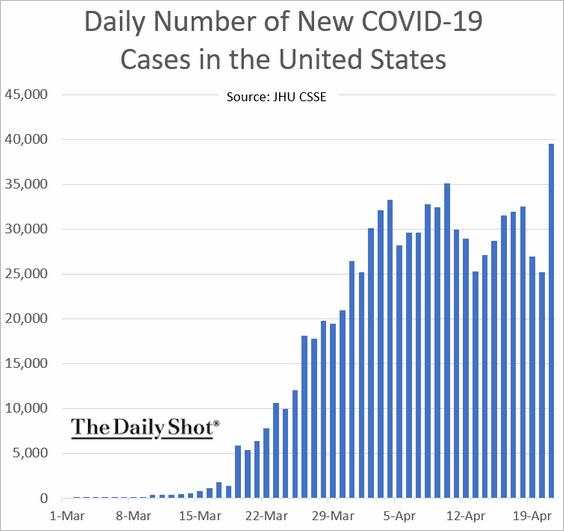
Is it too early to begin reopening the economy, given that testing remains well below target levels?
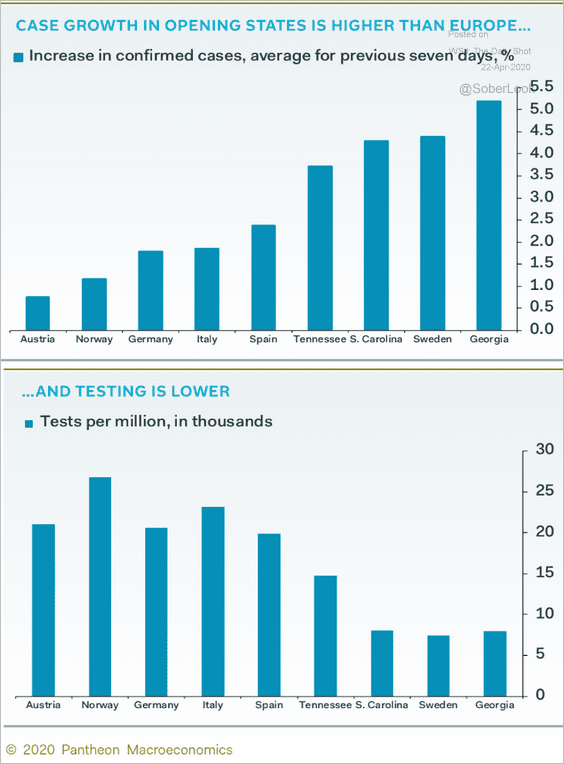 Source: Pantheon Macroeconomics
Testing should be running closer to 500k per day, not 150k.
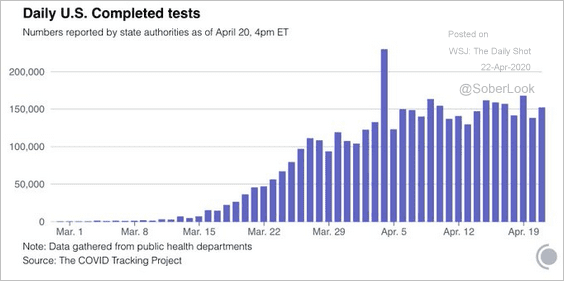 Source: @COVID19Tracking Read full article
——————–
Food for Thought
1. Death rates from alcohol, drugs, and suicide:
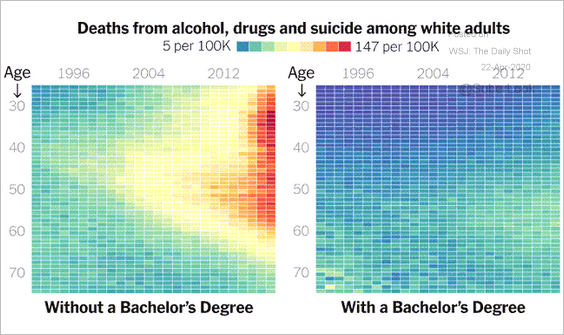 Source: The New York Times Read full article
2. Life evaluations:
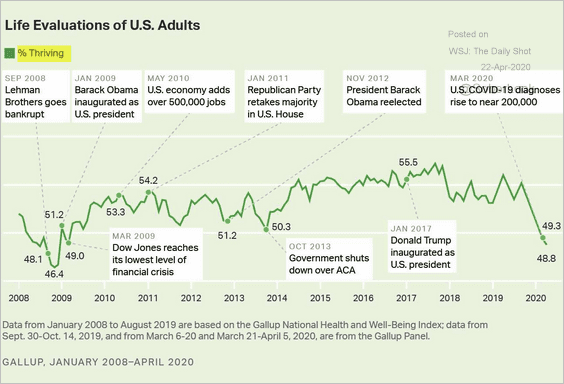 Source: Gallup Read full article
3. The trend in US cannabis sales:
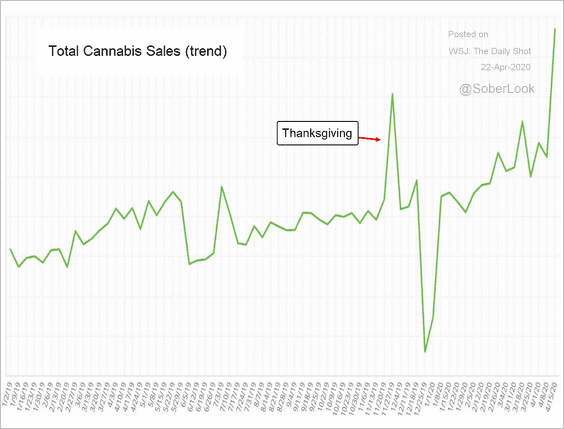 Source: Aryeh Primus, Akerna
4. High contact intensity occupations:
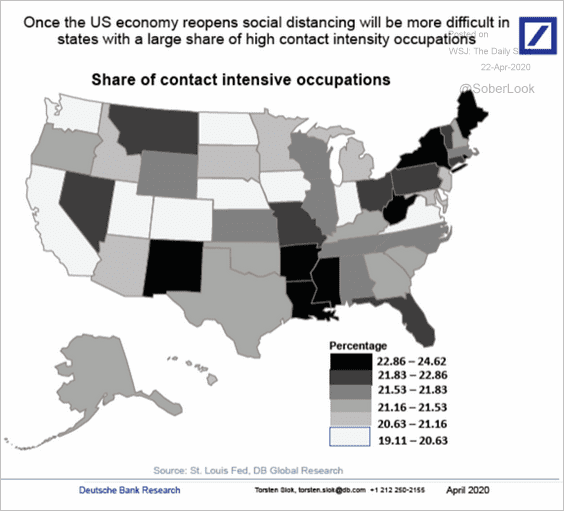 Source: Deutsche Bank Research
5. US healthcare workers who are immigrants:
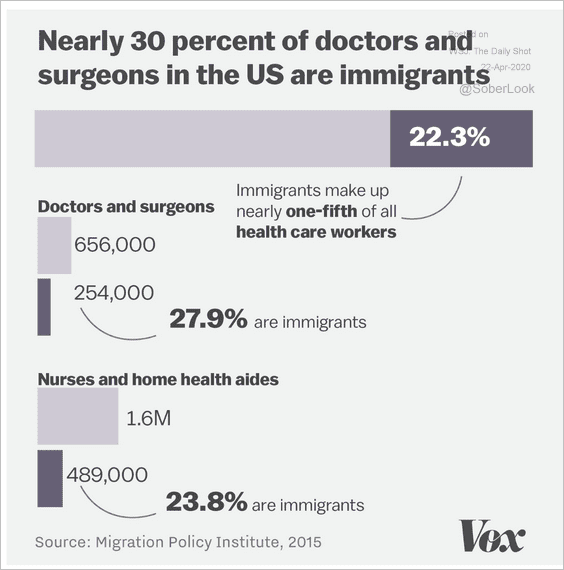 Source: @voxdotcom Read full article
6. The US recycling market:
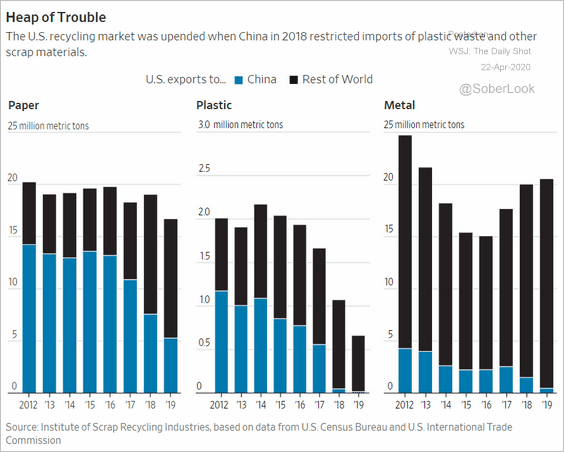 Source: @WSJ Read full article
7. Consumer spending on media:
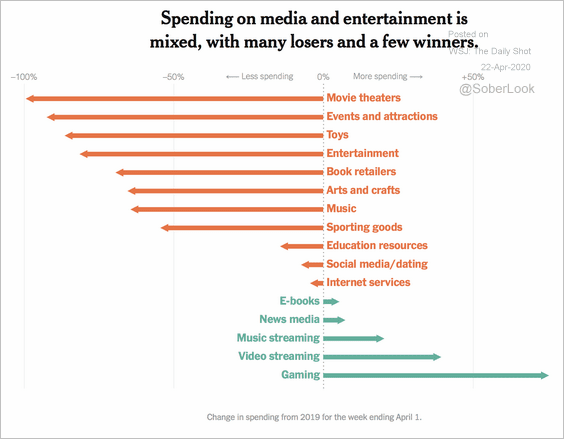 Source: The New York Times Read full article
8. Digital streaming revenues:
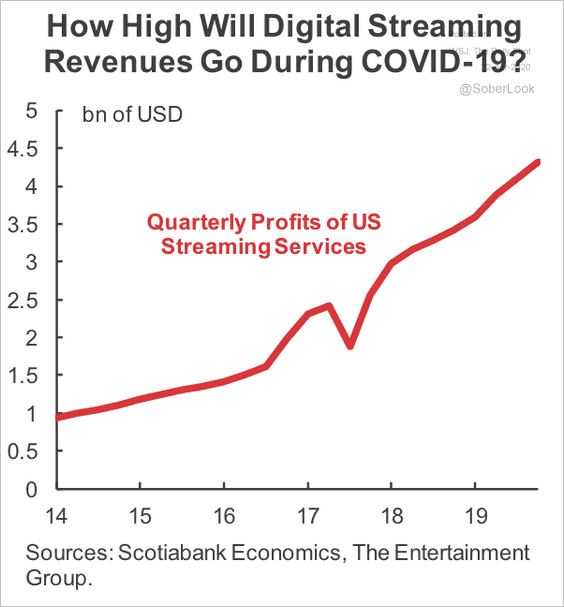 Source: Scotiabank Economics
9. Computer operating systems:
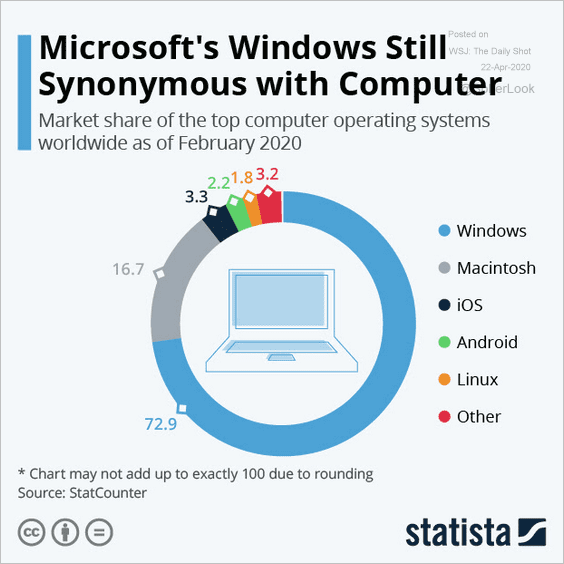 Source: Statista
10. Most popular sandwiches:
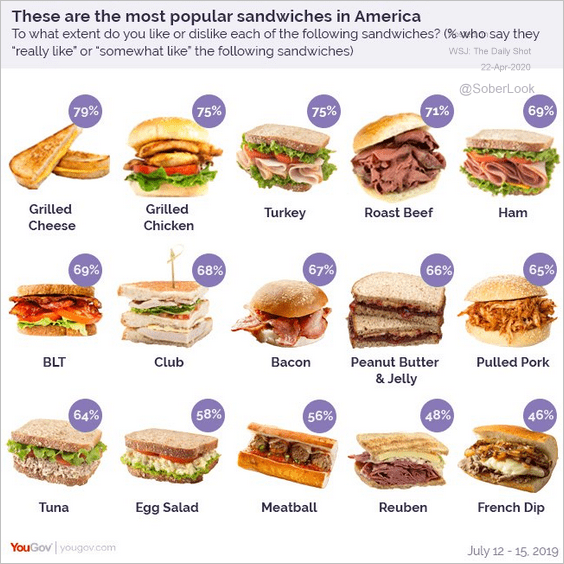 Source: @YouGov Read full article
——————–