
The Daily Shot: 04-May-20
• The United States
• Canada
• The United Kingdom
• Europe
• Asia – Pacific
• China
• Emerging Markets
• Commodities
• Energy
• Equities
• Credit
• Rates
• Global Developments
• Food for Thought
The United States
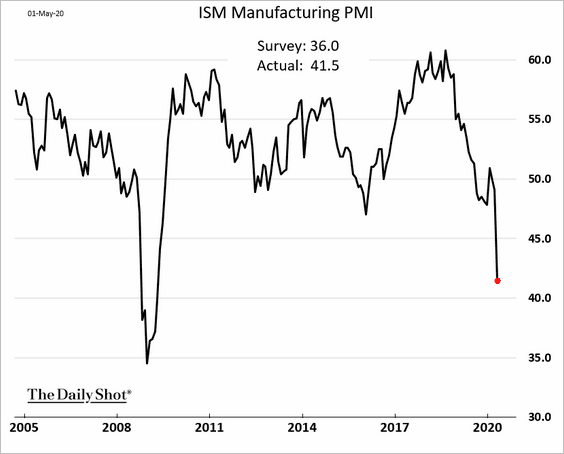
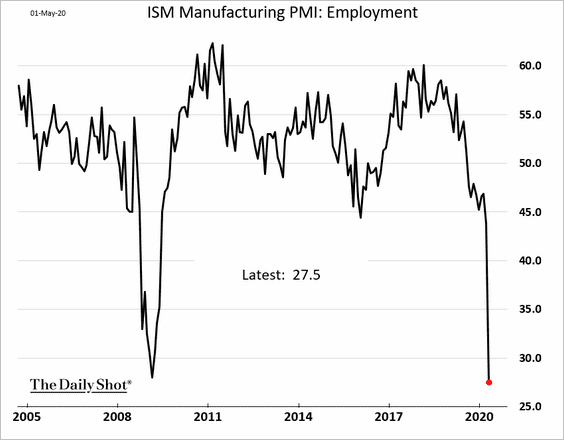
1. US factory activity all but ground to a halt in April. While the headline ISM Manufacturing PMI remained above the 2008 lows, the detail of the report showed utter devastation.
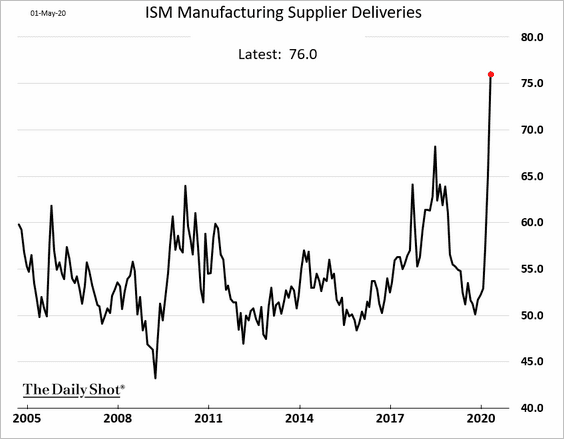
The ISM index hasn’t hit new lows due to worsening supply chain bottlenecks (which are creating a distortion). While in a strong economy, slower supplier deliveries may indicate robust demand (suppliers can’t keep up), that’s not the case in the current environment.
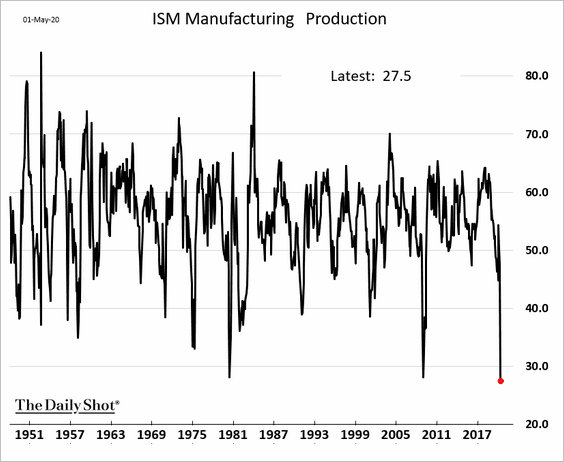
The ISM production index showed that manufacturing output in its worst shape in the post-WW-II era.
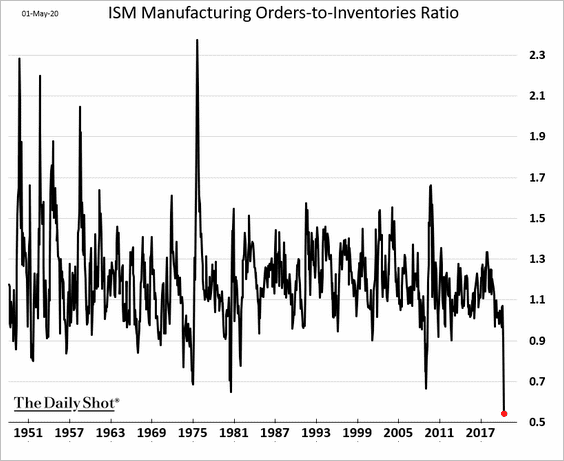
Here is the orders-to-inventories ratio.
The employment index hit a multi-decade low.
A separate manufacturing report from IHS Markit (updated from earlier in April) painted a similar picture.
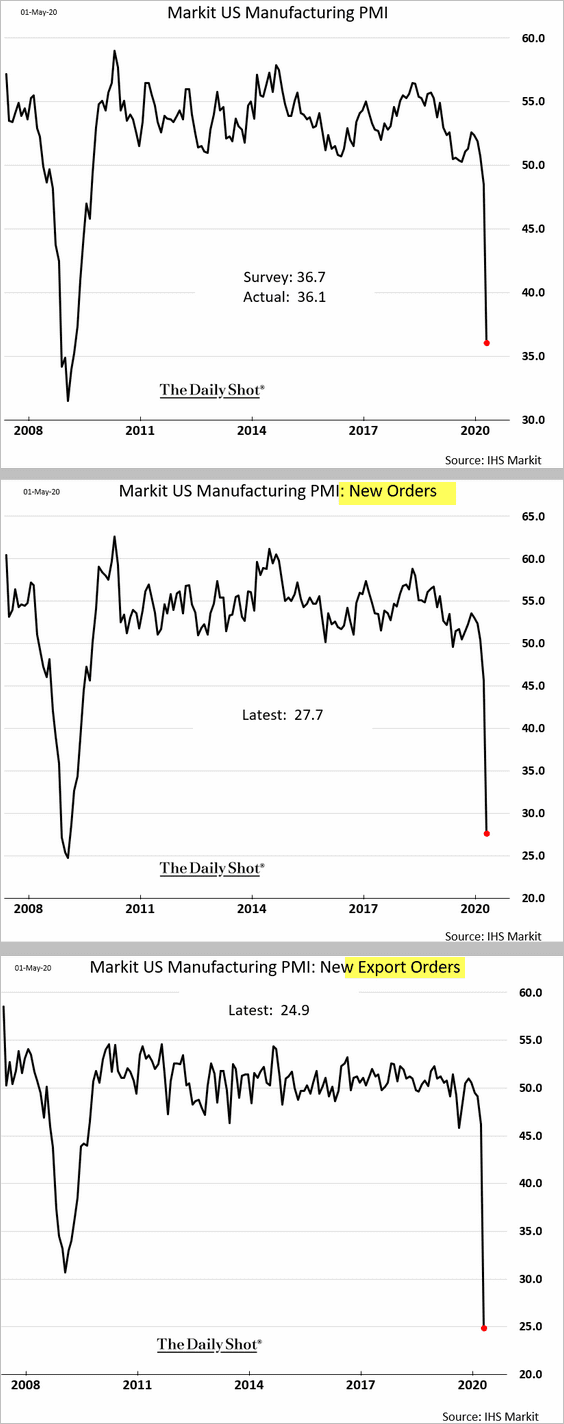
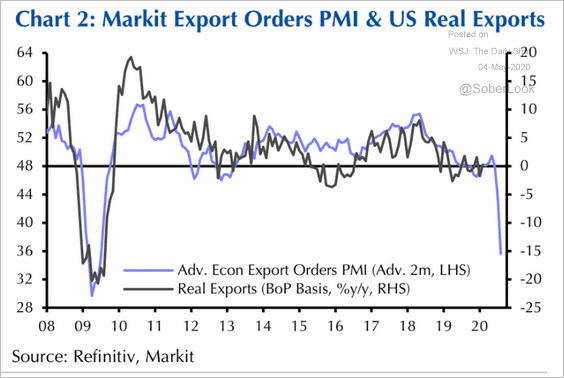
Exports plummetted.
 Source: Capital Economics
——————–
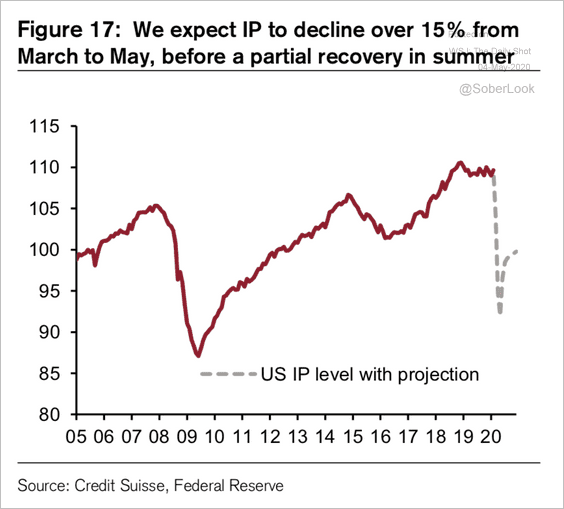
2. Credit Suisse expects a 15% drop in industrial production.
 Source: Credit Suisse
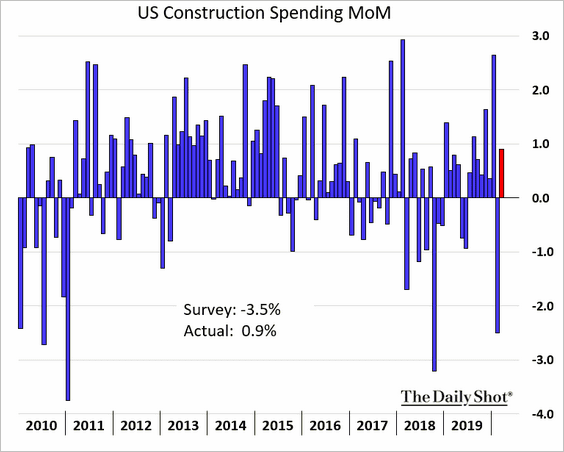
3. March construction spending surprised to the upside.
Separately, industrial property supply has recently outstripped demand, which could pressure the sector’s REIT fundamentals.
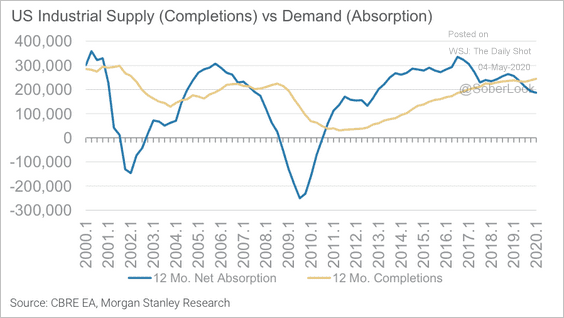 Source: Morgan Stanley Research
——————–
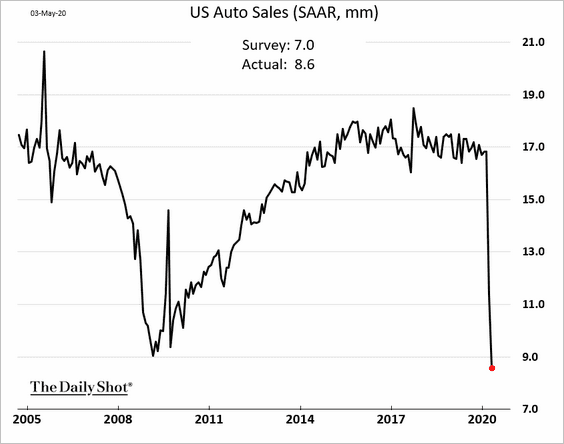
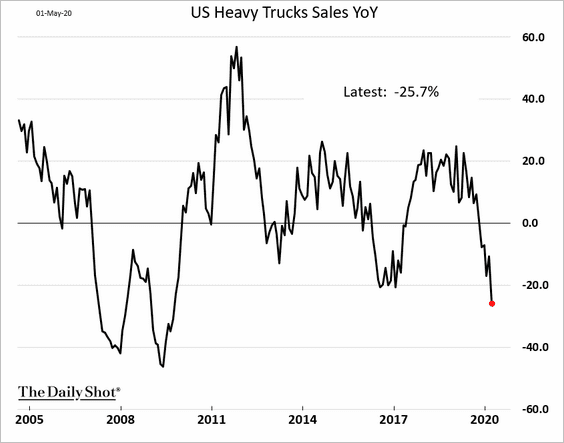
4. Vehicle sales crumbled in April.
• Dealers are increasingly offering no-interest loans to attract buyers.
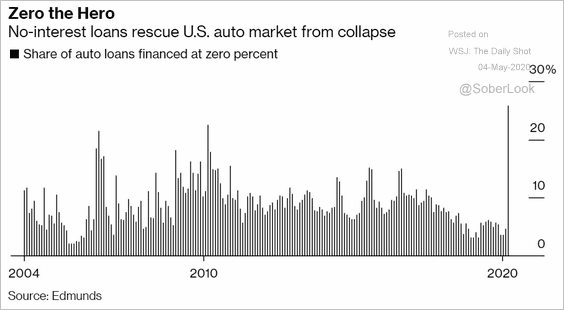 Source: @business Read full article
• Heavy truck sales are down 25% from the same time last year.
——————–
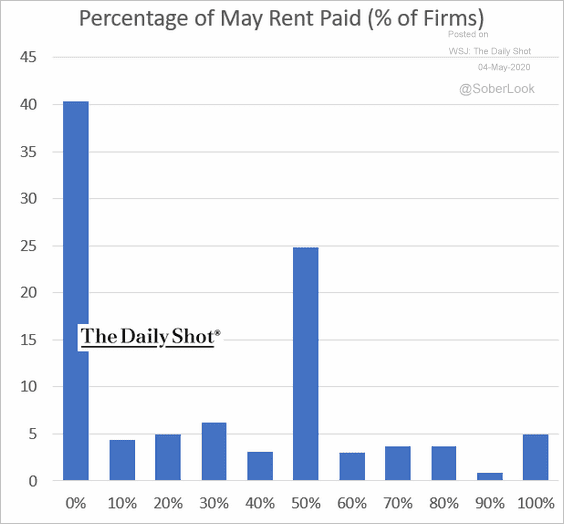
5. Next, we have some updates on small business.
• 84% of US small firms are paying less than 50% of rent due in May, and 40% are skipping rent altogether this month (based on a survey from Alignable).
 Source: Alignable.com
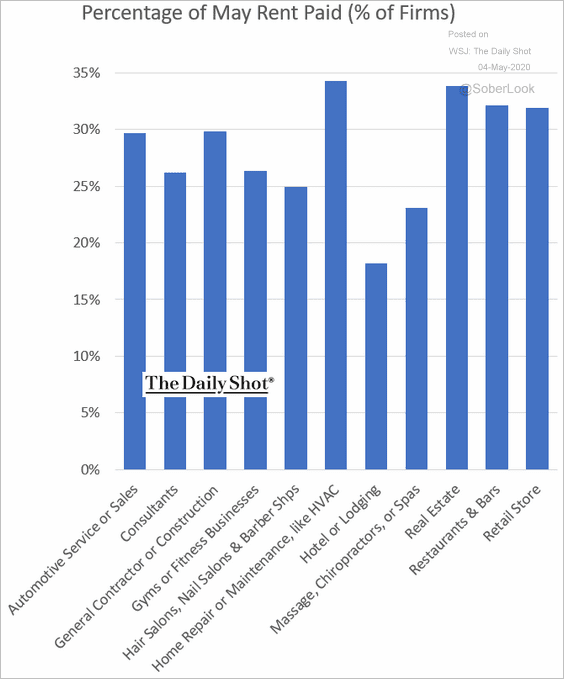
Here is the breakdown by industry.
 Source: Alignable.com
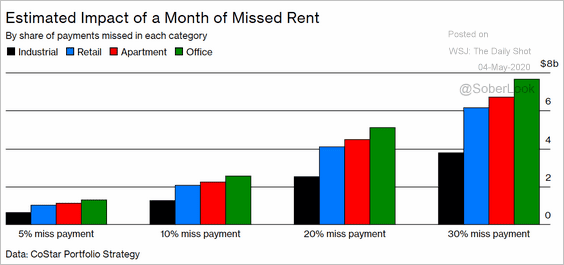
• Missing rent is going to generate tremendous losses for commercial real estate firms.
 Source: @BW Read full article
• For many small and medium-sized enterprises (SMEs), PPP loan amounts will be insufficient to replace lost revenue, according to Moody’s.
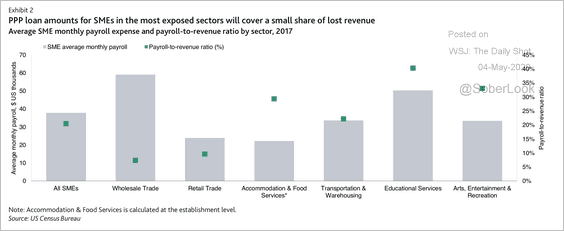 Source: Moody’s Investors Service
• This scatterplot shows the PPP loan approval rate by state vs. the percentage of firms shutting down.
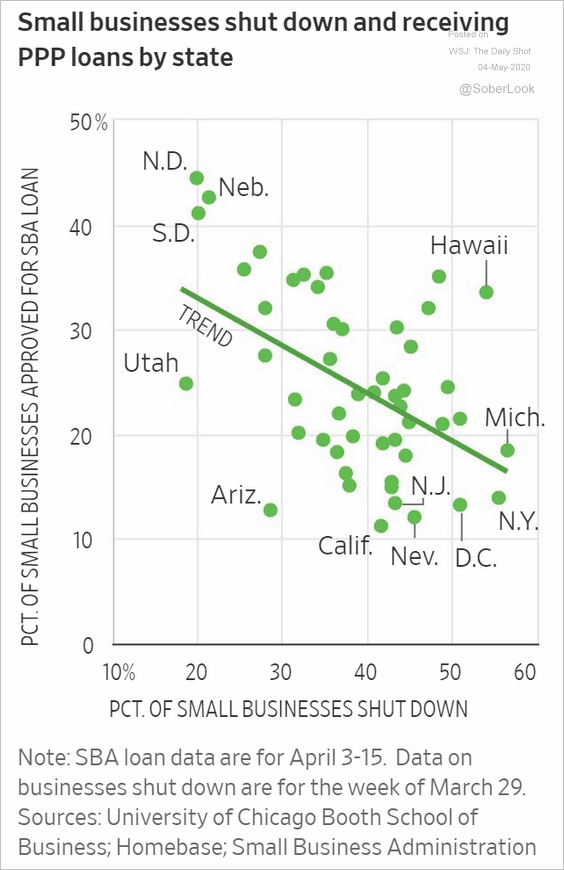 Source: @WSJ Read full article
——————–
6. Air travel in the US and globally is starting to show modest signs of recovery from extreme lows (3 charts).
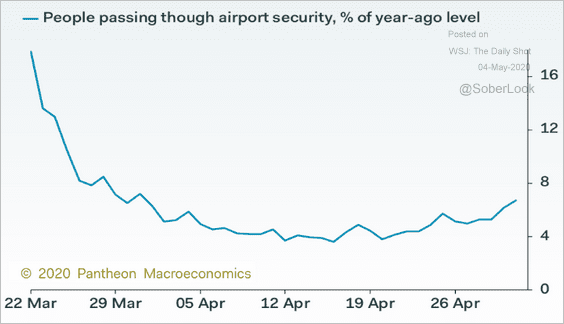 Source: Pantheon Macroeconomics
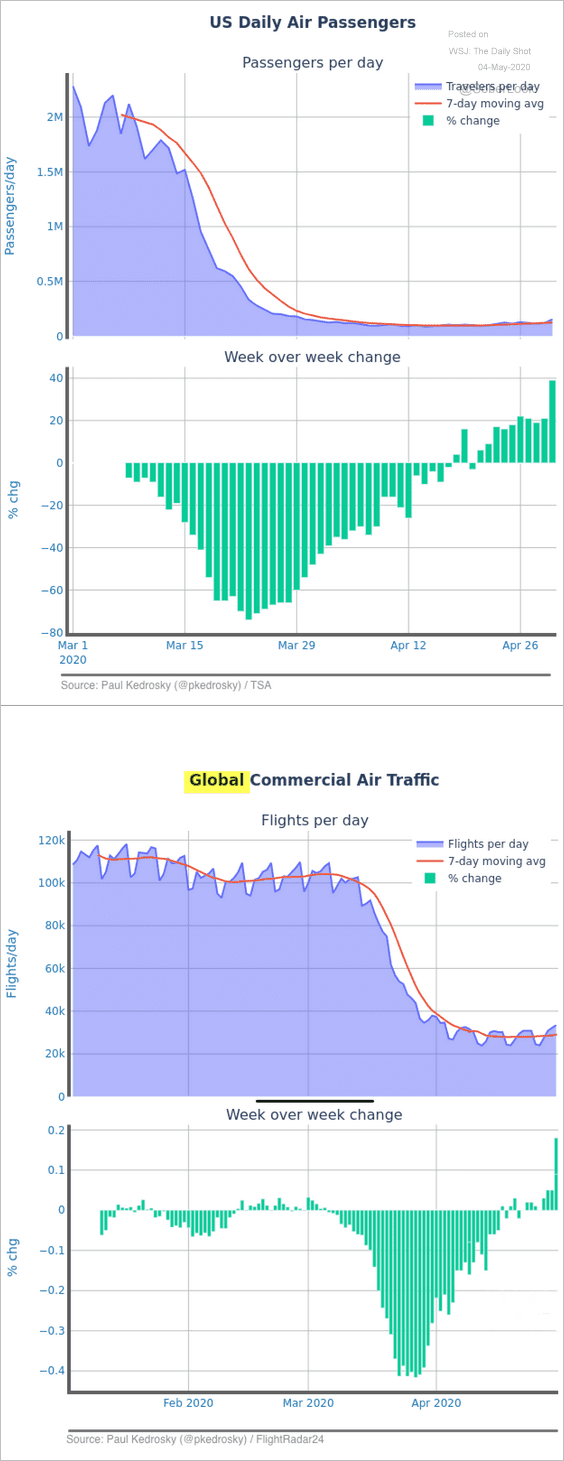 Source: @pkedrosky
——————–
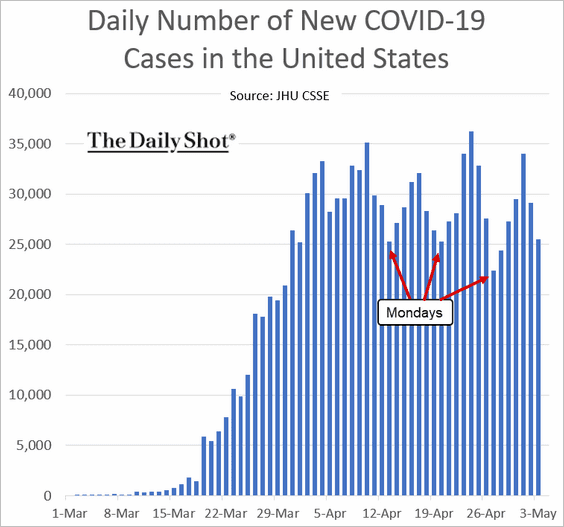
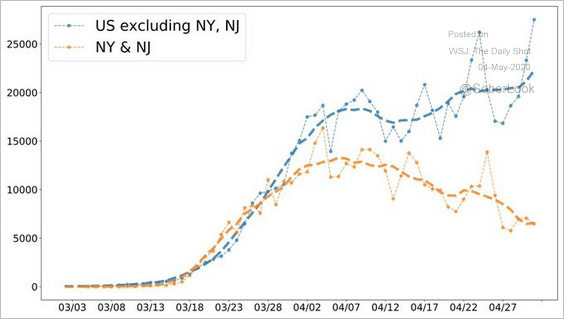
7. Finally, we have some updates on the epidemic.
• The average number of newly diagnosed infections is holding above 25k per day.
 Source: @AndyBiotech, @JDB0711
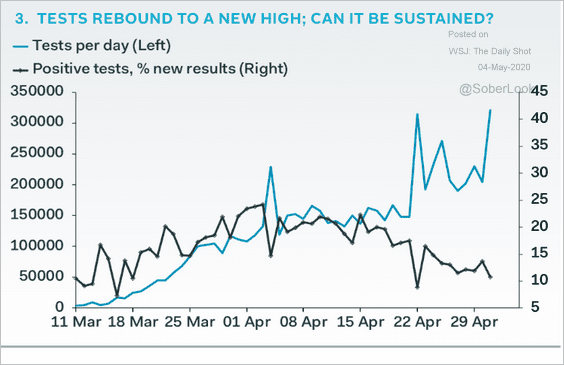
Part of the reason for this persistently high rate is improved testing.
 Source: Pantheon Macroeconomics
Canada
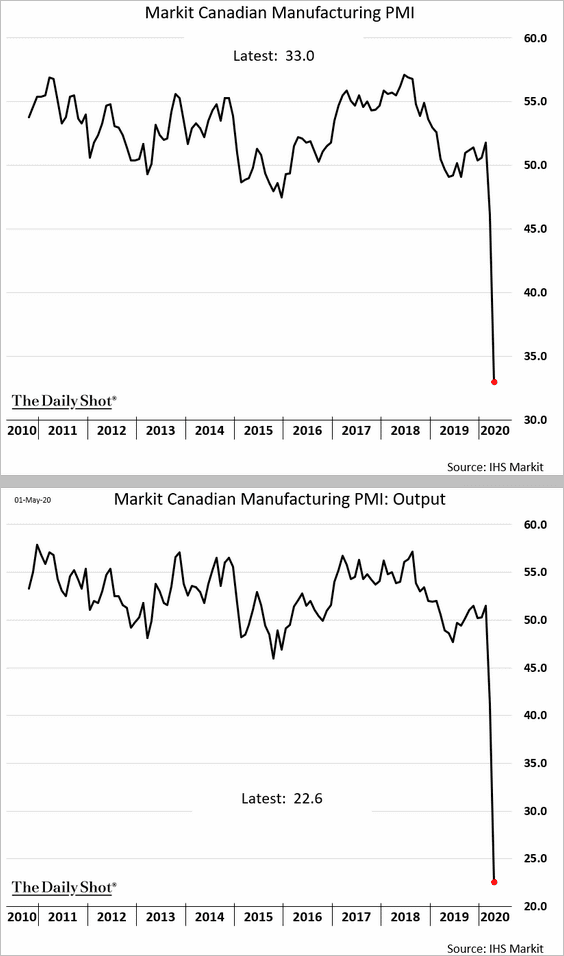
1. Manufacturing activity collapsed in April.
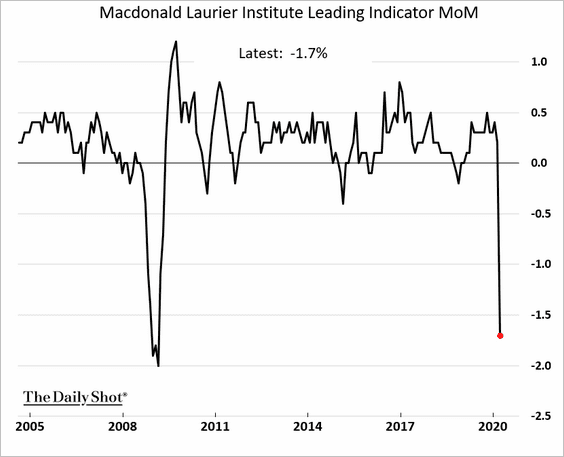
2. Here is the March index of leading indicators.
3. The budget deficit is expected to hit a new record.
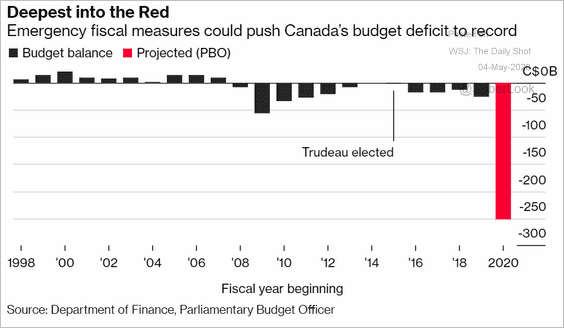 Source: @bpolitics Read full article
4. The BoC continues to expand its balance sheet.
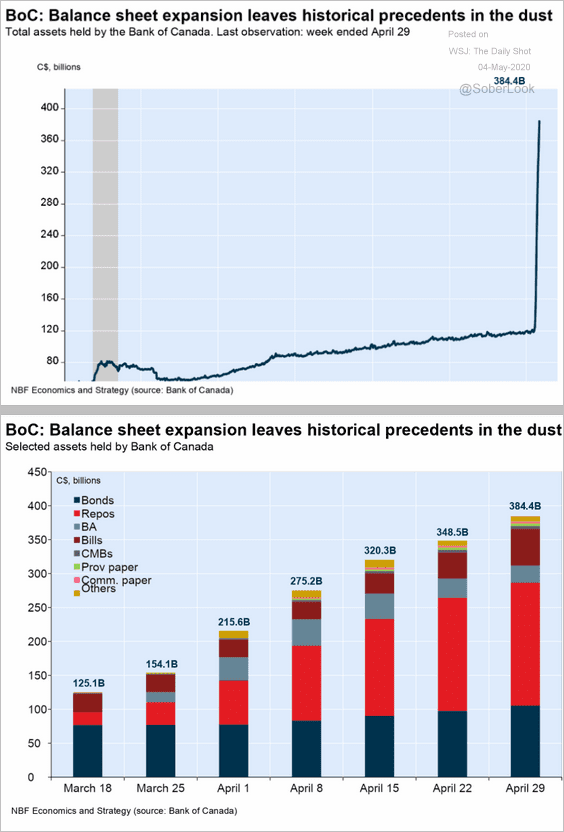 Source: Economics and Strategy Group, National Bank of Canada
The BoC’s and the Fed’s balance sheet growth has been comparable relative to the GDP.
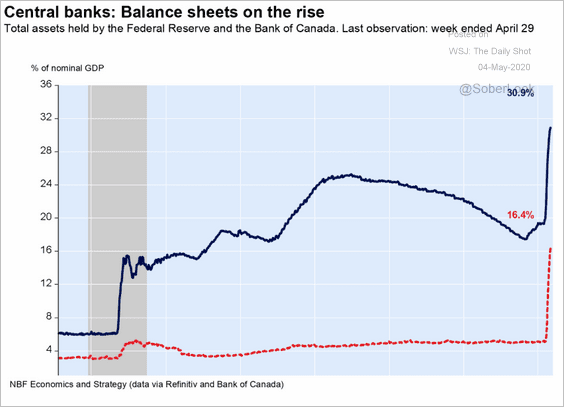 Source: Economics and Strategy Group, National Bank of Canada
——————–
5. Weak commodity prices are weighing on the Canadian dollar.
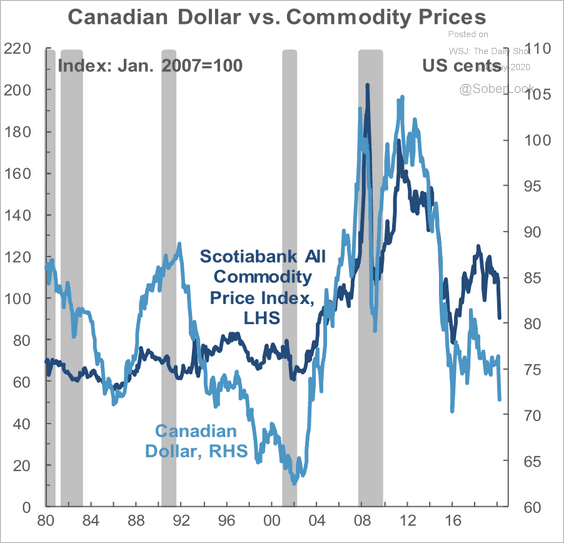 Source: Scotiabank Economics
USD/CAD is at long-term resistance.
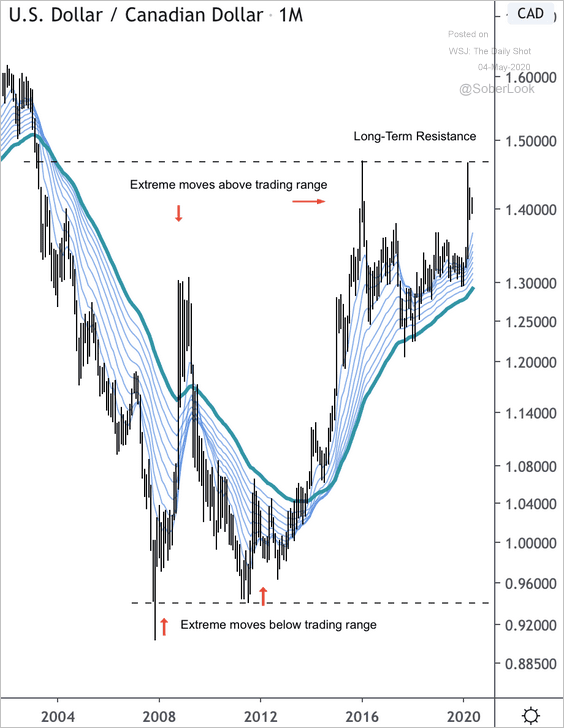 Source: @DantesOutlook
The United Kingdom
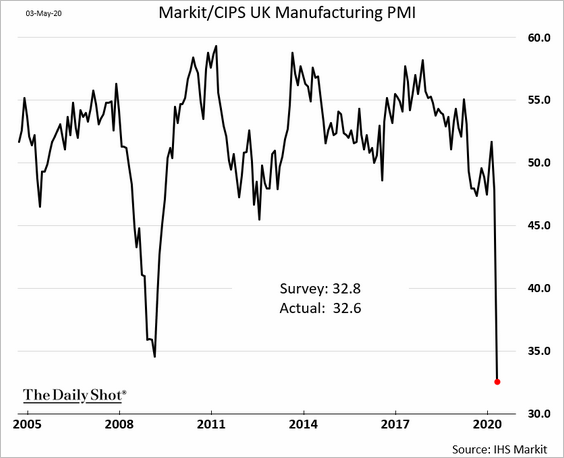
1. The updated April manufacturing PMI was even worse than the earlier report.
Factory output plummeted.
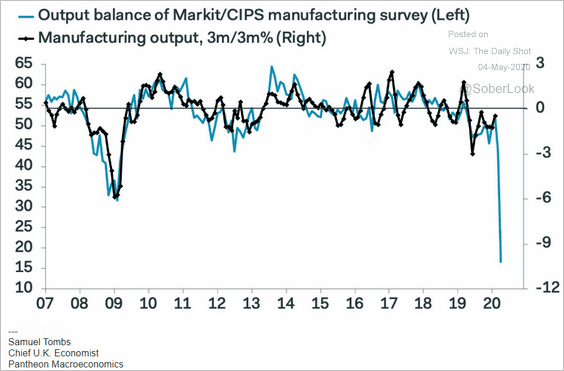 Source: Pantheon Macroeconomics
——————–
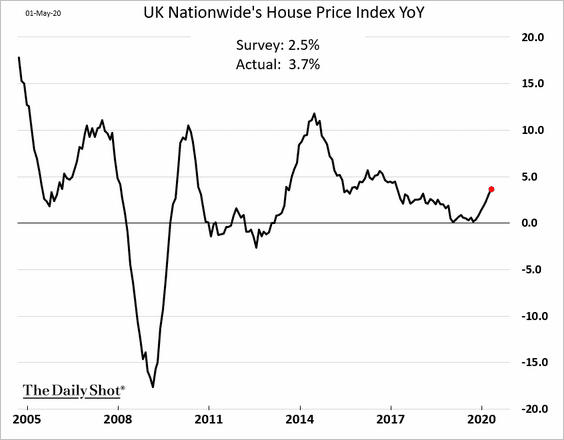
2. April home price appreciation surprised to the upside. Many of these transactions originated before the crisis.
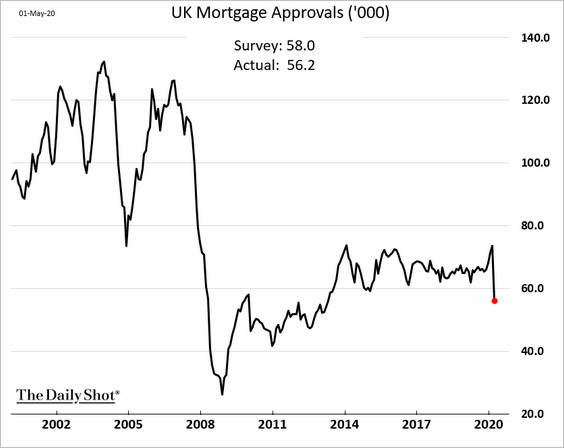
3. Mortgage approvals declined. The drop wasn’t entirely driven by slower demand. Supply was constrained as well, as lenders encountered difficulties processing applications.
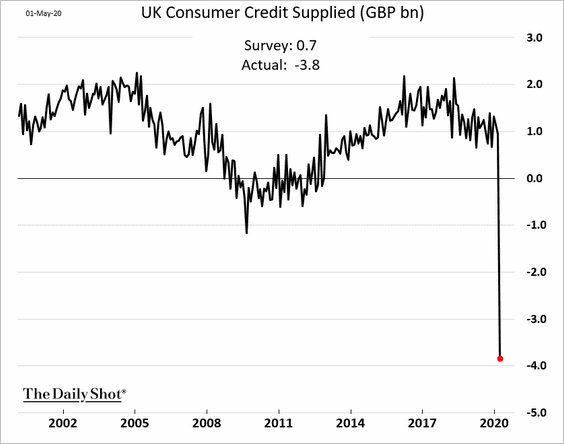
4. The overall consumer credit supplied tumbled in March.
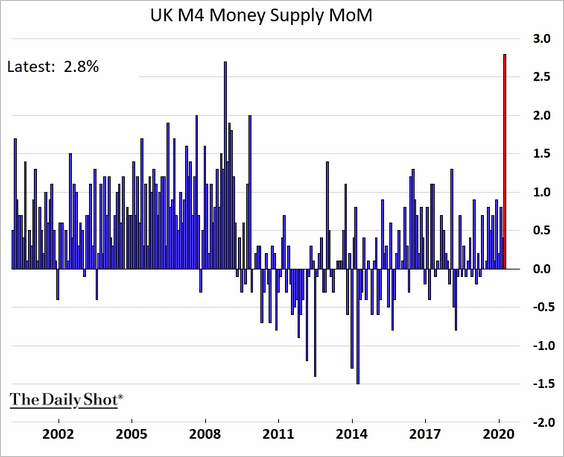
5. There was a record monthly increase in the broad money supply, driven primarily by businesses seeking liquidity.
6. The BoE’s support of UK firms is gradually ramping up.
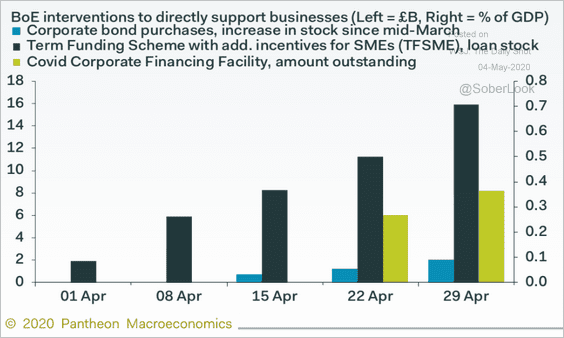 Source: Pantheon Macroeconomics
7. The pound is well below its fair value estimate, according to ANZ Research.
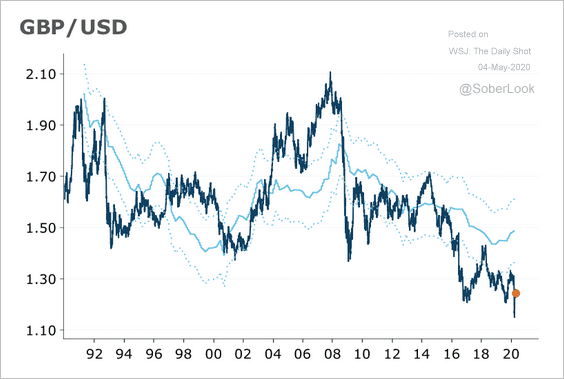 Source: ANZ Research
And downside momentum has slowed over the past three years.
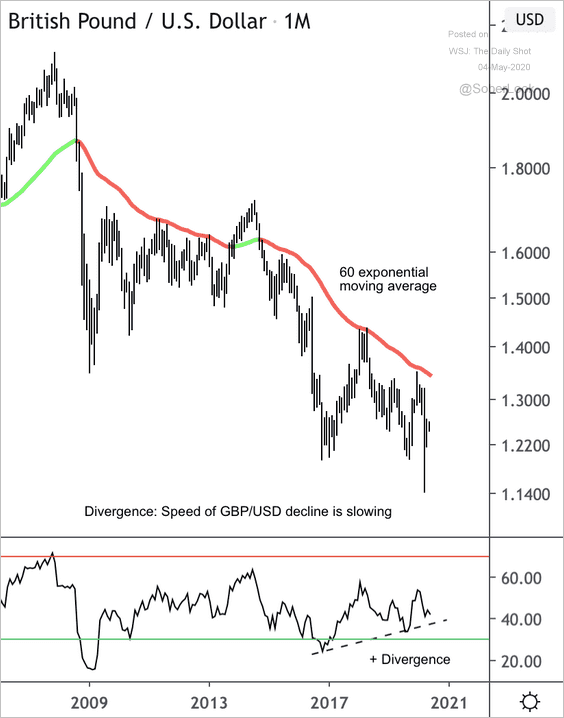 Source: @DantesOutlook
Europe
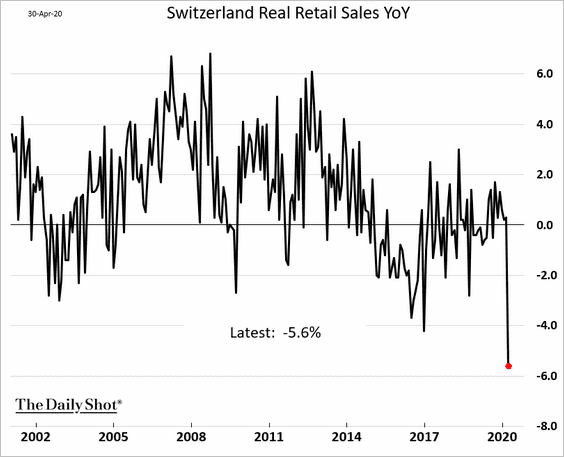
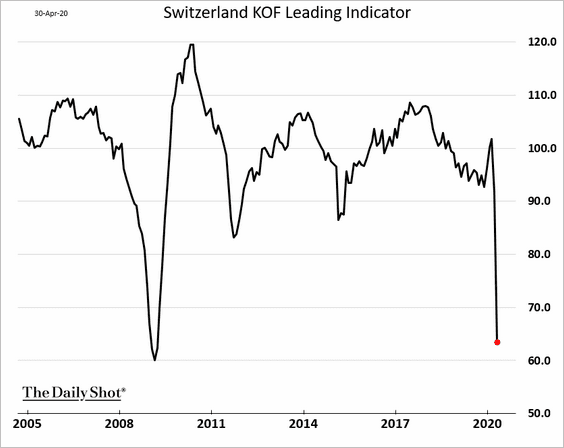
1. Swiss retail sales plummetted in March.
Here is Switzerland’s leading indicator (through April).
——————–
2. European bank shares remain under pressure.
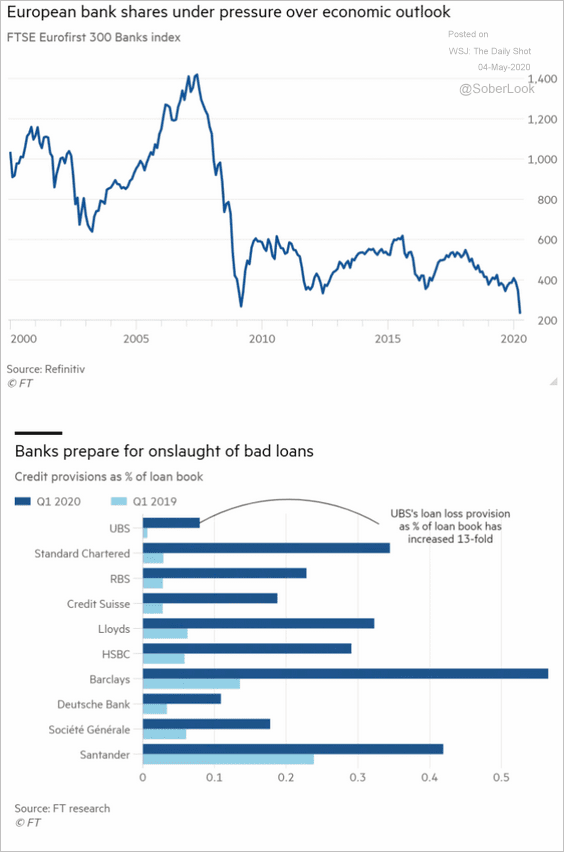 Source: @financialtimes Read full article
Euro-area banks tend to perform better after a 6-month period of bond yield deceleration, according to BCA Research.
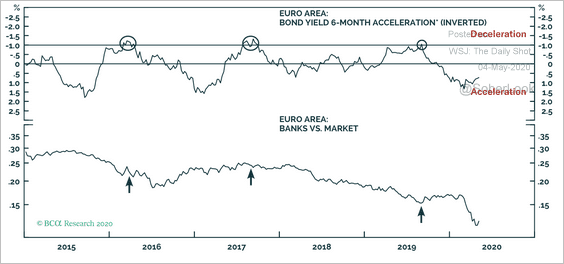 Source: BCA Research
Unlike the US, Eurozone bank credit flow has been underwhelming.
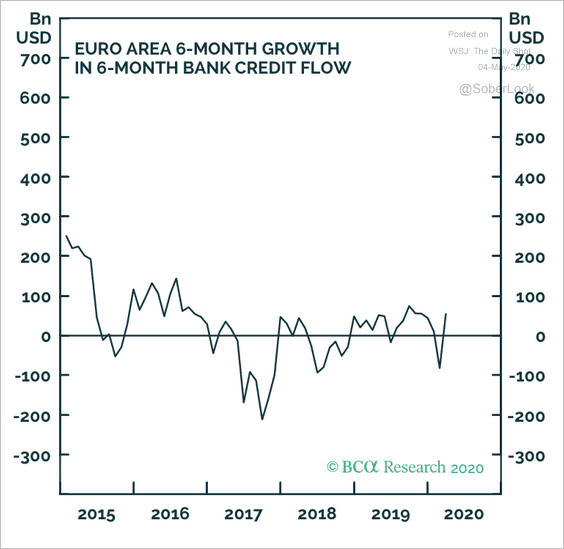 Source: BCA Research
——————–
3. European share valuations are near record lows relative to the US.
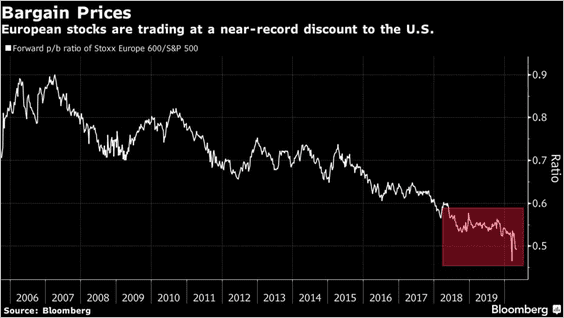 Source: @markets Read full article
4. This chart shows the status of COVID-19 testing across Europe.
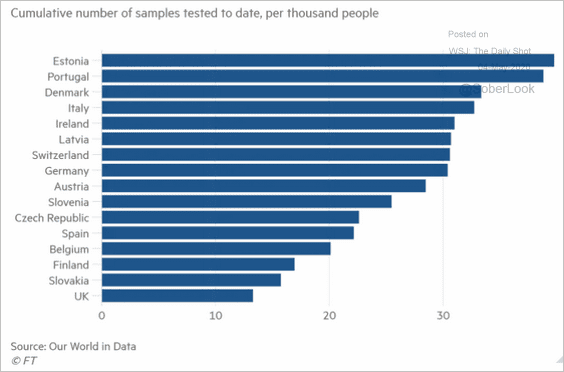 Source: @financialtimes Read full article
5. Spanish credit card expenditures tumbled after the lockdown.
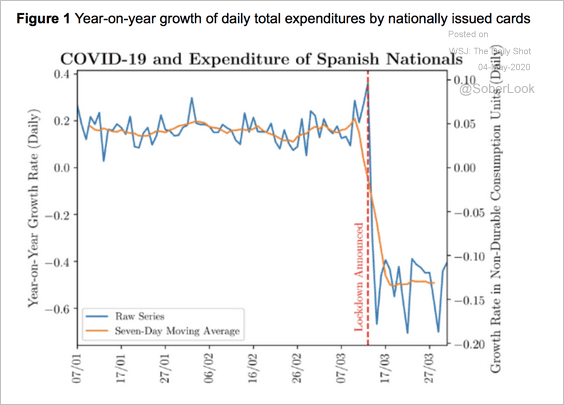 Source: VOX EU Read full article
And many in Spain shifted to online purchases.
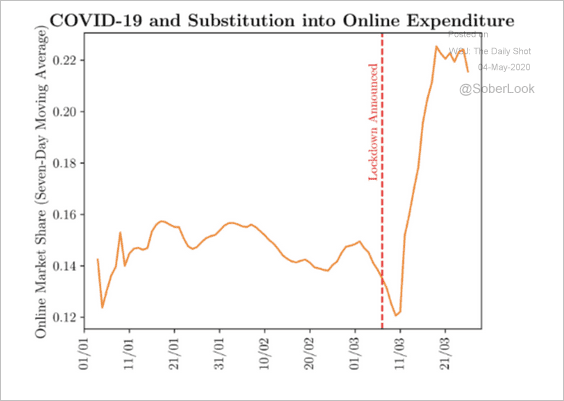 Source: VOX EU Read full article
Asia – Pacific
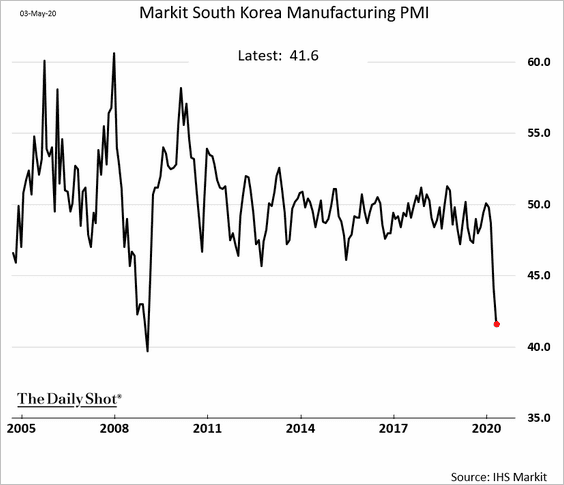
1. South Korea’s factory activity slowed sharply in April.
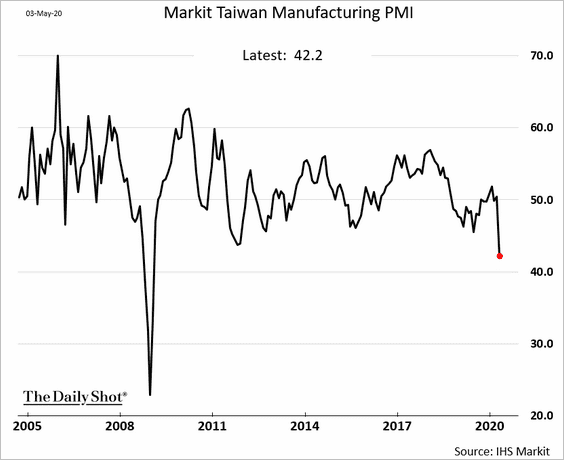
The slowdown in Taiwan was less severe.
Taiwanese seem to be less worried about the coronavirus impact.
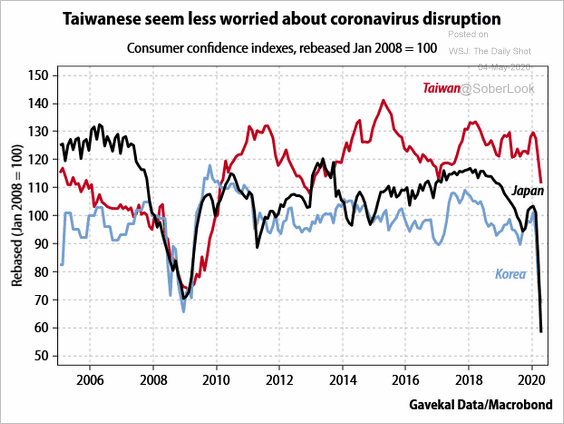 Source: Gavekal
——————–
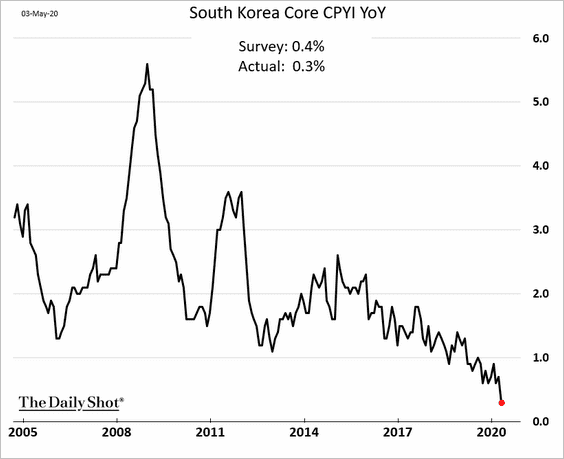
2. South Korea is headed for deflation.
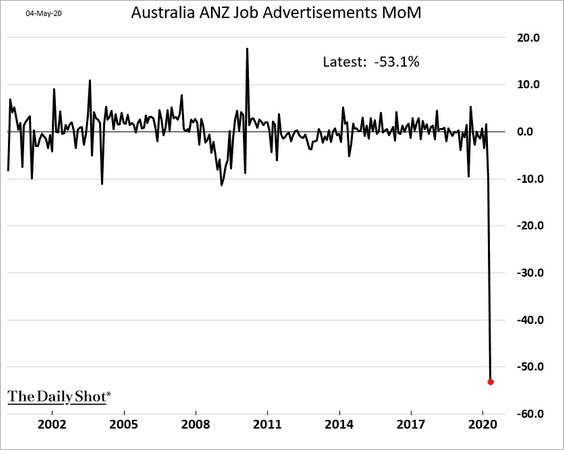
3. Next, we have a couple of updates on Australia.
• Housing auction clearance rates point to a sharp decline in home prices.
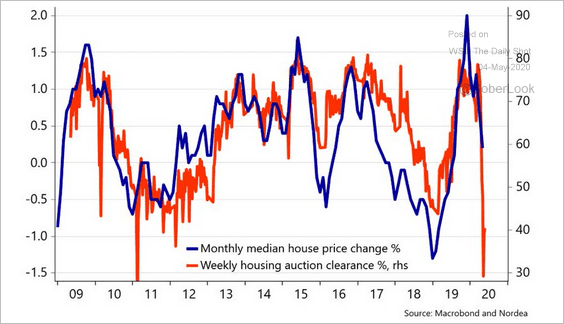 Source: @AndreasSteno
• Job postings collapsed in April.
China
1. Here are the Q1 GDP components by sector.
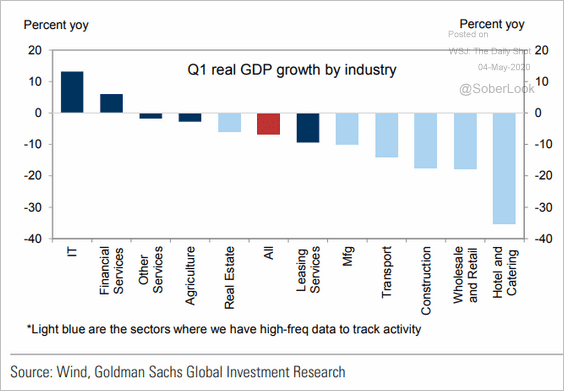 Source: Goldman Sachs
2. Imports from the US are yet to show meaningful improvement.
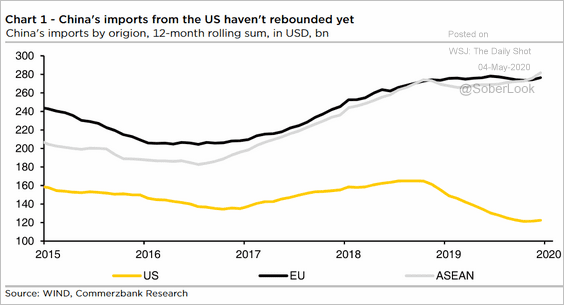 Source: Commerzbank Research
3. The Belt & Road initiative may face some credit challenges.
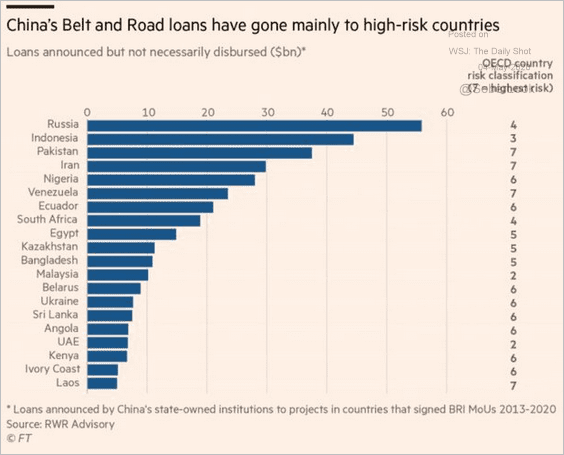 Source: @adam_tooze, @JKynge Read full article
4. Next, we have a couple of updates on Hong Kong.
• Shares are trading below book value.
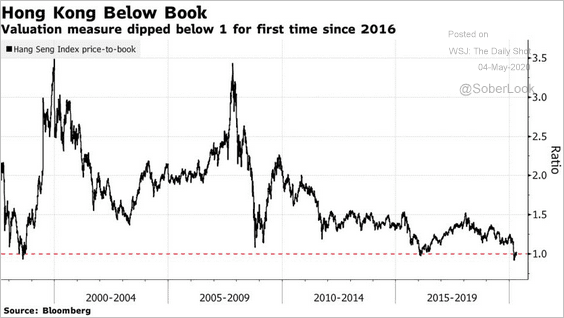 Source: @markets Read full article
• Mainland property investors are staying away from Hong Kong.
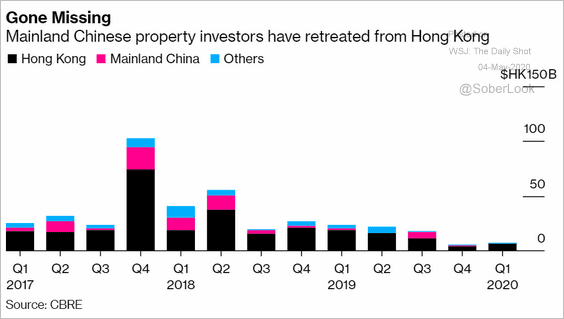 Source: @markets Read full article
Emerging Markets
1. Several key EM currencies have been range-bound.
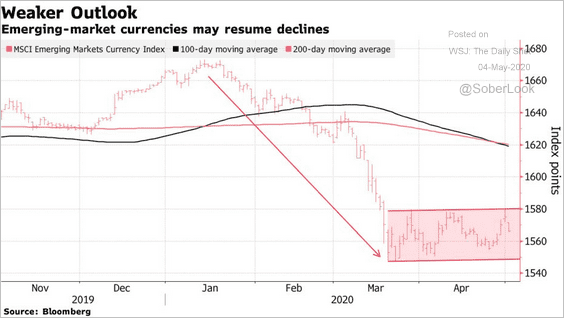 Source: @markets Read full article
The dollar is testing resistance against …
• the Mexican peso,
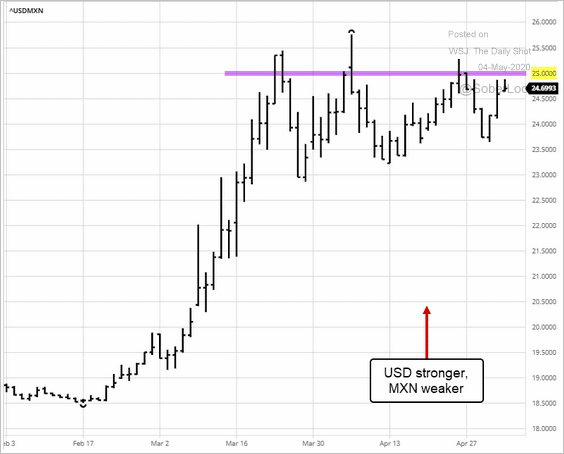 Source: barchart.com
• the South African rand,
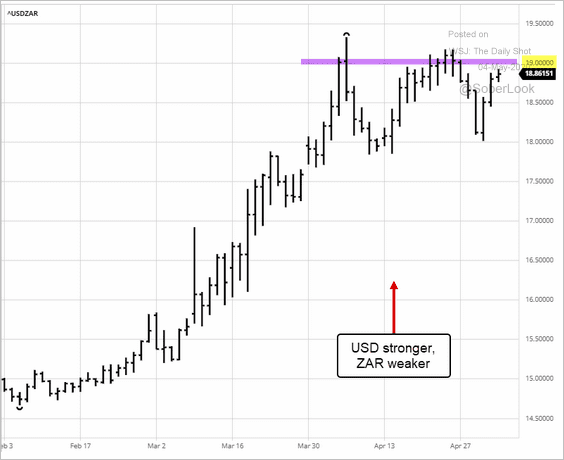 Source: barchart.com
• and the Turkish lira.
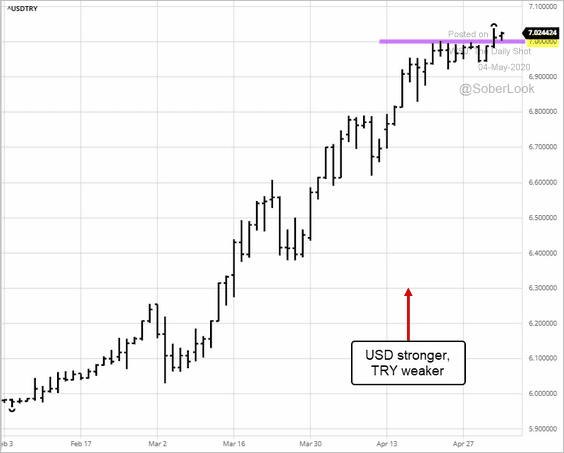 Source: barchart.com
——————–
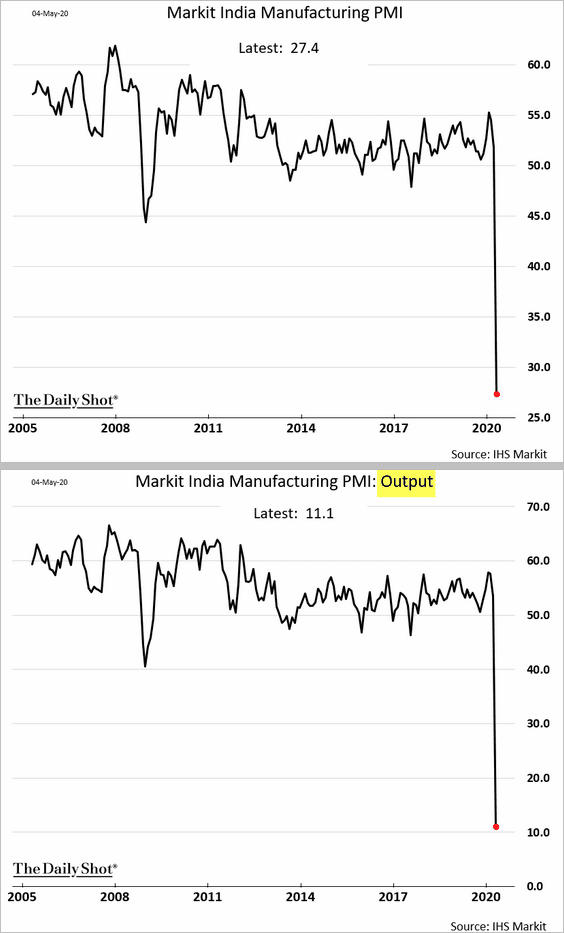
2. India’s factory activity ground to a halt in April.
3. Daily infections in Russia are accelerating.
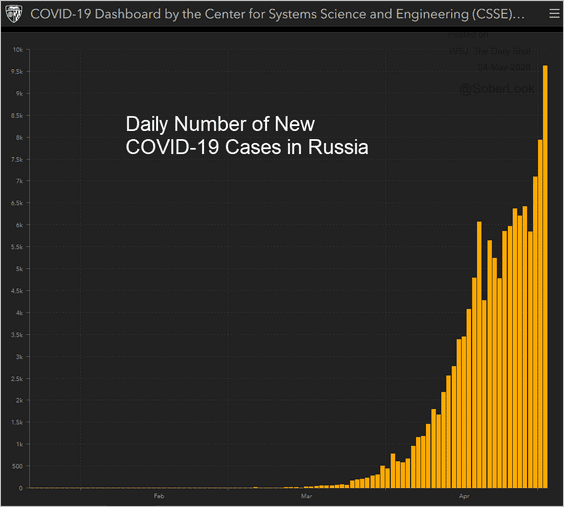 Source: JHU CSSE
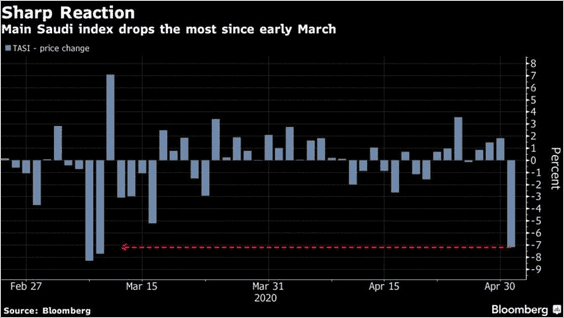
4. Saudi stocks had a rough month.
 Source: @markets Read full article
5. Which countries’ equity markets are most sensitive to oil prices?
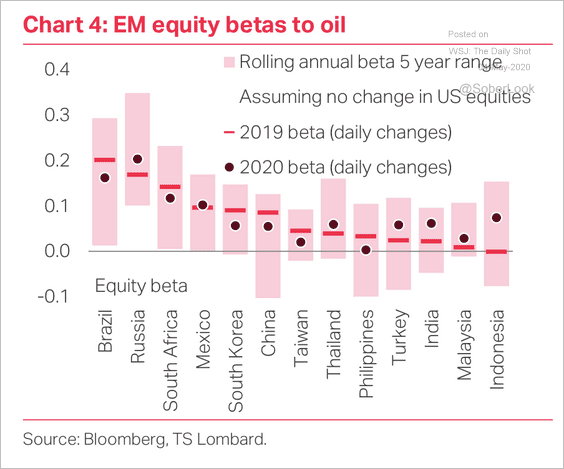 Source: TS Lombard
Commodities
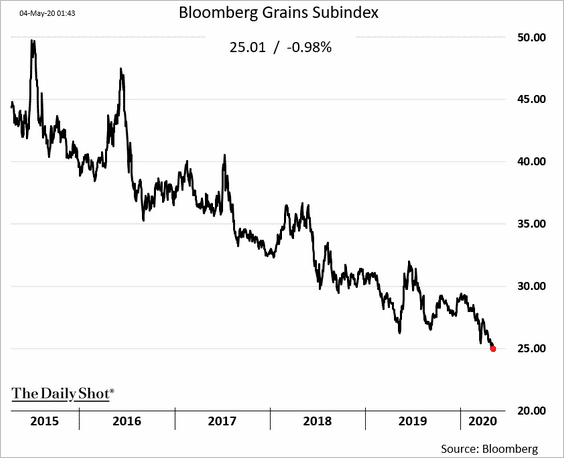
1. Bloomberg’s grains index is near all-time lows.
2. The gold/silver ratio is near record highs.
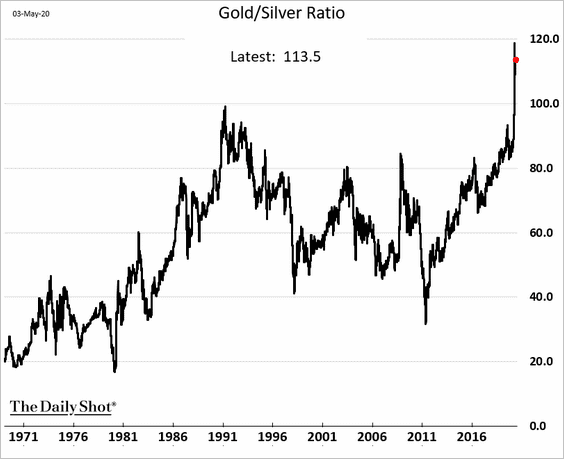 h/t Eddie van der Walt
3. Commodity funds posted their largest total monthly flow ever in April, mostly in gold and energy-focused ETFs.
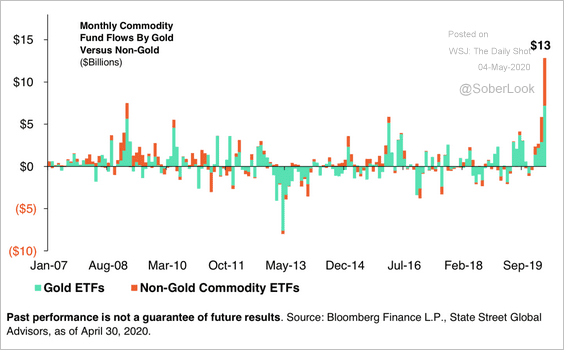 Source: SPDR Americas Research, @mattbartolini
Energy
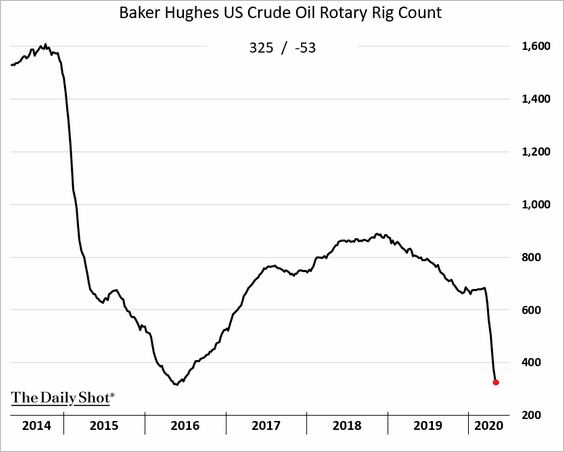
1. The rotary rig count in the US continues to tumble, approaching the 2016 lows.
2. Without government support, the survival of the US shale sector is now in question.
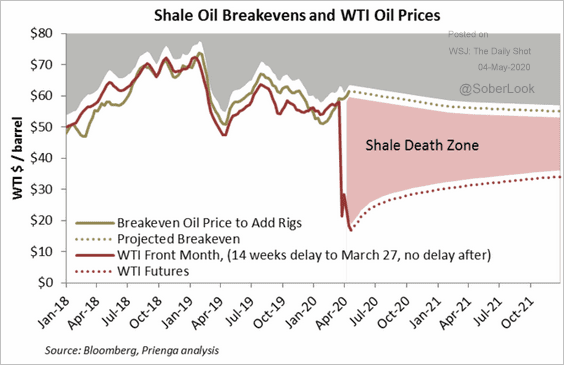 Source: Princeton Energy Advisors Read full article
Many US shale companies are relatively small and are unlikely to weather this shock.
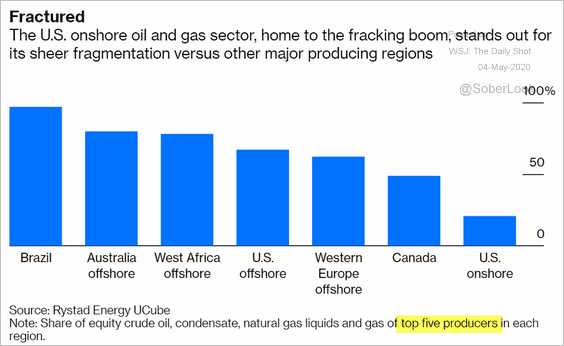 Source: @bopinion Read full article
With shale production expected to collapse, speculators are betting on natural gas (gas production will decline with oil).
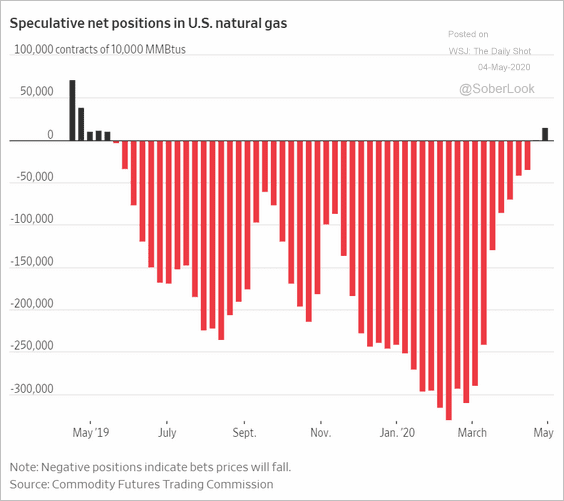 Source: @WSJ Read full article
——————–
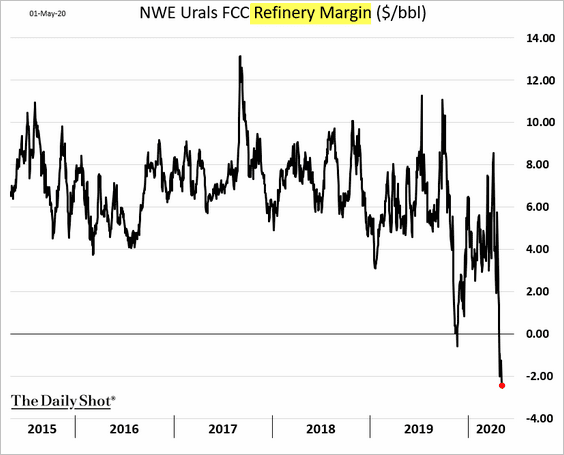
3. It is now quite a challenge to operate a refining business in Europe as refining margins collapse.
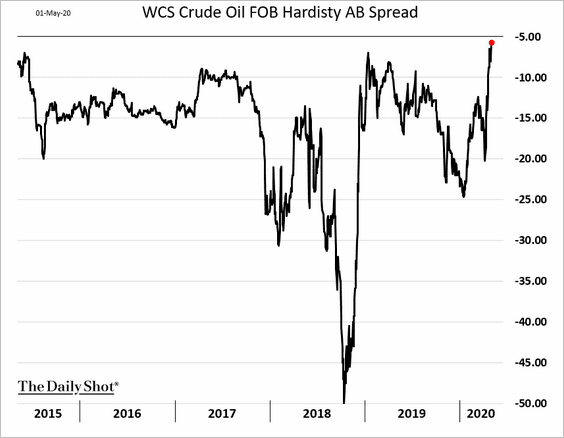
4. Canada’s heavy crude is trading at the smallest discount to the US benchmark in years.
5. Tankers are increasingly used for storage.
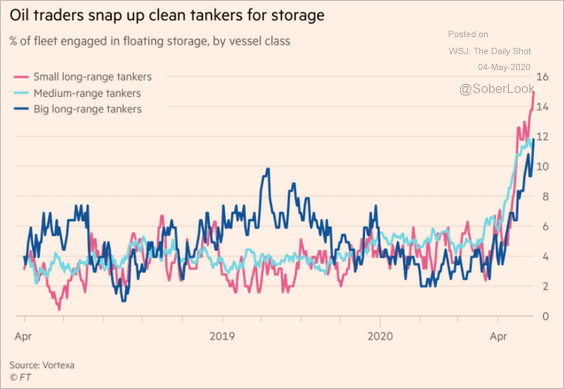 Source: @financialtimes Read full article
6. These scatterplots show correlations in crude oil and natural gas across major global hubs.
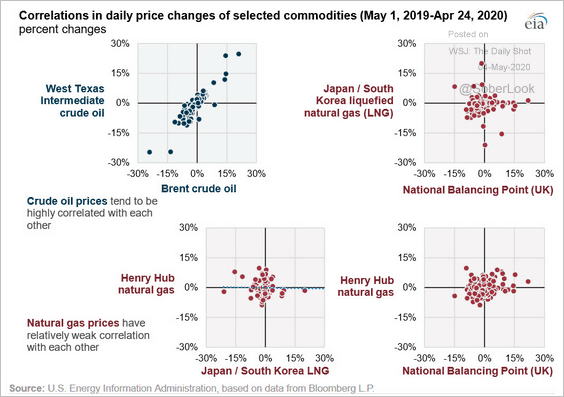 Source: EIA Read full article
Equities
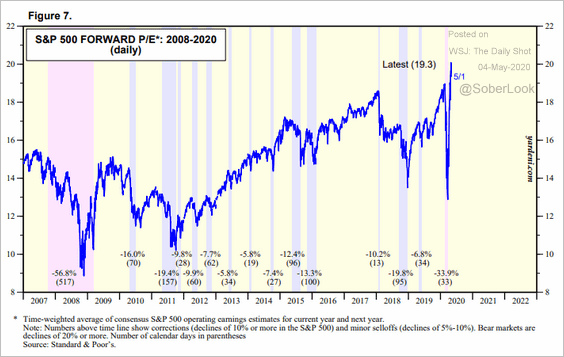
1. Investors have been less worried about earnings over the next 12 months, focusing instead on the rebound that is expected to follow. As a result, P/E multiples on the forward earnings expectations are at multi-year highs. Based on these metrics, stocks look expensive.
 Source: Yardeni Research
Globally, earnings expectations have disconnected from economic fundamentals.
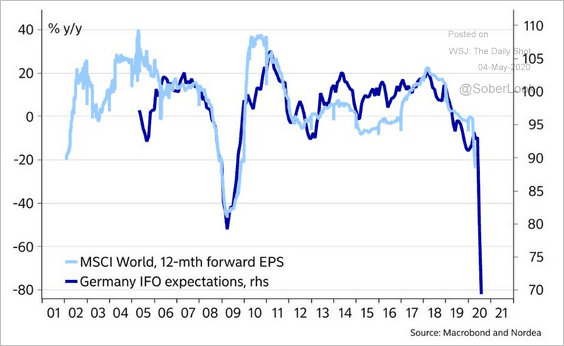 Source: @AndreasSteno
——————–
2. US funds continue to post inflows, while investors pull money away from international and emerging market ETFs.
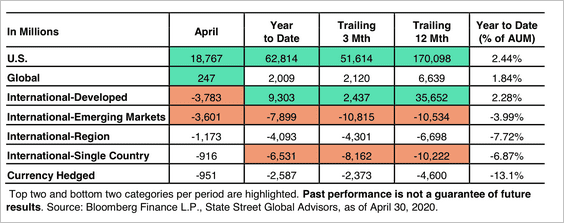 Source: SPDR Americas Research, @mattbartolini
3. The share of S&P 500 companies that beat earnings estimates is well below average.
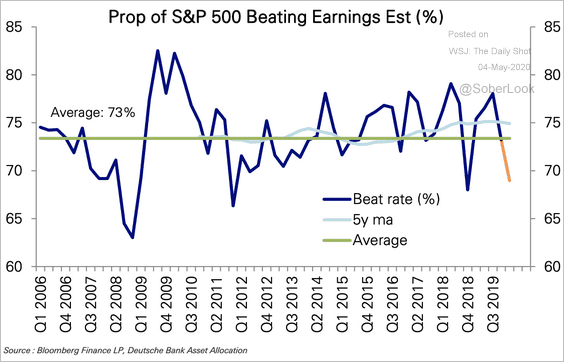 Source: Deutsche Bank Research
4. US M&A activity has slowed.
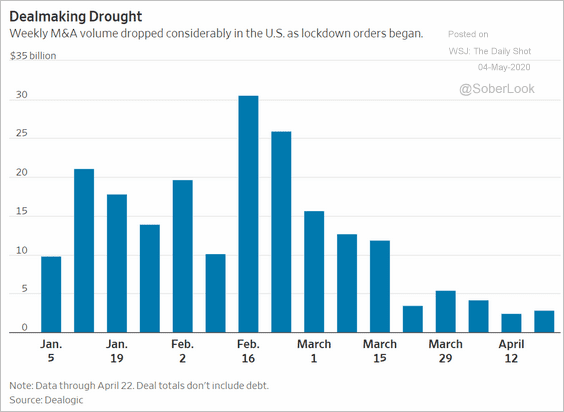 Source: @WSJ Read full article
5. Market-neutral quant hedge funds have been underperforming.
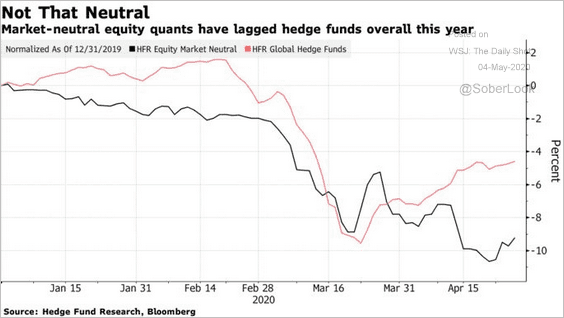 Source: @markets Read full article
6. Finally, we have the best and worst-performing global industry groups year-to-date, according to Morningstar.
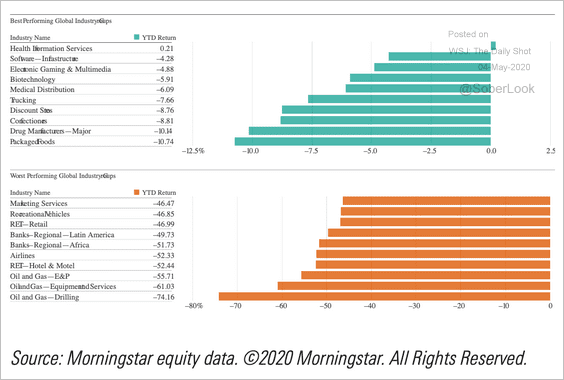 Source: Morningstar
Credit
1. BBB-rated bonds had a good month after the Fed stepped in.
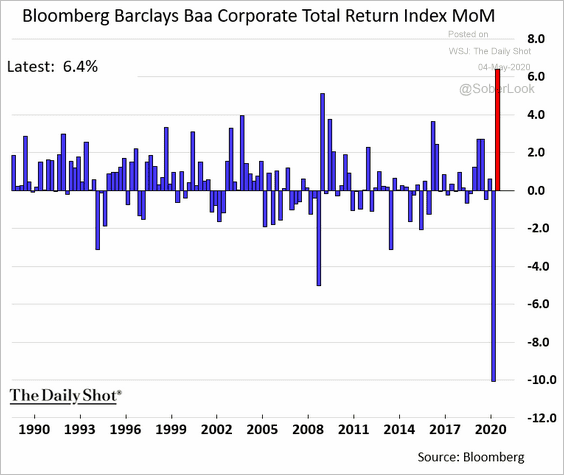 h/t James Crombie
2. Potential fallen angels have risen to a record high, according to Moody’s.
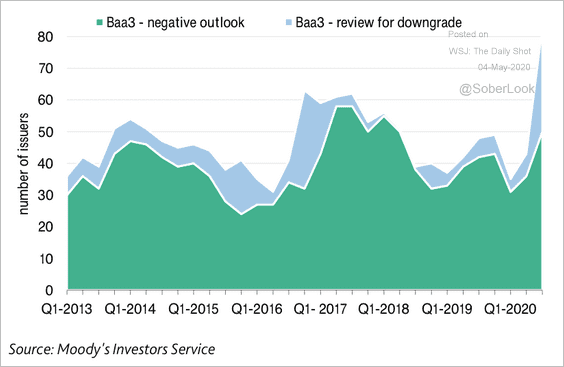 Source: Moody’s Investors Service
Here is the regional breakdown.
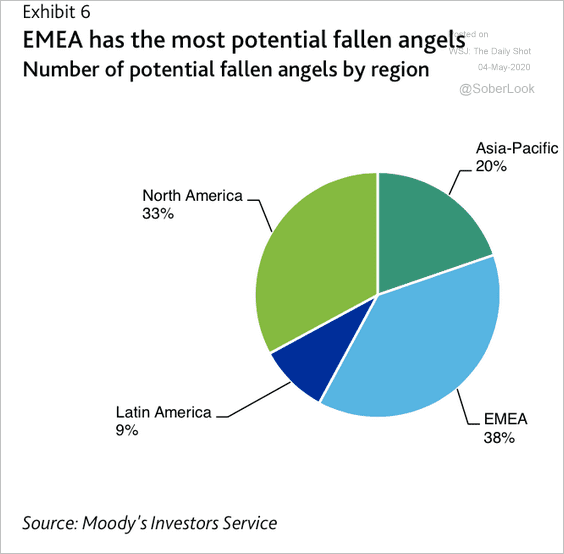 Source: Moody’s Investors Service
——————–
3. Flows into US investment-grade and high-yield corporate bond ETFs seem to be rolling over.
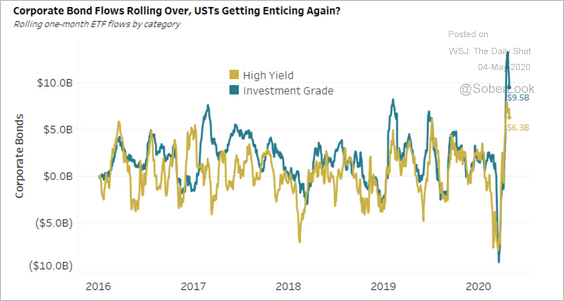 Source: Arbor Research & Trading
4. This table shows year-to-date corporate bond returns by rating and maturity.
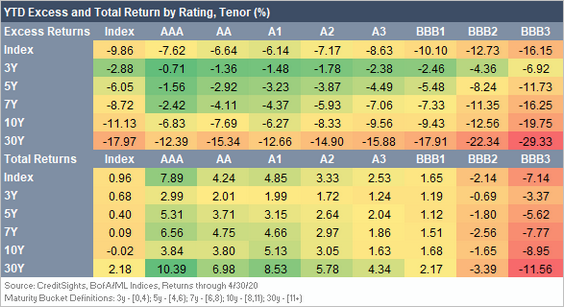 Source: CreditSights
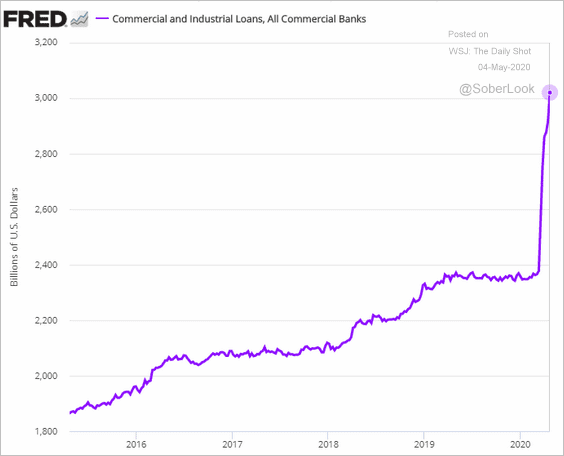
5. US business loan balances keep climbing as companies try to boost liquidity.
In Europe, companies seem to have stopped tapping credit lines.
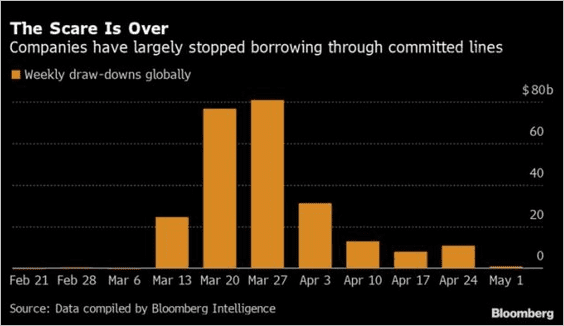 Source: Bloomberg Law Read full article
——————–
6. $767 billion worth of investment-grade bonds have been issued year-to-date.
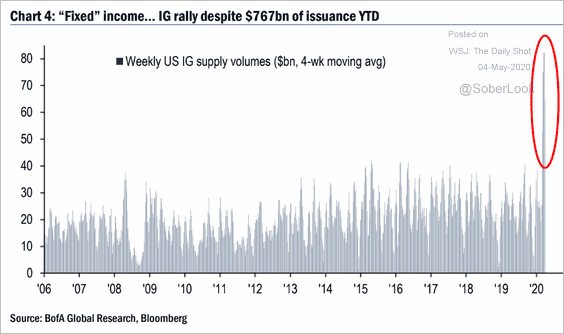 Source: BofA Merrill Lynch Global Research
Rates
1. The Fed has slowed its purchases of Treasuries.
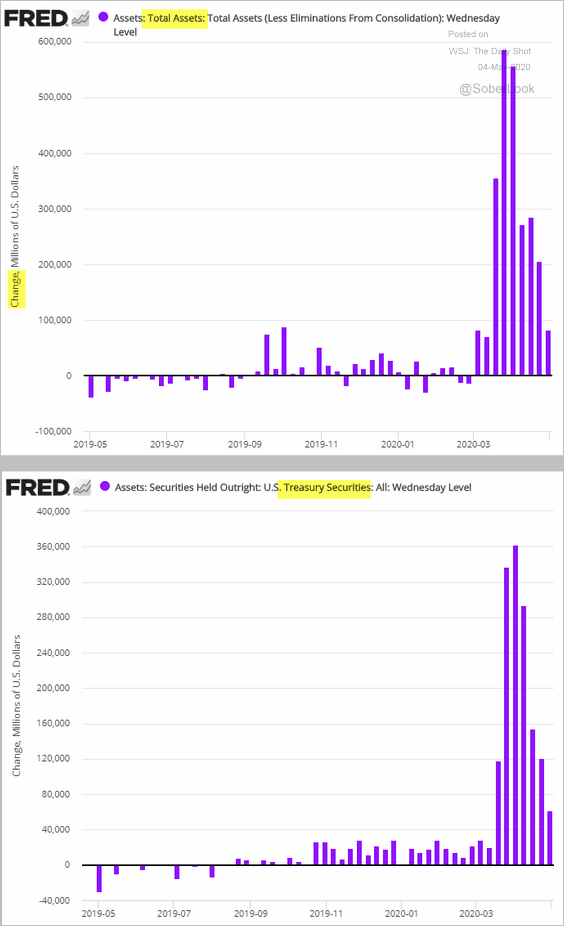
Nonetheless, the central bank’s balance sheet is expected to reach $12 trillion by the end of next year.
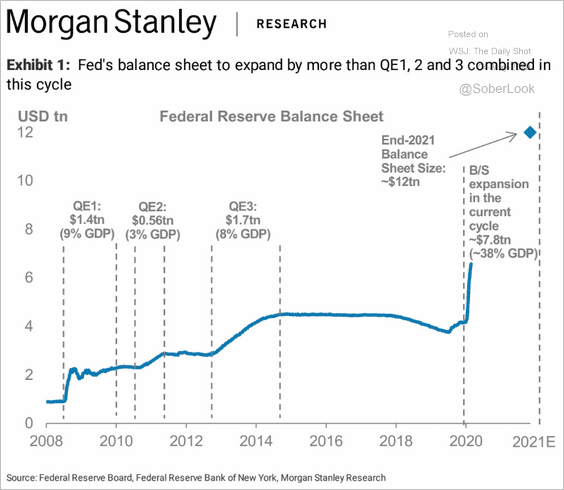 Source: Morgan Stanley Research
——————–
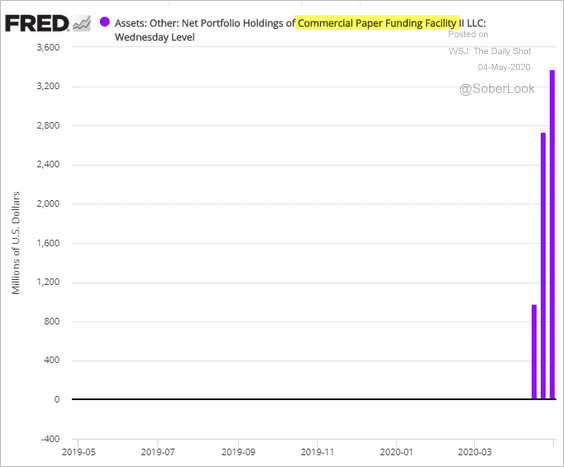
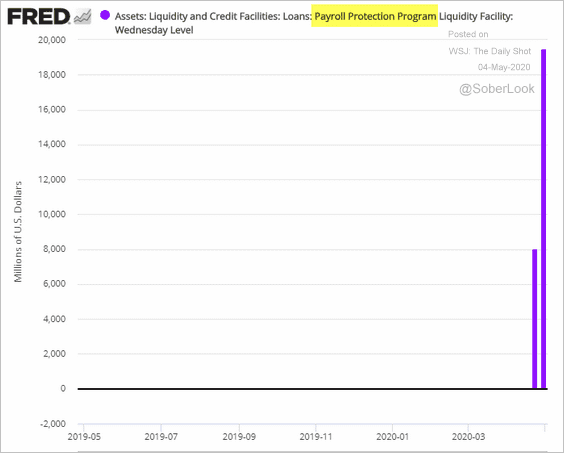
2. The new facilities are ramping up.
• The CP facility (slow start):
• The PPP (small business lending) facility:
——————–
3. The 10yr Treasury yield has been tracking US economic fundamentals.
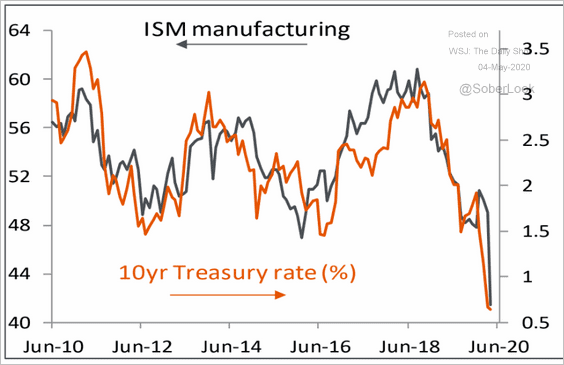 Source: Piper Sandler
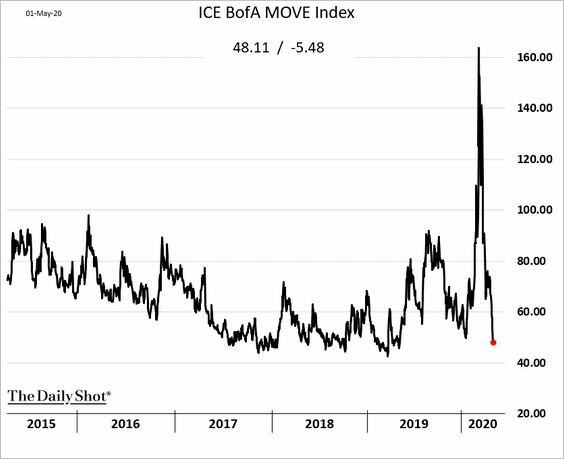
4. Treasury market implied volatility is back to pre-crisis levels.
Global Developments
1. The US dollar is above its fair value estimate, according to ANZ Research.
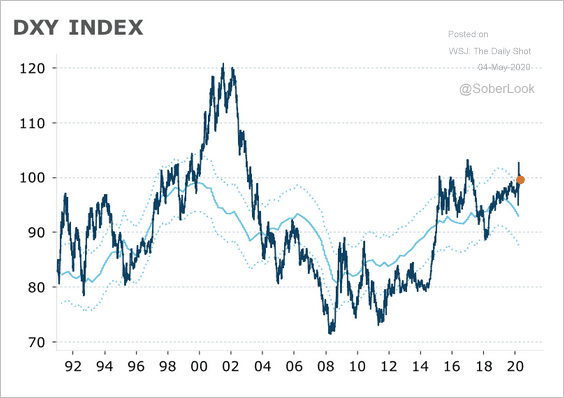 Source: ANZ Research
2. Which manufacturing sectors will be hit the hardest?
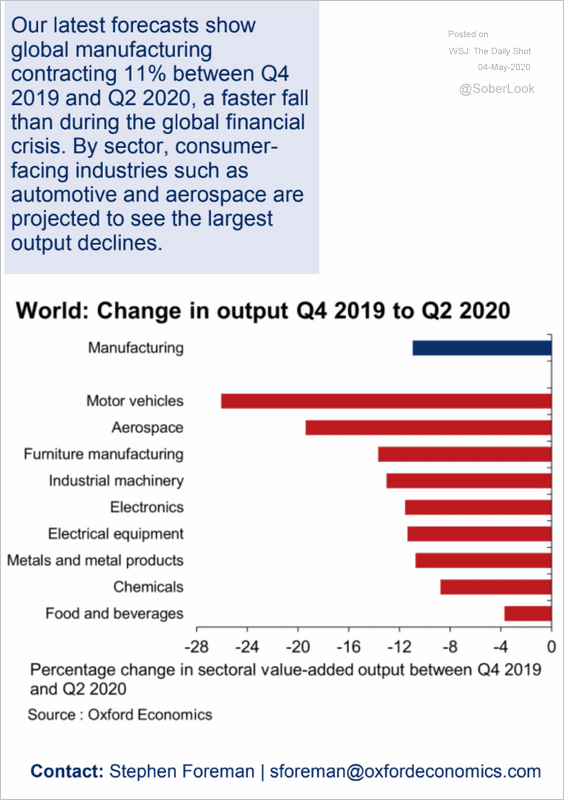 Source: Oxford Economics
3. The Fed has been much more aggressive in its response to the crisis than the ECB and the BoJ.
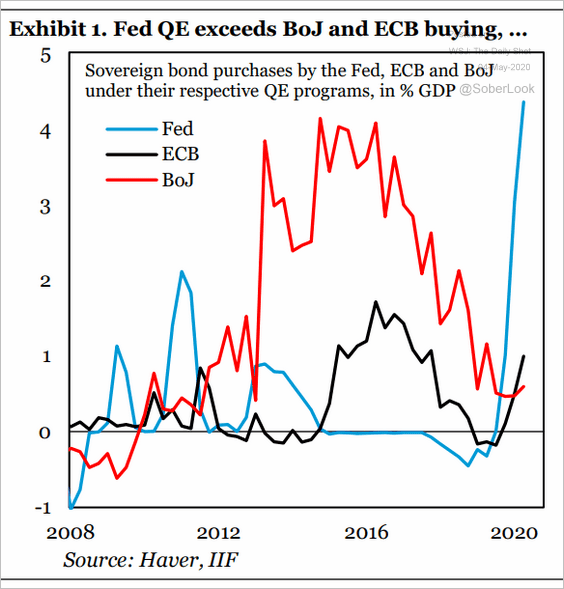 Source: IIF
——————–
Food for Thought
1. Layoffs and hiring in the US food industry:
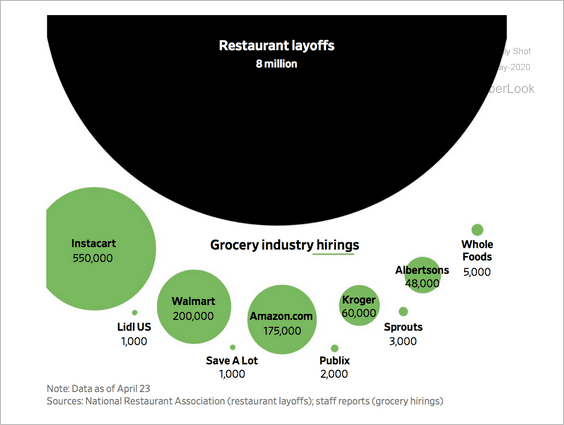 Source: @WSJ Read full article
2. Views on tracking apps:
![]() Source: The Washington Post Read full article
Source: The Washington Post Read full article
3. The 2020 electoral map according to the betting market:
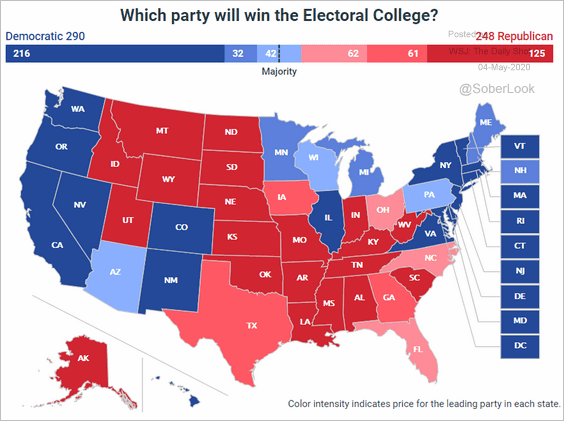 Source: @PredictIt
4. Views on helping states:
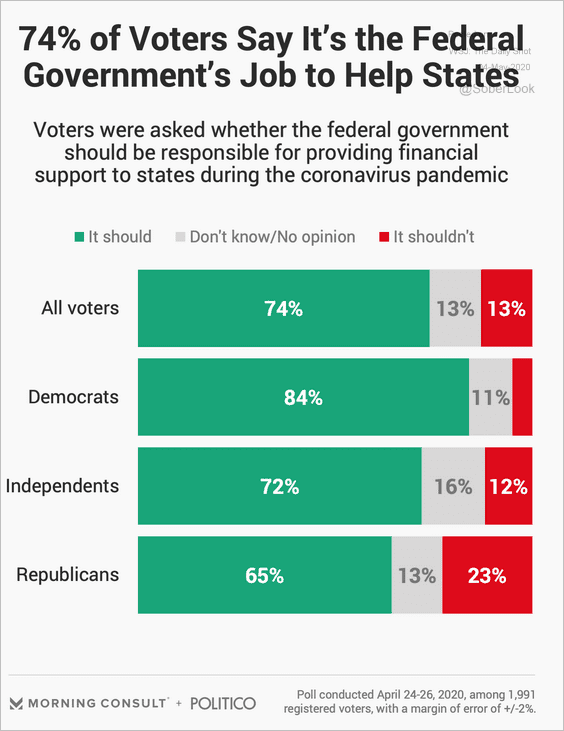 Source: Morning Consult Read full article
5. Compliance with stay-at-home orders:
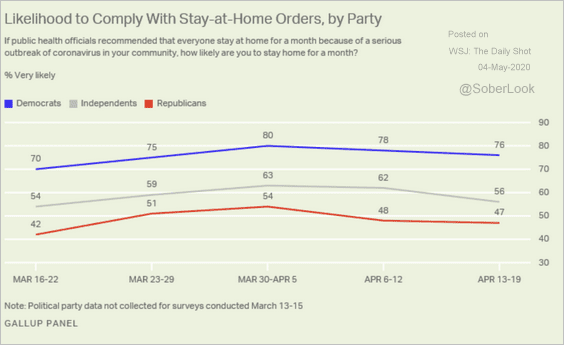 Source: Gallup Read full article
6. The legal status of US foreign-born population:
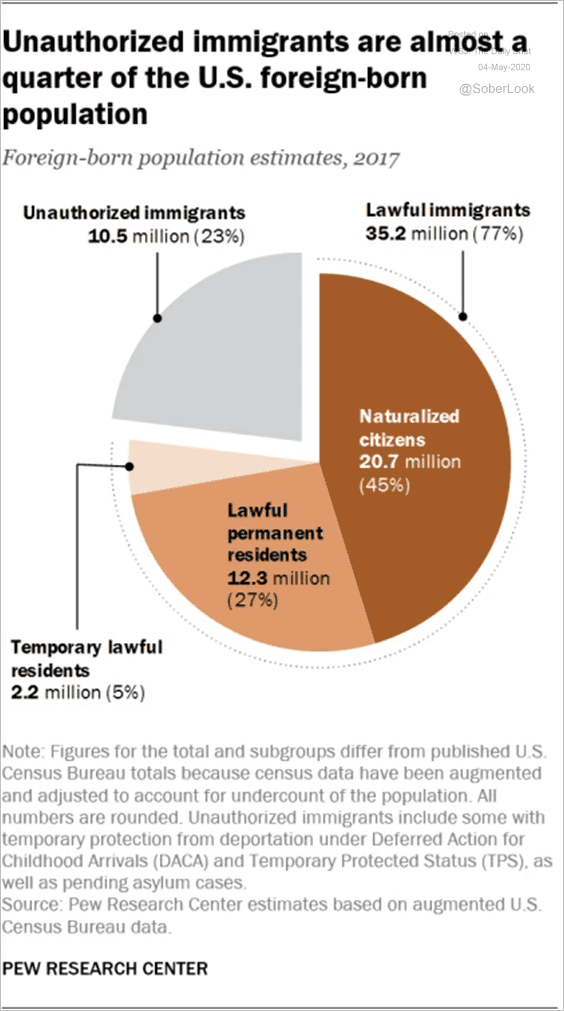 Source: Pew Research Center Read full article
7. Languages spoken among US immigrants:
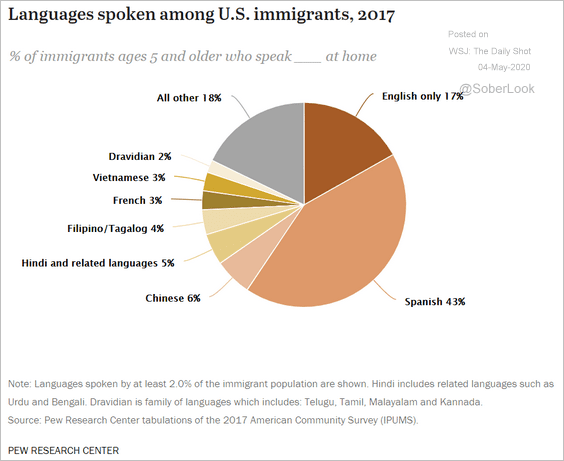 Source: Pew Research Center Read full article
8. Vaccine efforts:
 Source: Nature Read full article
9. Gradual reopening (2 charts):
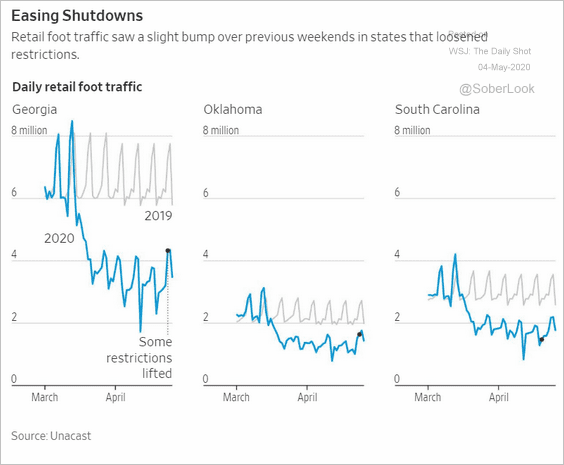 Source: @WSJ Read full article
 Source: @economistmeg Read full article
——————–
10. Gestation periods:
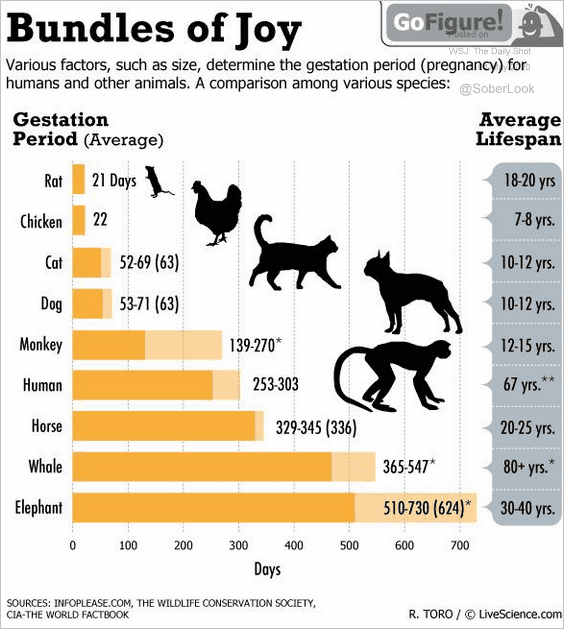 Source: LiveScience.com
——————–