
The Daily Shot: 05-May-20
• Emerging Markets
• China
• Japan
• The Eurozone
• Europe
• Canada
• The United States
• Rates
• Credit
• Equities
• Energy
• Commodities
• Global Developments
• Food for Thought
Emerging Markets
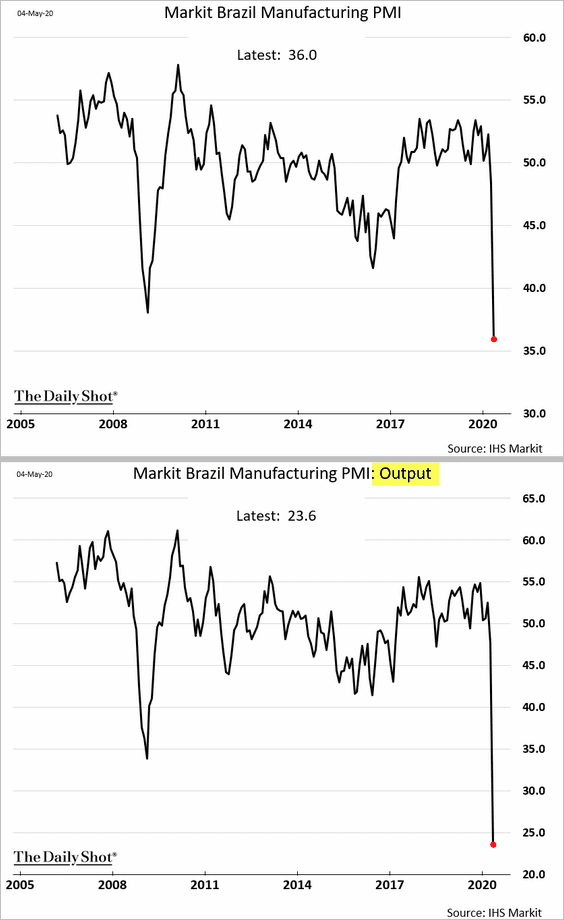
1. Let’s begin with Brazil.
• The nation’s manufacturing-sector contraction is now substantially worse than what we saw after the financial crisis.
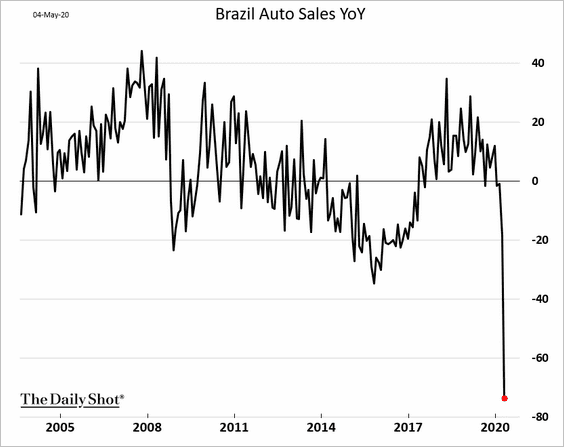
• Vehicle sales collapsed last month.
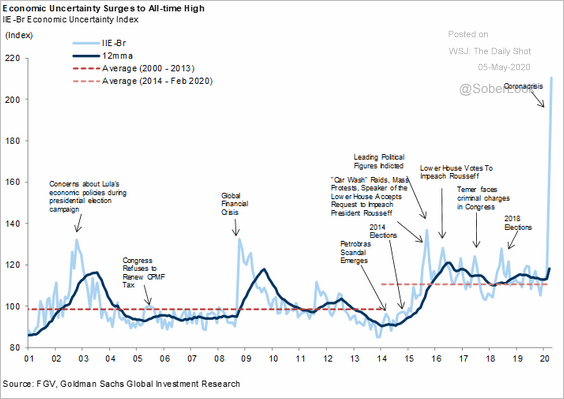
• Here is the economic uncertainty index.
 Source: Goldman Sachs
——————–
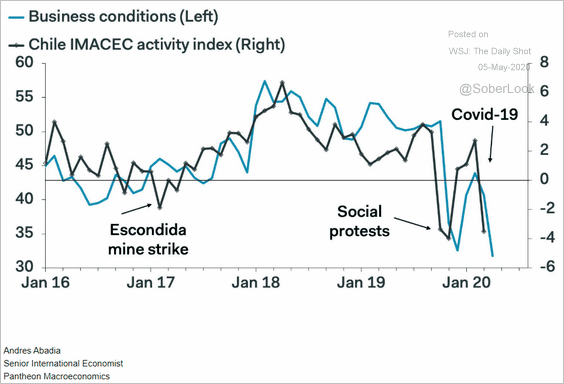
2. Chile’s rebound in economic activity was short-lived.
 Source: Pantheon Macroeconomics
3. Mexican remittances unexpectedly spiked in March, hitting a record high.
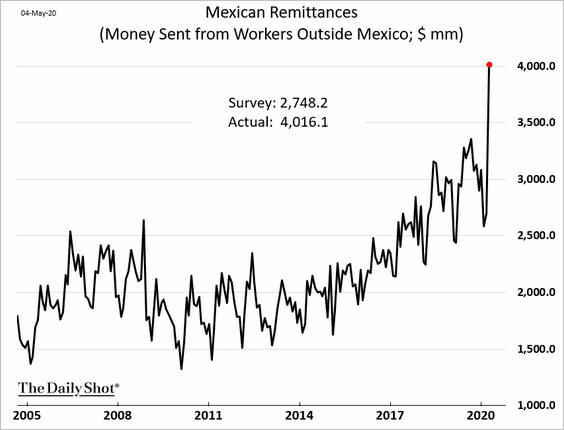
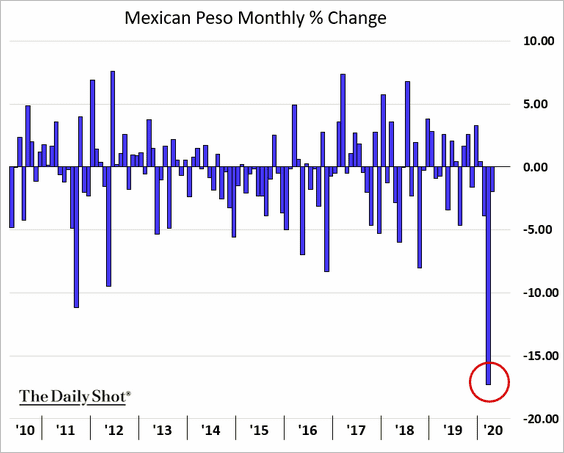
Workers from Mexico living in the US tapped their dollar savings to take advantage of the weak peso during the crisis.
Here is a comment from Goldman.
Alberto Ramos (Goldman Sachs): – The significant acceleration of remittances in March is difficult to square with labor market conditions and sentiment in the US. We speculate that perhaps fearing a significant deterioration of the employment and income prospects in the US, many workers may have capitalized on a favorable USD/MXN level to send part of their accumulated savings in the US back to Mexico.
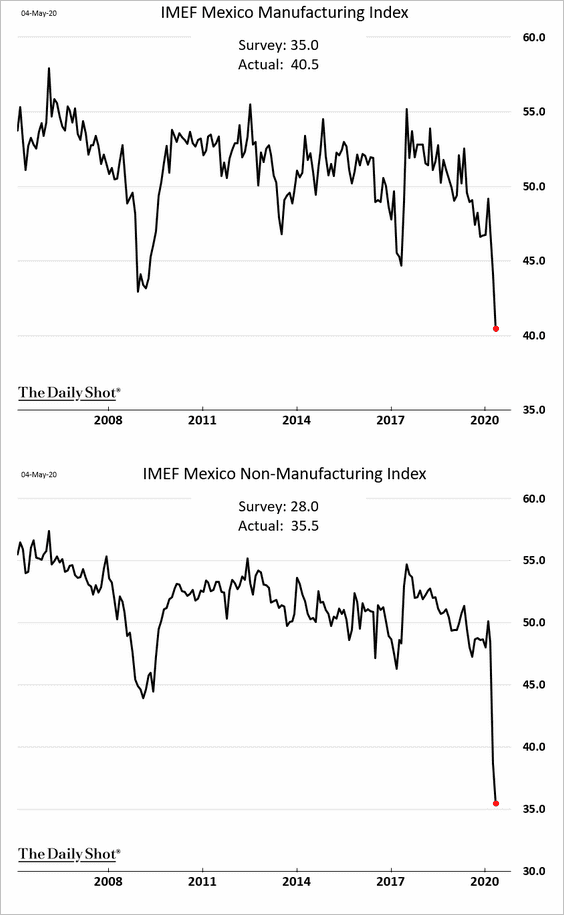
Separately, Mexico’s business activity deteriorated further in April, with the PMI indices hitting record lows.
——————–
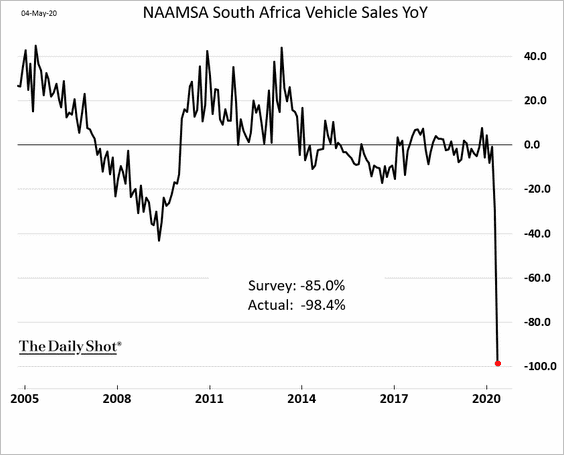
4. South Africa’s car sales completely stopped last month.
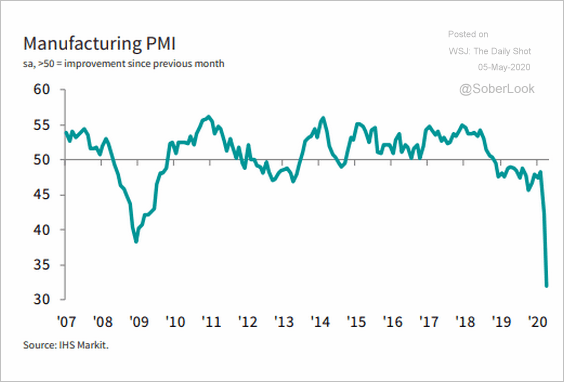
5. This chart shows Turkey’s manufacturing PMI.
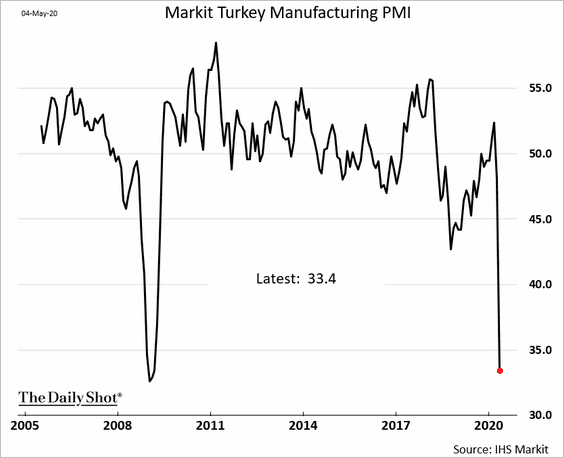
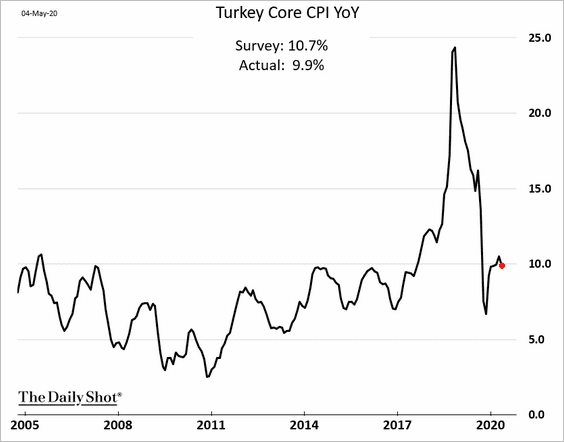
Separately, Turkey’s core inflation is back below 10%.
——————–
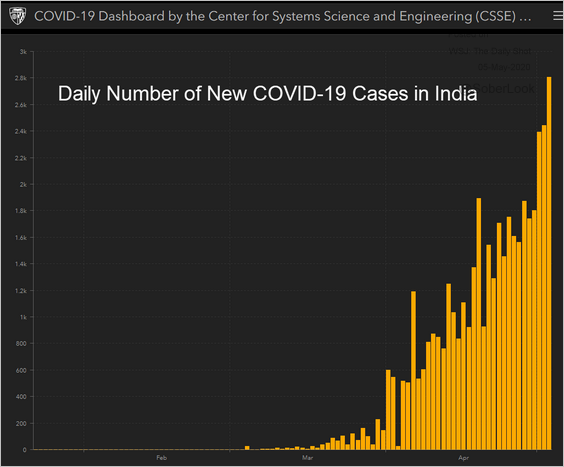
6. New coronavirus cases in India have accelerated.
 Source: JHU CSSE
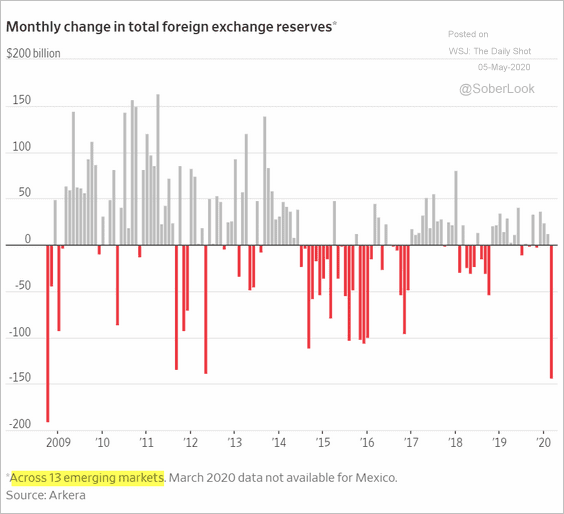
7. EM F/X reserves declined sharply in March.
 Source: @WSJ Read full article
8. May is typically not a good month for emerging-market assets.
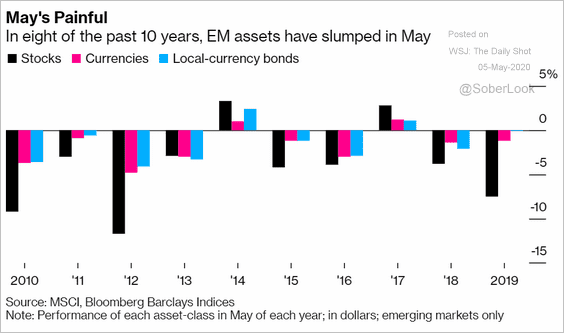 Source: @markets Read full article
9. EM high-yield sovereign bond spreads remain elevated.
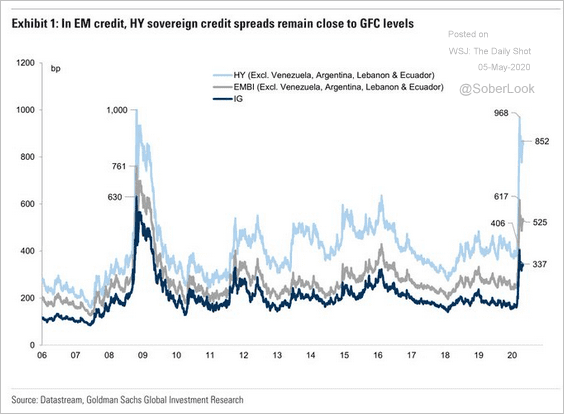 Source: Goldman Sachs, @TayTayLLP
10. Finally, here is the Economist’s EM vulnerability heat map.
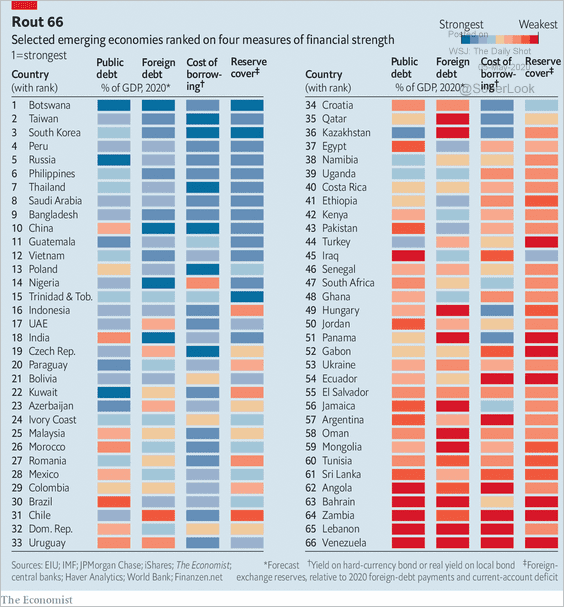 Source: The Economist Read full article
China
1. Corporate earnings have deteriorated sharply in the first quarter.
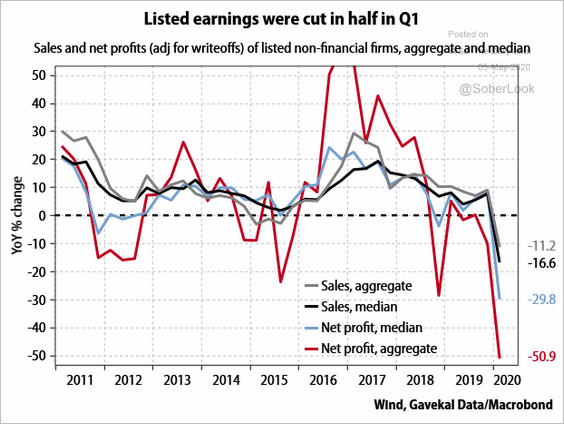 Source: Gavekal
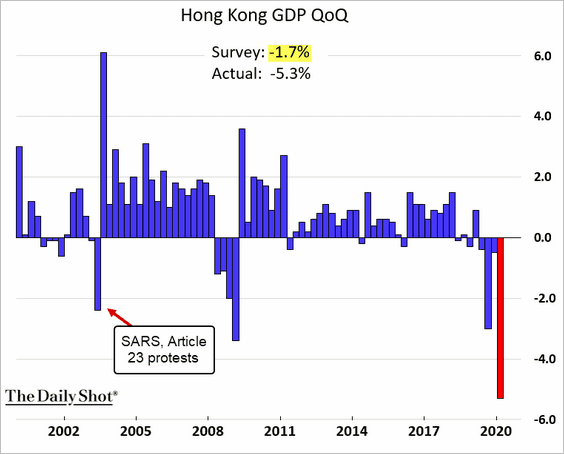
2. Hong Kong’s GDP registered the largest quarterly decline on record as the recession deepens.
Japan
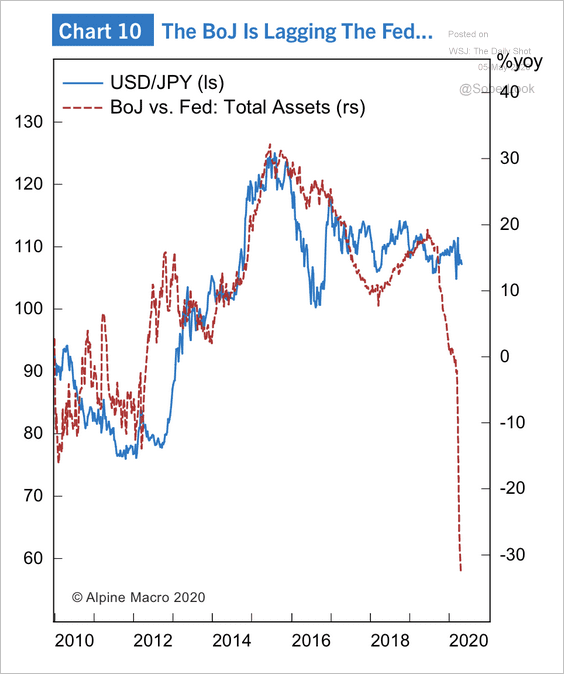
The Bank of Japan is lagging the Fed in terms of total assets, which could weigh on USD/JPY.
 Source: Alpine Macro
The Eurozone
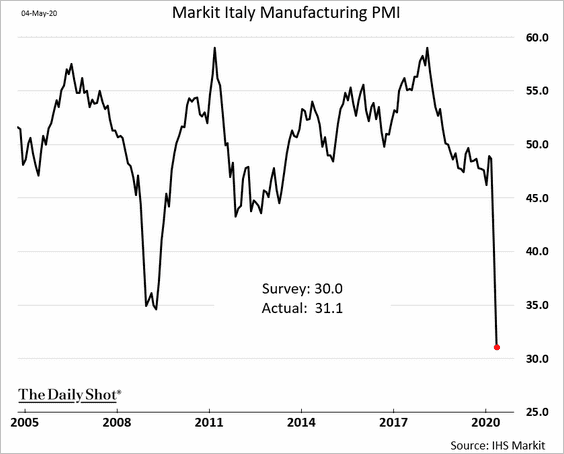
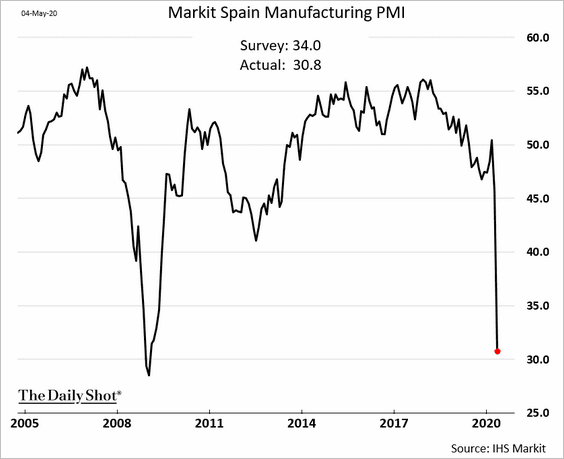
1. The April manufacturing PMI reports continue to show devastation in factory activity.
• Italy:
• Spain:
——————–
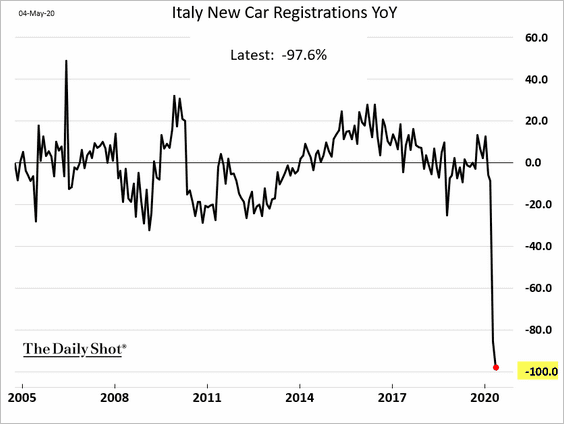
2. Italian new vehicle registrations completely stopped in April.
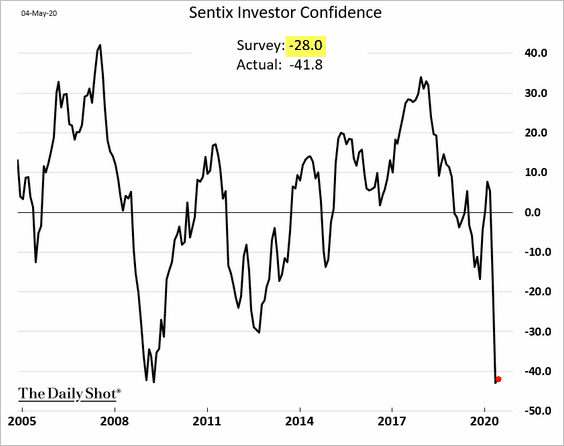
3. The expected rebound in the Sentix index did not materialize.
4. The ECB has been deviating from the capital keys in its PSPP securities purchases.
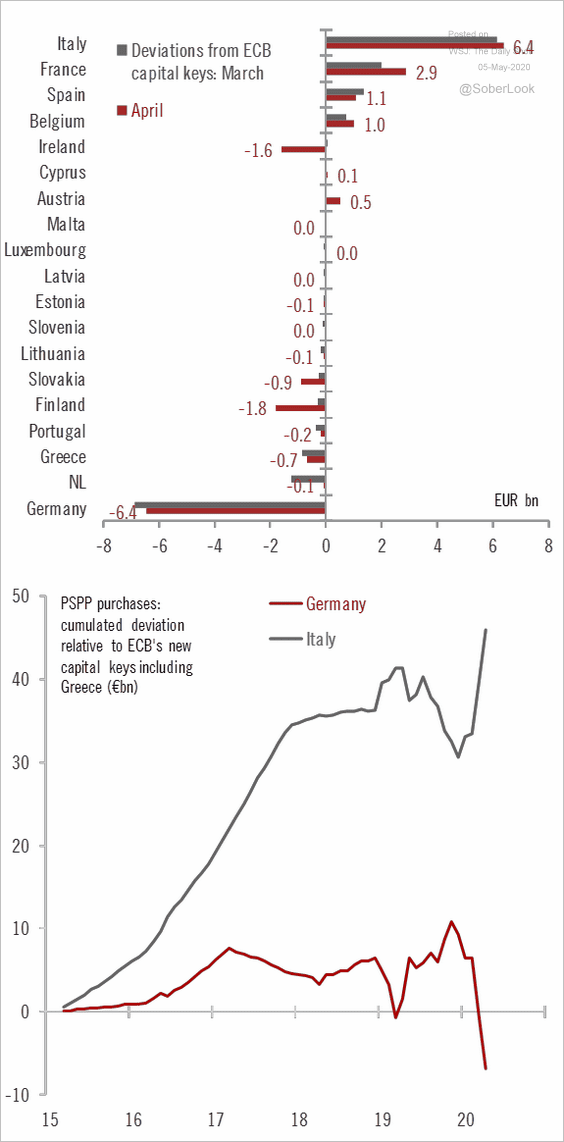 Source: @fwred, Banque Pictet Read full article
5. Long-term Eurozone GDP growth forecasts have finally bottomed.
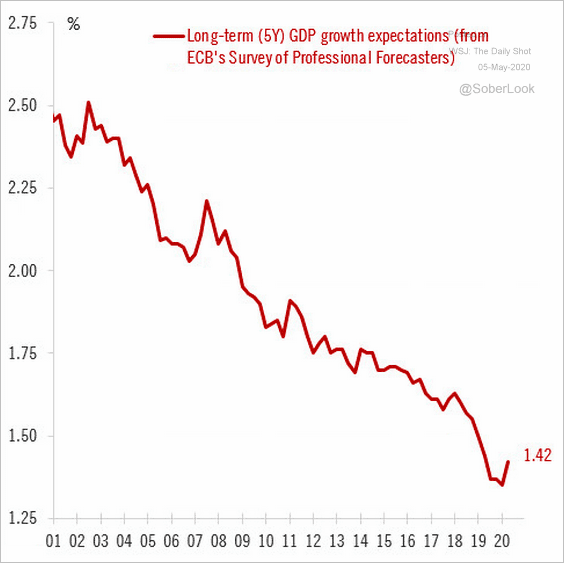 Source: @fwred
6. Households’ demand for credit tumbled since the start of the pandemic.
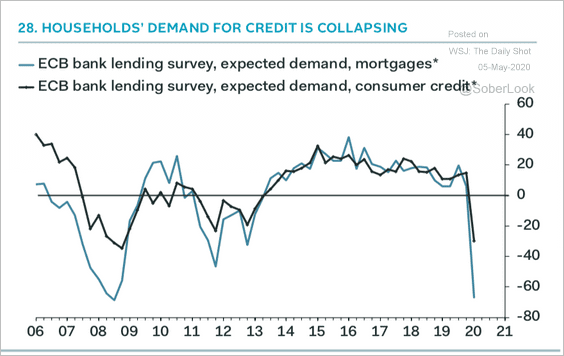 Source: Pantheon Macroeconomics
Europe
1. Sweden’s manufacturing activity crashed in April.

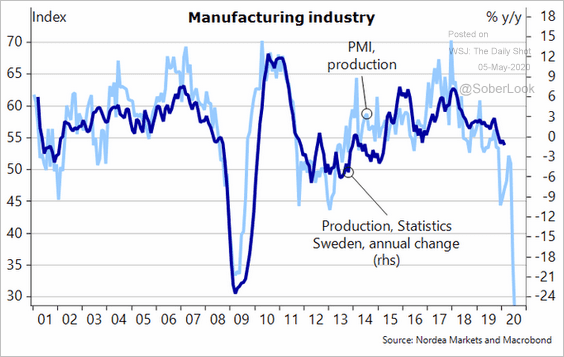 Source: @TorbjrnIsaksson Read full article
——————–
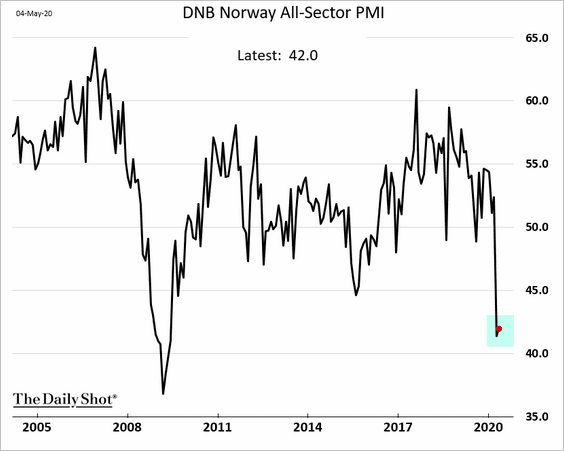
2. Norway’s all-sector PMI stabilized in April but remains deep in contraction territory (PMI < 50).
3. Central European manufacturing hubs are struggling.
• The Czech Republic’s manufacturing PMI:
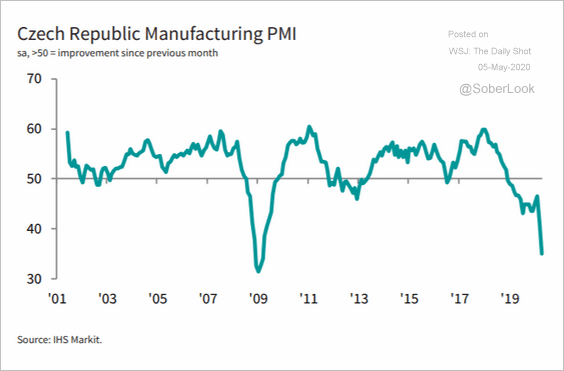 Source: @IHSMarkitPMI Read full article
• Poland’s manufacturing PMI:
 Source: @IHSMarkitPMI Read full article
Canada
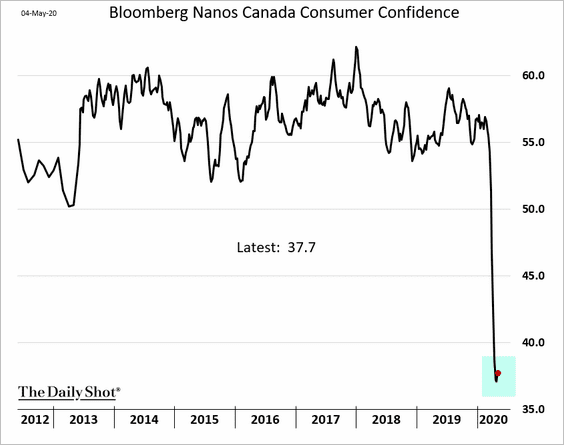
1. Consumer confidence appears to have stabilized near record lows.
2. CIBC expects the unemployment rate to remain elevated through next year.
 Source: CIBC Capital Markets
The United States
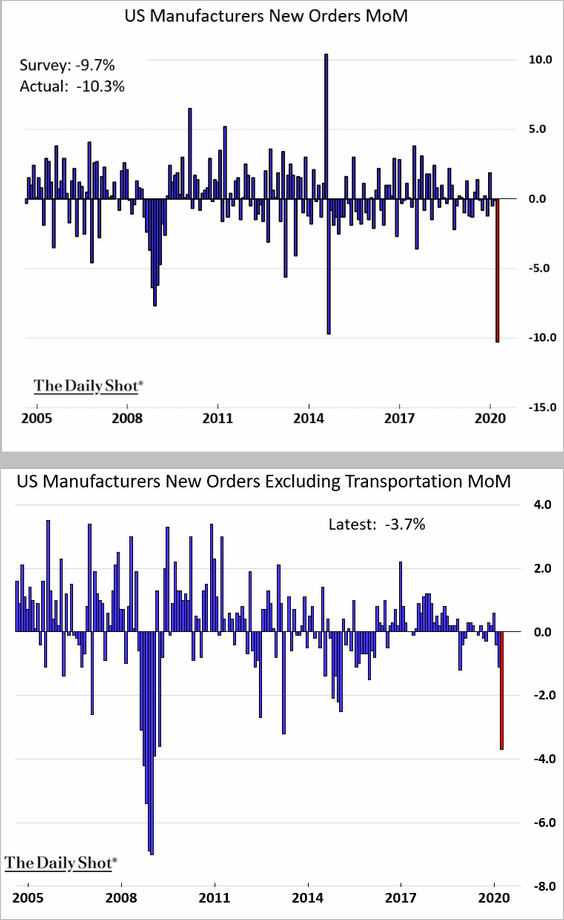
1. Factory orders registered sharp declines in March.
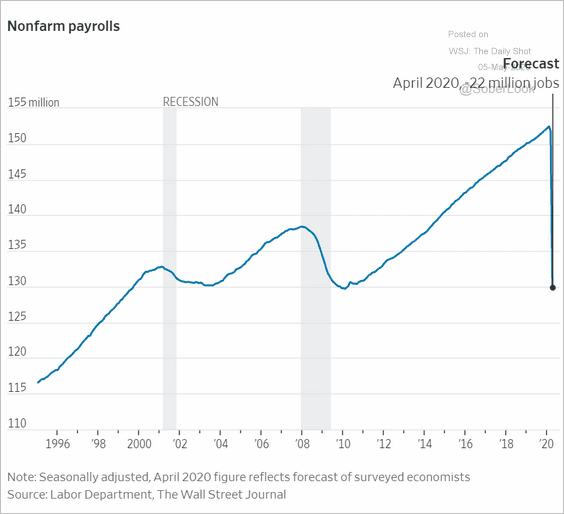
2. Below are a few updates on the labor market.
• Economists expect the April payrolls report to show a complete reversal of all the job gains since the 2009 lows.
 Source: @WSJ Read full article
• The largest US cities suffered steeper job losses (in percent terms) than smaller metro areas.
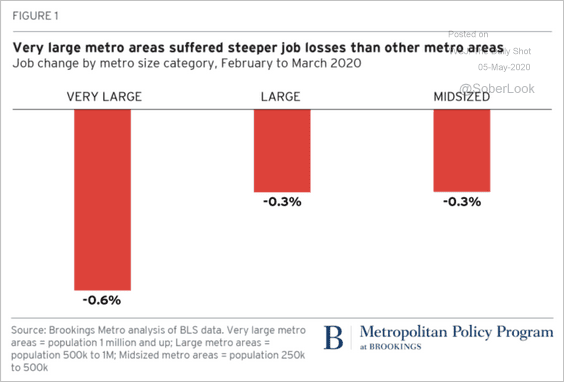 Source: The Brookings Institution Read full article
• The US unemployment rate tends to be more volatile than what we see in other countries.
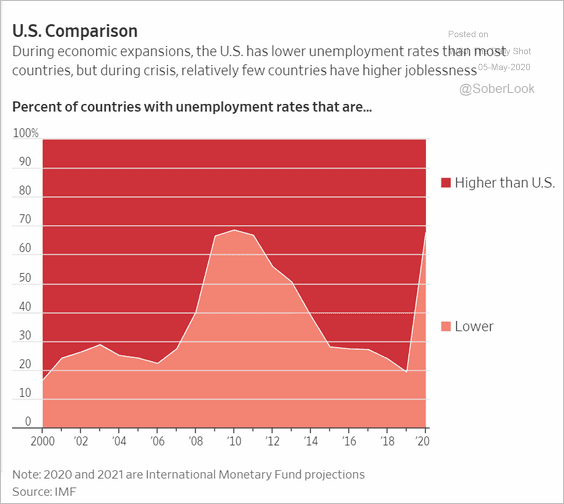 Source: @WSJ Read full article
• This chart shows federal spending on unemployment insurance.
 Source: @pgpfoundation Read full article
——————–
3. Consumer confidence has been more resilient than retail sales.
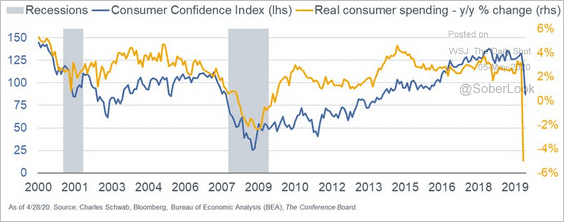 Source: @LizAnnSonders
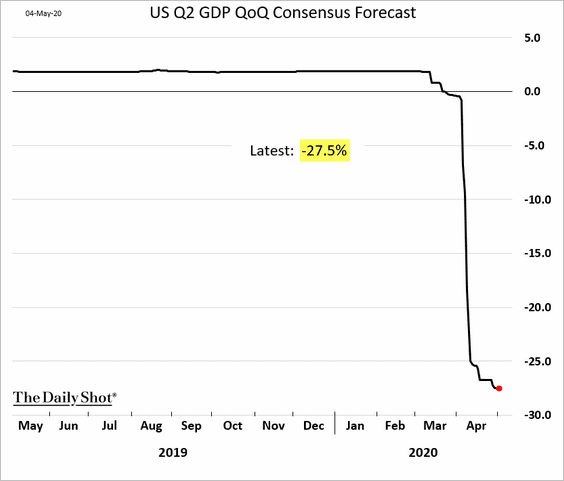
4. How massive will the GDP decline be in the second quarter?
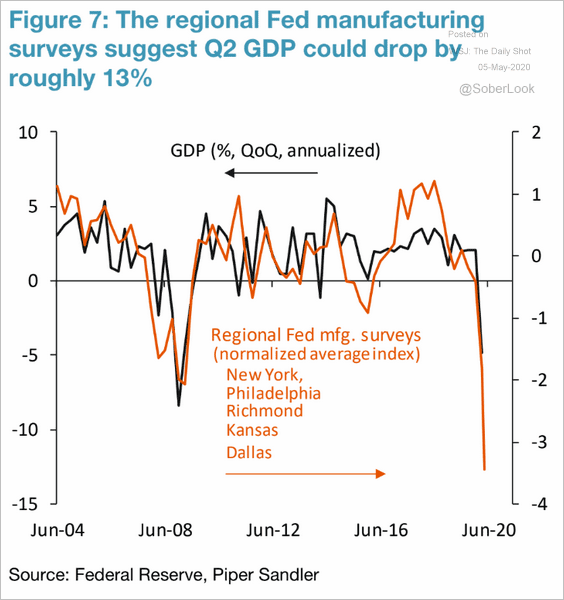 Source: Piper Sandler
Many economists suggest that “soft” economic data such as the PMI or regional Fed surveys are substantially underestimating the carnage in output. The latest consensus forecast is a contraction of 27.5% (annualized).
Here is a forecast for the GDP trajectory vs. 2008 (from Moody’s).
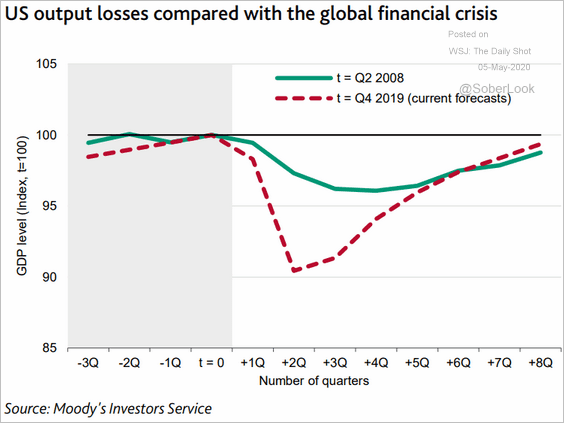 Source: Moody’s Investors Service
——————–
5. Next, we have some updates on inflation.
• The largest GDP contraction in recent history (above) is expected to usher in deflation.
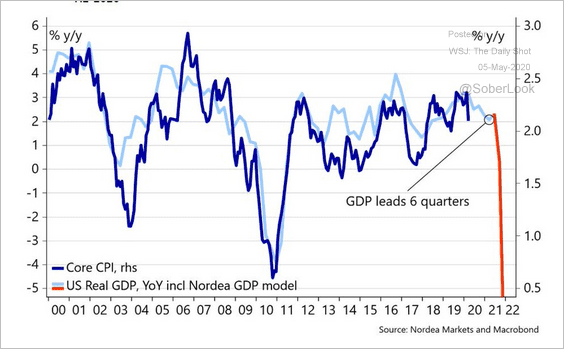 Source: @AndreasSteno
• The collapse in oil prices will also drag the core CPI into deflation territory.
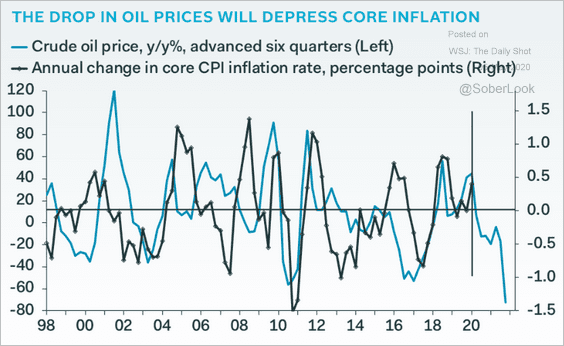 Source: Pantheon Macroeconomics
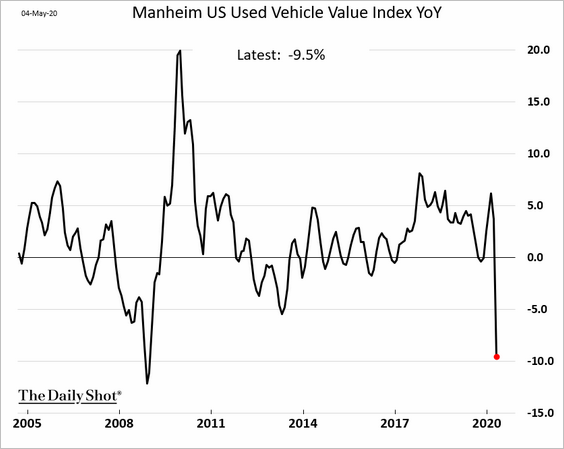
• Used vehicle prices are down almost 10% from the same time last year (adding to deflationary pressures).
——————–
6. Finally, here is Bloomberg’s US recovery heat map.
![]() Source: @business Read full article
Source: @business Read full article
Rates
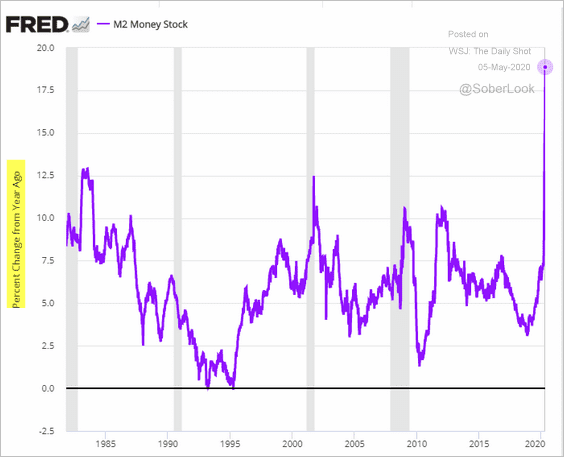
1. The growth in the US money supply continues to hit new records.
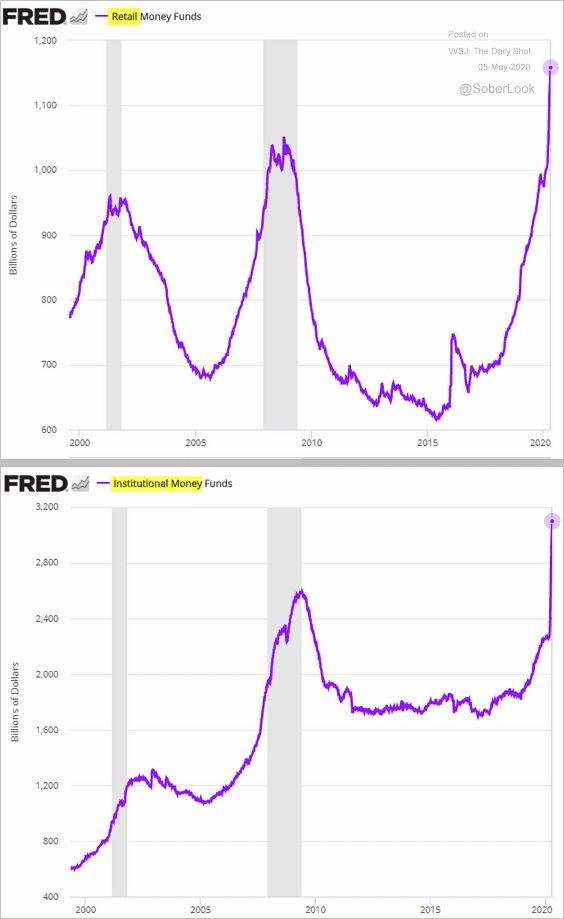
2. Money market fund assets are soaring.
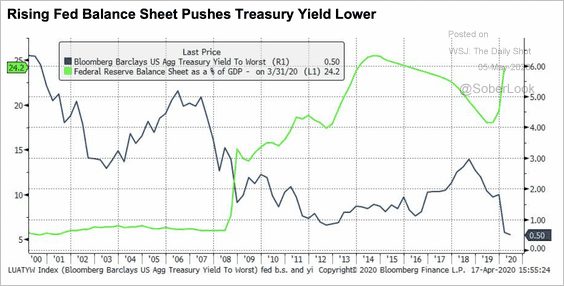
3. This chart shows the Fed’s balance sheet (as % of GDP) vs. Treasury yields.
 Source: Caldan Partners Read full article
4. Will Treasury yields follow other developed markets into negative territory?
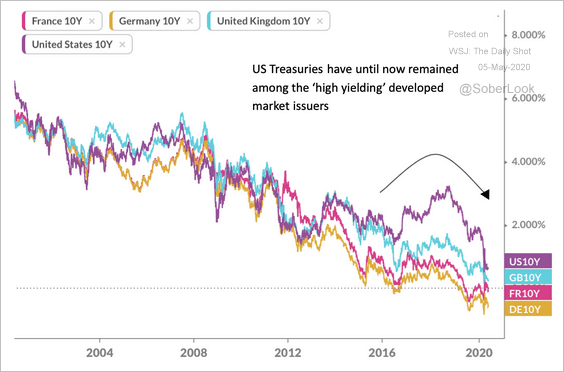 Source: Caldan Partners Read full article
5. TIPS yields could see further downside.
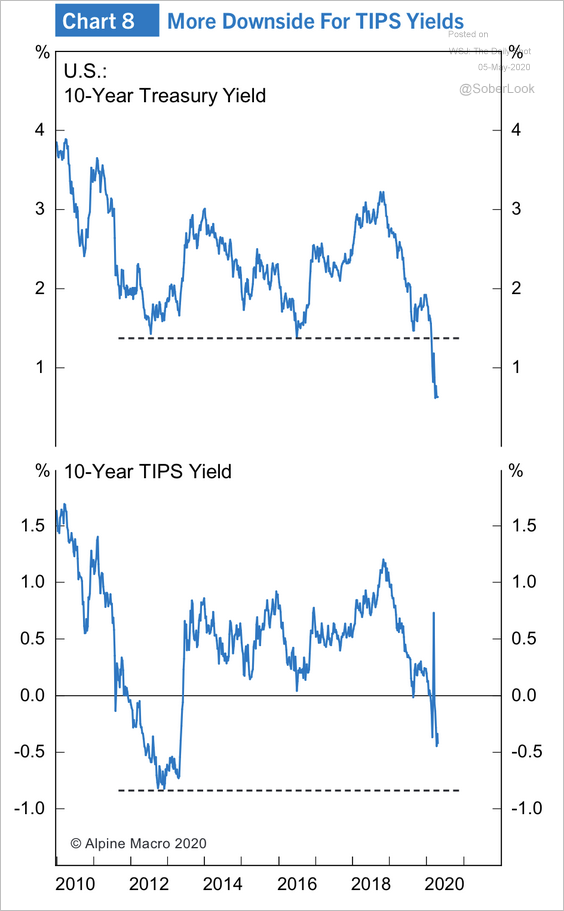 Source: Alpine Macro
6. Mortgage rates remain elevated relative to the 10yr Treasury yield (see #2 here).
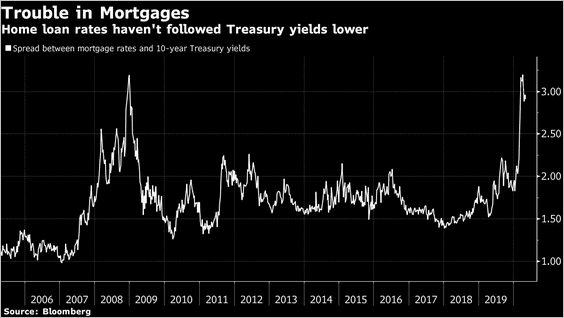 Source: @BloombergQuint Read full article
7. This chart shows the issuance of SOFR-linked bonds.
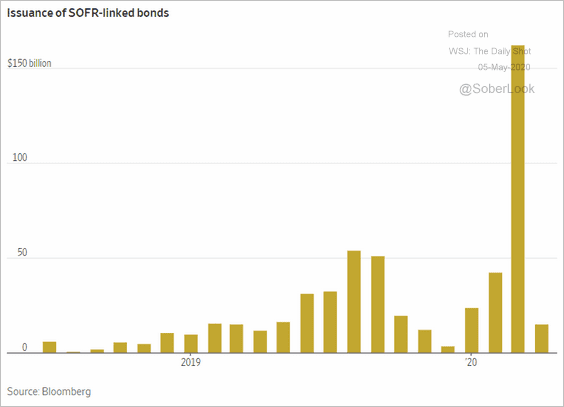 Source: @WSJ Read full article
Credit
1. Let’s begin with the Fed’s Senior Loan Officer Opinion Survey.
• Banks tightening standards on business loans:
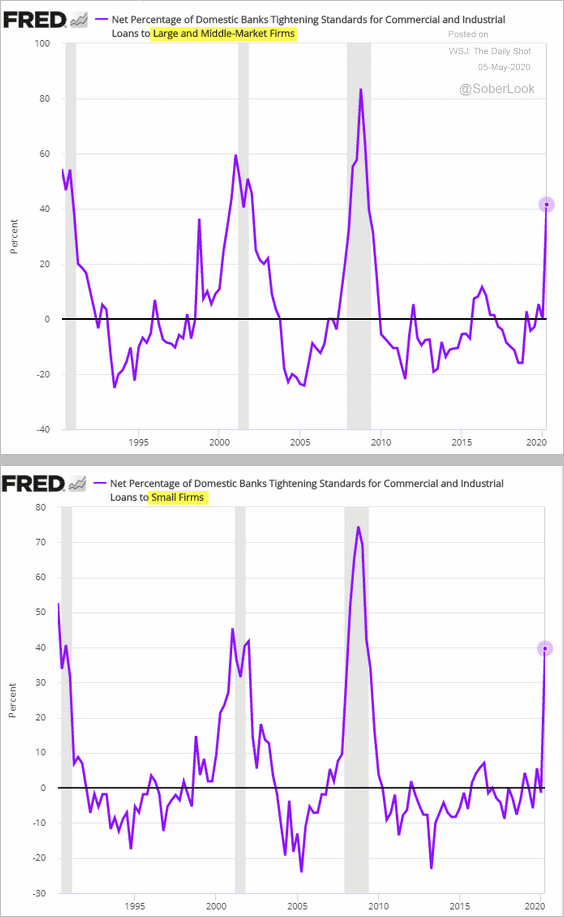
• Tightening standards on credit cards and other consumer debt (2 charts):
 Source: Senior Loan Officer Opinion Survey, The Federal Reserve
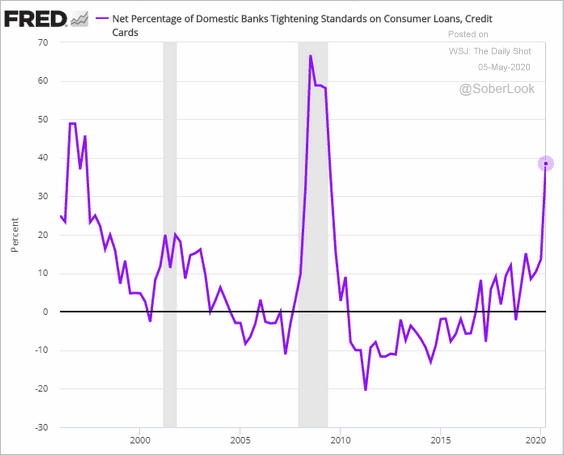
• Demand for credit cards and automobile loans:
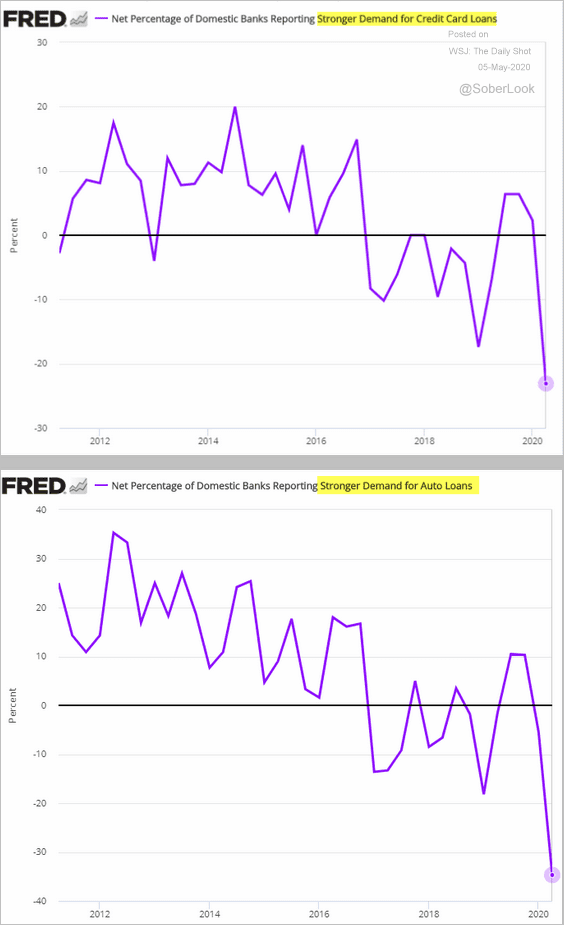
• Demand and lending standards on commercial real estate loans:
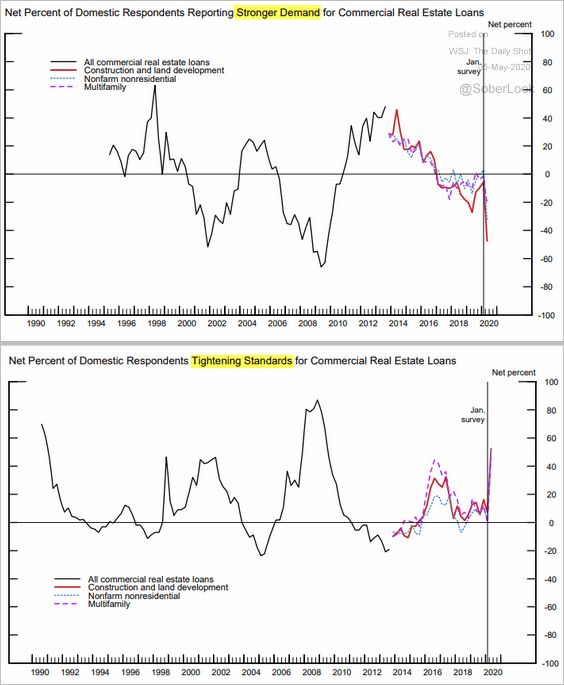 Source: Senior Loan Officer Opinion Survey, The Federal Reserve
——————–
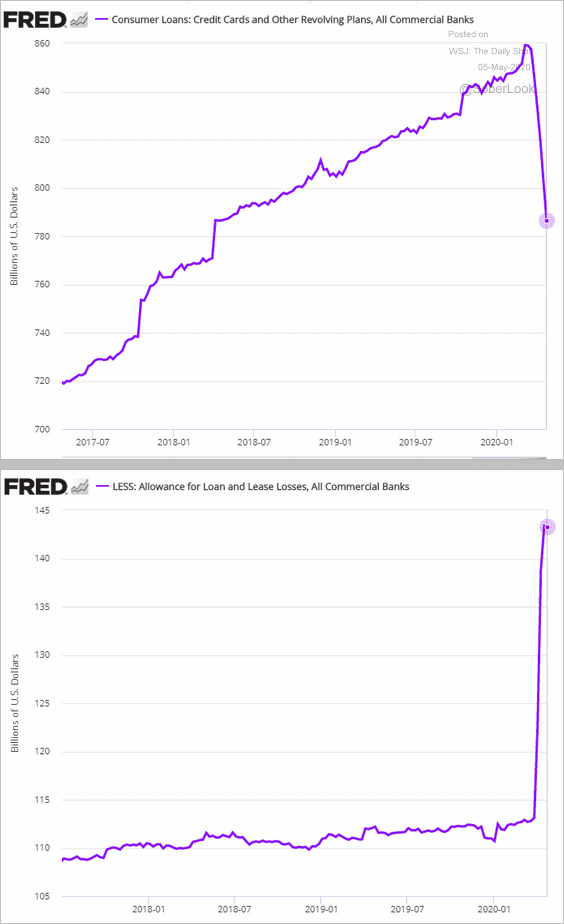
2. Banks’ holdings of credit card balances are declining. A good portion of this drop can be explained by banks taking loan loss provisions (second chart) against delinquent/risky credit card debt.
3. Consumer credit risks have yet to catch up with corporate and municipal credit risk.
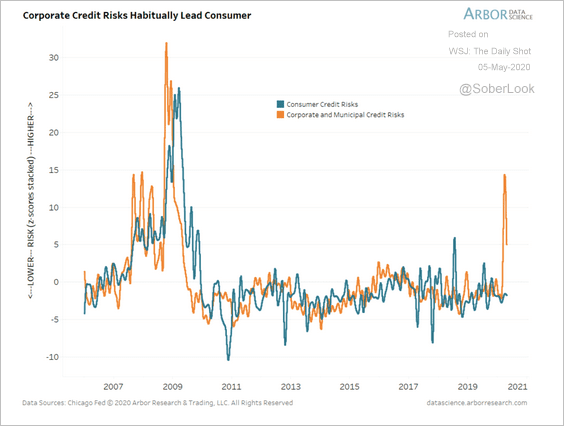 Source: Arbor Research & Trading
4. Chapter 11 filings are expected to hit record levels.
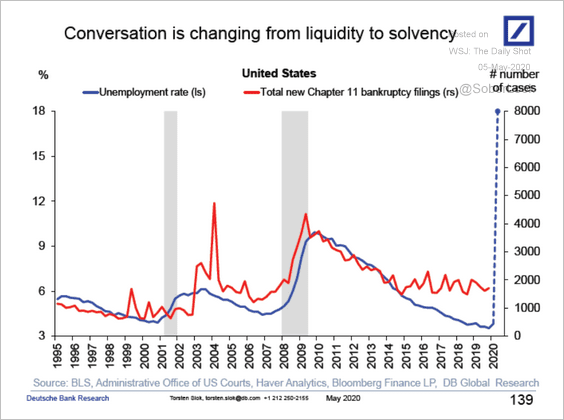 Source: Deutsche Bank Research
Equities
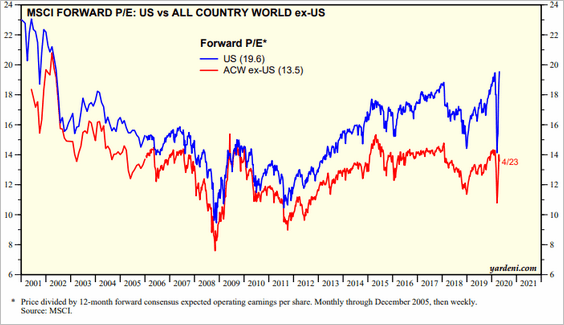
1. US shares have widened their outperformance vs. the rest of the world.
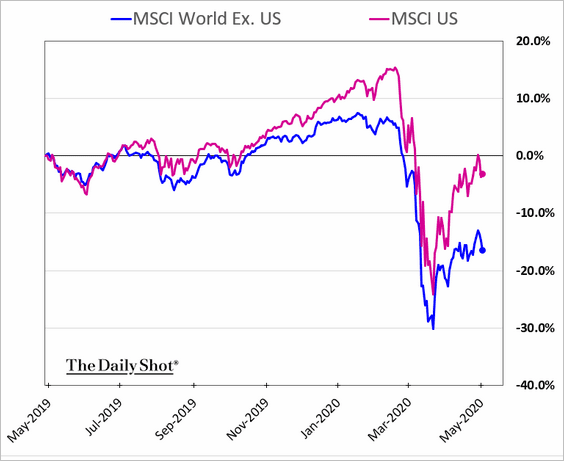
And valuations have diverged sharply as well.
——————–
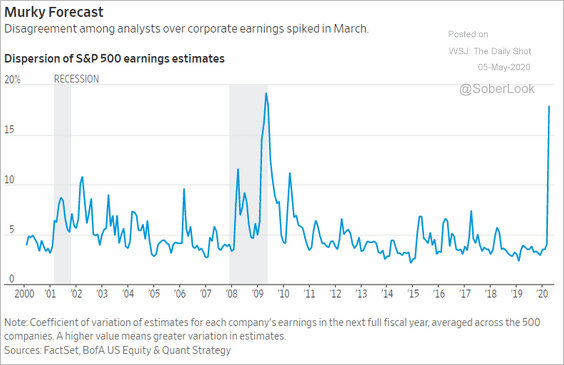
2. Analysts are having a tough time agreeing on earnings estimates, a sign of extreme uncertainty in business conditions going forward.
 Source: @WSJ Read full article
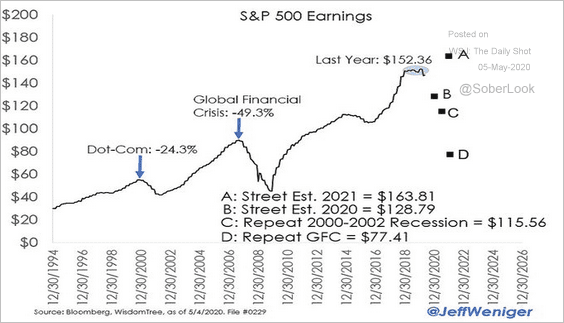
3. Below are some scenarios for the S&P 500 earnings.
 Source: @JeffWeniger
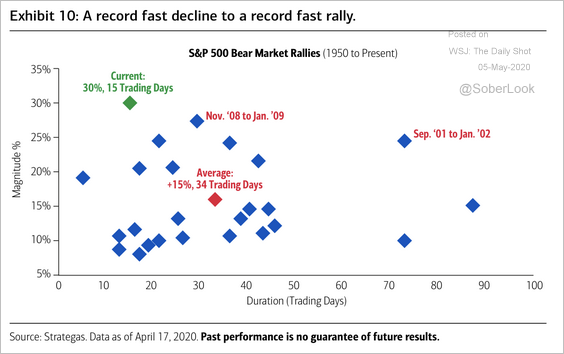
4. Here’s a closer look at the length and magnitude of previous bear market rallies.
 Source: BofA Merrill Lynch Global Research
5. Recessions tend to correct periods of “creative accounting” (more detail here).
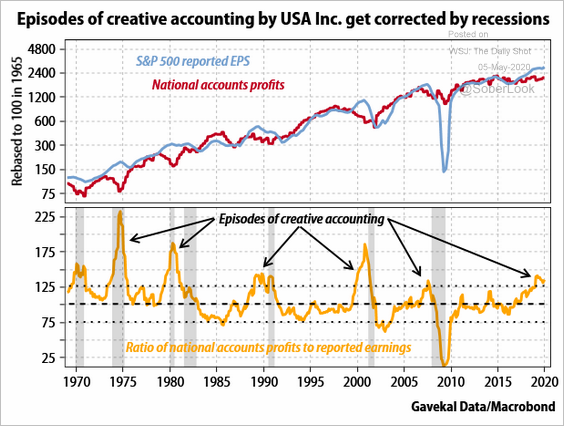 Source: Gavekal
6. The Fama-French Small-Cap Value Index marked its worst quarterly performance on record.
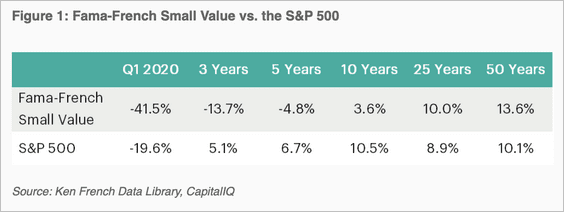 Source: Verdad Advisors Read full article
7. The Smart Money Index saw a slight drawdown compared to the S&P 500 and is back near its December highs.
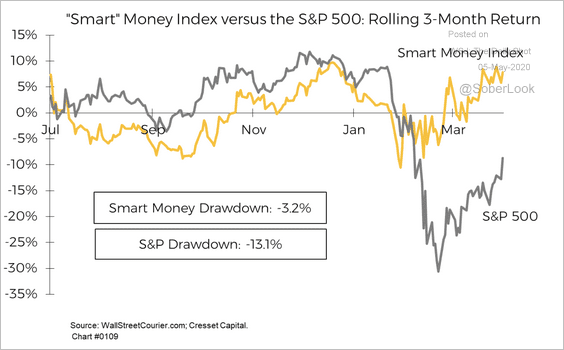 Source: Jack Ablin, Cresset Wealth Advisors
8. Retail investors have been positioned more defensively since the start of the crisis (2 charts).
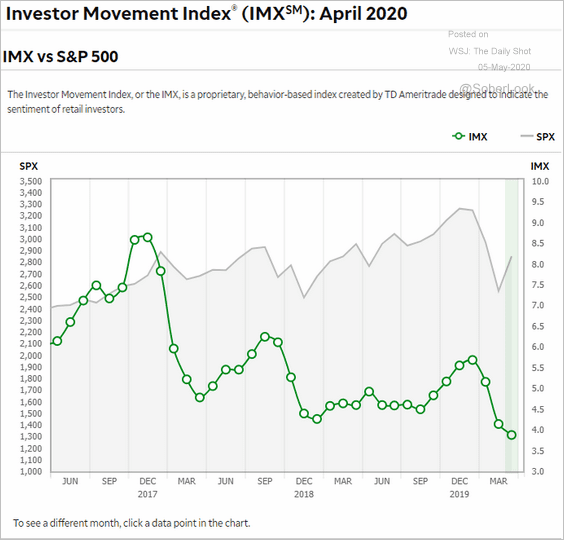 Source: TD Ameritrade
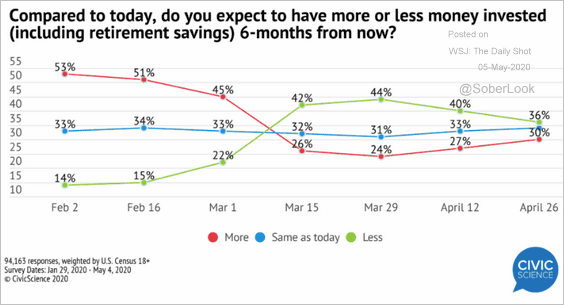 Source: @CivicScience Read full article
——————–
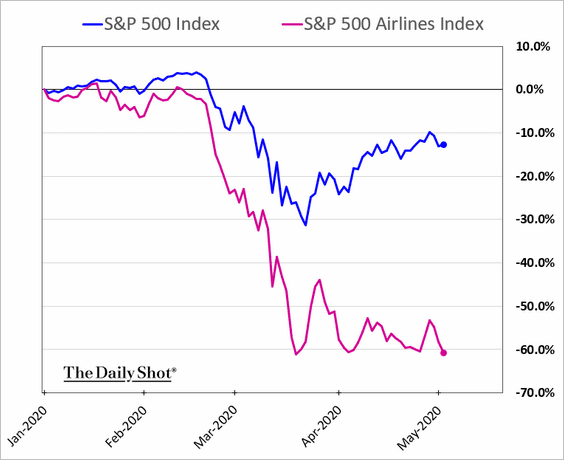
9. The underperformance of US airline shares continues to widen (see story).
Energy
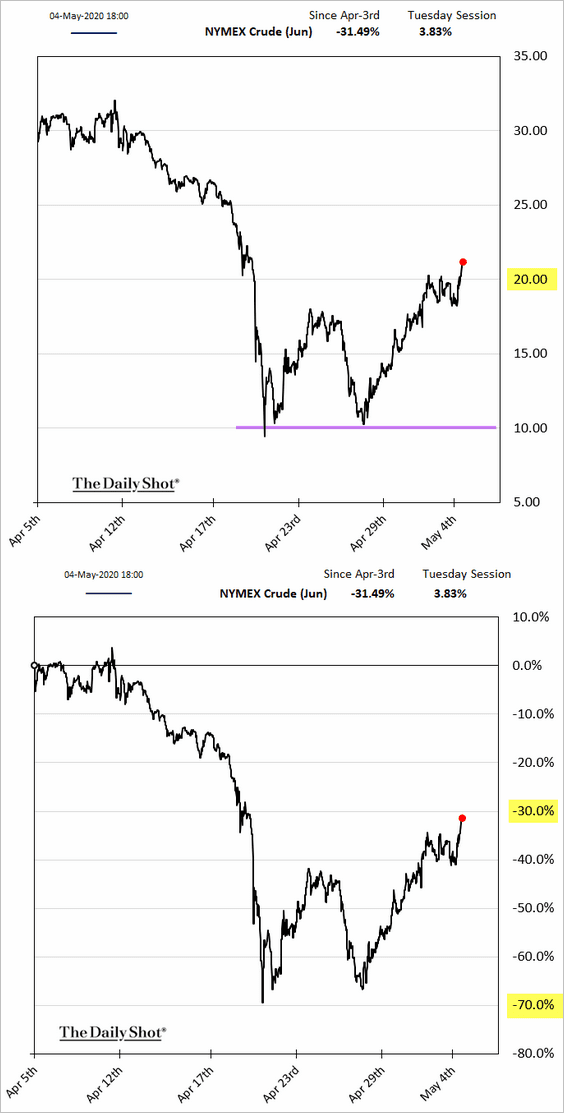
1. Crude oil is rebounding, with the June NYMEX contract climbing above $20/bbl. The second chart below shows percent changes over the past month.
The Fed’s massive injections of liquidity should provide some support for crude oil.
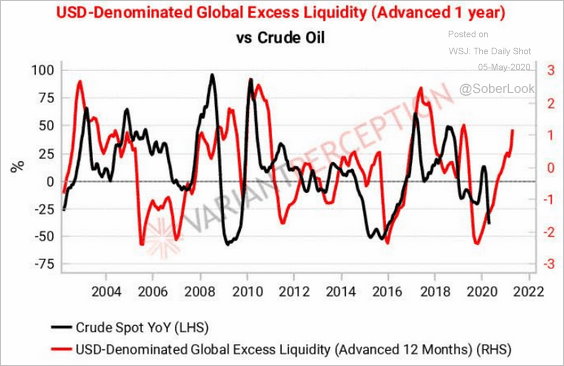 Source: @VrntPerception
——————–
2. The Saudi – Russia price war was costly as OPEC’s production surged (just as demand collapsed).
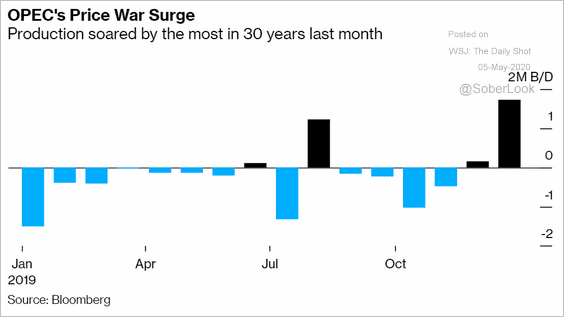 Source: @markets Read full article
But production cuts should begin to take effect, and demand is expected to recover.
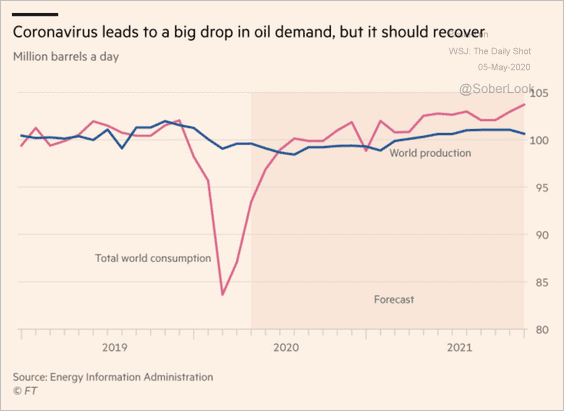 Source: @financialtimes Read full article
Moreover, energy CapEx in the US has collapsed, which should curtail supply.
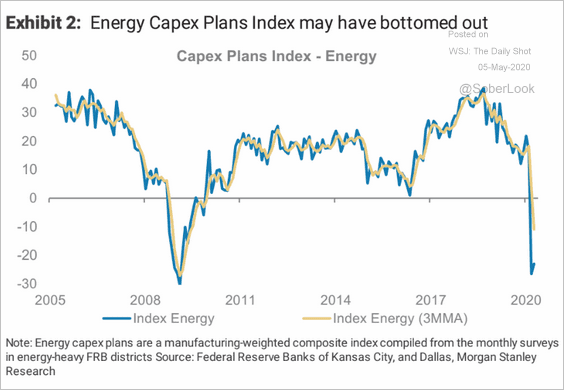 Source: Morgan Stanley Research
——————–
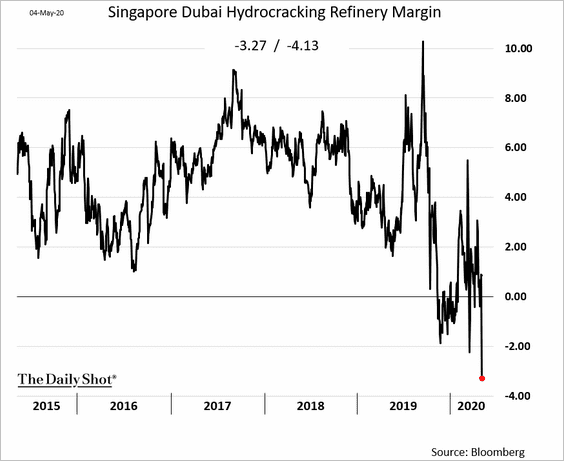
3. Refining margins are negative not just in Europe …
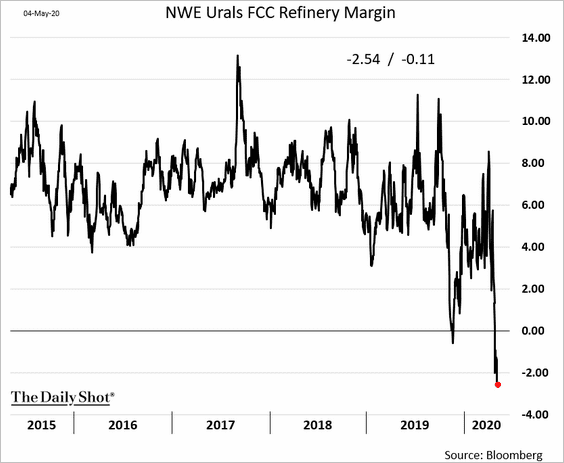
… but now in Asia as well.
——————–
4. Here are the largest oil importers in Asia.
 Source: @WSJ Read full article
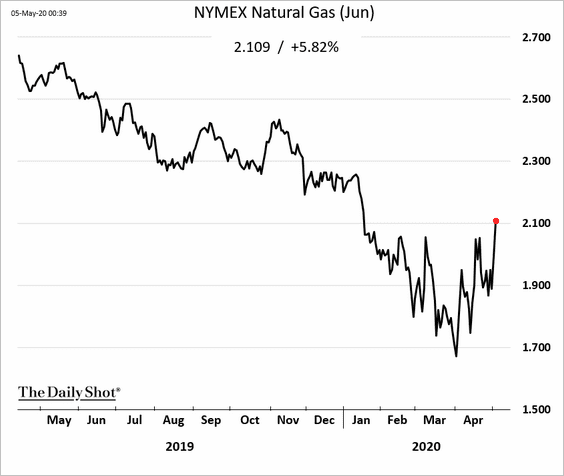
5. US natural gas futures climbed above $2.1/mmbtu on expectations of slowing output.
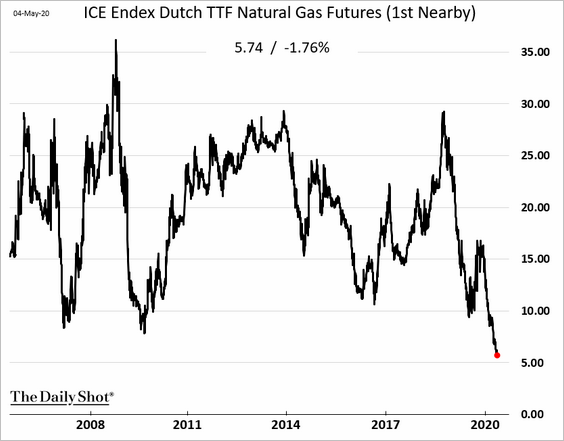
On the other hand, European natural gas prices are hitting multi-decade lows.
Commodities
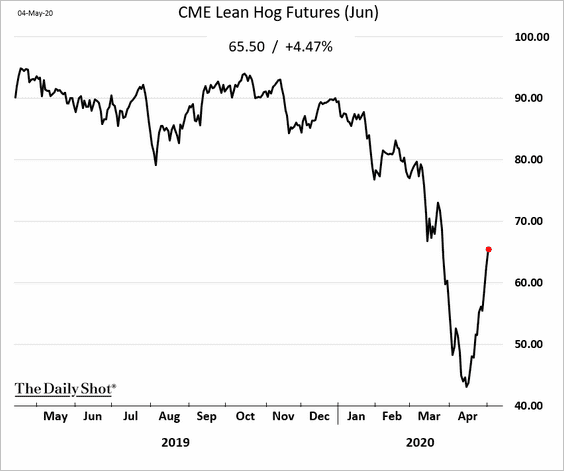
1. Chicago lean hog futures continue to rebound (up by over 50% since the lows in mid-April).
2. Precious metals mining shares had a good month.
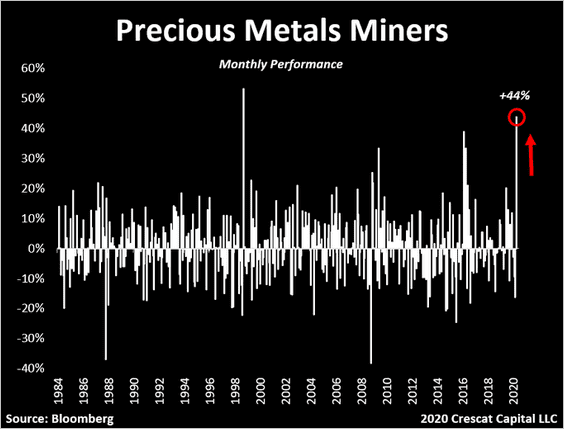 Source: @TaviCosta
Global Developments
1. Let’s start with this illustration of global containment measures.
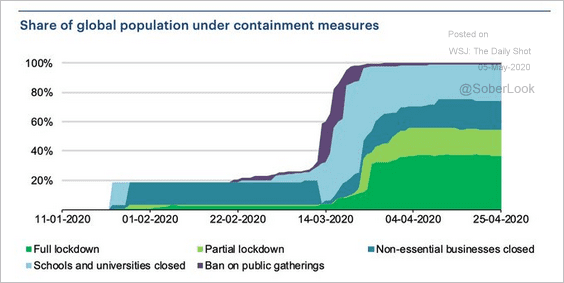 Source: @adam_tooze, @IEA Read full article
2. Lockdowns are correlated with economic performance (2 charts).
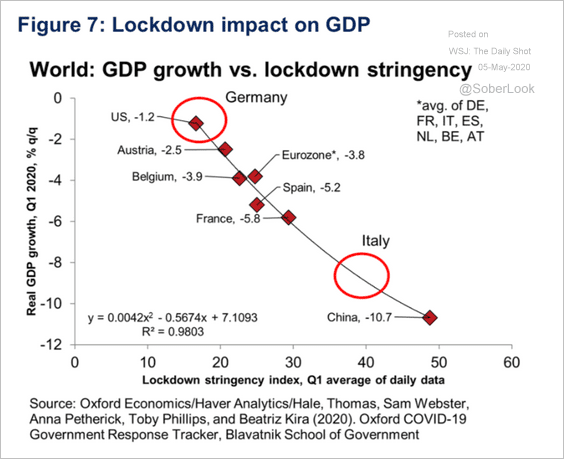 Source: Oxford Economics
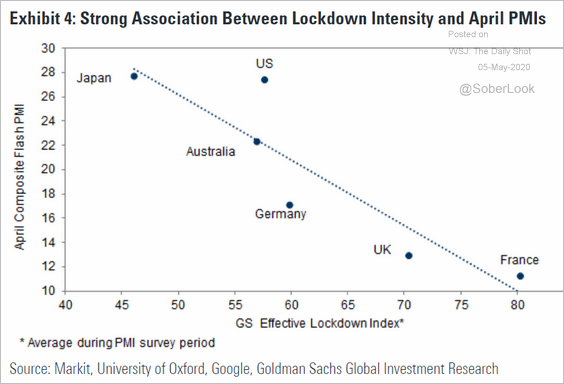 Source: Goldman Sachs
——————–
3. Next, we have LinkedIn-based hiring trends.
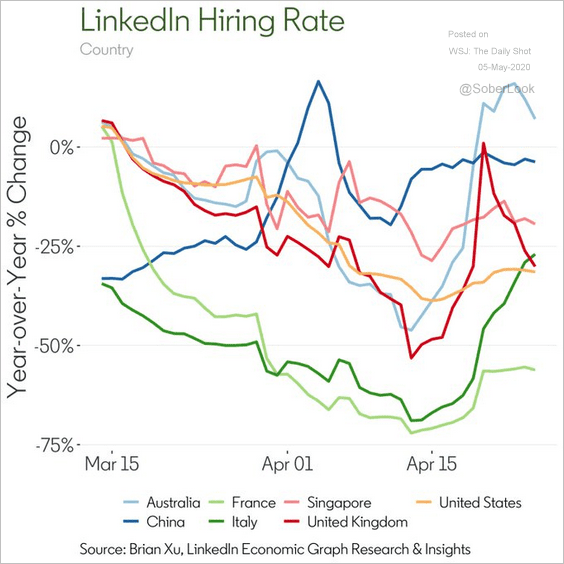 Source: @LinkedInEcon
4. Below are the ratios of consumption tax to GDP by country.
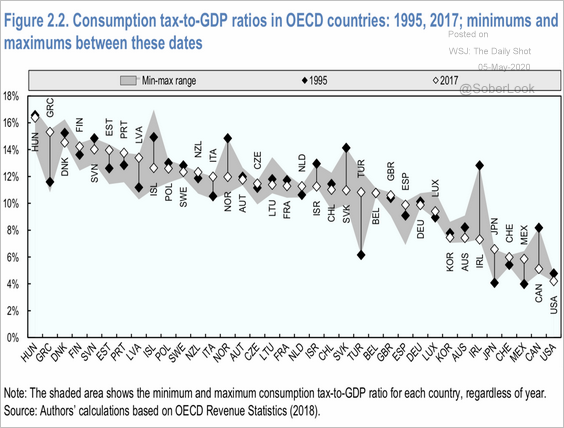 Source: OECD Read full article
5. This chart shows debt service relative to cash buffers across countries and sectors.
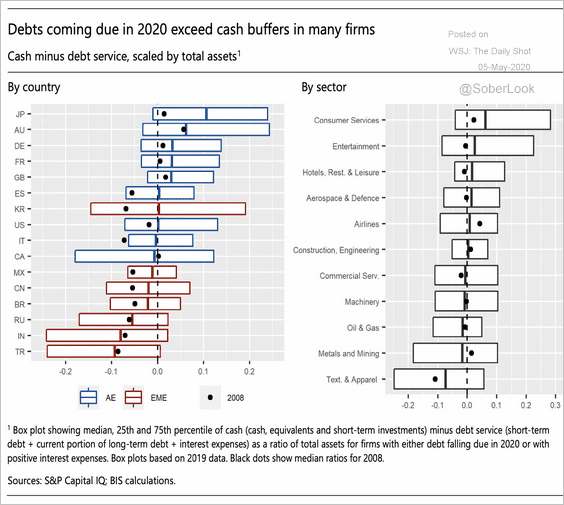 Source: BIS Read full article
——————–
Food for Thought
1. Foreign-born vs. US-born population pyramids:
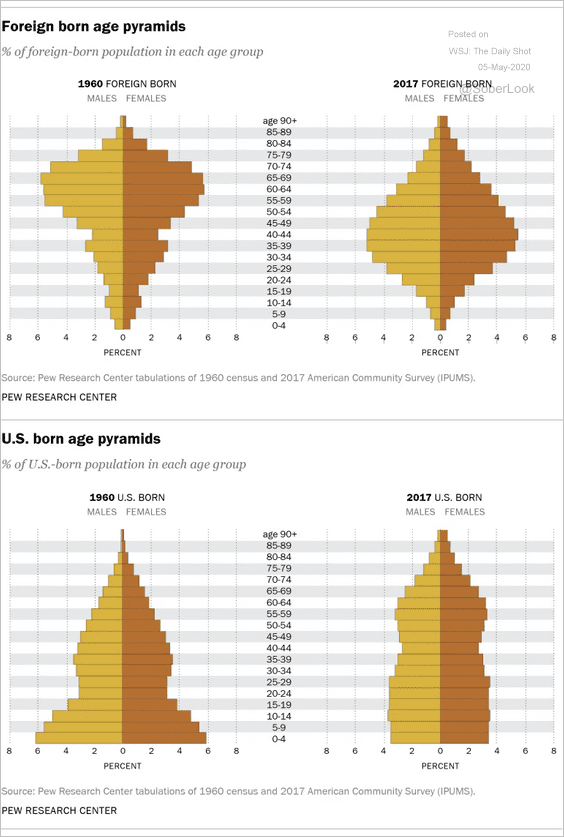 Source: Pew Research Center Read full article
2. Origins of the foreign-born population in the US:
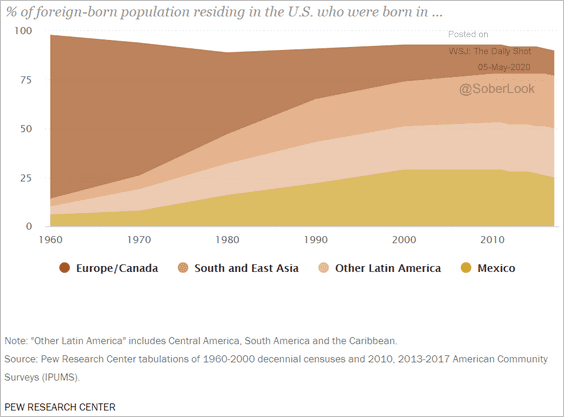 Source: Pew Research Center Read full article
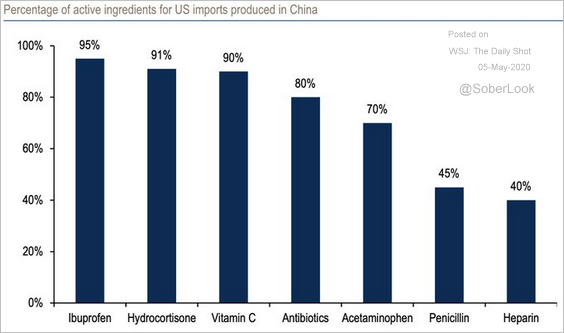
3. Medical supplies and medications imported from China (2 charts):
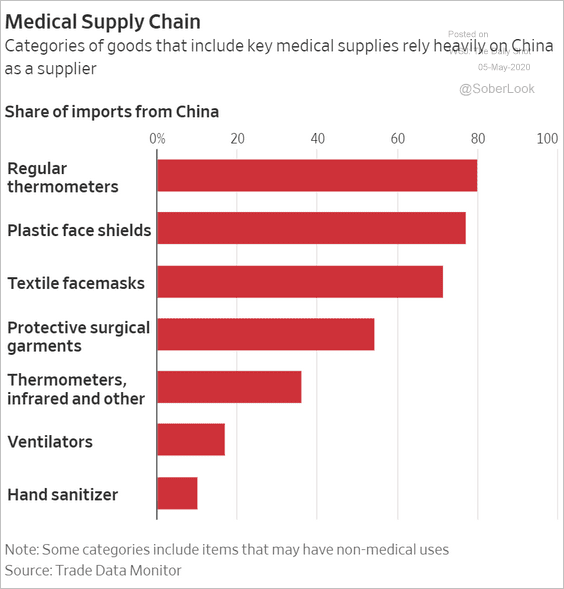 Source: @WSJ Read full article
 Source: BofA Merrill Lynch Global Research, @RobinWigg
——————–
4. Top causes of death in Africa:
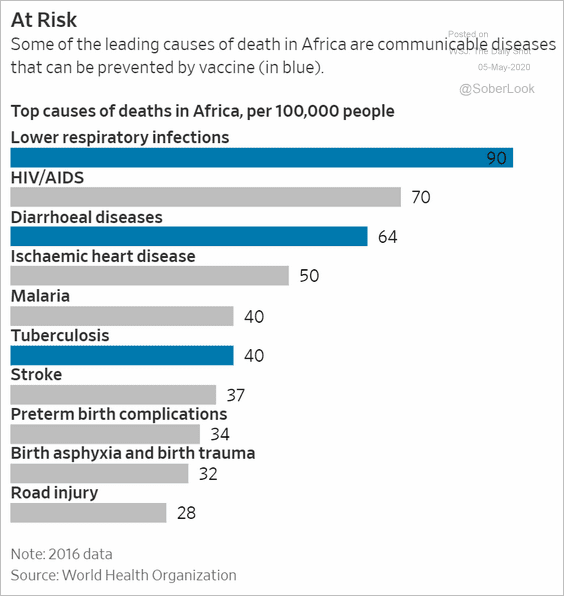 Source: @WSJ Read full article
5. Success rates in vaccine developments:
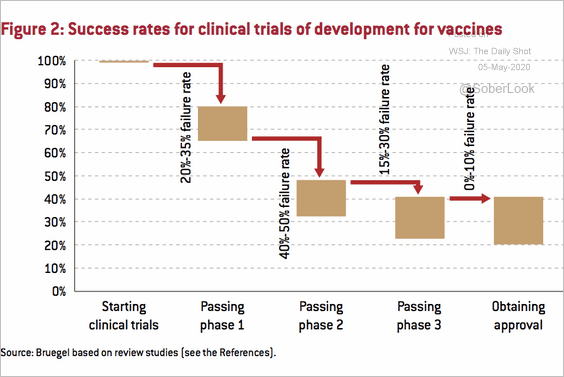 Source: Bruegel Read full article
6. The social distancing index:
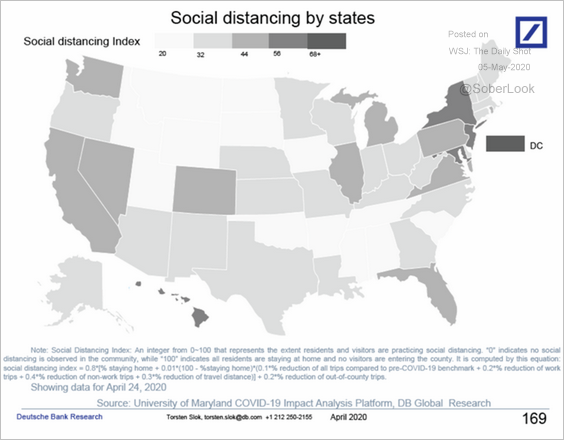 Source: Deutsche Bank Research
7. Ineffective face masks:
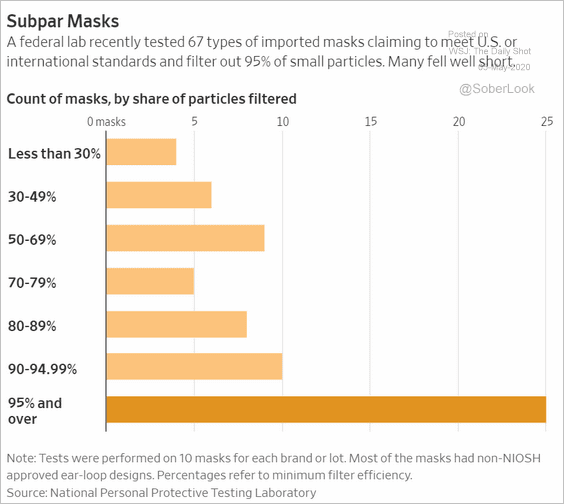 Source: @WSJ Read full article
——————–
8. Financial assets by income group:
 Source: @WSJ Read full article
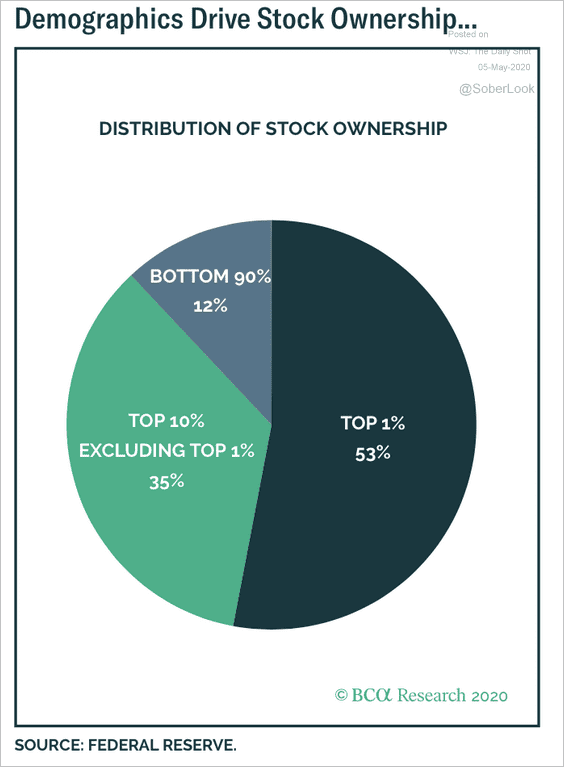 Source: BCA Research
——————–
9. Mother’s Day gifts:
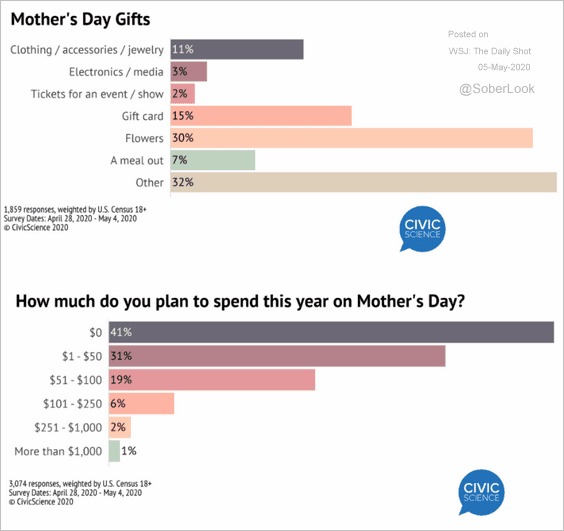 Source: @CivicScience Read full article
——————–