
The Daily Shot: 14-May-20
• The United States
• The United Kingdom
• The Eurozone
• Japan
• Asia – Pacific
• China
• Emerging Markets
• Commodities
• Energy
• Equities
• Credit
• Rates
• Global Developments
• Food for Thought
The United States
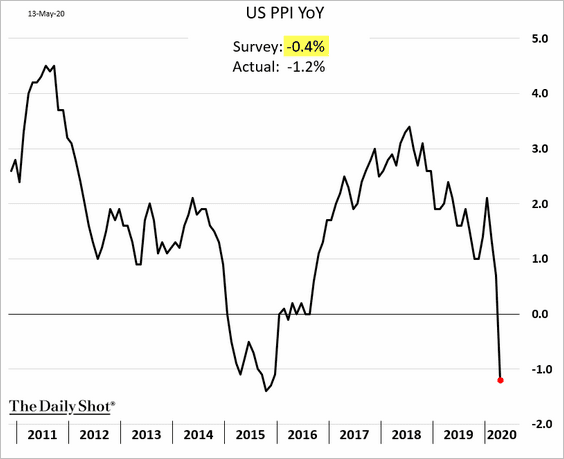
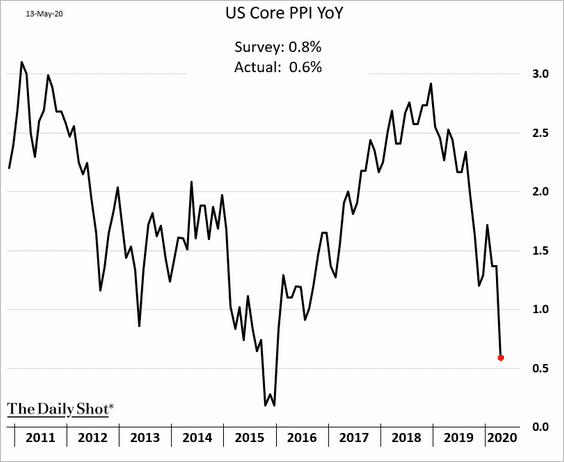
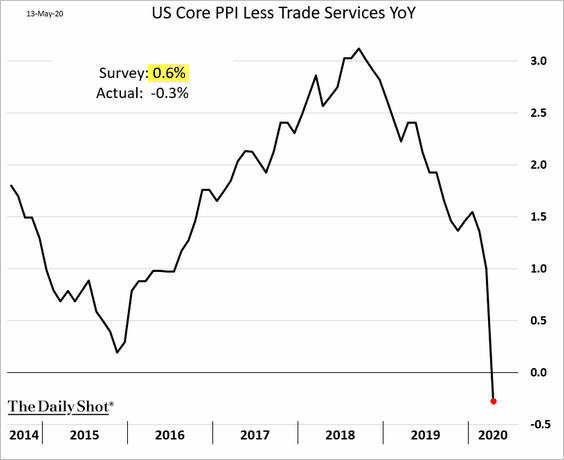
1. Just as we saw with the CPI report, disinflation is showing up in producer prices.
• The headline PPI (well below forecasts):
• The core PPI:
• The core PPI excluding trade services (which tend to be volatile):
——————–
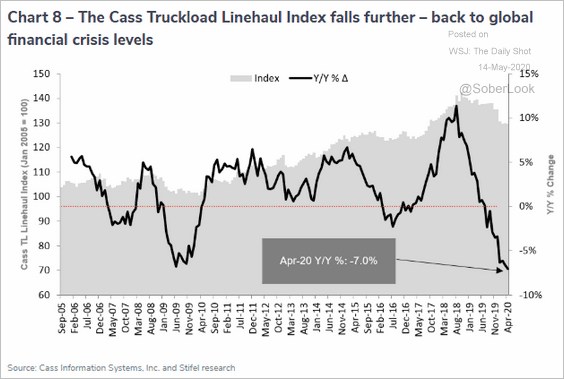
2. Freight activity continued to deteriorate last month, with both shipments and expenditures declining.
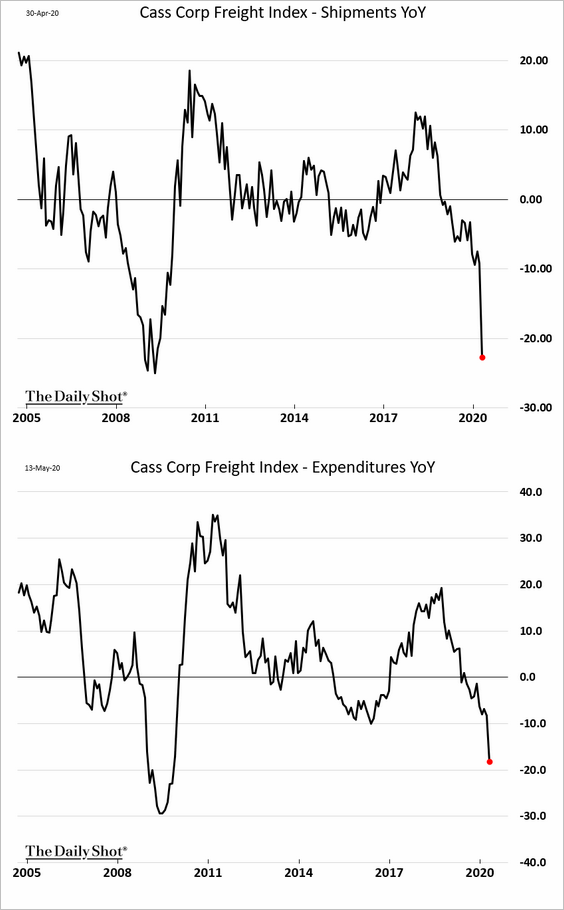
Here is the Cass Truckload Linehaul Index.
 Source: Cass Information Systems
Freight weakness was visible in the PPI report. The charts show price changes for semi-trailers and truck transportation of freight.
![]()
——————–
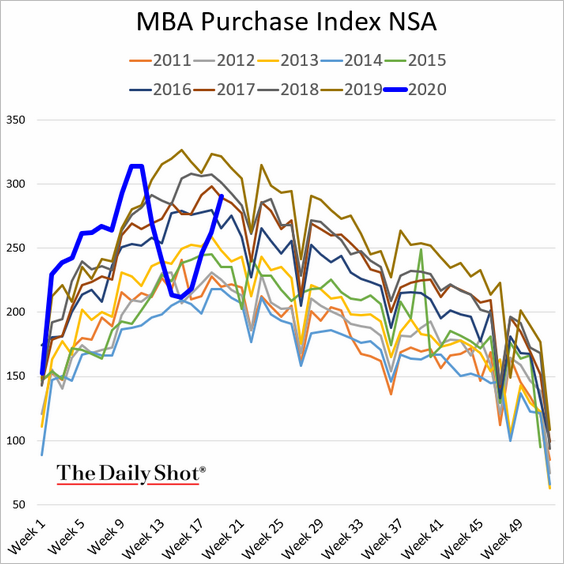
3. Mortgage applications to purchase a home continue to rebound. The market has been remarkably resilient as buyers take advantage of low mortgage rates.
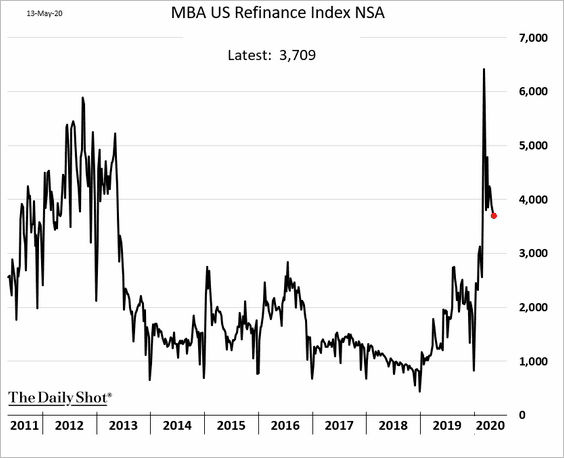
Refi activity has slowed but remains elevated.
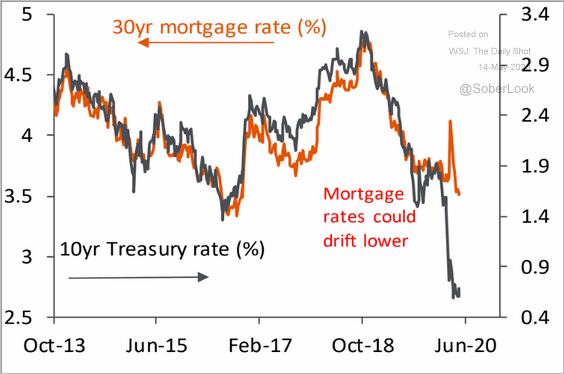
Will mortgage rates move even lower?
 Source: Piper Sandler
——————–
4. Here are a couple of updates on the Paycheck Protection Program for small businesses (PPP).
• The program’s progress:
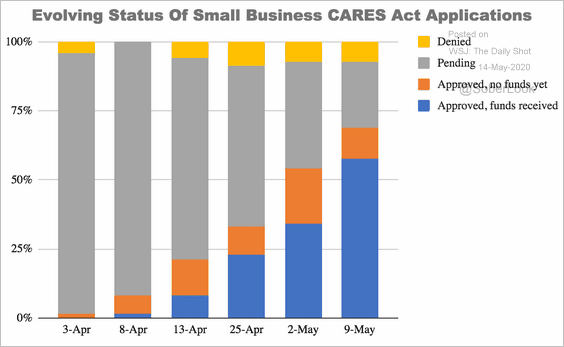 Source: Alignable.com
• PPP loans by state:
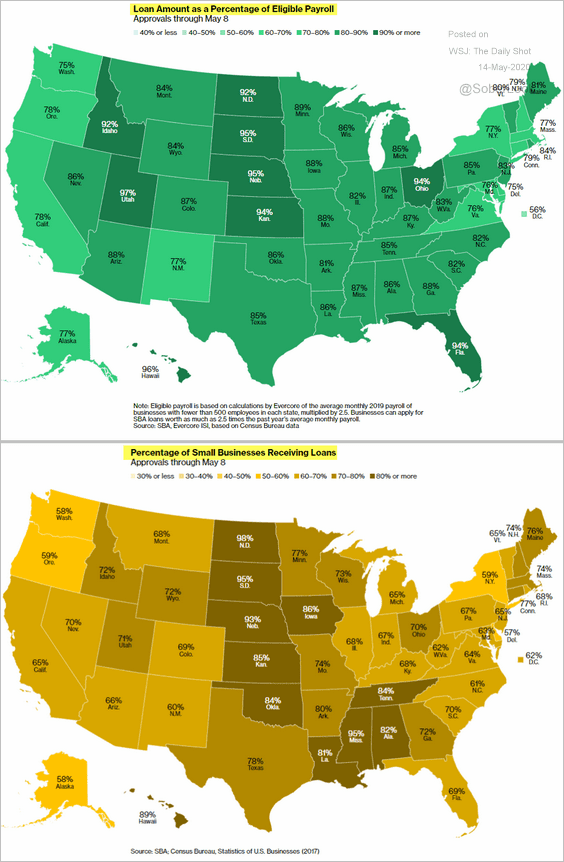 Source: @bbgvisualdata Read full article
——————–
5. Consumer sentiment has bottomed, but the rebound is stalling.
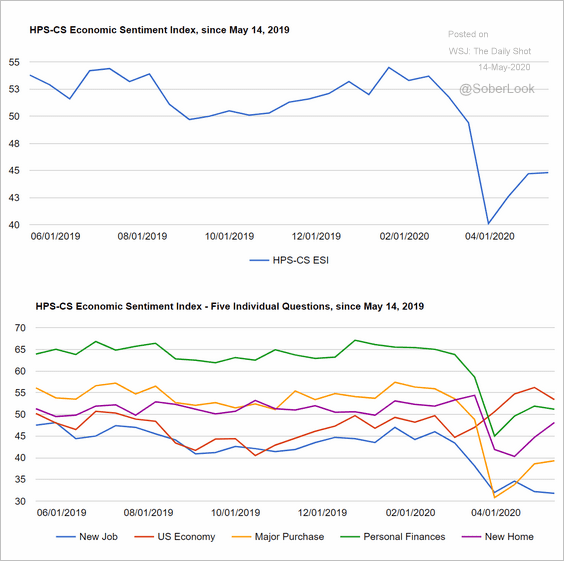 Source: @HPSInsight, @CivicScience
Here is Gallup’s Life Evaluations index.
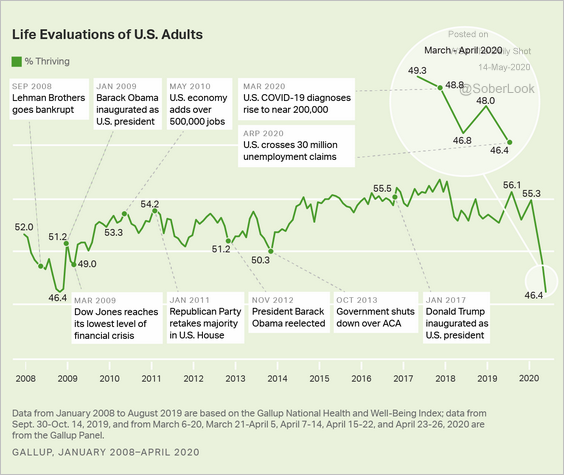 Source: Gallup Read full article
——————–
6. Public pensions’ portfolios took a hit in the first quarter.
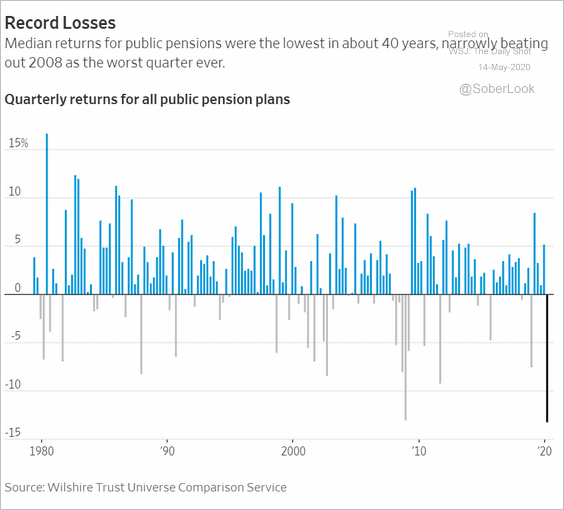 Source: @WSJ Read full article
7. About 50% of Americans have withdrawn money from their retirement accounts or plan to do so. The second chart shows the reasons for withdrawals, and the third one provides the breakdown by usage and generation.
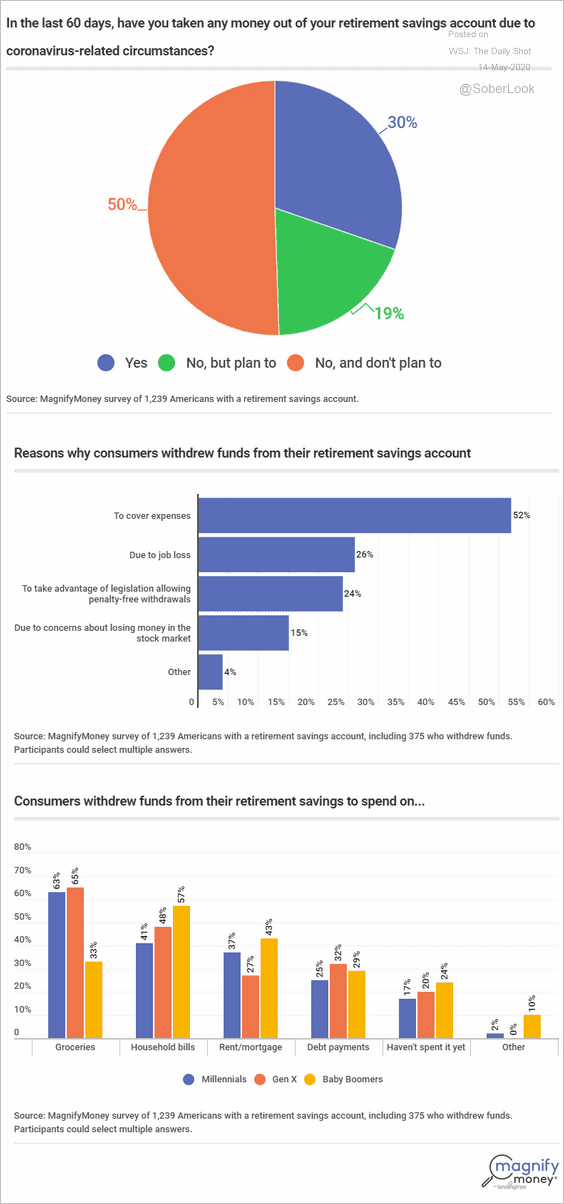 Source: MagnifyMoney Read full article
8. Many Americans have been hoping to see a quick rebound in the economy after “reopening.” That’s not going to happen.
 Source: @axios Read full article
The shape of the recovery will be much more of a “swoosh” rather than a “V.”
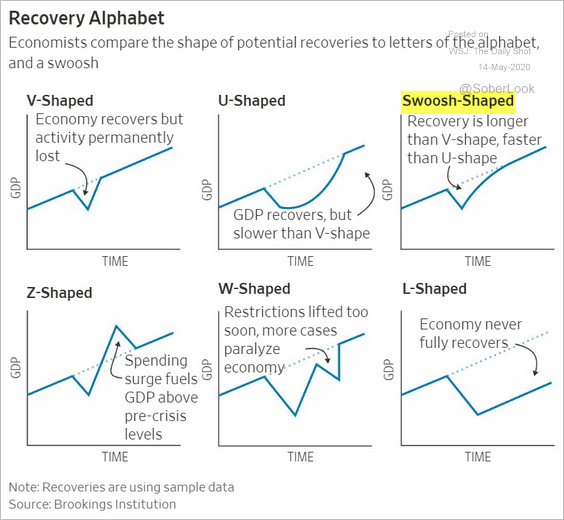 Source: @WSJ Read full article
And it’s going to be an extended swoosh. Here is a forecast from Pantheon Macroeconomics.
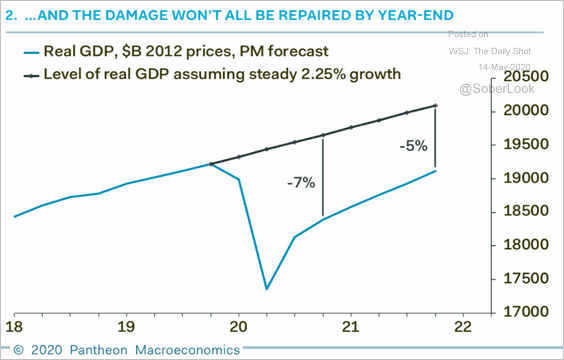 Source: Pantheon Macroeconomics
While the stock market expects a quick rebound, economic data tell us otherwise.
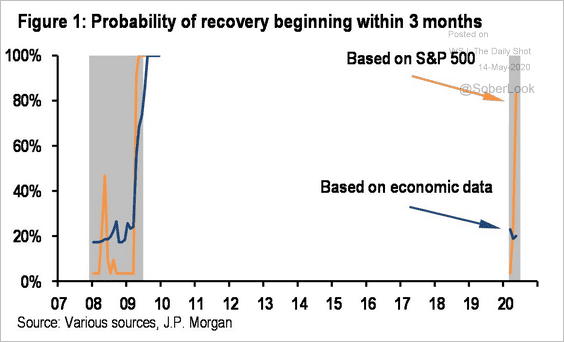 Source: JP Morgan, @carlquintanilla
——————–
9. The COVID-19 map is looking much better.
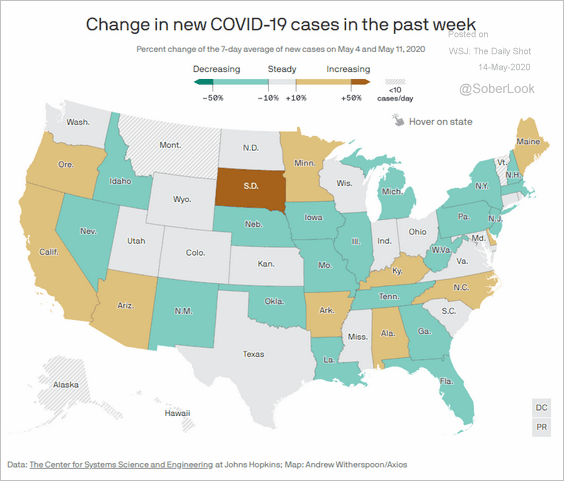 Source: @axios Read full article
More Americans are on the road.
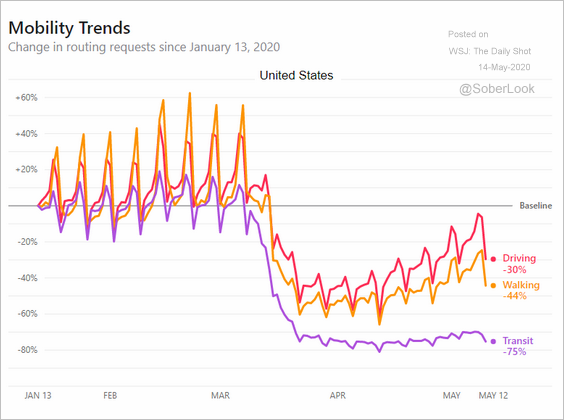 Source: Apple
The United Kingdom
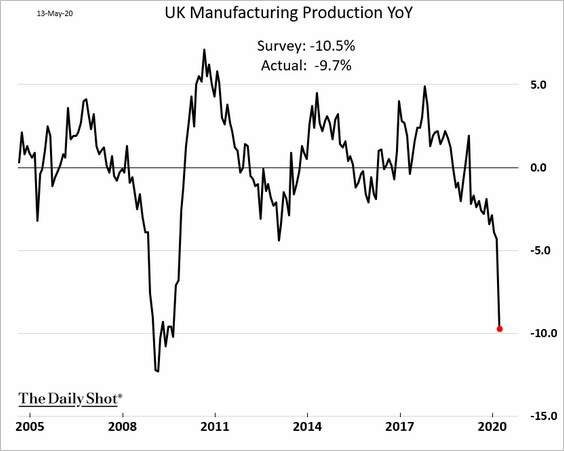
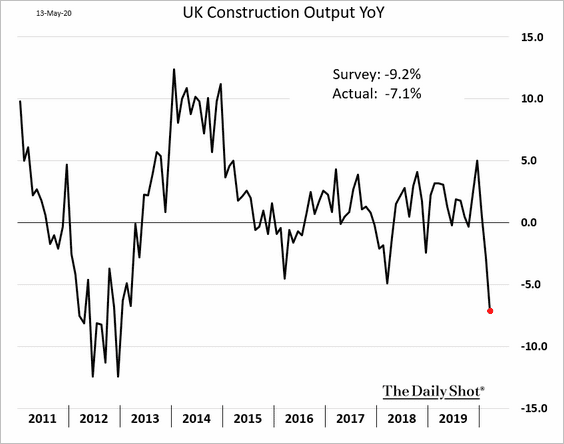
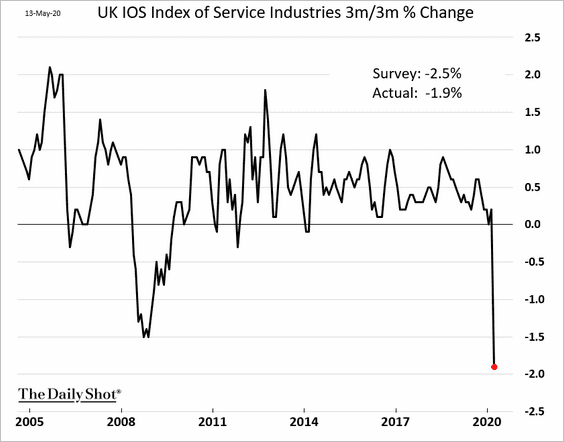
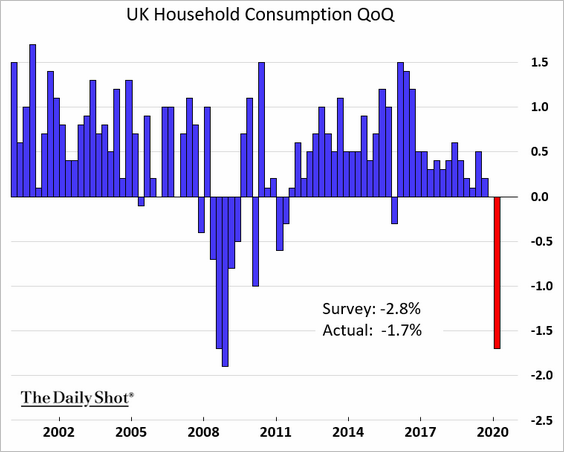
1. March economic data showed severe deterioration, but the results were a bit better than the forecasts.
• Manufacturing output:
• Construction output:
• Services:
• Household consumption:
——————–
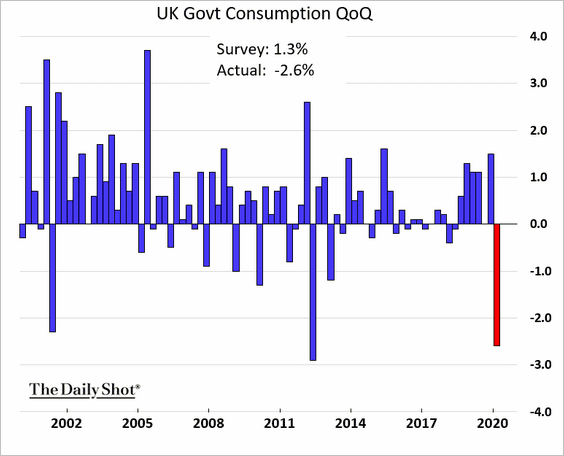
2. The GDP contracted by 2% in the first quarter.
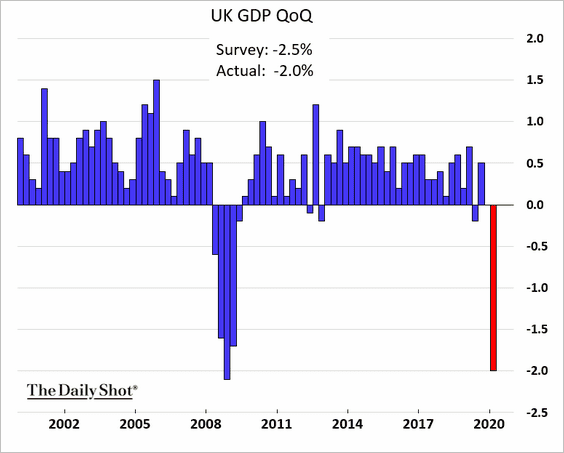
Government spending was surprisingly weak.
The GDP will probably get revised lower as we saw in 2008.
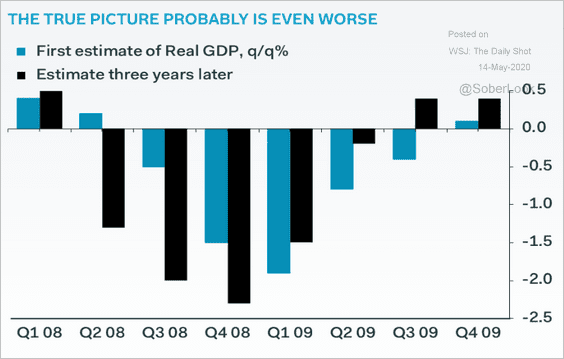 Source: Pantheon Macroeconomics
——————–
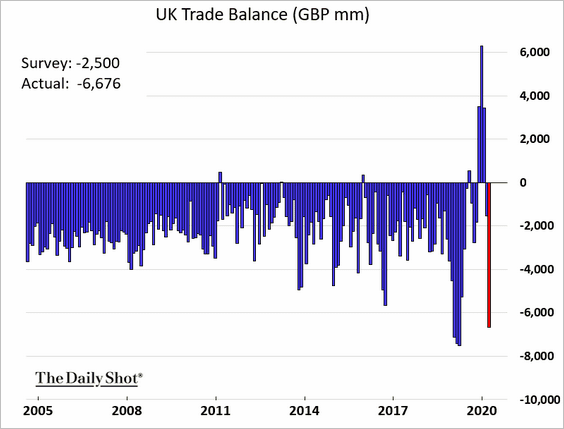
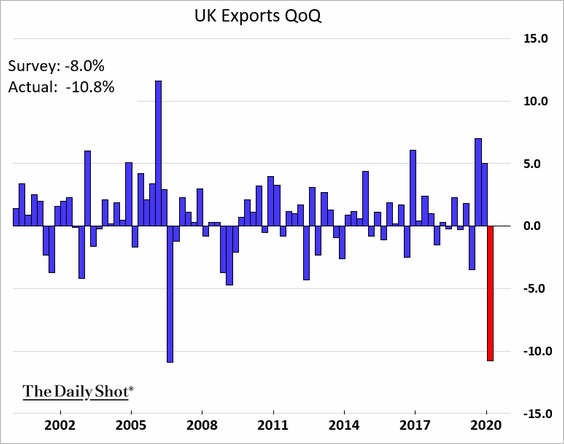
3. The UK trade balance shifted into deficit again as exports tumbled. Last year’s trade figures were distorted by Brexit-related activity.
——————–
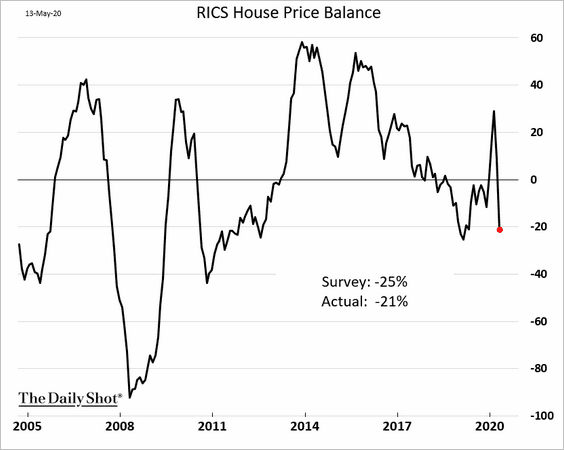
4. The RICS housing index dipped into negative territory.
 Source: The New York Times Read full article
——————–
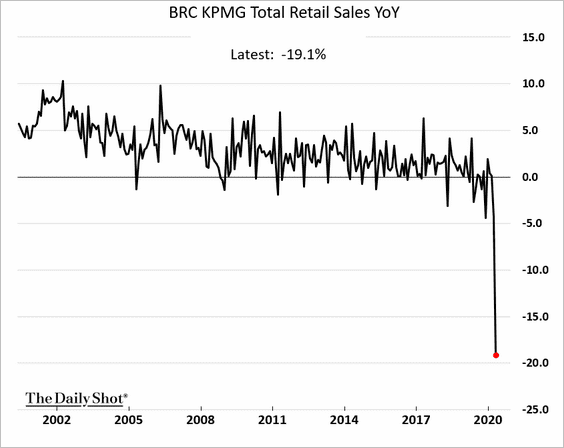
5. The BRC retail sales index plunged in April.
 Source: Reuters Read full article
——————–
6. According to Apple, the UK’s mobility trends (driving, walking, public transport) are now worse than Italy’s.
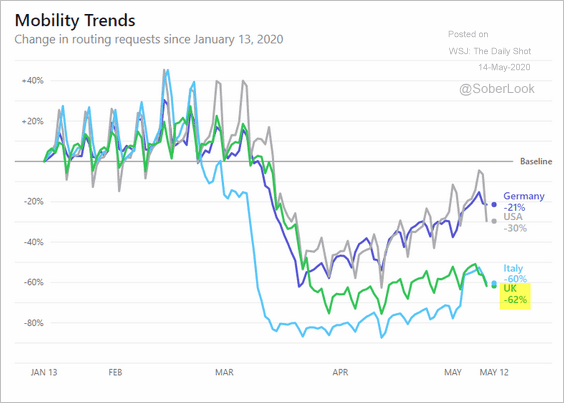 Source: Apple
7. Men working in low-skilled or care, leisure, and other service occupations had the highest rates of COVID-19-related fatalities.
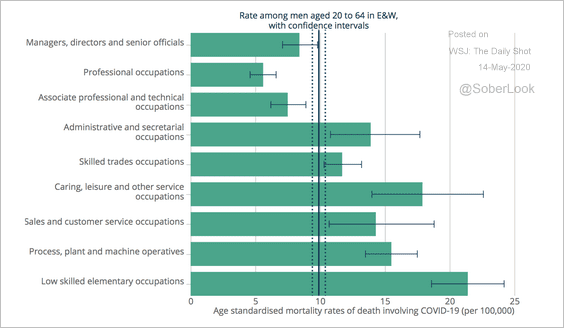 Source: Office for National Statistics Read full article
The Eurozone
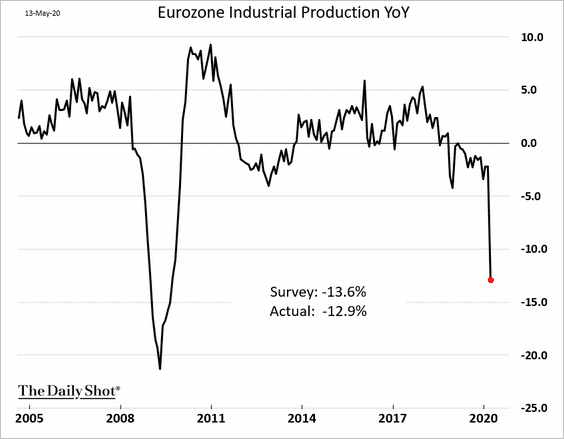
1. Industrial production plummetted in March.
The Eurozone’s industrial output has been underperforming the rest of the EU.
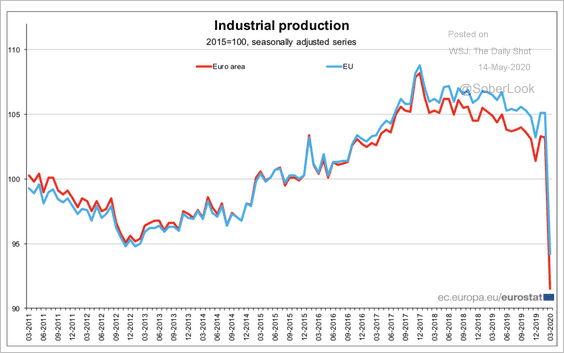 Source: Eurostat Read full article
——————–
2. German economic activity has held up better than in the rest of the Eurozone.
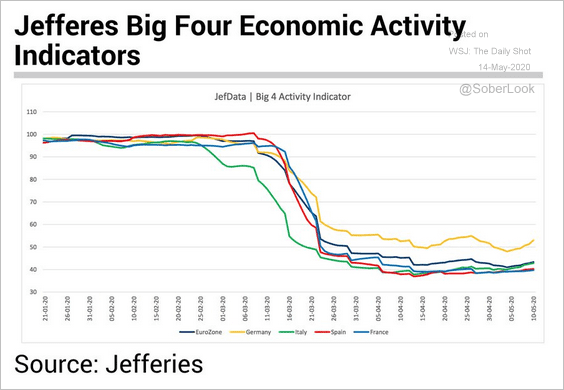 Source: Jefferies, @Schuldensuehner
3. This chart shows Germany’s online transactions vs. 2019.
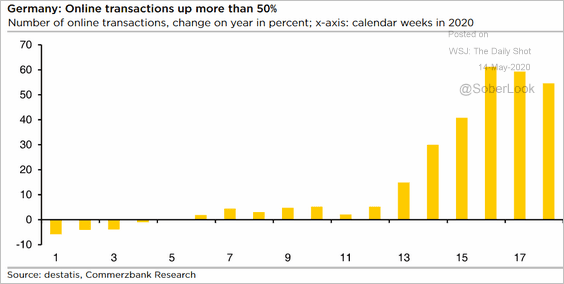 Source: Commerzbank Research
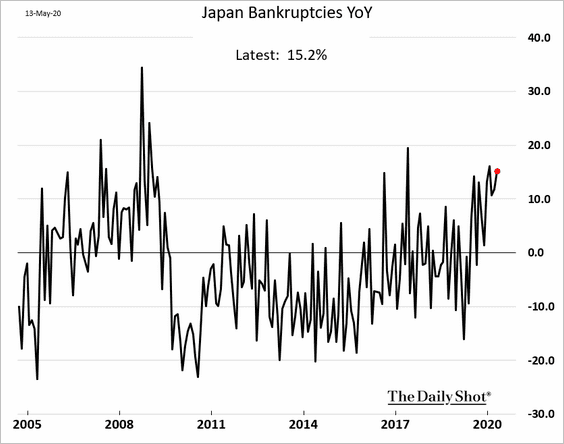
Japan
1. Bankruptcies are rising.
2. Will an economic recovery in China boost Japanese corporate profits?
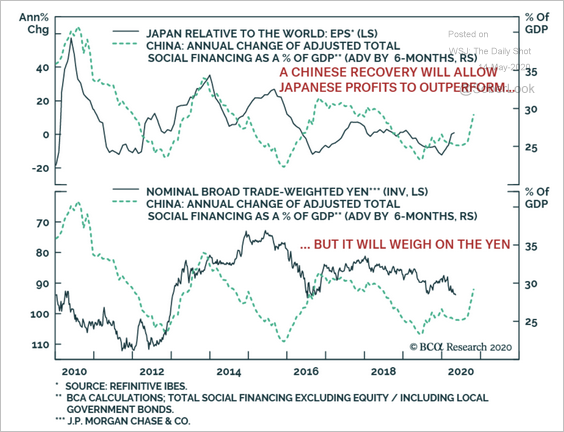 Source: BCA Research
3. Japanese feel that government support for businesses during the crisis is lacking relative to other countries (according to a survey by Kekst CNC).
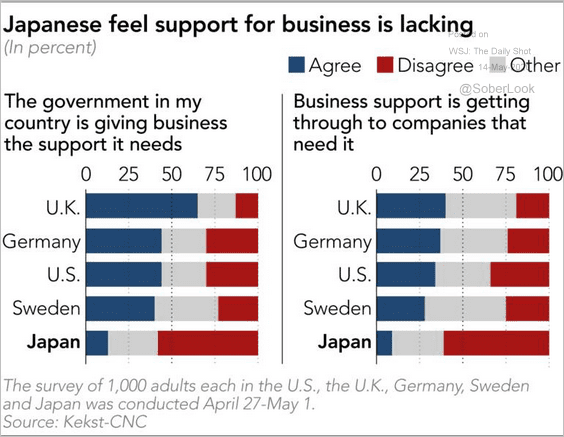 Source: Nikkei Asian Review Read full article
Asia – Pacific
1. South Korea’s unemployment claims are rising.
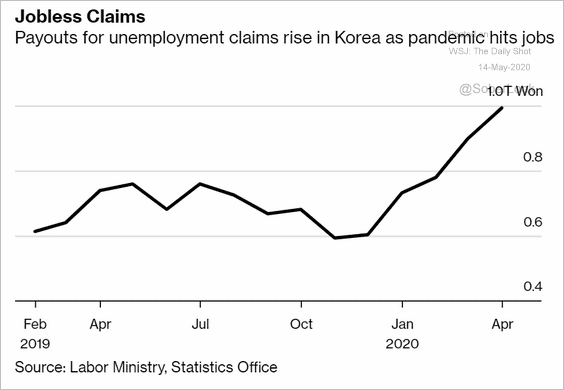 Source: @markets Read full article
2. According to Nomura, Asia’s exports will deteriorate further.
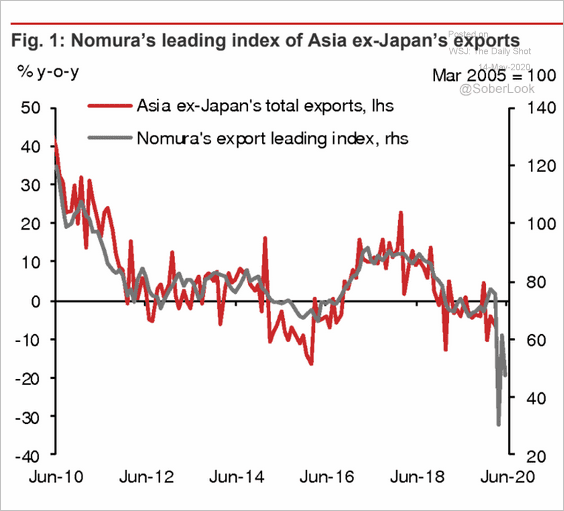 Source: Nomura Securities
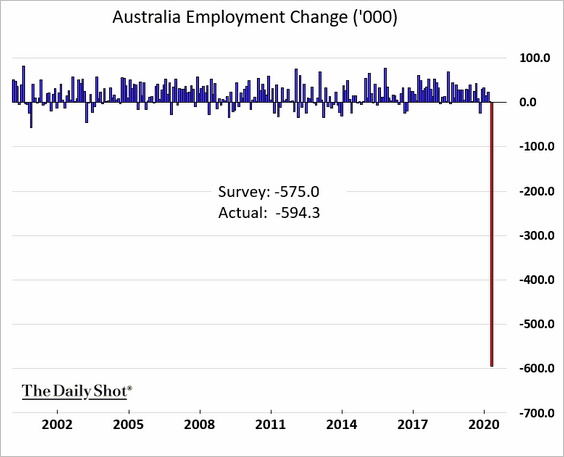
3. Australia lost almost 600 thousand jobs last month, a record.
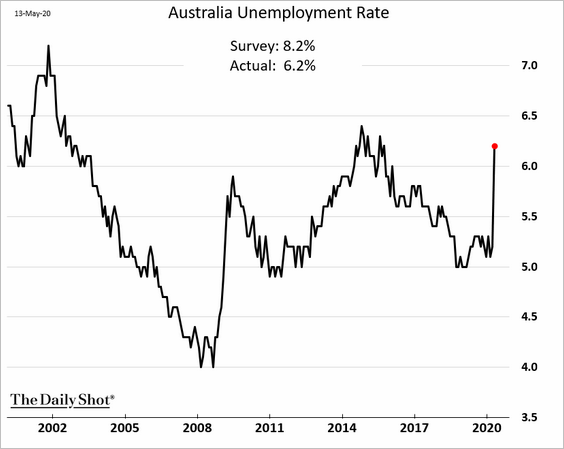
The unemployment rate rose less than expected (similar to the US).
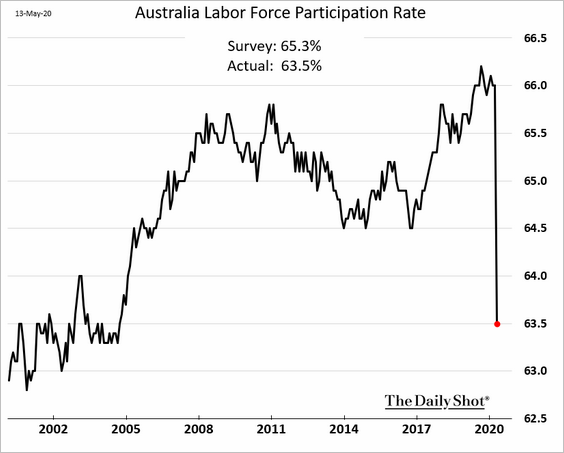
But many workers left the labor force. The participation rate plunged.
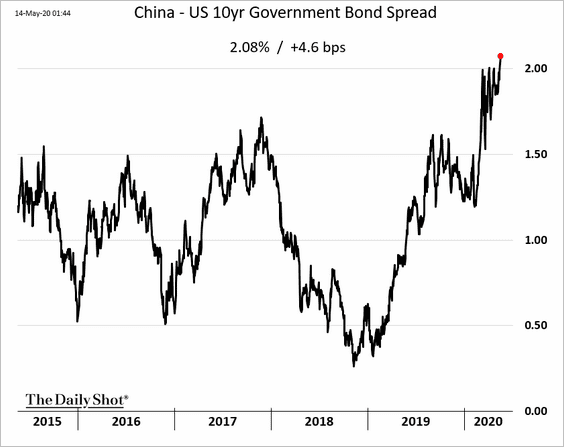
China
1. The 10yr bond yield keeps climbing, with the China-US spread hitting a multi-year high.
2. Domestic and international air travel trends continue to diverge.
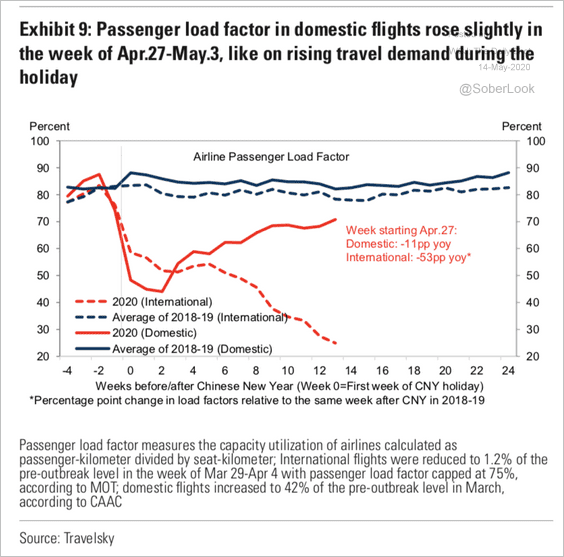 Source: Goldman Sachs
3. Substantial US-China tariffs remain in place.
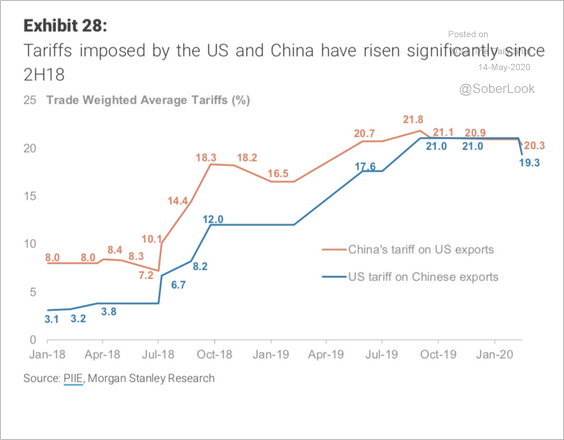 Source: Morgan Stanley Research
4. Foreign direct investment in the US tumbled from the 2016 peak.
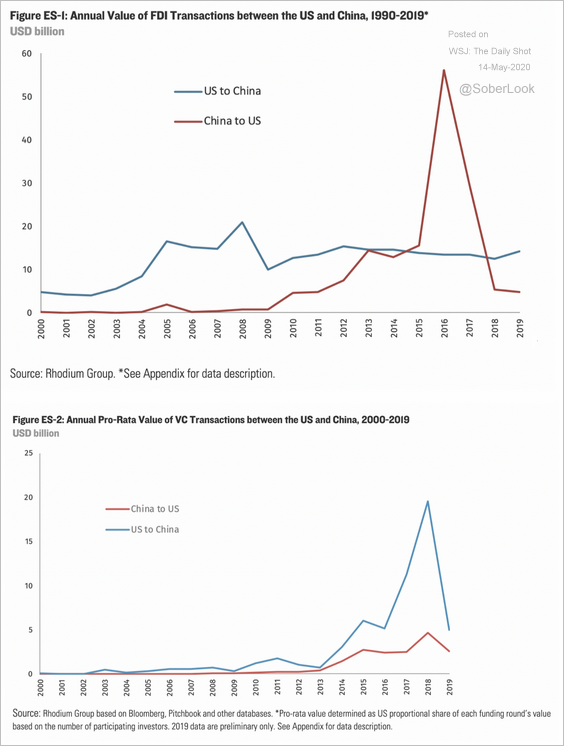 Source: Rhodium Group Read full article
Cross-border VC transactions slowed as well.
Source: Rhodium Group Read full article
——————–
5. The US and China increasingly view each other negatively.
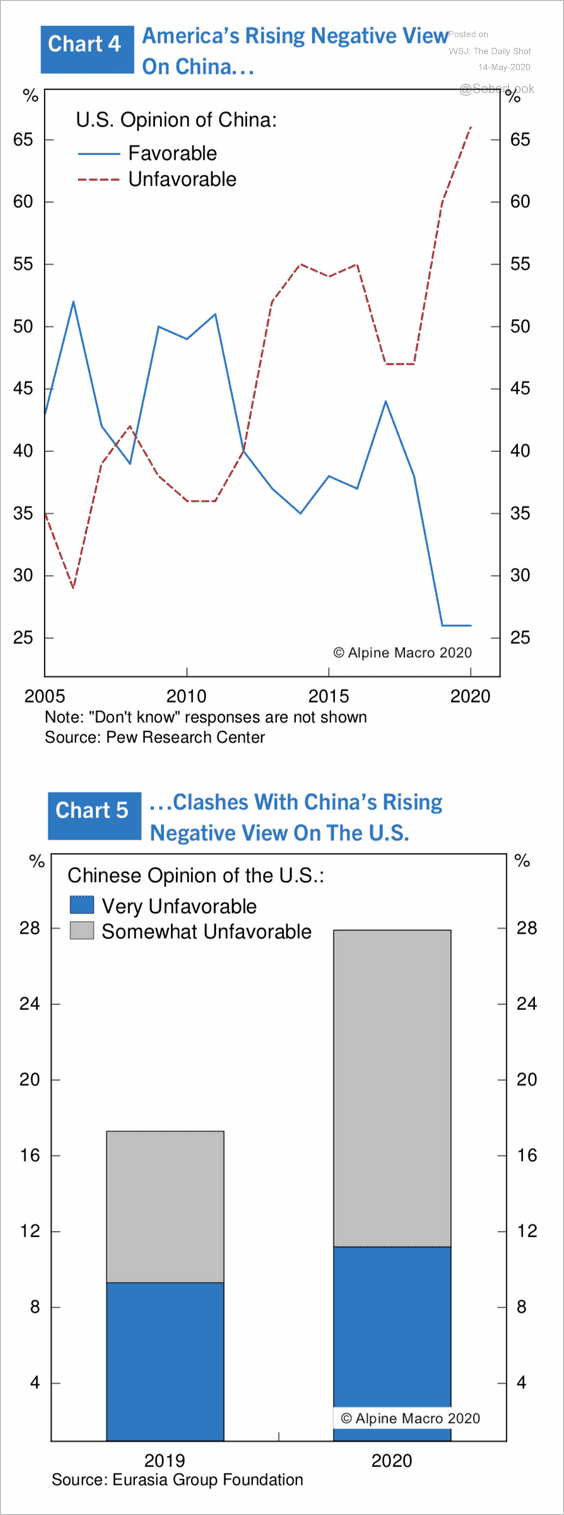 Source: Alpine Macro
Emerging Markets
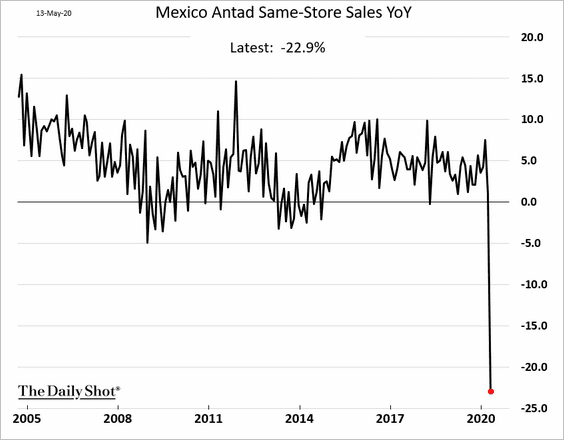
1. Mexico’s economic conditions have deteriorated sharply.
• Formal job creation:
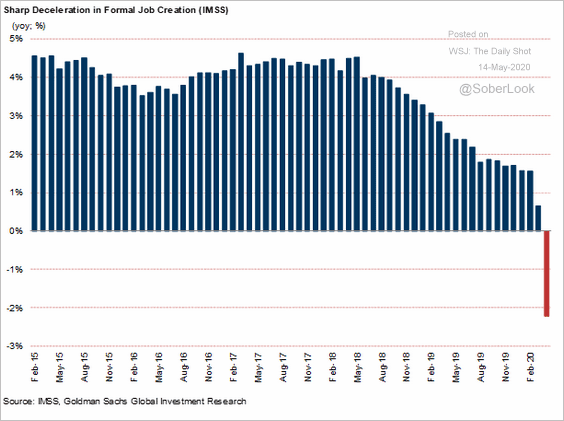 Source: Goldman Sachs
• Same-store sales:
——————–
2. The Argentine peso is collapsing on the black market.
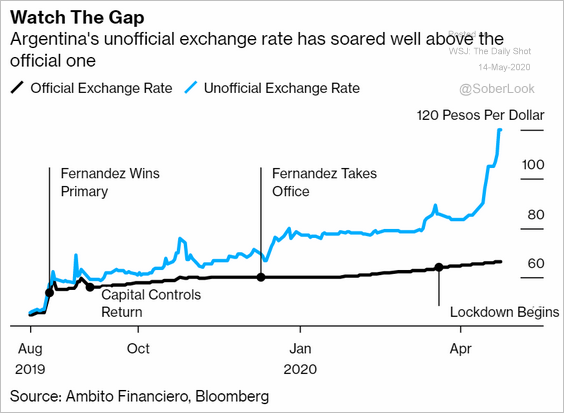 Source: @markets Read full article
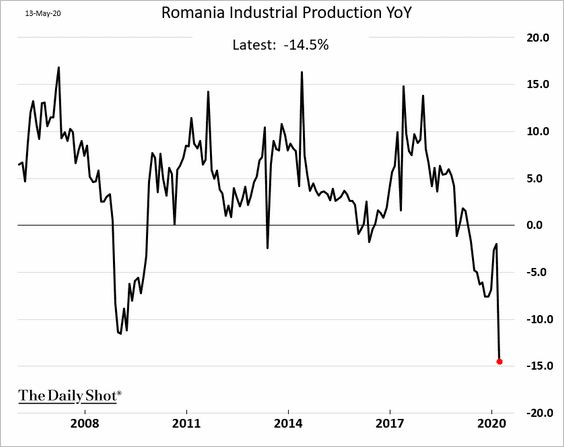
3. Romania’s industrial production decline has been worse than in 2008 (and this is through March).
4. China is the largest official creditor to emerging economies.
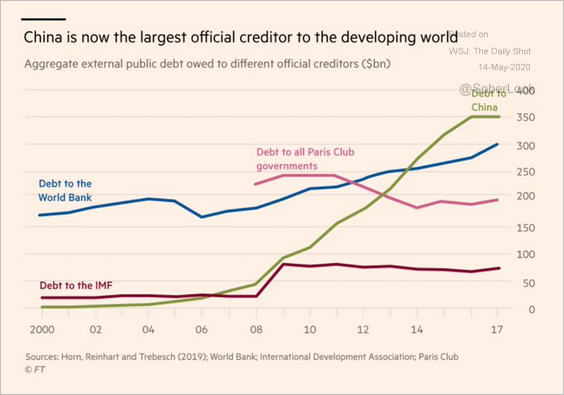 Source: @colbyLsmith, @RobinWigg Read full article
5. Much of EM employment is informal, making it challenging to replace income through unemployment benefits.
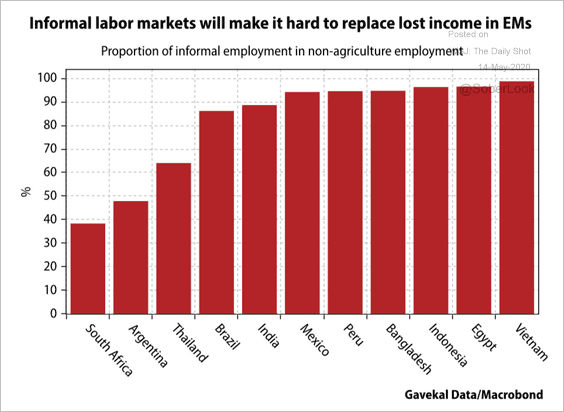 Source: Gavekal
Commodities
1. The outperformance of precious metals relative to industrial metals is starting to fade.
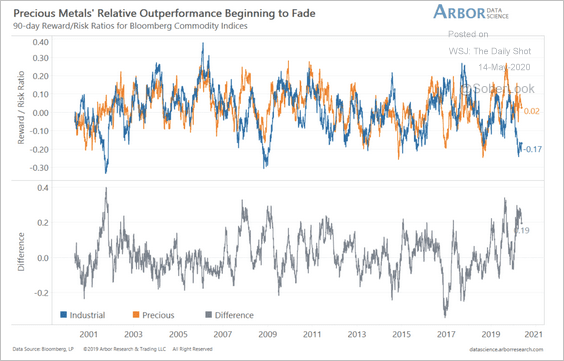 Source: Arbor Research & Trading
2. Lumber is at support. A recovery could signal stabilization in residential construction activity.
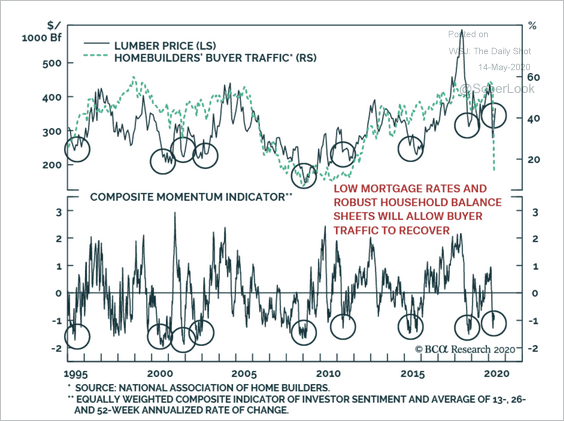 Source: BCA Research
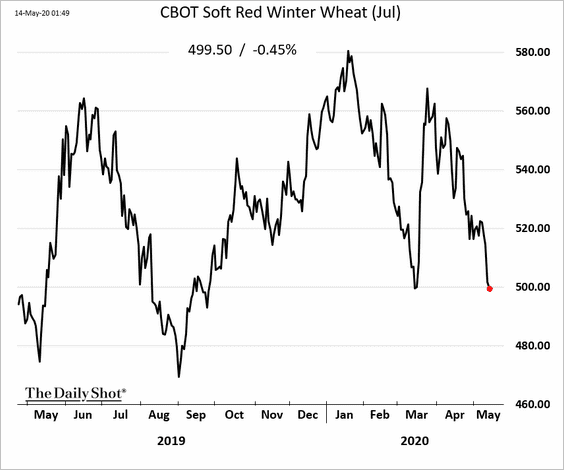
3. US wheat has been declining on oversupply concerns.
 Source: Reuters Read full article
Here is Bloomberg’s grains index.
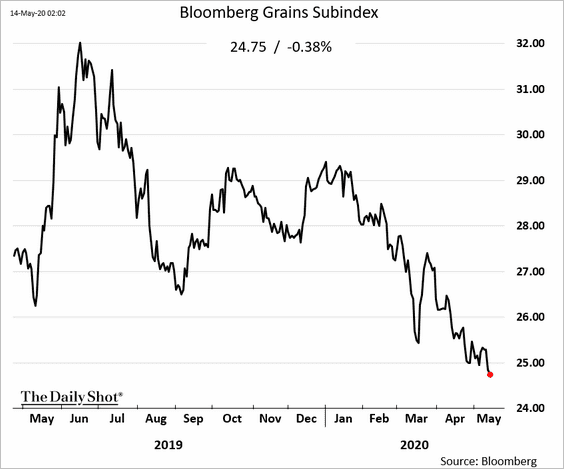
——————–
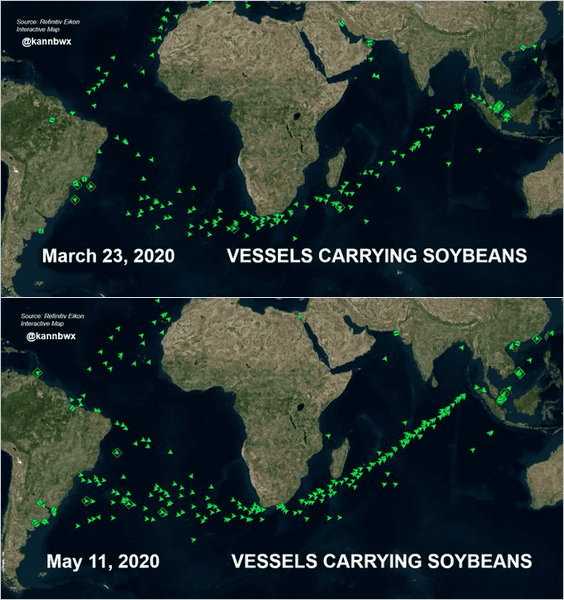
4. According to Karen Braun of Reuters,
an unprecedented amount of soybeans is headed from South America to Asia right now. Brazil shipped an unheard-of 16.3 million tonnes of soybeans in April, including 11.8 million to China. Here is the difference in traffic vs. seven weeks ago.
 Source: @kannbwx, {ht} Guilherme
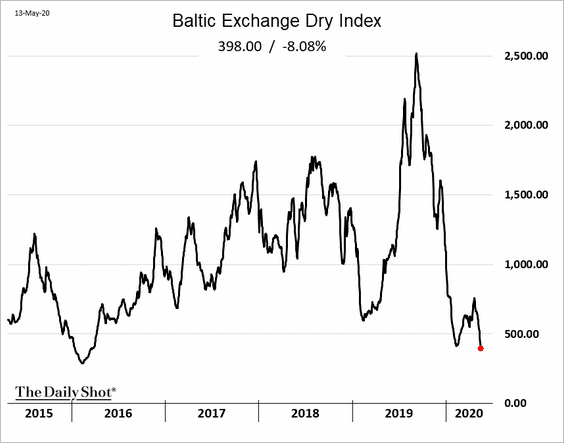
5. The Baltic Dry shipping index hit the lowest level since 2016.
Energy
1. US gasoline demand continues to recover as more Americans hit the road (see #9 in the US section).
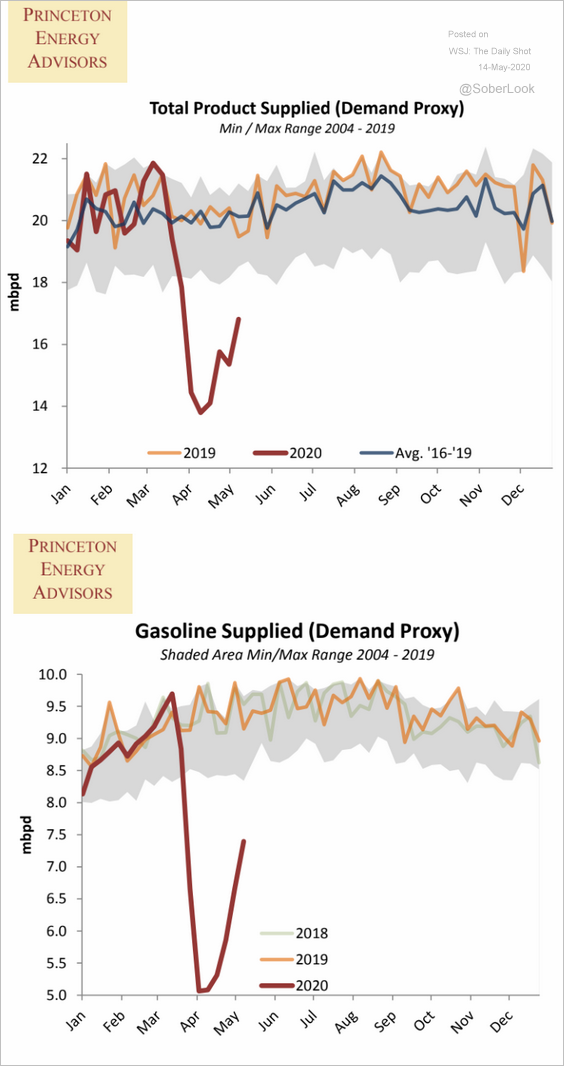 Source: Princeton Energy Advisors
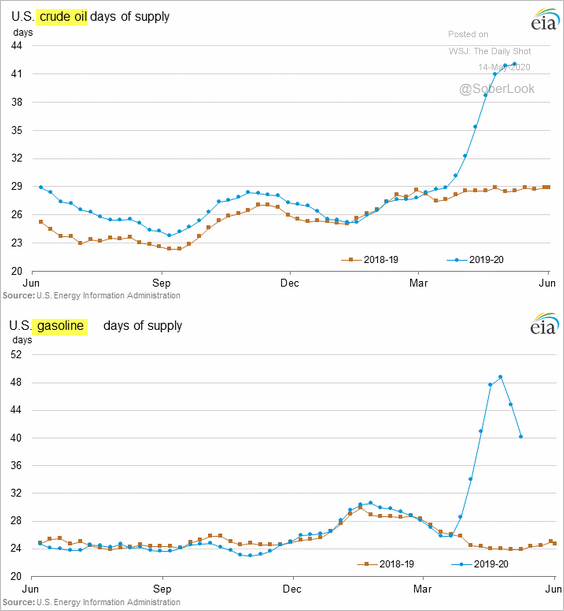
Gasoline inventories have been easing (second chart).
Refinery inputs weakened again.
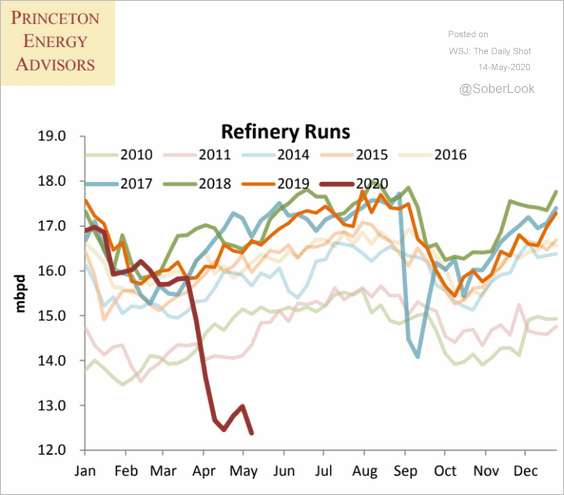 Source: Princeton Energy Advisors
——————–
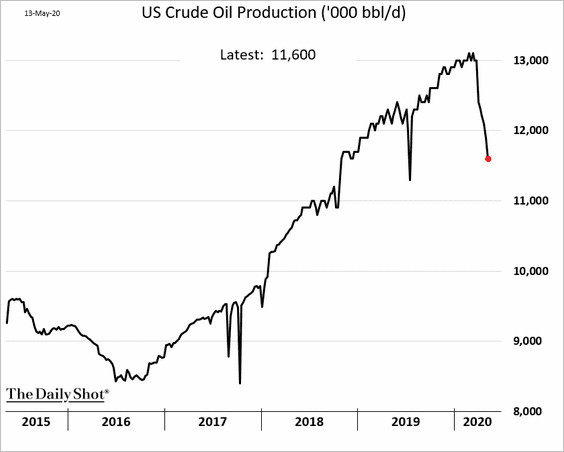
2. US crude oil production continues to slow.
Net imports are at multi-year lows.
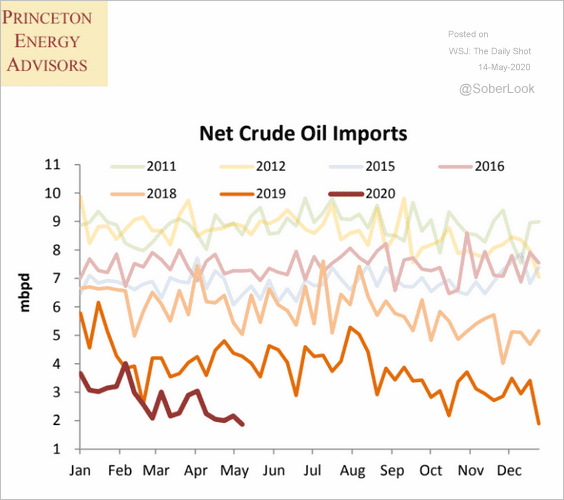 Source: Princeton Energy Advisors
——————–
3. Liquid fuel markets are expected to swing into deficit starting next quarter.
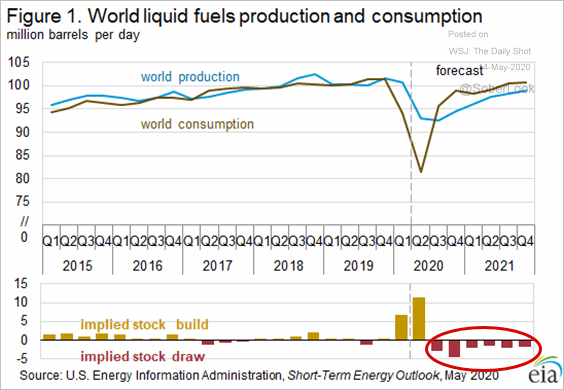 Source: EIA
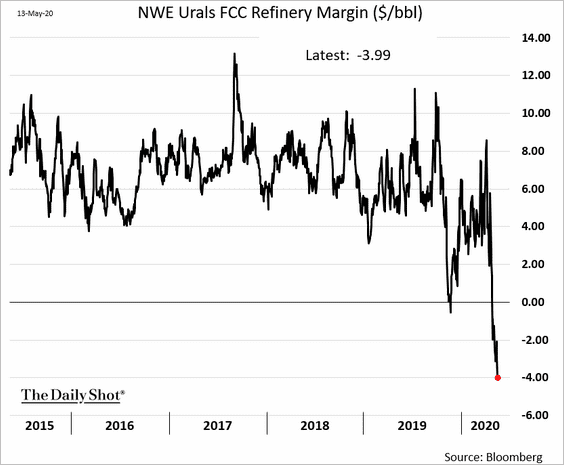
4. European refinery margins remain negative.
5. US wholesale electricity prices declined sharply this year.
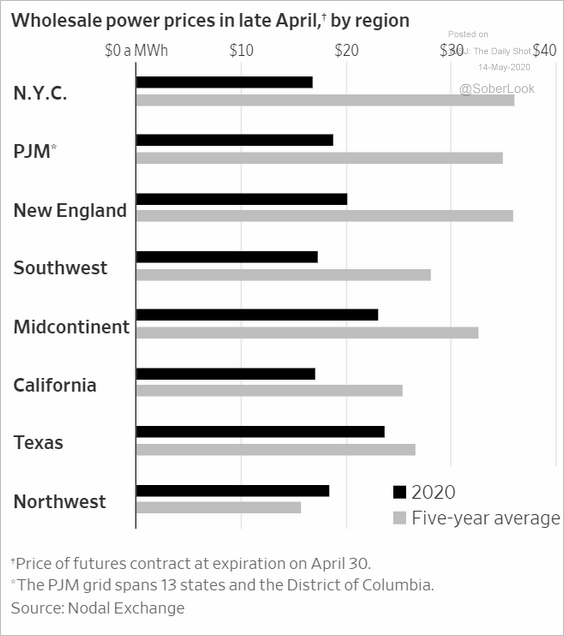 Source: @WSJ Read full article
Equities
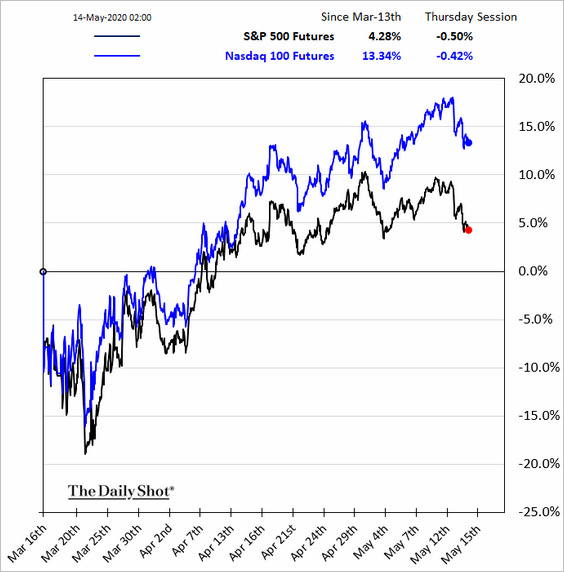
1. The stock market rebound faded this week. Valuation concerns, combined with dire economic forecasts, are making investors uneasy.
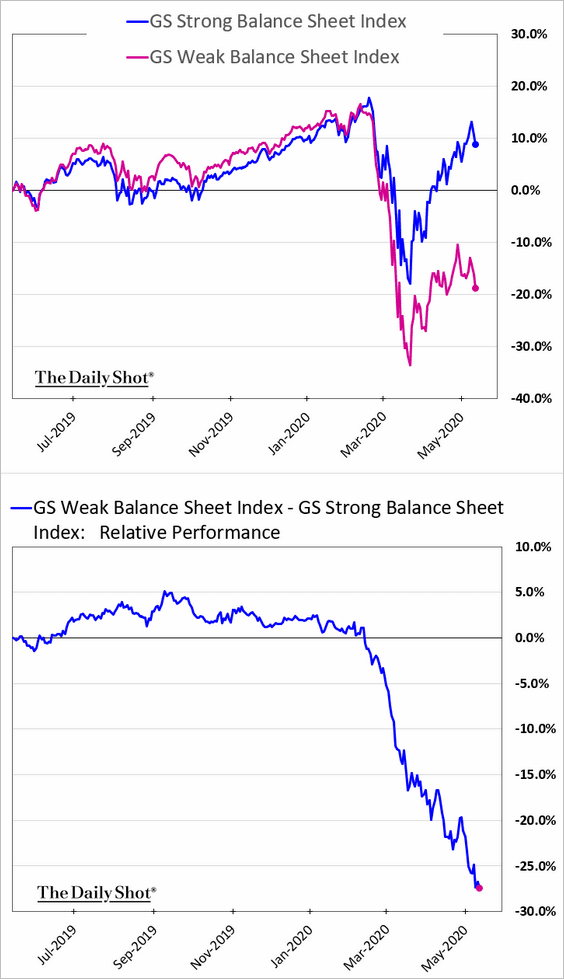
2. Investors continue to shun companies with weak balance sheets.
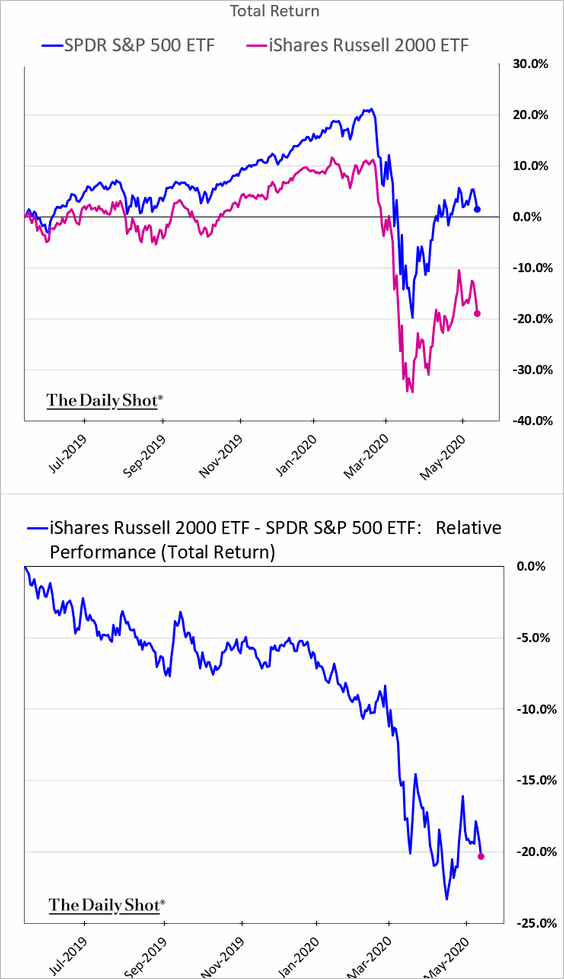
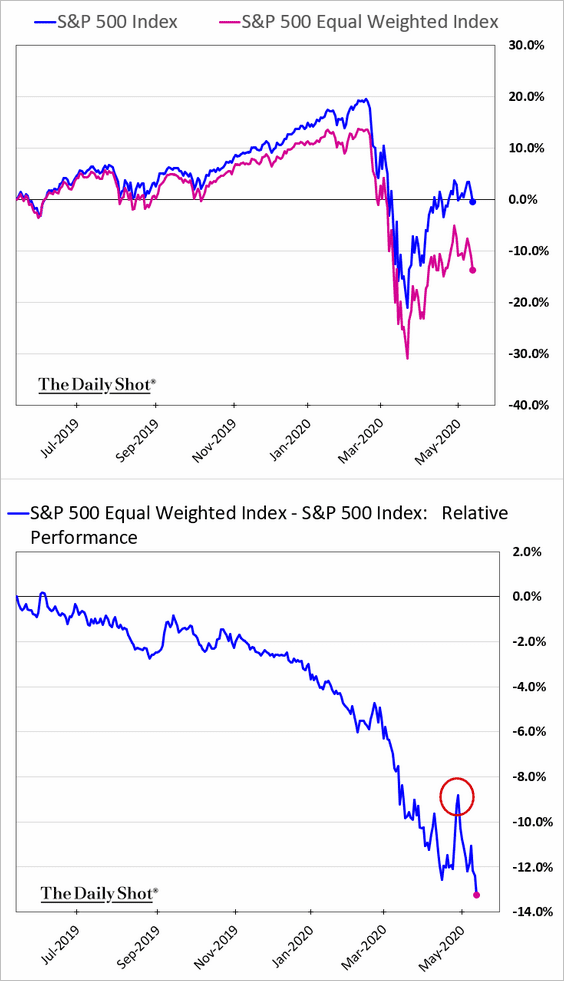
3. The brief rebound in smaller firms vs. the tech mega-caps has faded.
• Russell 2000:
• Equal-weight S&P 500:
——————–
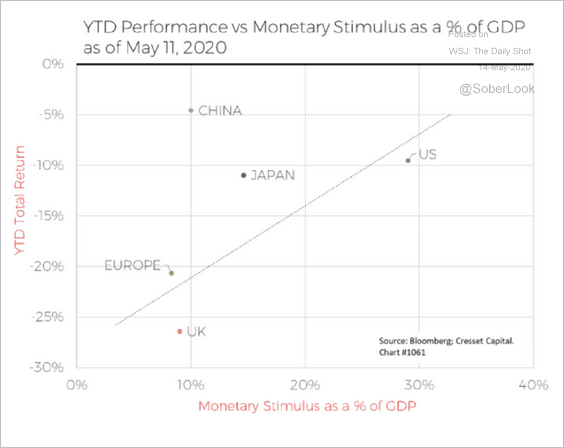
4. Two key factors gave US shares a boost relative to other markets.
• Extraordinary measures from the Fed:
 Source: Morgan Stanley Research
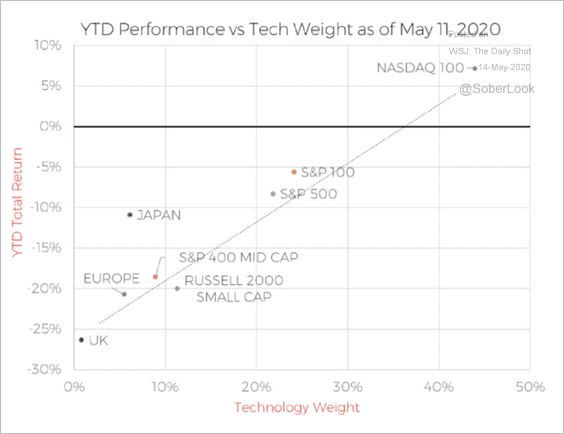
• A much higher tech-sector weight:
 Source: Morgan Stanley Research
——————–
5. Consumers increasingly expect higher stock prices in a year, a bearish signal.
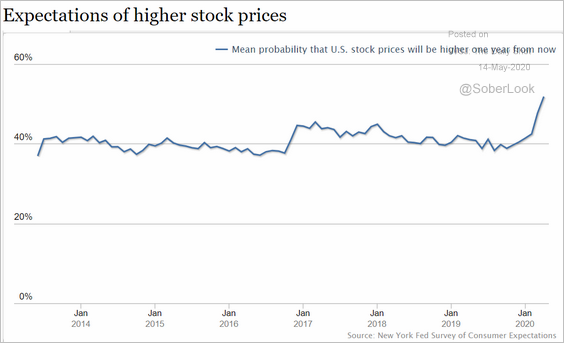 Source: Federal Reserve Bank of New York
6. Stocks have decoupled from consumer sentiment.
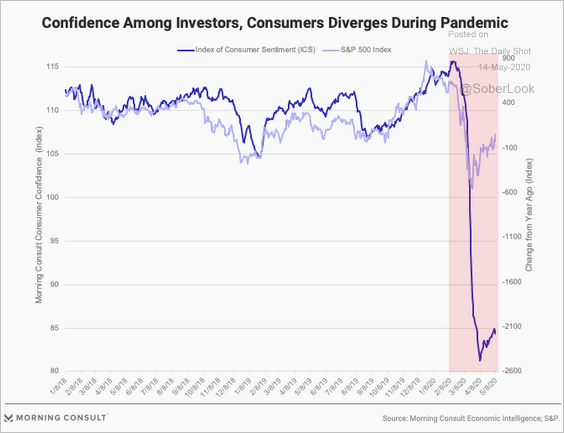 Source: Morning Consult Read full article
7. These charts show the S&P 500 consensus revenue per share, operating earnings, and profit margins.
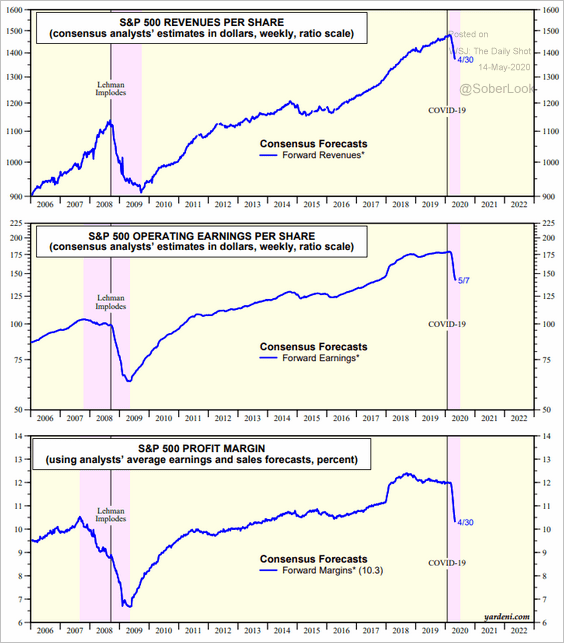 Source: Yardeni Research
8. Dispersion among smart-beta ETFs has been elevated over the past two months.
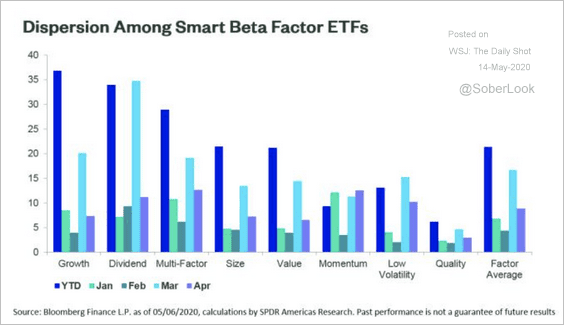 Source: SPDR Americas Research, @mattbartolini
Credit
1. Here’s a breakdown of US corporate bond ownership.
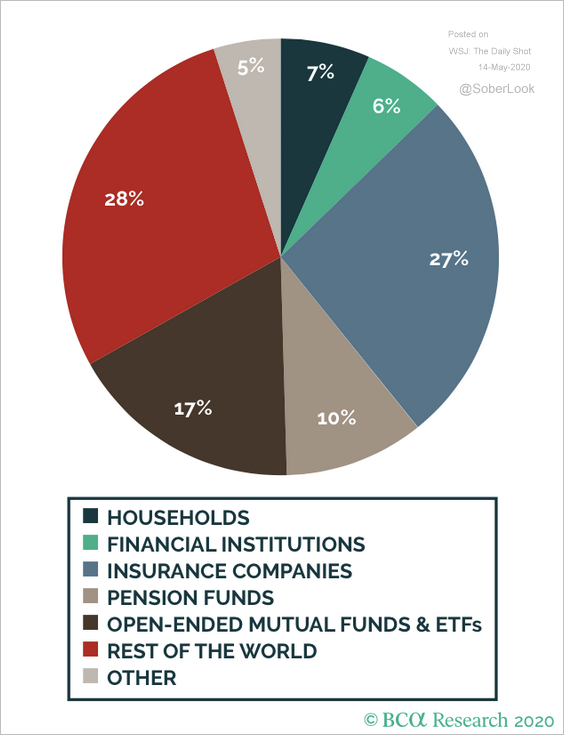 Source: BCA Research
2. This chart shows US investment-grade bond issuance by sector.
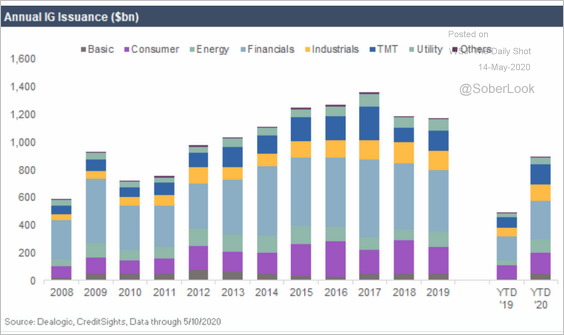 Source: CreditSights
3. Rating agencies have been busy. Below are the actions of Fitch Ratings since March 10th (by sector).
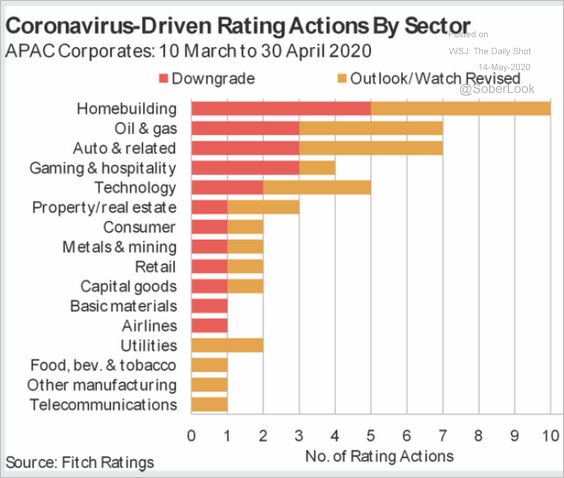 Source: @FitchRatings Read full article
Rates
1. Powell poured cold water on negative rates.
 Source: Reuters Read full article
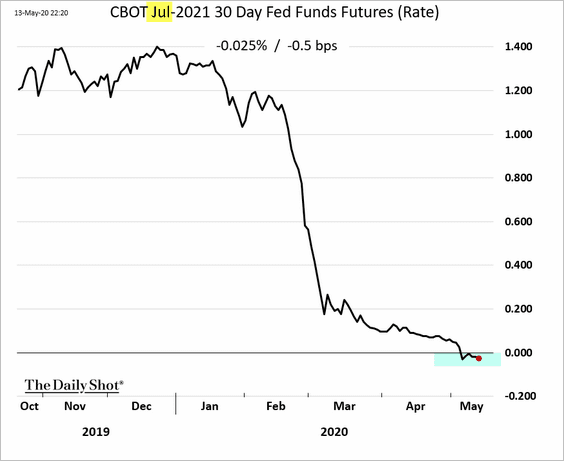
Nonetheless, traders see a scenario in which the Fed is forced to take rates into negative territory.
• Perhaps not this year, …
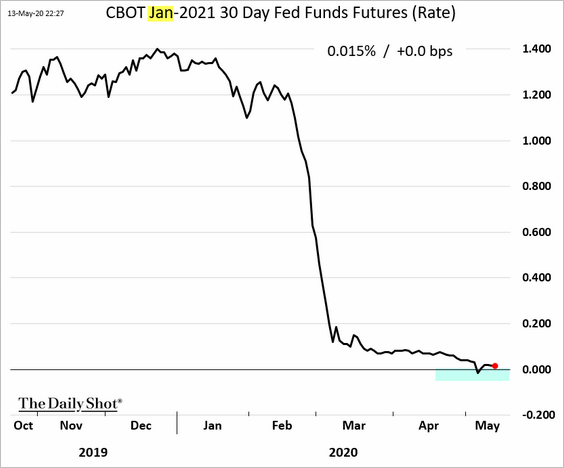
• but maybe in the first half of next year.
——————–
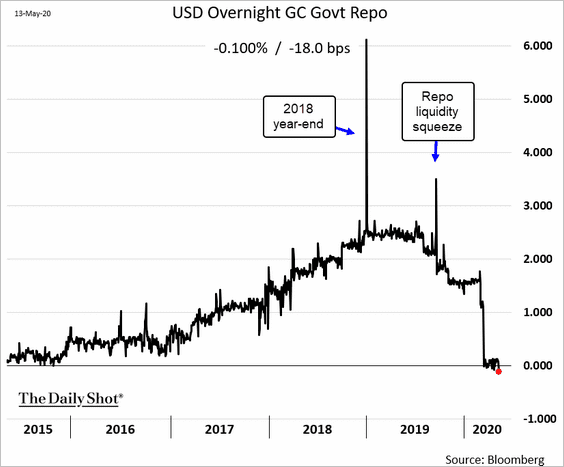
2. The US GC repo rates are negative again amid ample liquidity.
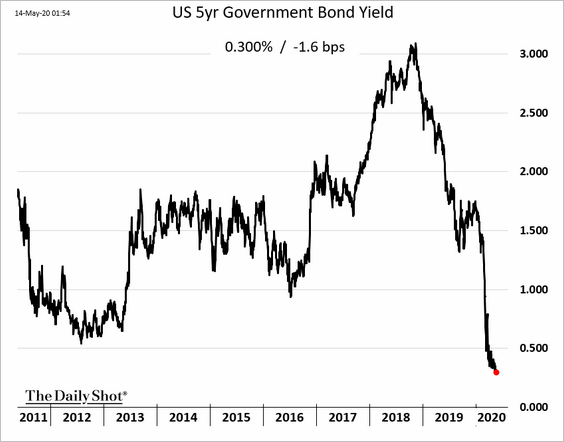
3. The 5-year Treasury yield hit a record low.
4. Long-dated Treasuries are looking increasingly attractive for FX-hedged European and Japanese investors.
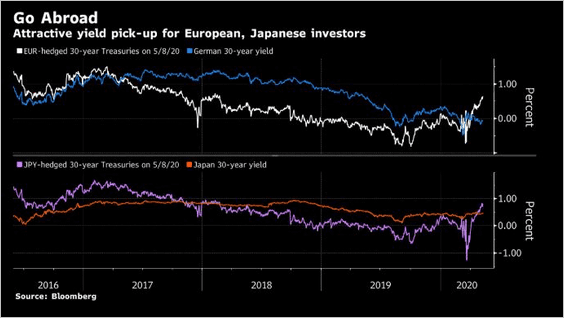 Source: @StephenSpratt
Global Developments
1. What are the global COOs/CFOs’ top priorities for 2H 2020?
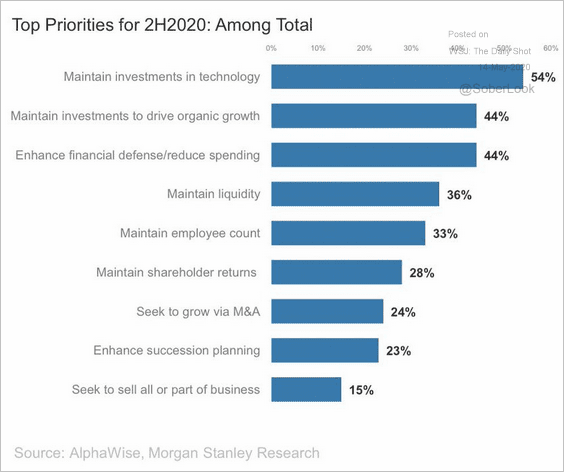 Source: Morgan Stanley Research, @carlquintanilla
2. This chart shows bond flows as a percentage of assets under management.
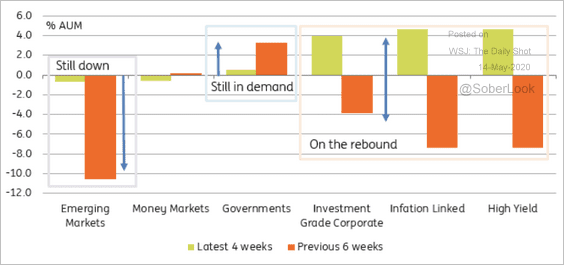 Source: ING
3. Finally, here is the distribution of currencies used for imports and exports by country/region.
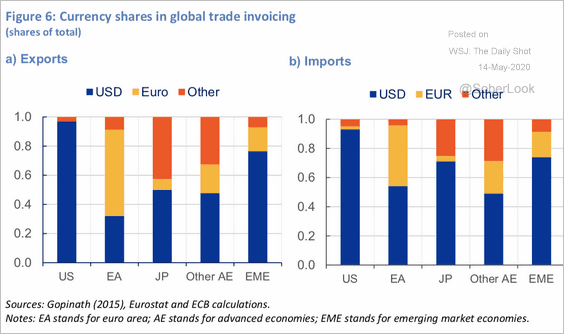 Source: ECB Read full article
——————–
Food for Thought
1. Diabetes rates by country:
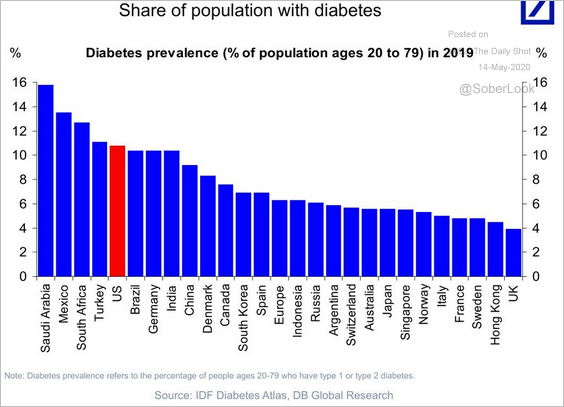 Source: Deutsche Bank Research, @TayTayLLP
2. COVID-19 mortality rates by country:
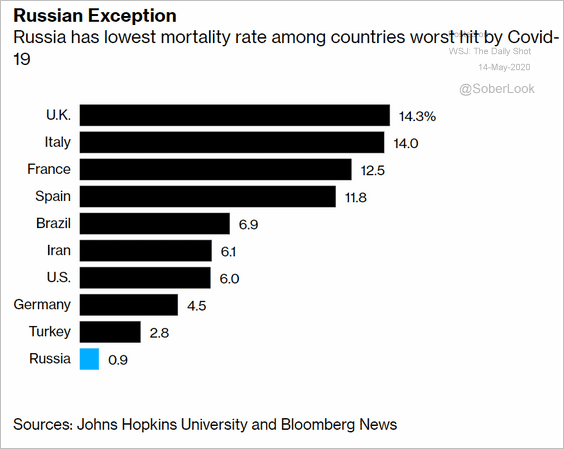 Source: @bpolitics Read full article
3. Exporters of face masks:
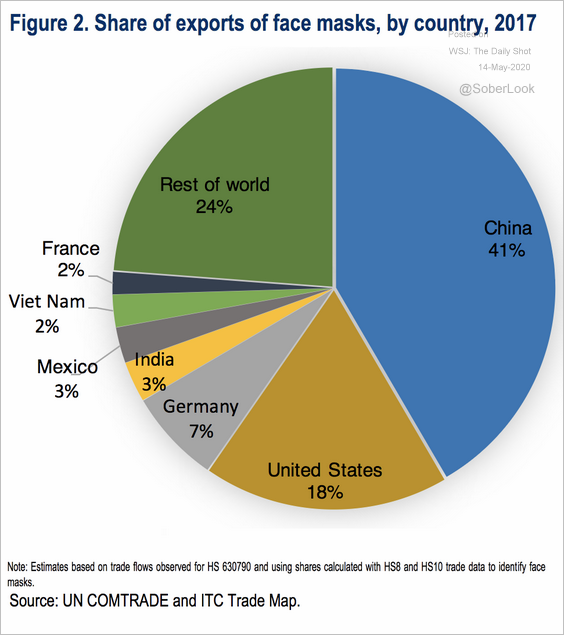 Source: OECD Read full article
4. Many Americans who lost their jobs also lost health coverage.
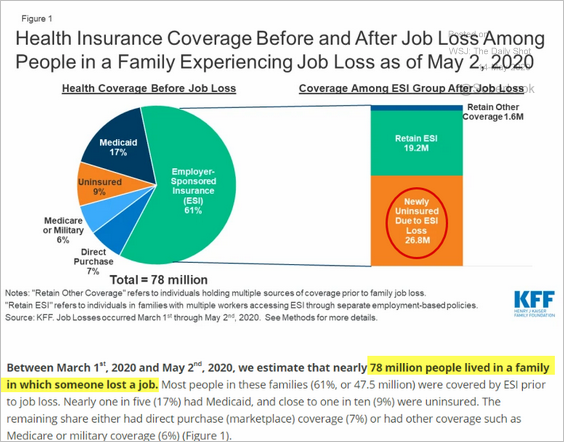 Source: KFF, {ht} @axios Read full article
5. Going to the gym:
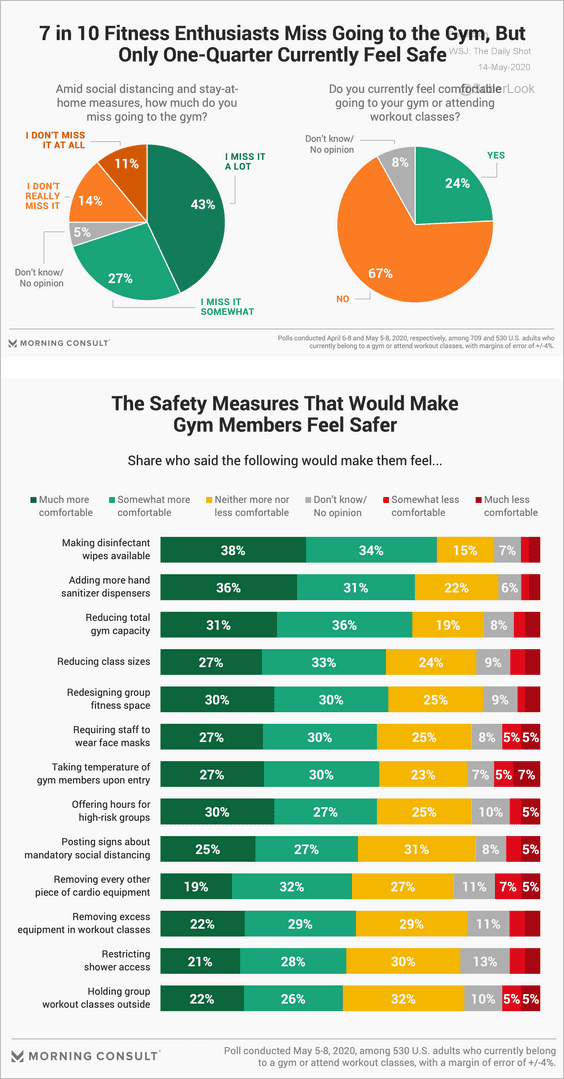 Source: Morning Consult Read full article
6. Applications for student aid:
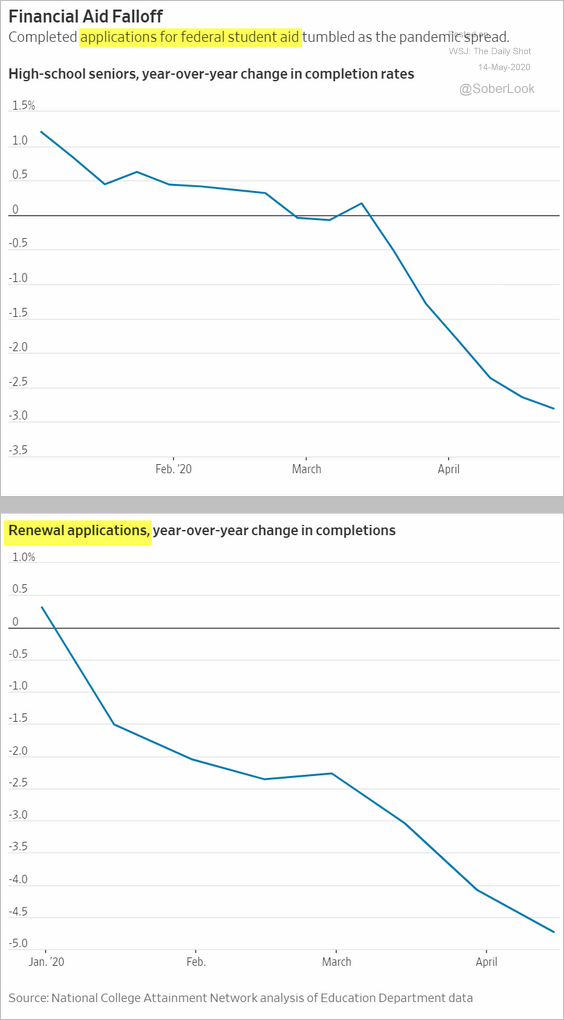 Source: @WSJ Read full article
7. Which brand source do you consider the most useful?
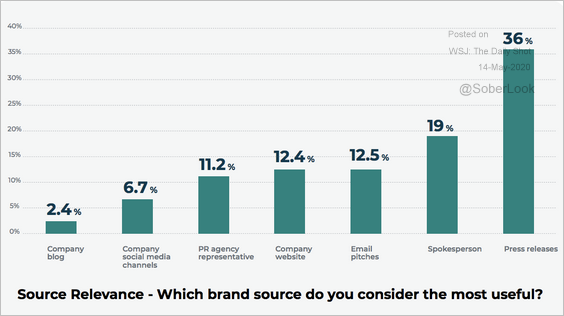 Source: Cision
8. Coronavirus relief donations:
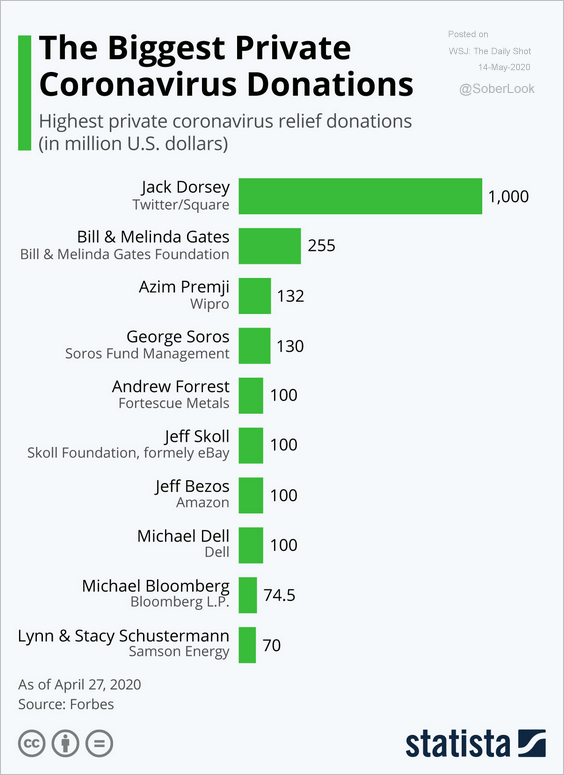 Source: Statista
9. Why do you have houseplants?
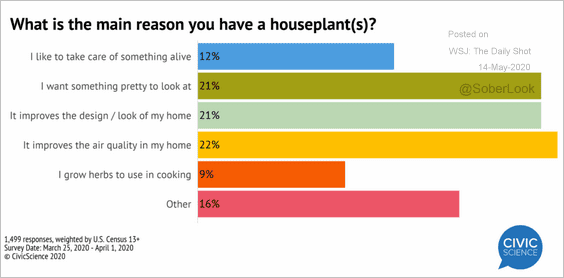 Source: @CivicScience Read full article
——————–