
The Daily Shot: 29-May-20
• The United States
• The Eurozone
• Europe
• Japan
• Asia – Pacific
• China
• Commodities
• Energy
• Equities
• Alternatives
• Credit
• Rates
• Global Developments
• Food for Thought
The United States
1. The first-quarter GDP growth was revised slightly lower, mostly as a result of an adjustment to inventories.

Here is the latest GDP growth attribution. The second-quarter contraction will eclipse the decrease we saw in the first quarter.

Weakness in equipment purchases drove business investment lower.
 Source: @GregDaco
——————–
2. Last month’s decline in durable goods orders was severe but not as extreme as was feared.

Here is the year-over-year chart.

Capital goods orders are expected to dwindle further.
 Source: Pantheon Macroeconomics
The decline in vehicle orders was the biggest in recent history.

——————–
3. The US inventory-to-sales ratio hit a record high, which will be a drag on growth in the coming months.

4. The Kansas City Fed regional factory activity showed a modest rebound in May.

The index of new orders improved sharply, although export orders remain depressed.

Manufacturers are upbeat about future incoming business.

The employment situation improved.

——————–
5. Nearly two million more Americans filed for unemployment benefits last week. While it’s the smallest increase since March, new jobless claims remain well above anything we saw after the financial crisis.

Continuing claims declined. Some (but not all) of the decrease was due to hiring/re-hiring.

It’s worth noting that continuing claims don’t cover the full extent of US unemployment. Here is a comment from Bloomberg’s Eliza Winger.
… analysts should look not only at regular state continuing claims, but also at the number of individuals claiming benefits under the CARES Act. For those not eligible to receive regular benefits, the legislation made available Pandemic Unemployment Assistance (PUA) and Pandemic Emergency Unemployment Compensation (PEUC).
——————–
6. Pending home sales registered the largest monthly decline on record.

Below is the unadjusted sales index by year. Given the strength in mortgage applications (see chart), economists expect a rebound in May.

——————–
7. Bloomberg’s consumer sentiment index finally stabilized.

8. Next, we have a couple of updates on US small businesses.
• Concerns about reopening:
 Source: LendingTree Read full article
• Staff levels:
 Source: LendingTree Read full article
——————–
9. Large US bankruptcy filings spiked in recent weeks (J.C. Penney, J. Crew, Stage Stores, Neiman Marcus, Hertz, Tuesday Morning, Le Pain Quotidien, etc.)
 Source: @markets Read full article
10. Meeting the China Phase-1 agreement goals looks impossible at this point.
 Source: Scotiabank Economics
11. The US dollar broke through support. Further declines could be a tailwind for the recovery.

12. Finally, here is the map of new COVID-19 cases by state (percent changes).
 Source: @axios Read full article
The Eurozone
1. Let’s begin with sentiment indicators, which remained depressed in May.
• Italy consumer and manufacturing confidence:

• Portugal consumer confidence:

• The Eurozone manufacturing and services sentiment:

——————–
2. Next, we have some updates on inflation, which continues to trend lower.
• Germany CPI:

• Spain CPI:

• Italy PPI:

——————–
3. Spain’s retail sales collapsed last month.

4. Italian bond spreads tightened as the EU rolled out the fiscal stimulus package.

Europe
1. Elsewhere in Europe, the Lloyds Bank Business Barometer showed no relief for UK firms in May.

2. Sweden’s sentiment indicators have stabilized in May, albeit at extremely low levels.

3. Poland’s central bank unexpectedly brought its benchmark rate close to zero.

4. US banks have been gaining market share across Europe.
 Source: OMFIF Read full article
Japan
1. Industrial output contracted by most since 2009.

Production is expected to decline further in May, while inventories remain elevated.
 Source: Goldman Sachs
——————–
2. Retail sales tumbled last month (the biggest yearly decline in recent history).

3. The Tokyo CPI unexpectedly ticked higher.

4. The unemployment rate increased slightly.

The jobs-to-applicants ratio has been rolling over.

——————–
5. Based on the 12-month forward P/E ratio, Japan’s shares look expensive.
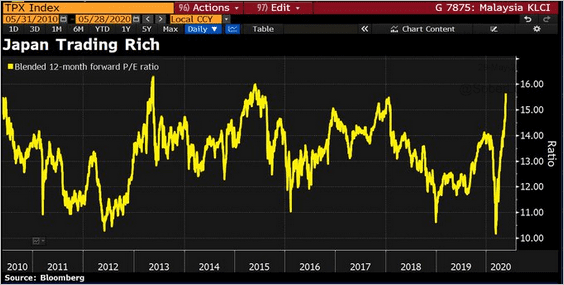 Source: @DavidInglesTV
Asia – Pacific
1. South Korea’s industrial production weakened more than expected.

2. New Zealand’s consumer sentiment bounced from April lows.

3. Next, we have some updates on Australia.
• The labor market is recovering.
 Source: Macrobond Read full article
• Government benefits have dominated household income growth over the past two months. Will consumers start to spend?
 Source: CBA, @Scutty
• The contraction in personal credit has accelerated.
 Source: Goldman Sachs
• The Aussie dollar is testing resistance.
 h/t Michael Wilson
China
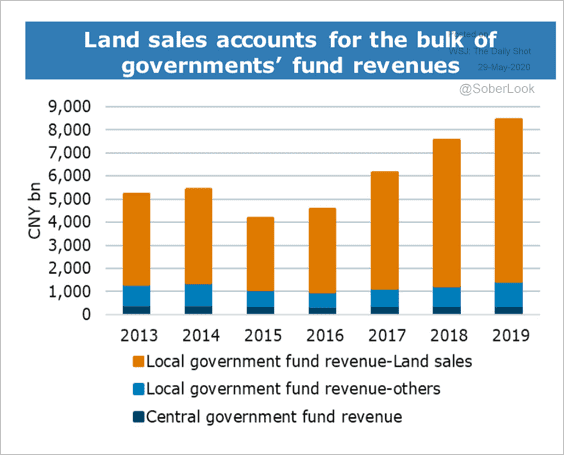
1. Revenues from land sales and issuance of SLGBs (special local government bonds) are key cash flow streams for local governments.
 Source: ANZ Research
Local government debt issuance has accelerated.
 Source: Goldman Sachs
——————–
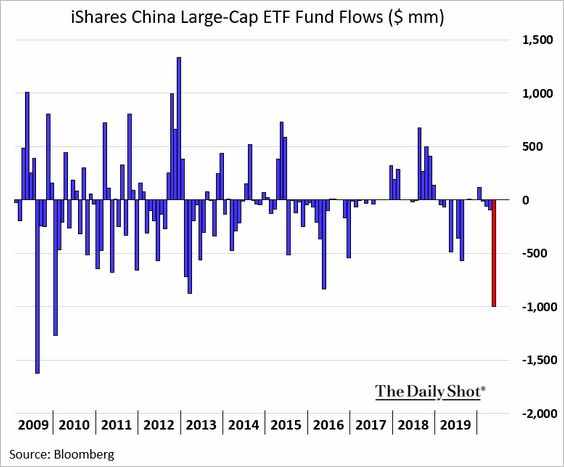
2. Dollar-based investors have been cutting back their large-cap China exposure.
3. Macau’s hotel occupancy rate has collapsed.

Commodities
1. Iron ore prices are surging, driven in part by Brazil’s coronavirus crisis (limiting production) and improved demand from China.

2. The S&P GSCI industrial metals index is now above its 50-day moving average.
 Source: Longview Economics
3. The Baltic Dry Shipping Index appears to be stabilizing.
 Source: Longview Economics
4. The July arabica coffee futures dipped below $1/lb in New York. Traders are concerned that Brazil’s coffee output could climb to a record next season.
 Source:
5. Net-short speculative positioning in US corn futures is at an extreme.
 Source: Fitch Solutions Macro Research
Fitch expects the corn market to tighten more than other grain markets, exceeding consensus estimates.
 Source: Fitch Solutions Macro Research
Corn futures are recovering from oversold levels.
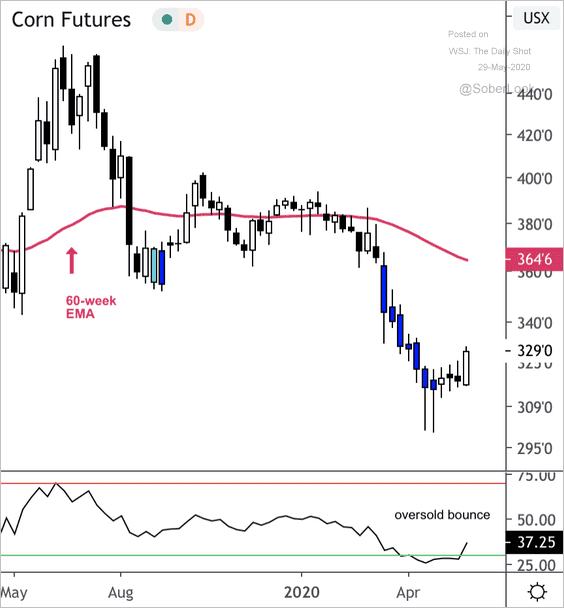 Source: @DantesOutlook
Energy
1. US crude oil production continues to decline.

2. US oil inventories hit a multi-year high.

However, with refinery runs remaining depressed, gasoline inventories are falling from peak levels.
• Refinery inputs:

• Crude oil and gasoline inventories measured in days of supply:

——————–
3. Gasoline demand is still extremely weak, …

… which doesn’t jibe with Apple’s US mobility index.
 Source: @TCosterg
——————–
4. According to the US Department of Energy, “U.S. renewable energy consumption surpassed coal for the first time in over 130 years.”
 Source: EIA Read full article
Equities
1. This scatterplot from Credit Suisse shows the relationship between the starting forward P/E ratio and future returns.
 Source: @ISABELNET_SA, @csresearch
2. The S&P 500 has had an average gain of 16% 12-months after 90% of stocks have traded above their 50-day moving average, according to SunTrust (see chart).
 Source: SunTrust Private Wealth Management
3. According to BofA, government spending has been driving the market rally.
 Source: @ISABELNET_SA, @BofAML
4. The book-to-price dispersion among the largest 1,000 US stocks is at record levels.
 Source: Instinet, @johnauthers, @bopinion Read full article
5. Mega-cap growth stocks have vastly outperformed the S&P 500 for several years …
 Source: Deutsche Bank Research
… and are now more than a quarter of the S&P 500 index.
 Source: Deutsche Bank Research
And this year, the deviation from the 6-year up-trend of mega-cap growth stocks relative to the S&P 500 has reached new highs.
 Source: Deutsche Bank Research
——————–
6. Has the growth-to-value ratio finally peaked?
 Source: @johnauthers, @bopinion Read full article
 Source: @johnauthers, @bopinion Read full article
——————–
7. Next, we have some sector updates.
• Communication Services:
 Source: NPR Read full article

• Semiconductors (hurt in part by rising US-China tensions):

• Energy:

• Sports betting stocks:
 Source: @axios Read full article
Alternatives
1. The largest hedge funds dominate the industry.
 Source: @adam_tooze, @financialtimes Read full article
2. Hedge funds’ long stock portfolios are increasingly concentrated.
 Source: @ISABELNET_SA, @GoldmanSachs
3. These charts show US VC activity in recent months.
 Source: Howell, Lerner, Nanda, Townsend (NBER) Read full article
Credit
1. US year-to-date investment-grade debt issuance hit $1 trillion.
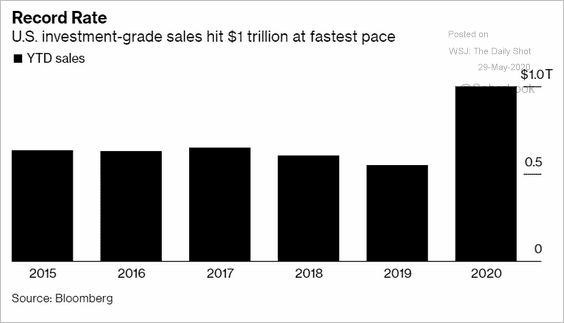 Source: @markets Read full article
2. Corporate debt looks attractive relative to stocks.
 Source: @WSJ Read full article
3. High-yield munis are recovering with high-yield corporates.

4. Credit risk-transfer mortgage securities (see overview) are off the lows but remain depressed.
![]() Source: @WSJ Read full article
Source: @WSJ Read full article
Rates
1. The Fed’s balance sheet expansion has slowed.

• Here is the composition of the central bank’s assets over time.
 Source: @GregDaco, @nanc455, @OxfordEconomics
• This chart shows the size and current utilization of the various emergency measures.
 Source: @GregDaco, @BostjancicKathy, @OxfordEconomics, @FT Read full article
• The Bank of Japan is making the greatest use of the Fed’s dollar swap lines to facilitate cross-border lending by Japanese banks (done mostly in dollars).
 Source: OMFIF Read full article
——————–
2. The Treasury curve has been steepening in the long end. The trend has been correlated with the probability of Democrats taking control of the US Senate. The market expects the budget gap to widen further under this scenario, putting pressure on long-term Treasuries.
 Source: BofA Merrill Lynch Global Research, @WallStJesus
3. Headline inflation would have to come in below -0.85% over the next 12-months for a hold-to-maturity TIPS position to underperform Treasuries, according to BCA Research. But have we already seen the full extent of deflation?
 Source: BCA Research
The iShares TIPS bond ETF (TIP) appears to be at a long-term low versus the iShares 20+ year Treasury bond ETF (TLT).
 Source: @DantesOutlook
——————–
4. The market is always predicting higher 10yr Treasury yields.
 Source: Deutsche Bank Research
Global Developments
1. The SMI report from World Economics shows further deterioration in business activity in May.
 Source: World Economics
2. Consumer confidence has stabilized and is recovering in some countries.
 Source: Morning Consult Read full article
3. Will global inflation rebound in response to massive liquidity injections from central banks and governments?
 Source: @ISABELNET_SA, @MorganStanley
——————–
Food for Thought
1. Teleworking opportunity vs. pay, by industry:
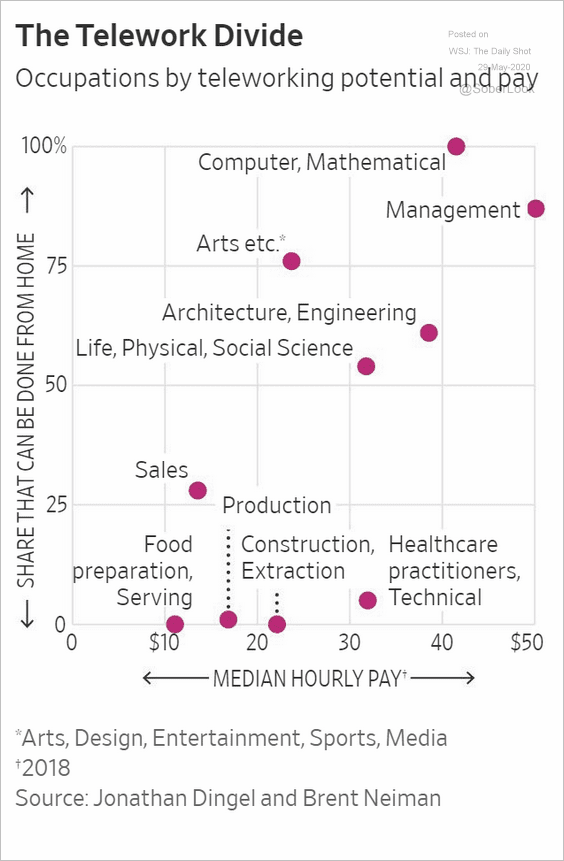 Source: @WSJ Read full article
2. How will small business owners promote their business after reopening?
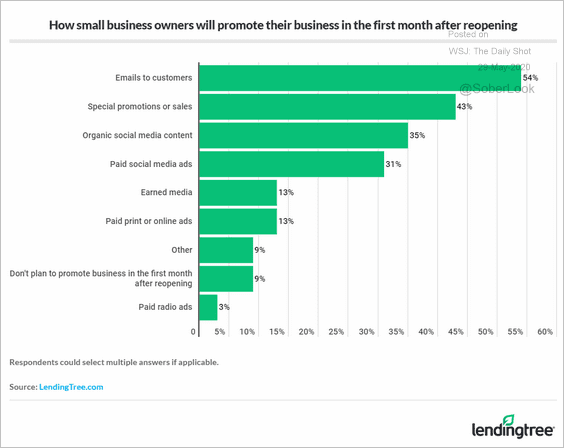 Source: LendingTree Read full article
3. Methods to file for unemployment benefits:
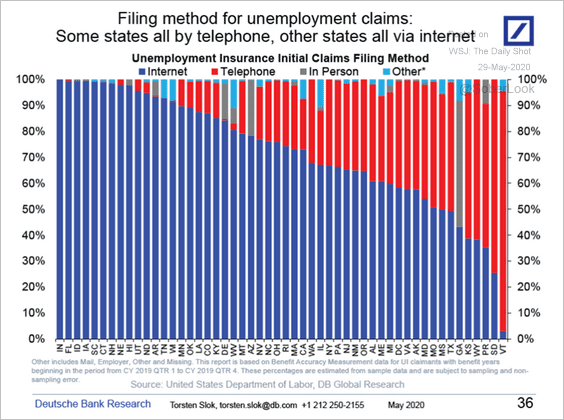 Source: Deutsche Bank Research
4. Booking a Florida vacation:
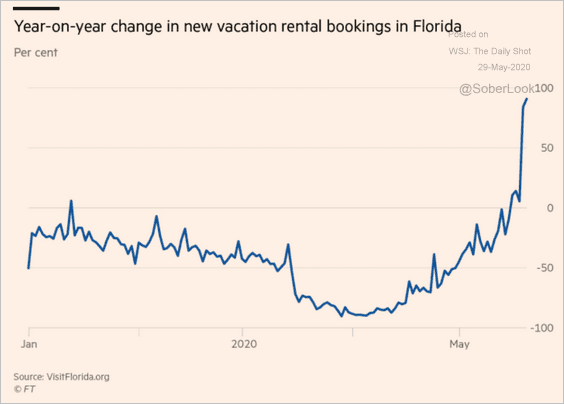 Source: @financialtimes Read full article
5. Who is hiring?
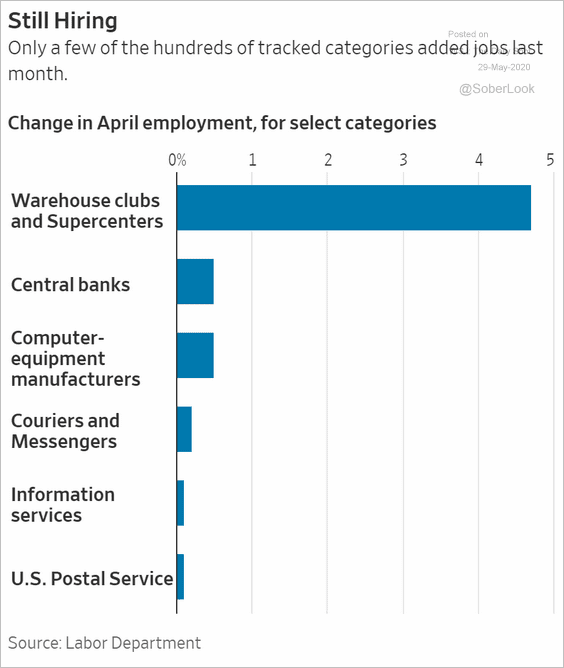 Source: @WSJ Read full article
6. Telemedicine:
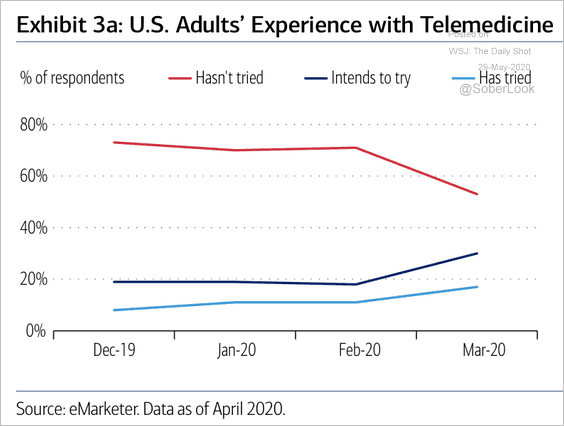 Source: BofA Merrill Lynch Global Research
——————–
7. Politicians’ approval ratings:
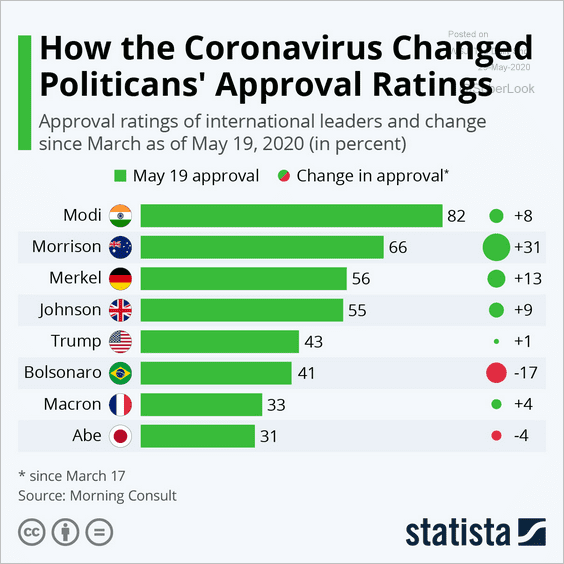 Source: Statista
8. Demographic changes in select states:
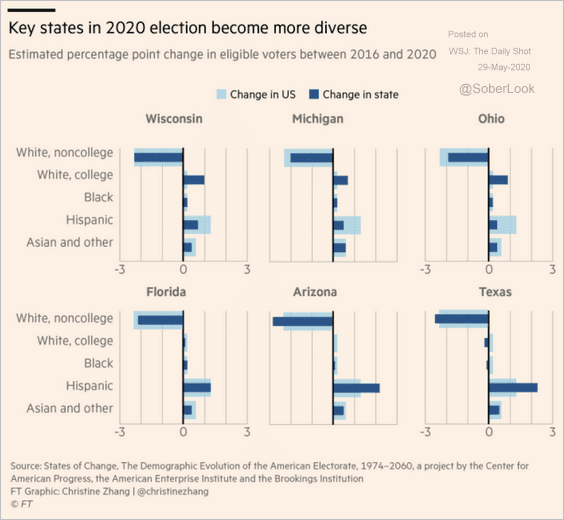 Source: @financialtimes Read full article
9. Wine exports:
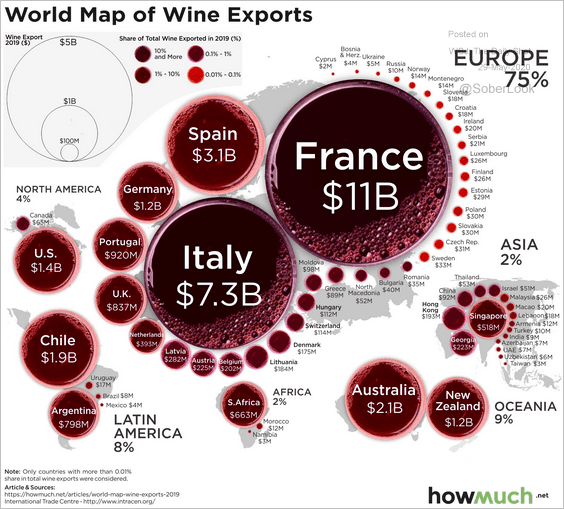 Source: @howmuch_net Read full article
——————–
Have a great weekend!