
The Daily Shot: 04-Jun-20
• The United States
• Canada
• The United Kingdom
• The Eurozone
• Europe
• Asia – Pacific
• China
• Emerging Markets
• Commodities
• Energy
• Equities
• Rates
• Food for Thought
The United States
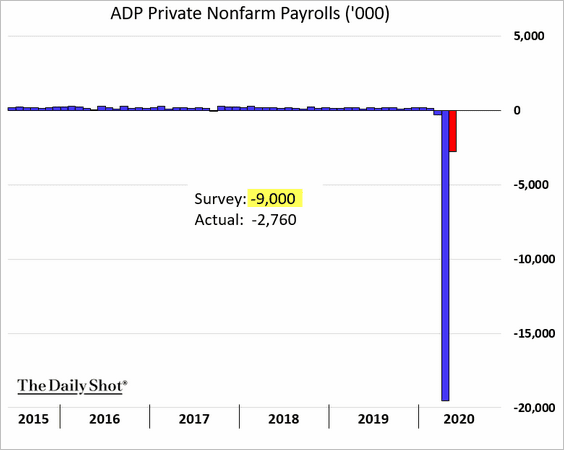
1. Let’s begin with the labor market.
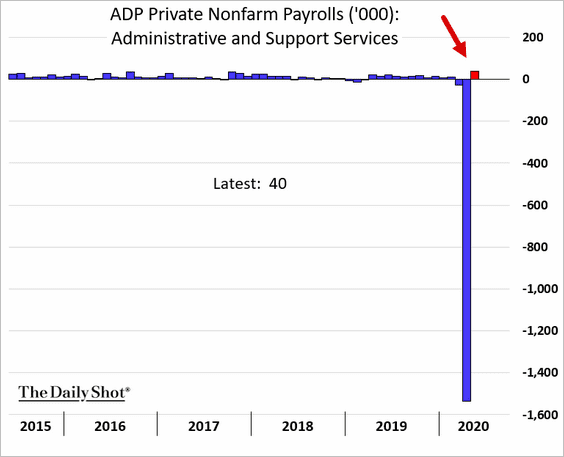
• The ADP private payrolls report showed that the May layoffs were not as severe as economists were estimating.
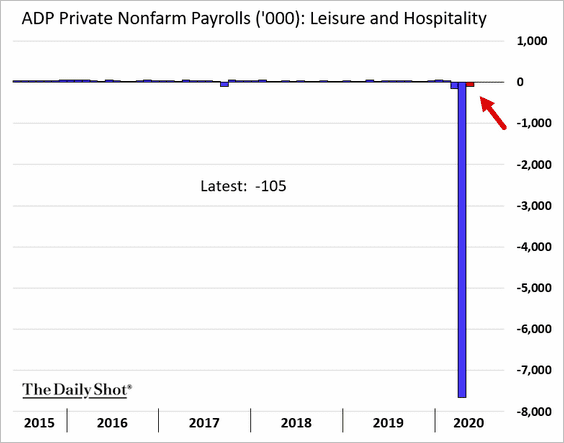
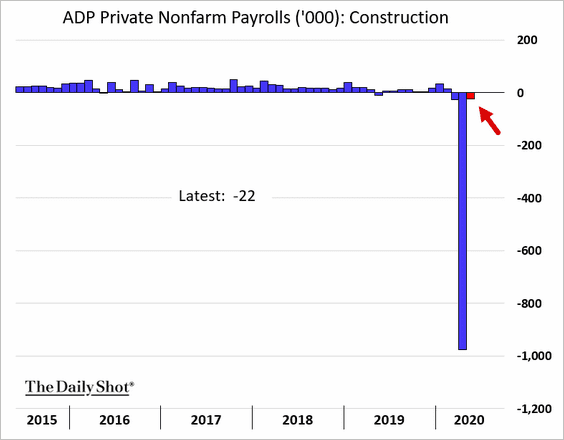
– While factories continued sharp reductions in their workforce, …
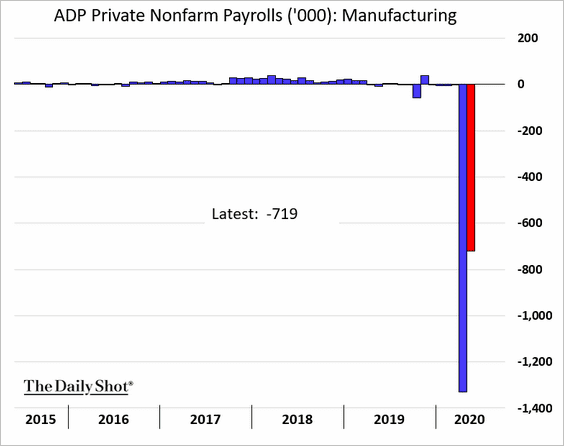
… job losses in other sectors such as hospitality and construction were small compared to what we saw in April.
Administrative services had a net gain in jobs.
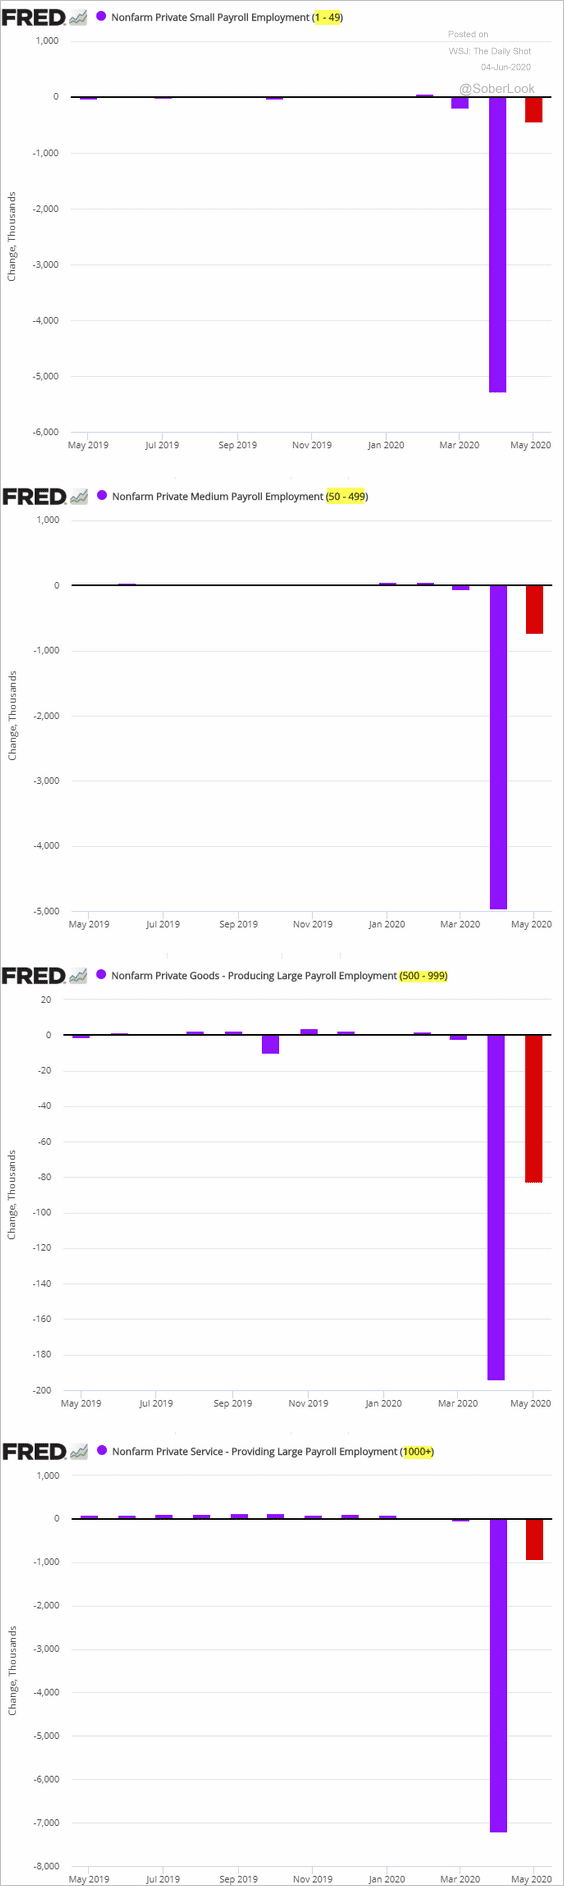
– Below is the breakdown of job losses by company size.
– And here is the ADP report summary.
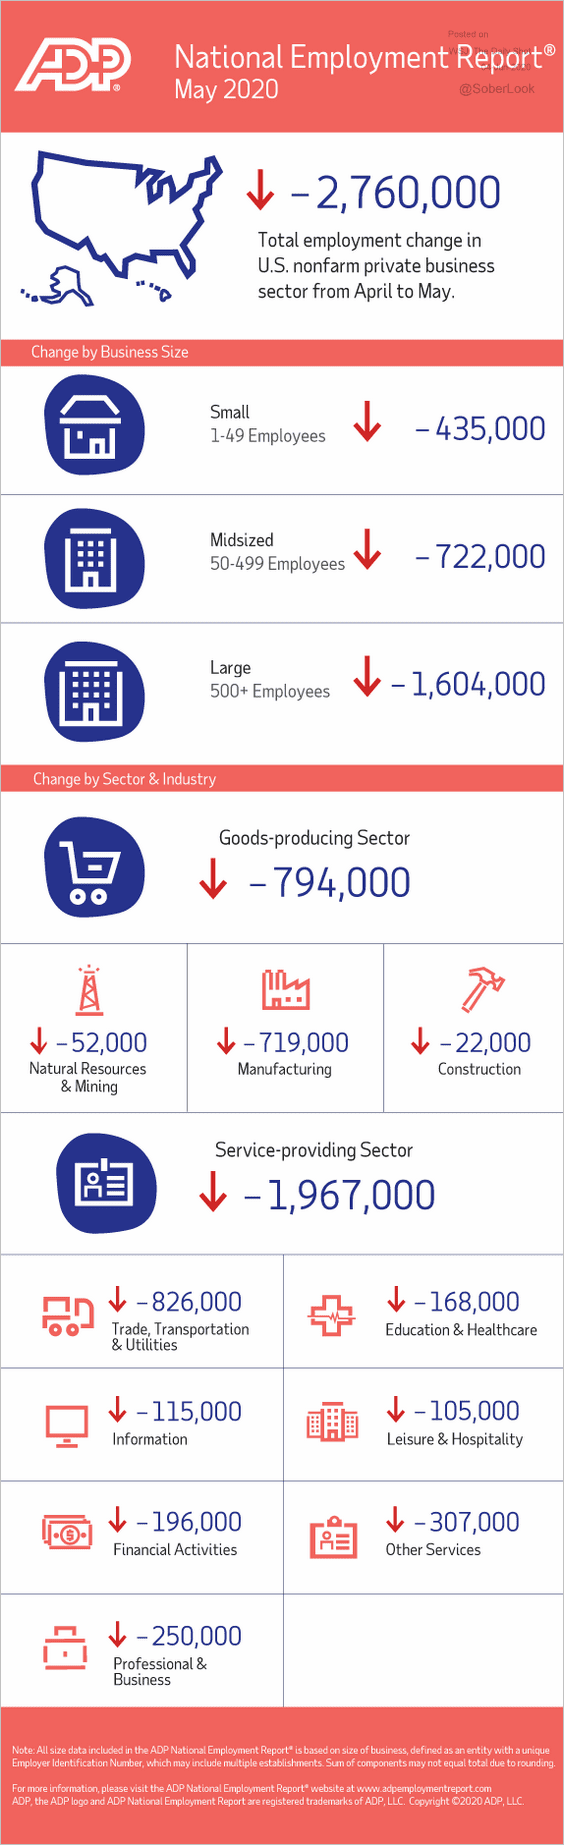 Source: ADP
——————–
• These scatterplots from Deutsche Bank show the relationship between initial jobless claims and mobility trends.
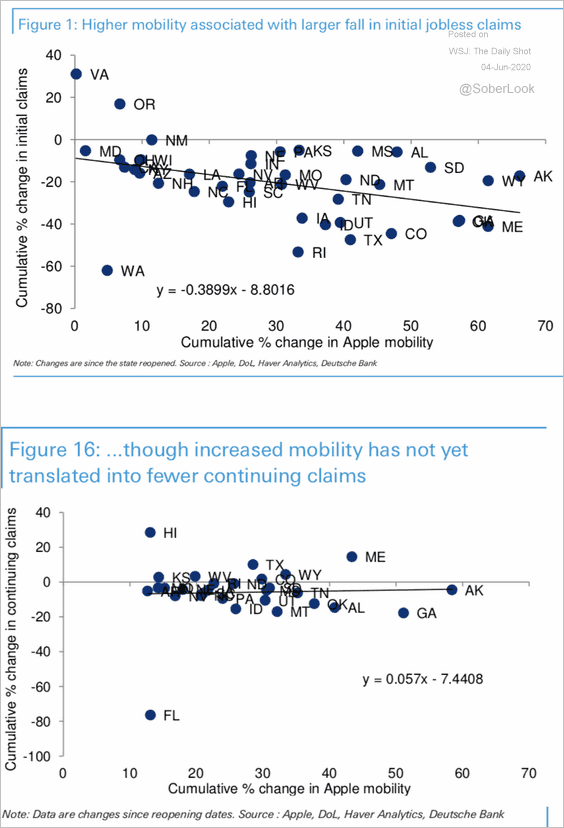 Source: Deutsche Bank Research
By the way, here is the latest mobility chart from Apple. The trend in driving appears to have recovered, which is inconsistent with relatively weak gasoline demand (see the energy section).
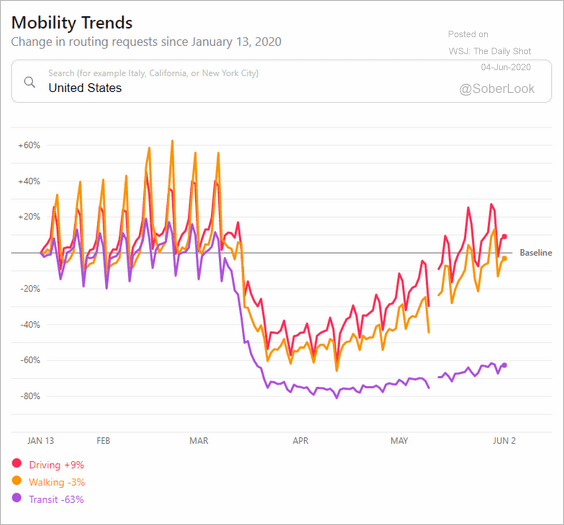 Source: Apple Maps
——————–
• Morgan Stanley expects the May unemployment rate to hit 17%.
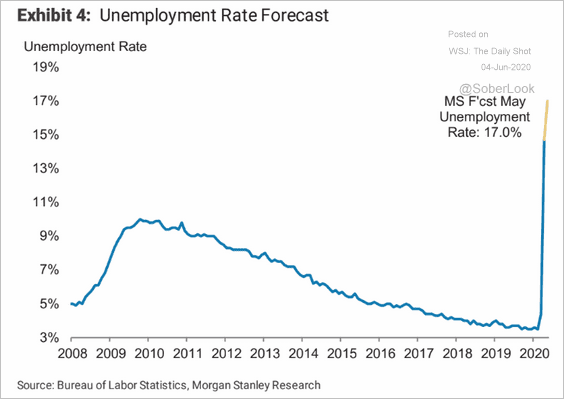 Source: Morgan Stanley Research
——————–
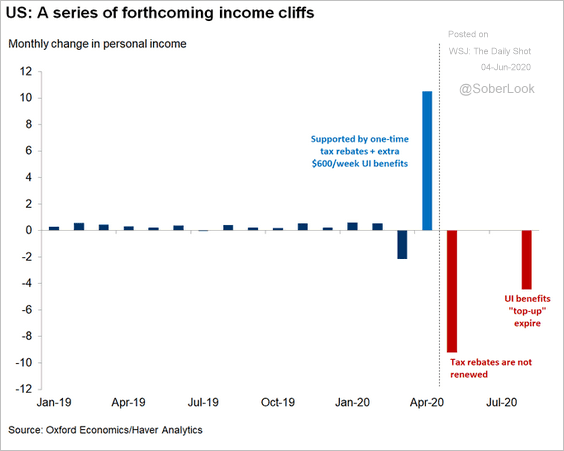
2. Without additional government support, Americans face two income “cliffs” this summer. The $1,200 stimulus checks will soon run out, and the beefed-up unemployment benefits (extra $600 per month) will expire at the end of July.
 Source: @GregDaco
According to Oxford Economics, these government programs have more than offset the loss of compensation income, …
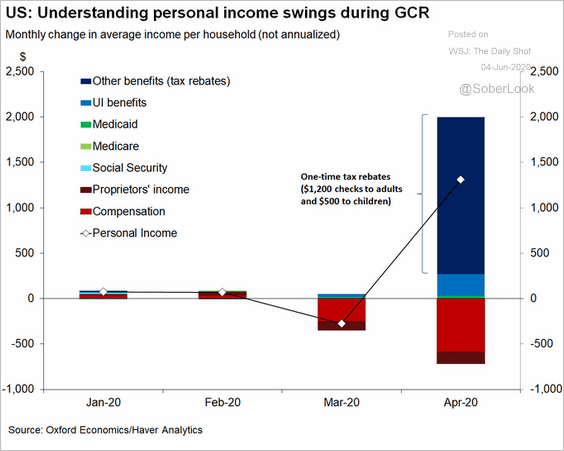 Source: @GregDaco
… supporting the economic “green shoots.” Below is the Citi Economic Surprise Index.
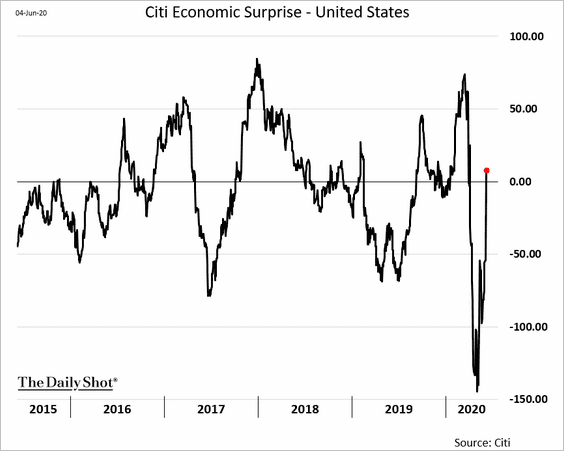
Will the federal government address the looming household income cliffs to keep the recovery from stalling?
 Source: CNBC Read full article
——————–
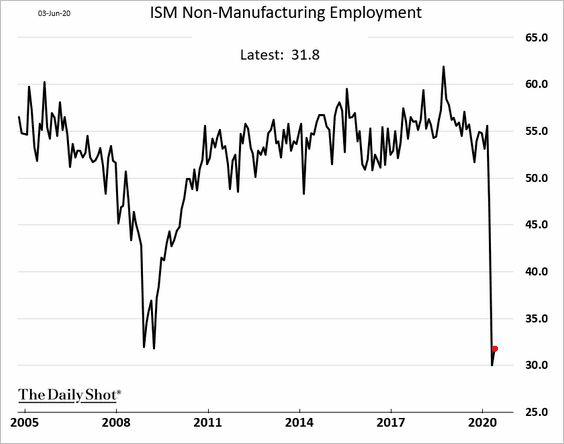
3. Business activity across non-manufacturing sectors in the US showed modest improvement in May (slower rate of contraction).
• Here is the headline ISM index.
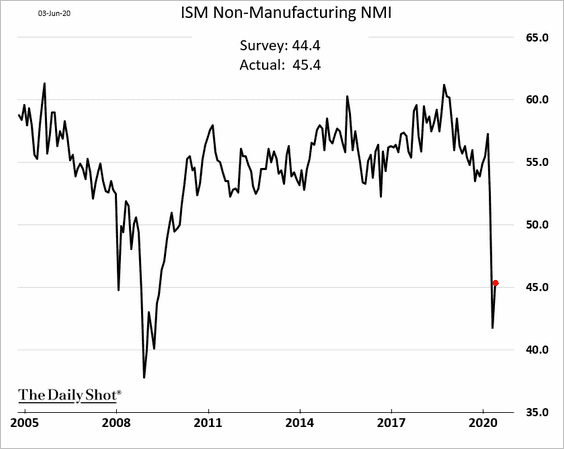
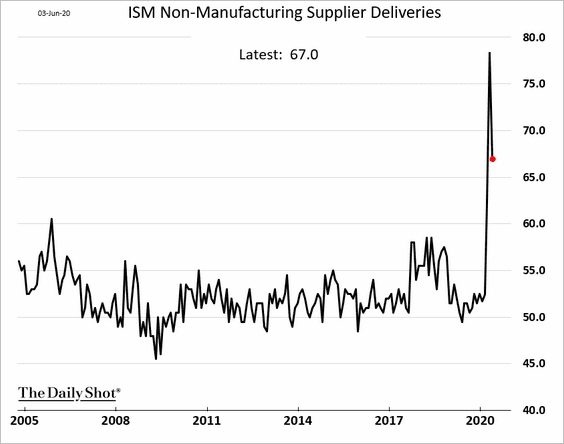
Supply chain issues continue to mask to the full extent of the contraction.
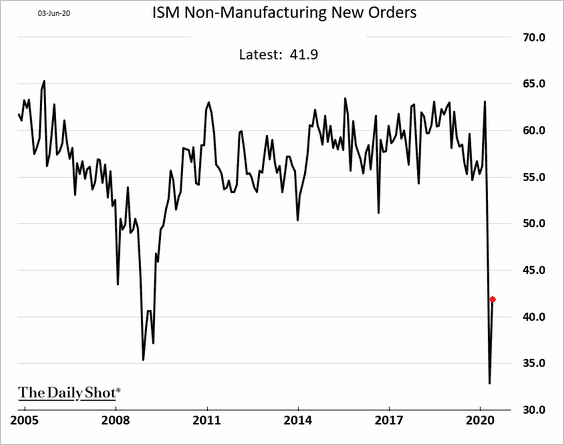
The index of new orders rose above the 2008/09 lows.
But employment barely budged from the record low in April.
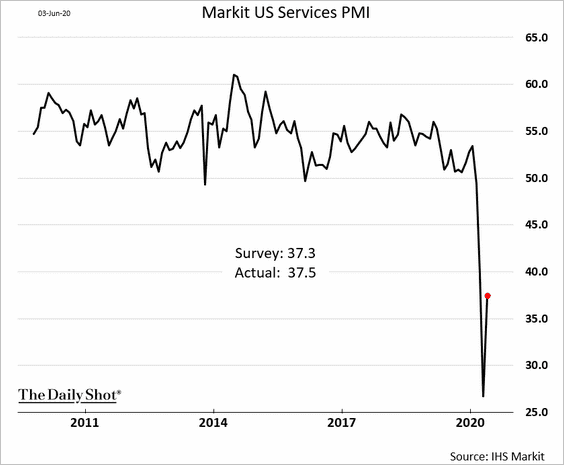
• The Markit Services PMI also showed a bounce in May.
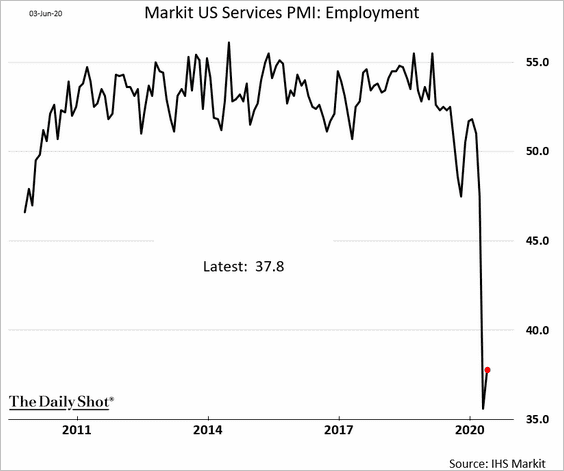
But similar to the ISM report, Markit’s services employment index remains extremely weak.
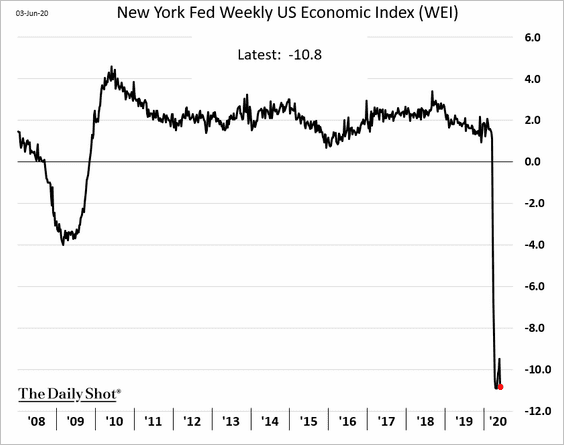
4. The New York Fed’s weekly economic activity index (WEI) is holding near record lows.
5. Mortgage applications to purchase a home remain at multi-year highs for this time of the year.
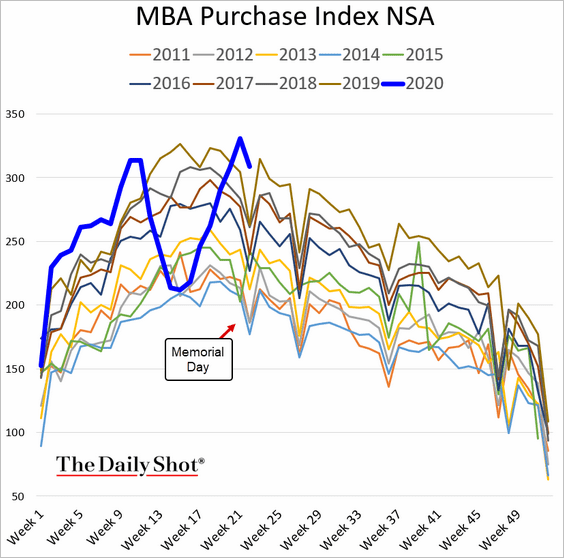
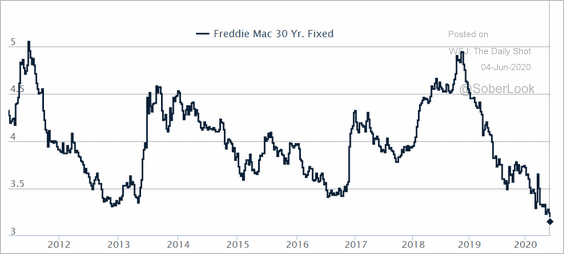
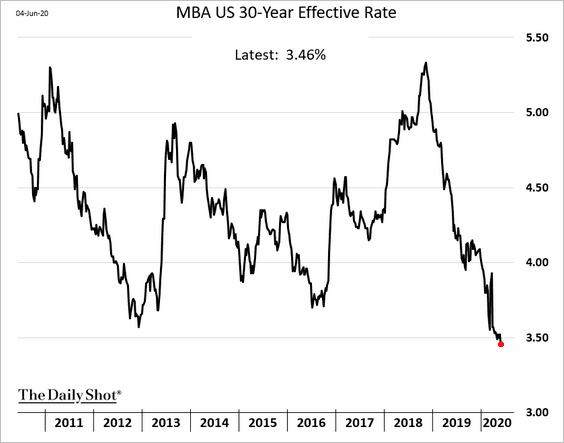
Record-low mortgage rates (2 charts below) and households trading multi-family housing in urban areas for single-family homes in the suburbs have been driving the demand.
 Source: Mortgage News Daily
Will mortgage rates move even lower?
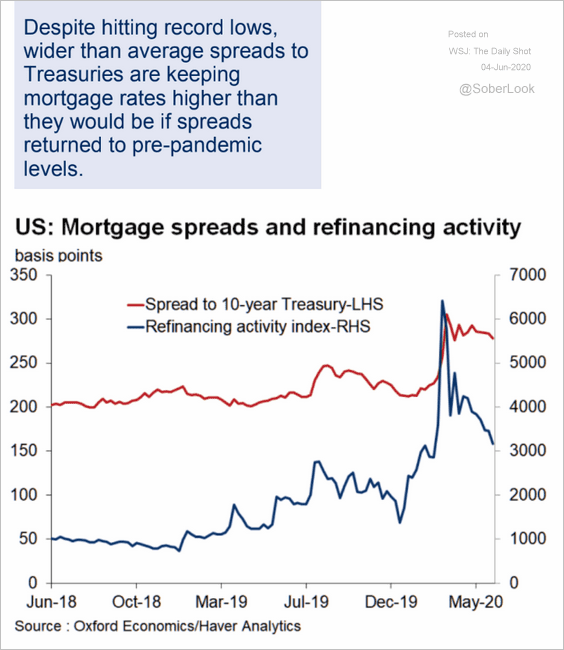 Source: Oxford Economics
Canada
1. Labor productivity soared in the first quarter as hours worked tumbled more than business output (due to lockdowns).
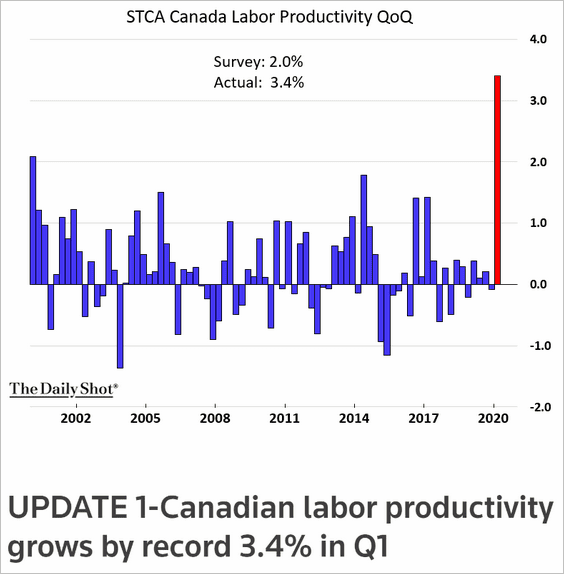 Source: Reuters Read full article
2. This chart shows mortgage payments as a percentage of median income in Canada’s four largest housing markets.
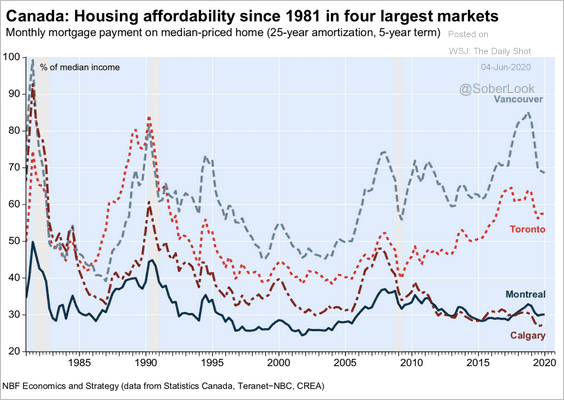 Source: Economics and Strategy Group, National Bank of Canada
3. The Bank of Canada’s asset portfolio is now 20% of the GDP.
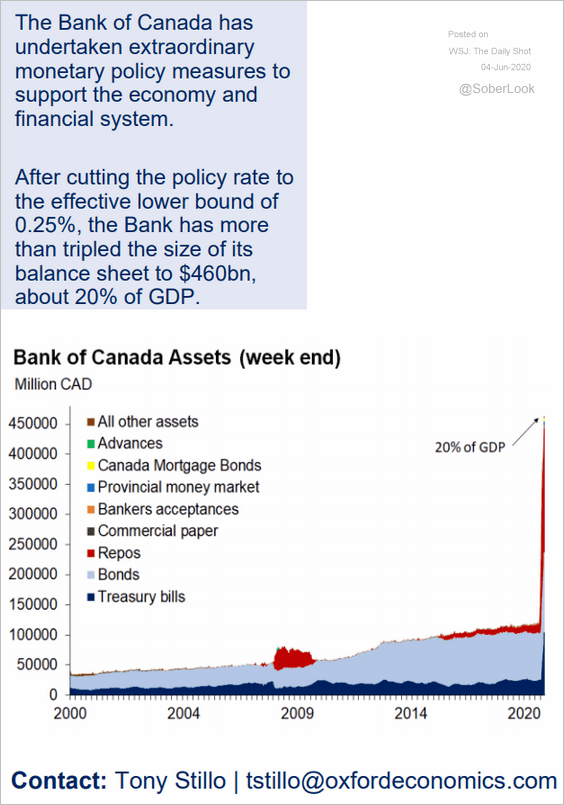 Source: Oxford Economics
4. Will we see a sharp decline in immigration as unemployment spikes?
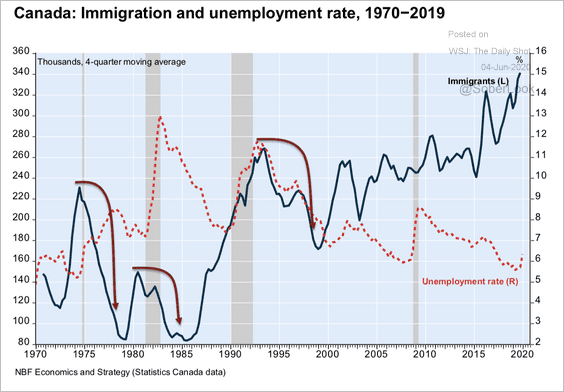 Source: Economics and Strategy Group, National Bank of Canada
The United Kingdom
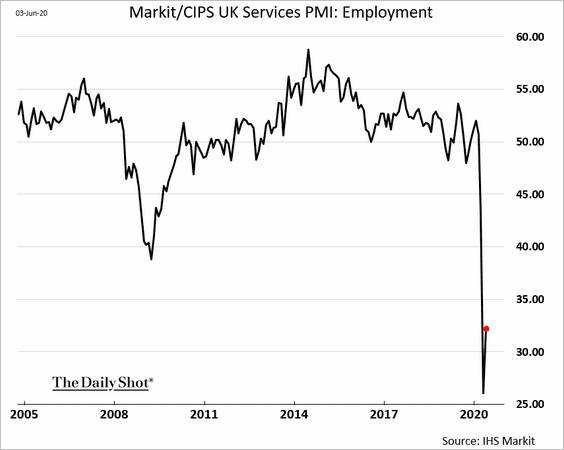
1. The Markit Services PMI bounced from record lows in April.
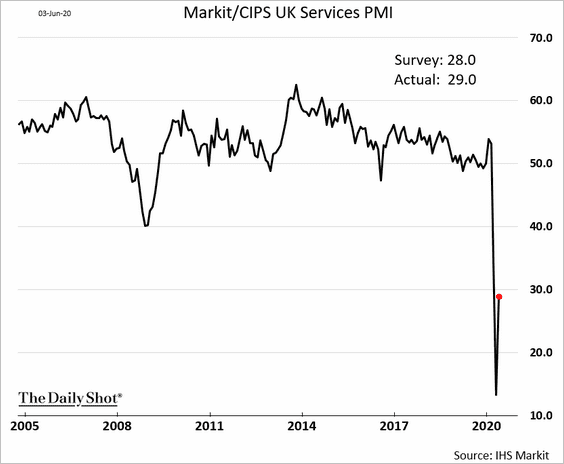
But the employment index rebound was relatively modest. The contraction remains more severe than the worst levels of the financial crisis.
——————–
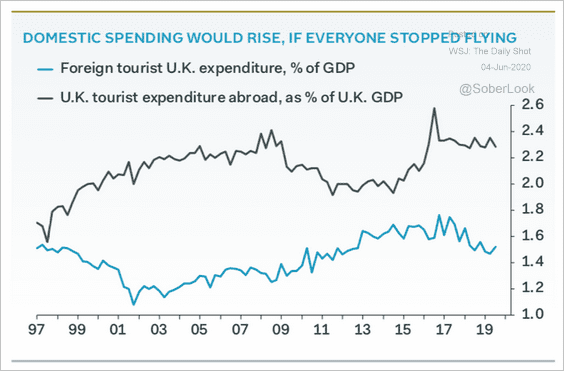
2. UK tourist expenditures abroad far exceed foreign visitors’ spending in Britain.
 Source: @samueltombs
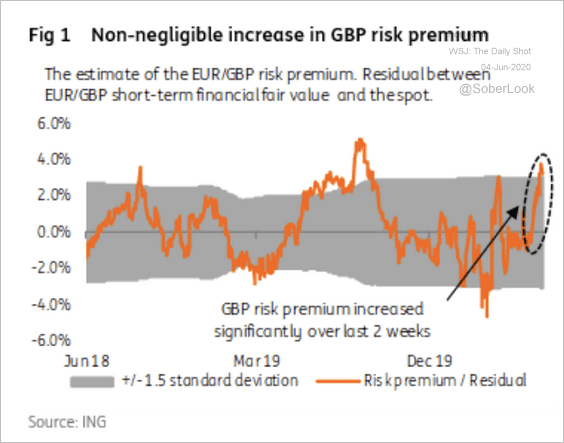
3. The British pound’s risk premium increased significantly over the past 2-weeks, partly due to Brexit risk.
 Source: ING
GBP/USD speculative short positioning is on the rise, but still less than last year’s levels.
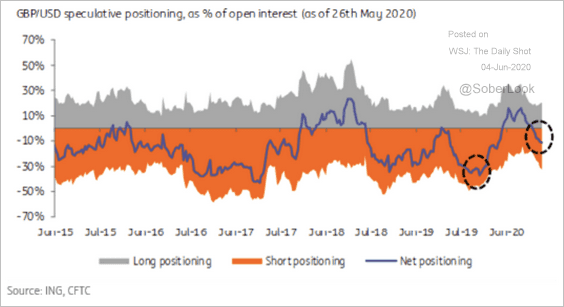 Source: ING
The Eurozone
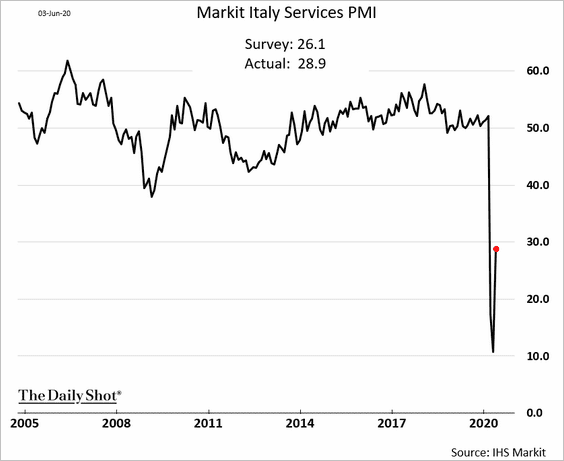
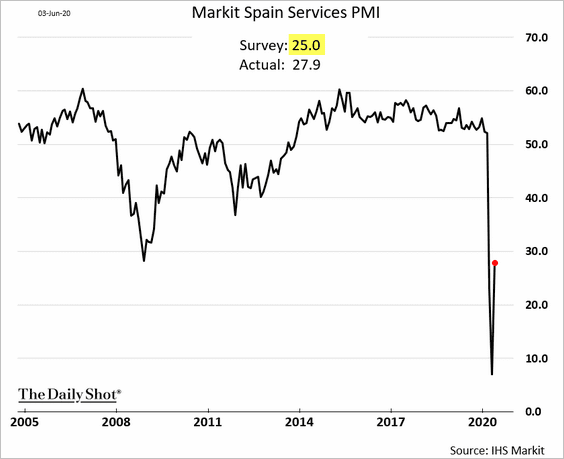
1. The May rebound in Spanish and Italian services PMI indicators surprised to the upside.
• Italy:
• Spain:
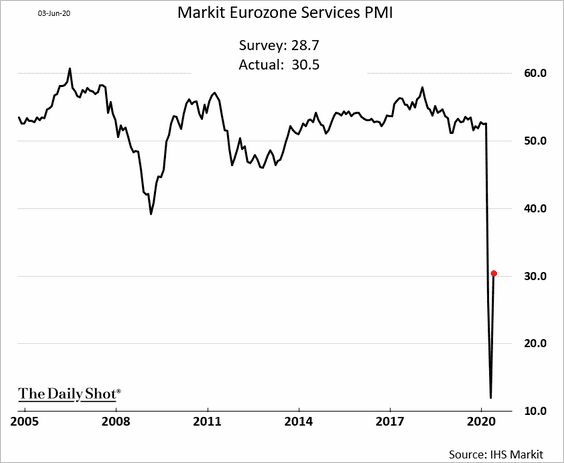
Below is the updated service-sector PMI at the Eurozone level.
And here is a nice summary of the PMI trends from March to May (from Goldman).
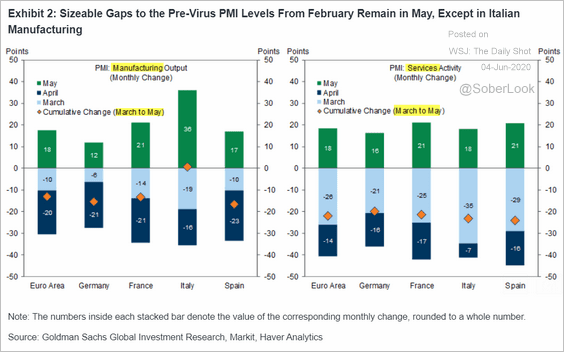 Source: Goldman Sachs
——————–
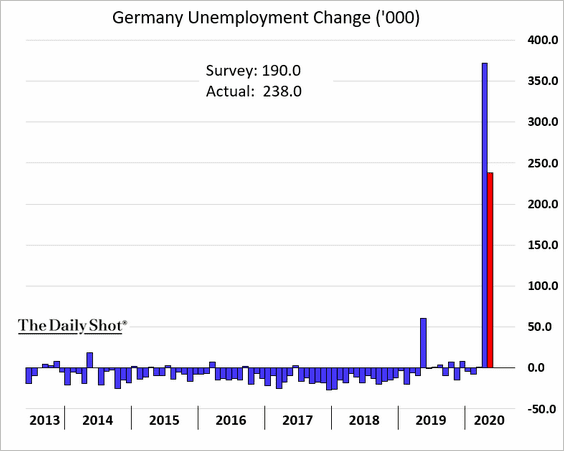
2. German unemployment rose sharply for the second month.
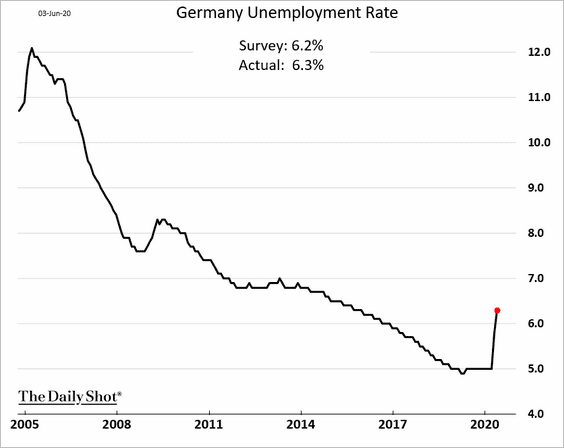
Here is the unemployment rate.
The “short-time work” (Kurzarbeit) is cushioning the hit to the labor market.
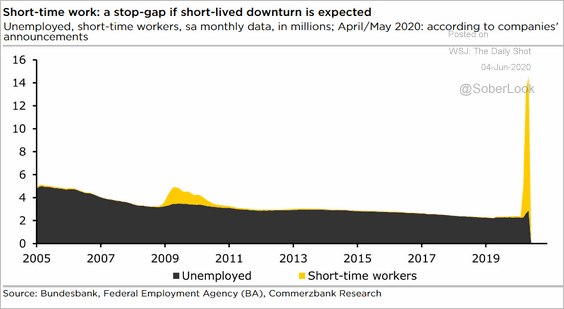 Source: Commerzbank Research
——————–
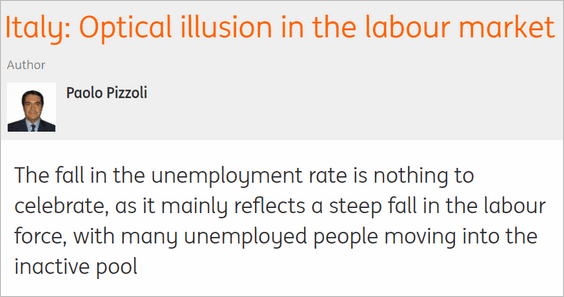
3. The Italian unemployment rate tumbled in May as the workforce shrunk.
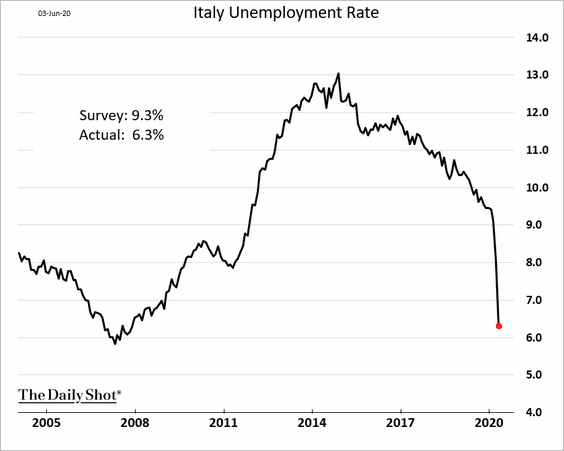
 Source: ING
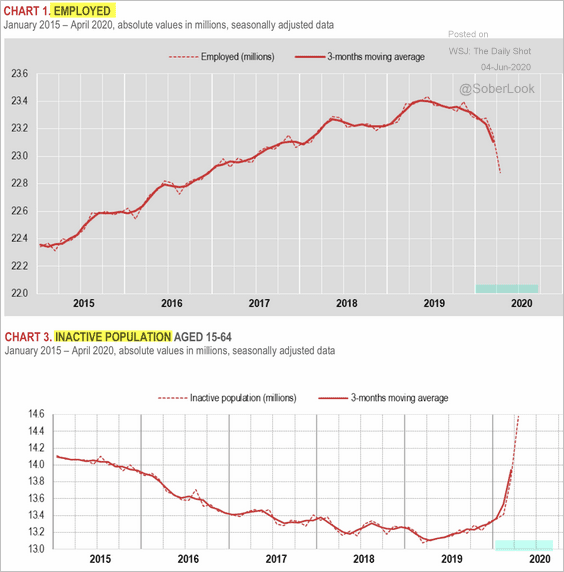 Source: Istat Read full article
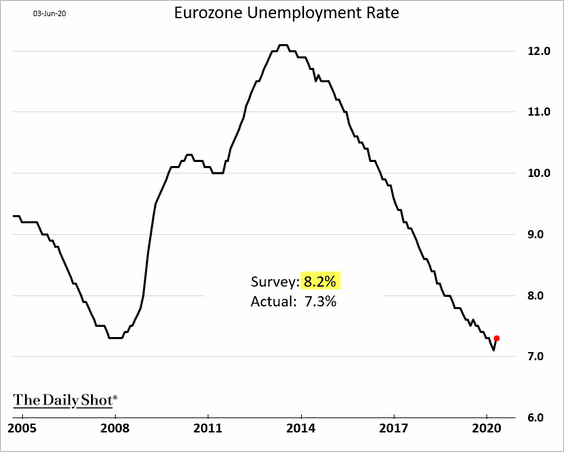
This contraction in the workforce kept the Eurozone’s unemployment rate subdued.
——————–
4. Euro-yen is testing downtrend resistance.
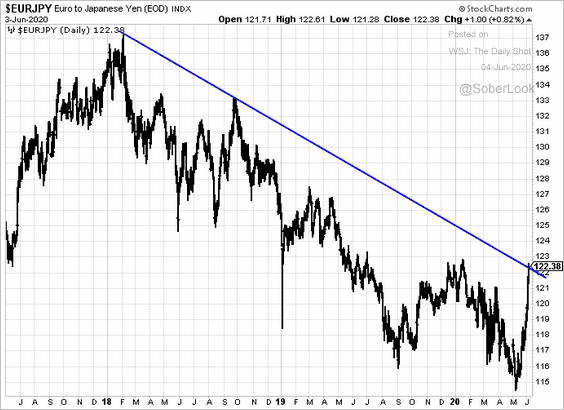 h/t Cormac Mullen
Europe
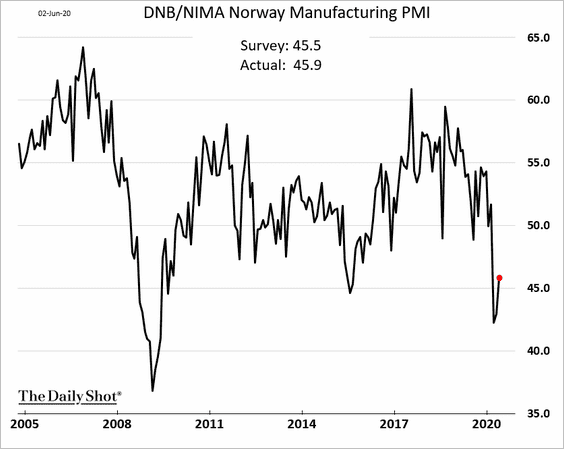
1. Norway’s factory activity showed signs of recovery in May.
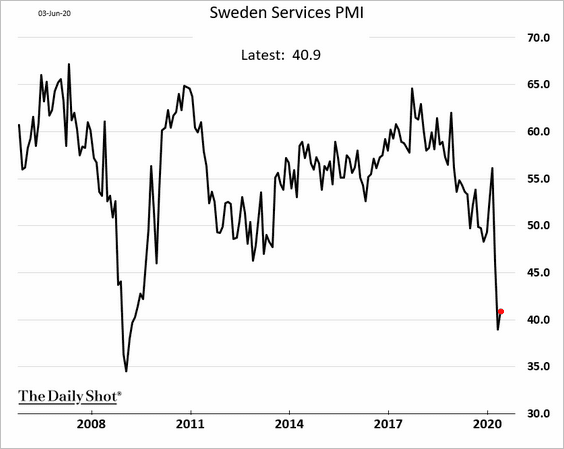
2. Sweden’s service-sector barely improved since April.
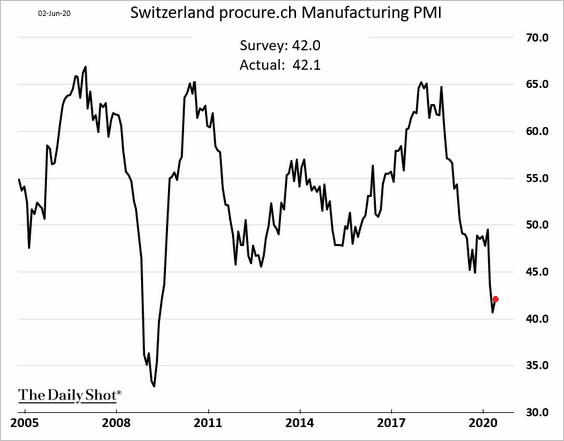
3. Switzerland’s GDP tumbled in the first quarter.
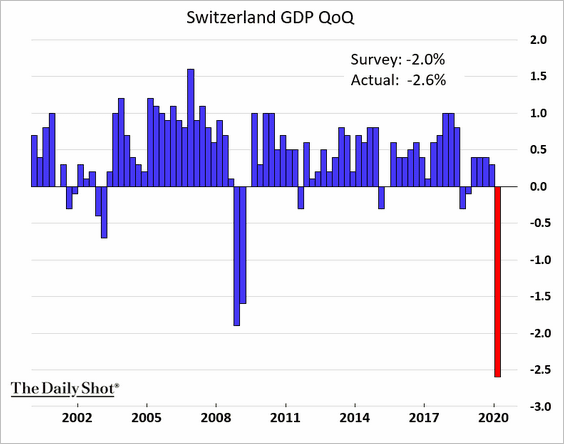
And there was almost no improvement in factory activity in May.
——————–
4. Reopening schools has the potential to speed up Europe’s recovery.
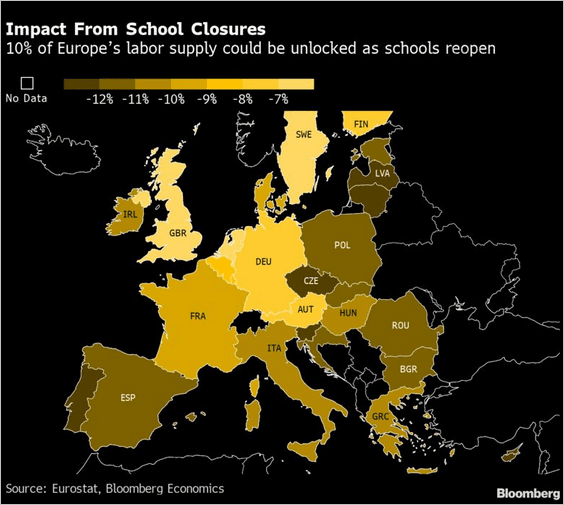 Source: @markets Read full article
Asia – Pacific
1. Japan’s yield curve has been steepening, especially at the long end.
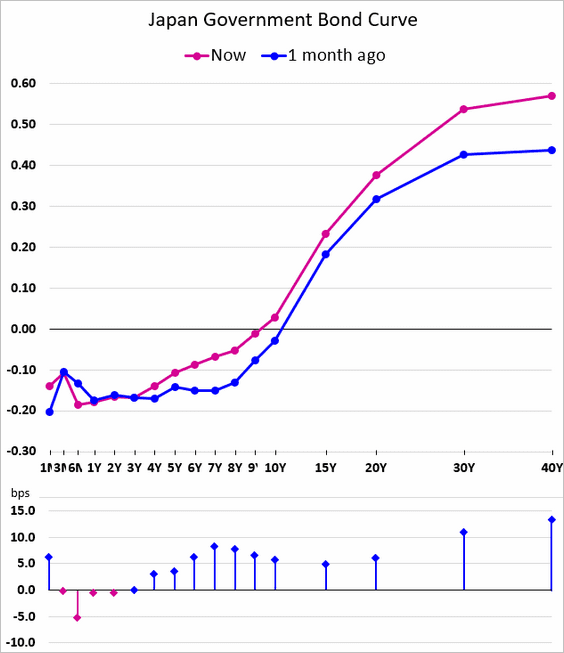
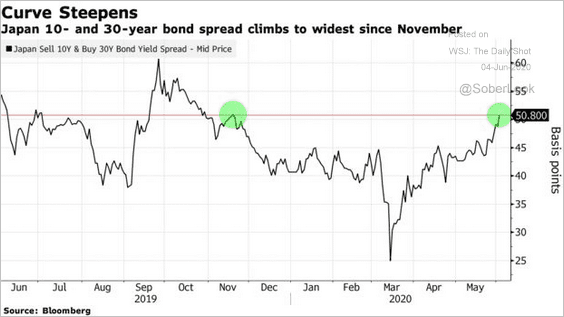 Source: @markets Read full article
——————–
2. South Korea’s budget deficit is expected to widen sharply this year, according to Goldman Sachs. Debt issuance will spike.
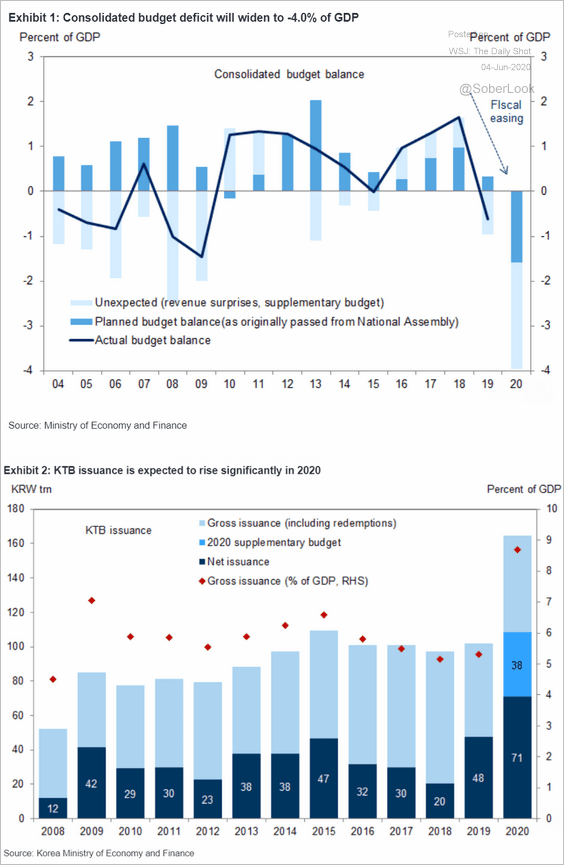 Source: Goldman Sachs
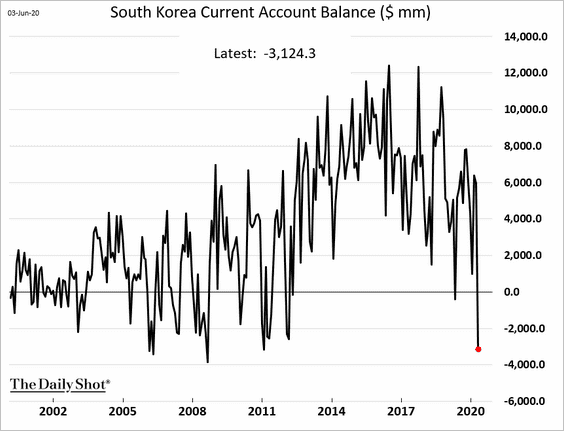
The nation’s current account has swung into deficit.
3. Australia’s 10yr bond yield is back above 1%.
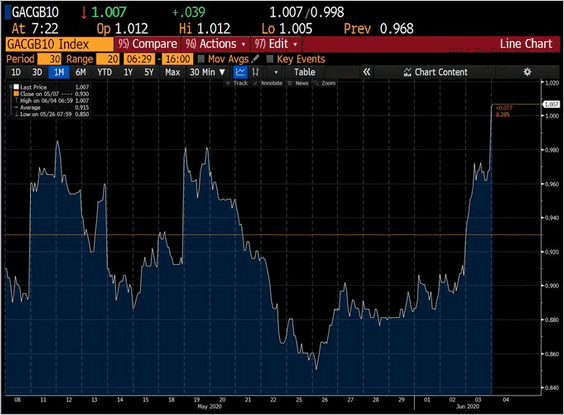 Source: @DavidInglesTV
This chart shows Australia’s tourism flows.
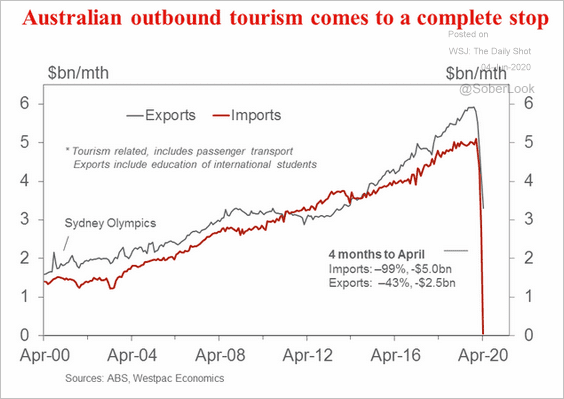 Source: @seandcallow, @WestpacMacro
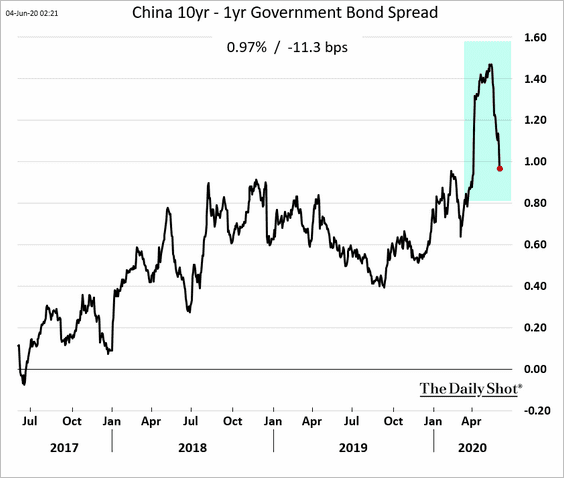
China
1. The yield curve has been flattening in recent days.
2. Mobile app activity shows increased searches for jobs and housing.
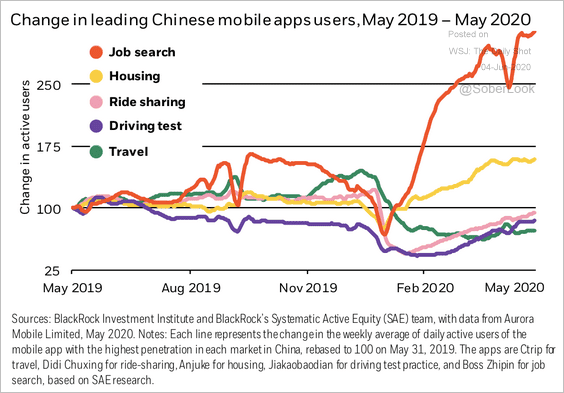 Source: BlackRock
3. Discretionary activities have been growing.
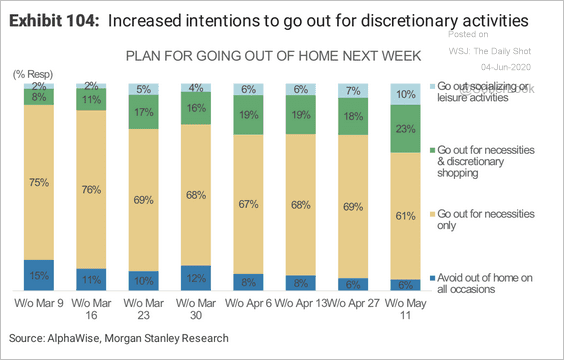 Source: Morgan Stanley Research
4. Excavator production is starting to recover along with surging shadow banking activity.
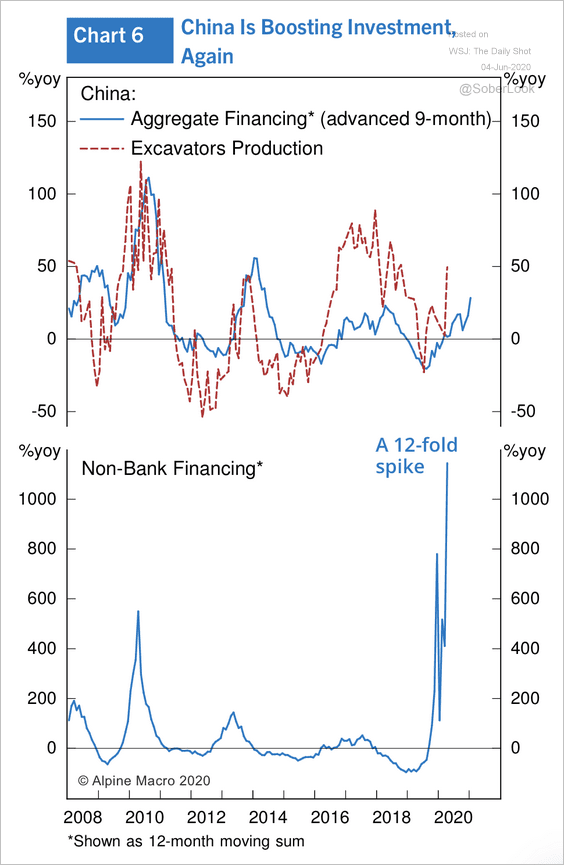 Source: Alpine Macro
But most of the acceleration in credit growth since February has been the result of firms replenishing depleting cash reserves rather than stocking up for capital expenditures, according to Gavekal.
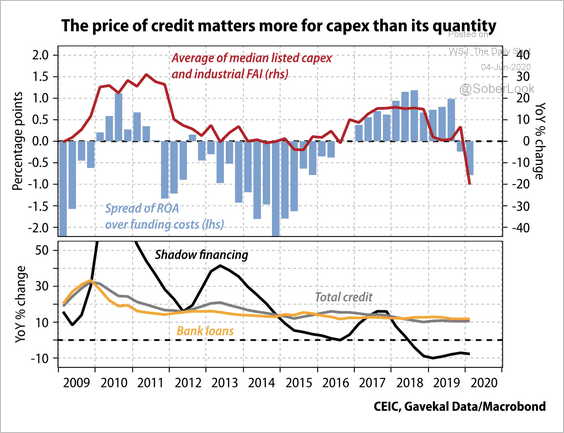 Source: Gavekal
——————–
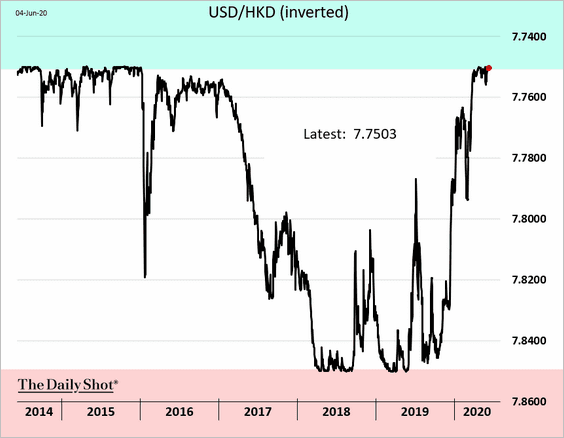
5. The Hong Kong dollar is at its upper HKMA boundary.
Emerging Markets
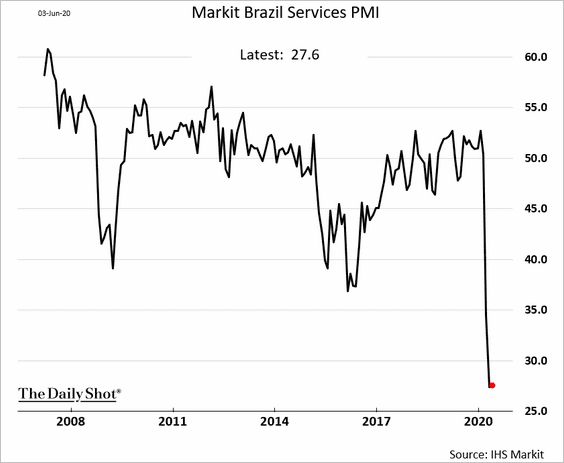
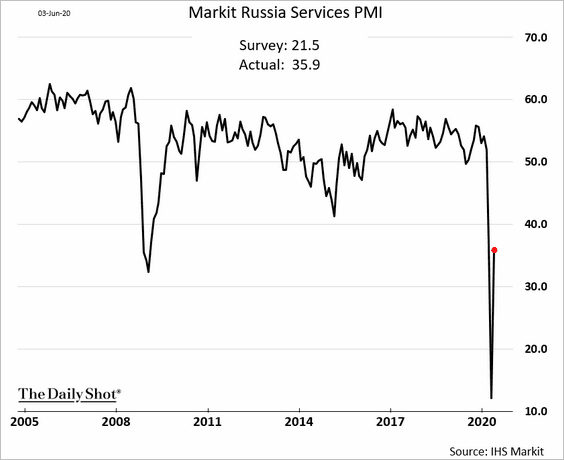
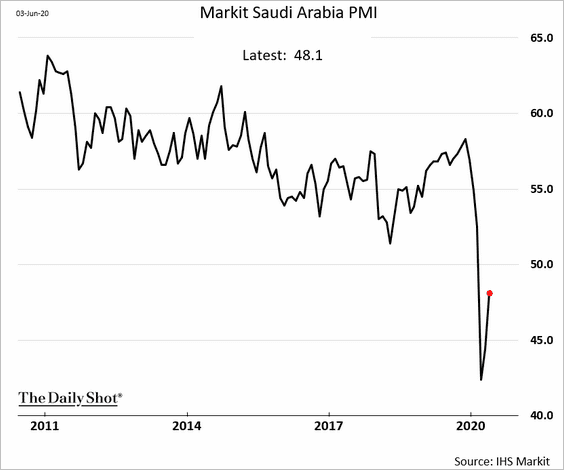
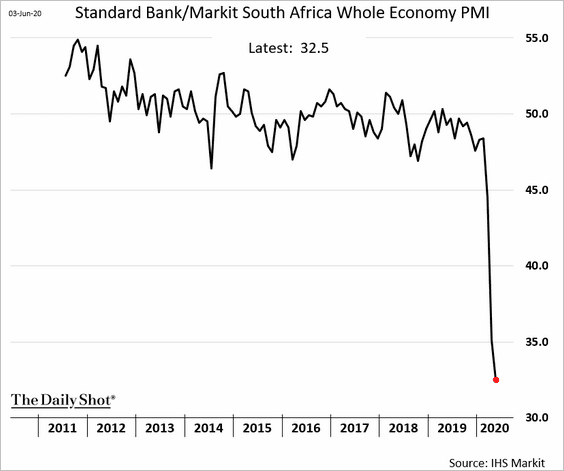
1. Let’s run through the PMI reports.
• Brazil’s services PMI (no improvement since April):
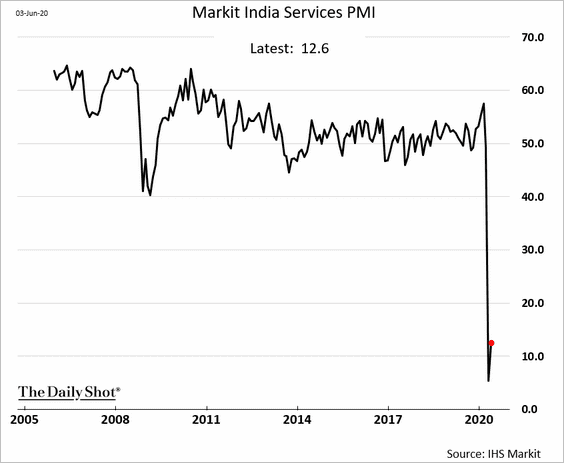
• India’s services PMI (extreme weakness persists):
• Russia’s services PMI (a strong rebound):
• Saudi Arabia’s PMI (signs of improvement):
• South Africa’s whole economy PMI (accelerating economic contraction):
——————–
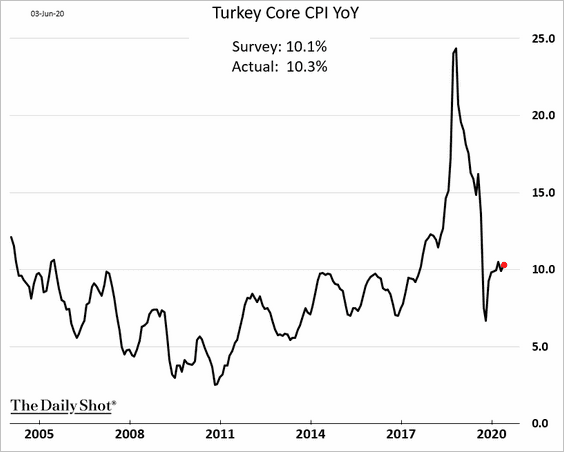
2. The Turkish core CPI is holding above 10%.
3. The Bank of Mexico still has room to cut rates.
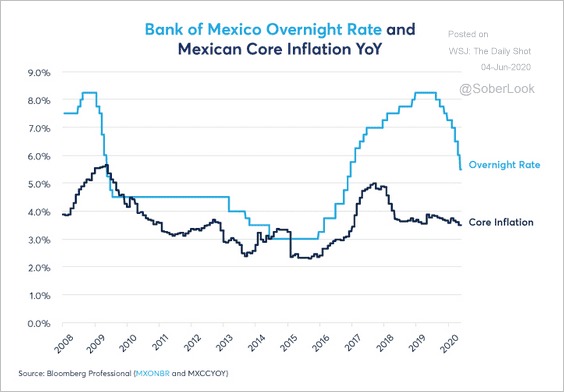 Source: @CMEGroup Read full article
It may be forced to do so as the pandemic worsens.
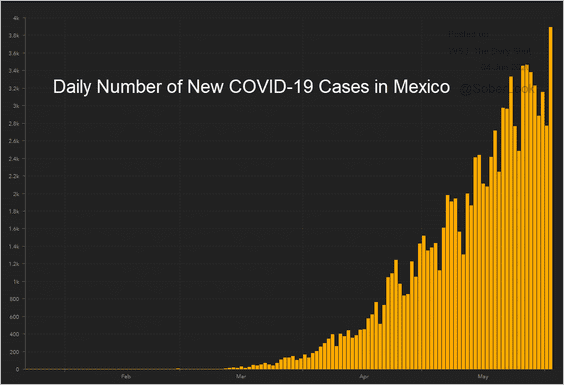 Source: JHU CSSE
——————–
4. This chart shows equity sector weightings based on MSCI’s country and regional indices.
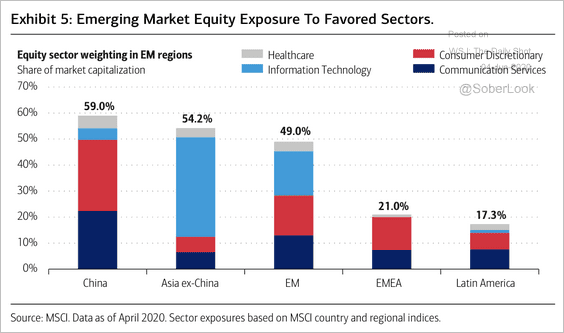 Source: BofA Merrill Lynch Global Research
Commodities
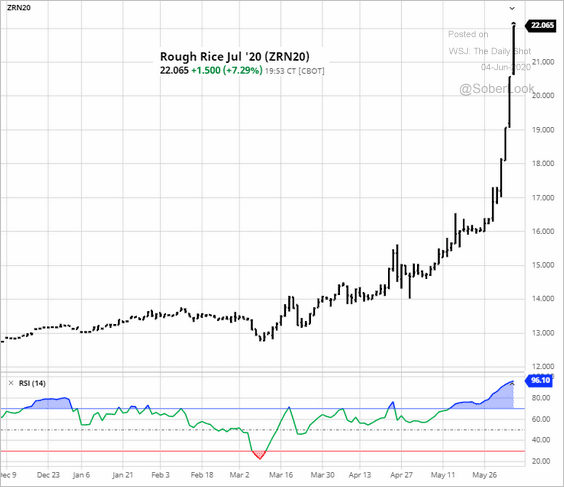
Rice futures have gone vertical. Here is a quote from Bloomberg’s Michael Hirtzer.
… low plantings in states such as Arkansas have boosted risks that supplies will stay tight after a short crop a year ago. At the same time, consumer demand has been heating up as more Americans cook at home during the pandemic.
 Source: barchart.com
Energy
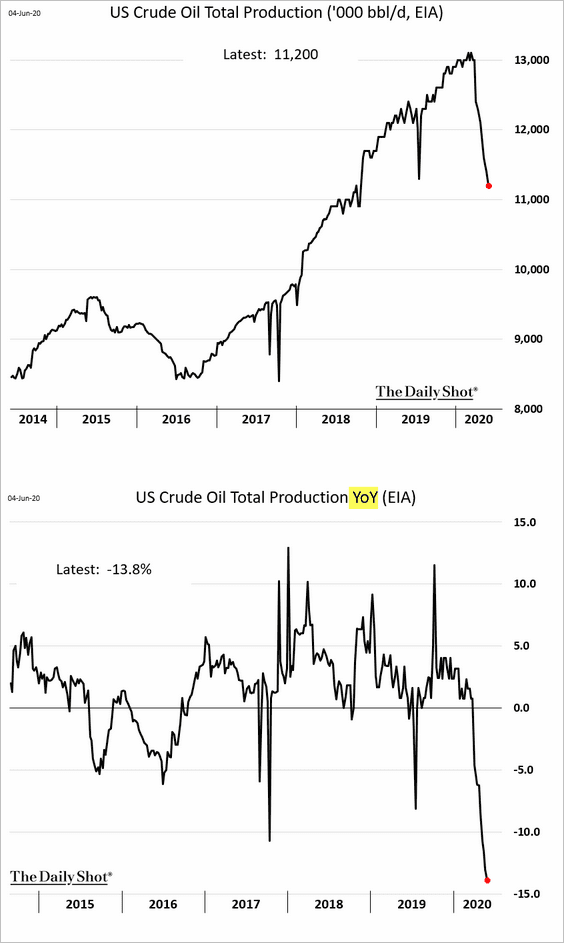
1. US crude oil output is down almost 14% from a year ago (second chart).
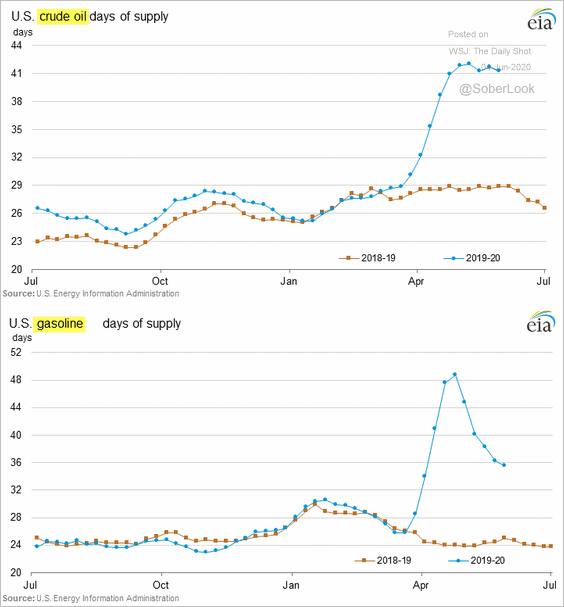
2. US crude oil inventories remain elevated. Gasoline inventories, measured in days of supply, continue to trend lower (second chart).
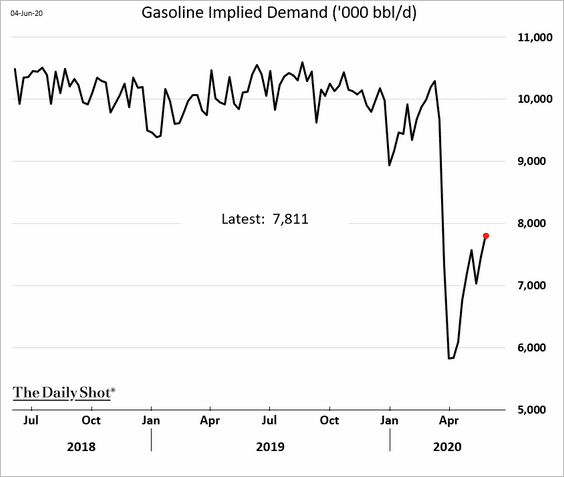
3. Gasoline demand is recovering but remains well below normal levels.
4. China’s share of Middle Eastern oil sales keeps growing.
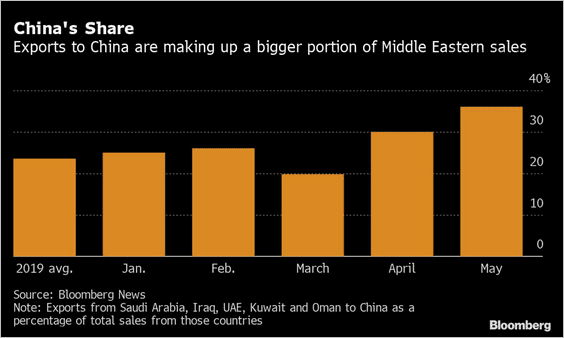 Source: @BloombergQuint Read full article
Equities
1. The market rally is looking increasingly stretched. The rebound has been remarkably fast …
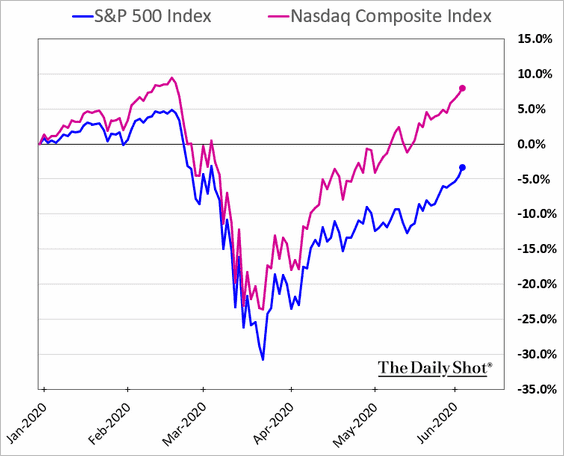
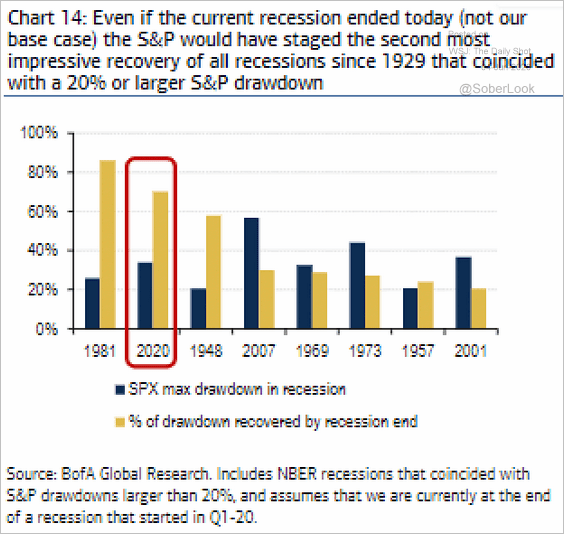 Source: @ISABELNET_SA, @BofAML
… and the key indices have risen some 40% from the lows.
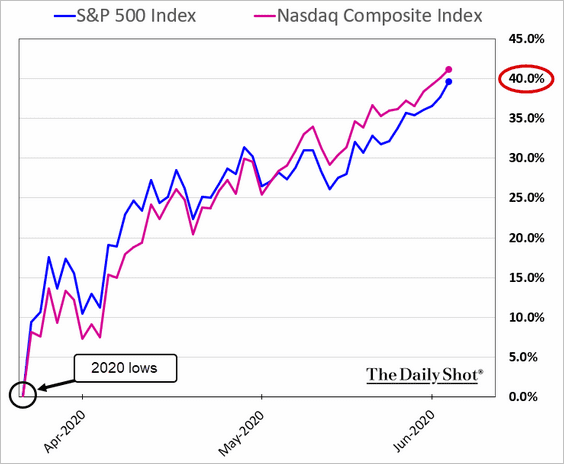 Source: Further reading
Here is the 50-day price change.
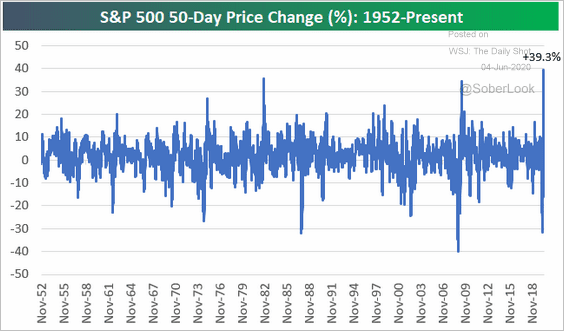 Source: @johnauthers, @bespokeinvest, @bopinion Read full article
The market is pricing in a V-shaped recovery.
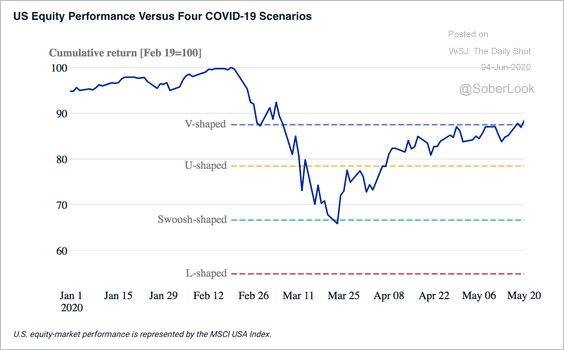 Source: MSCI Read full article
But economists expect more of a “swoosh.”
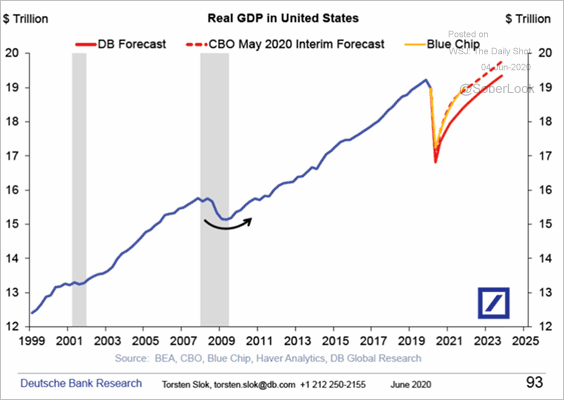 Source: Deutsche Bank Research
——————–
2. How will the stock market and earnings converge this time?
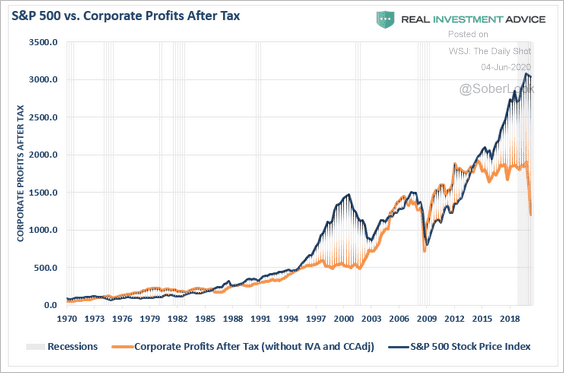 Source: @ISABELNET_SA, @LanceRoberts
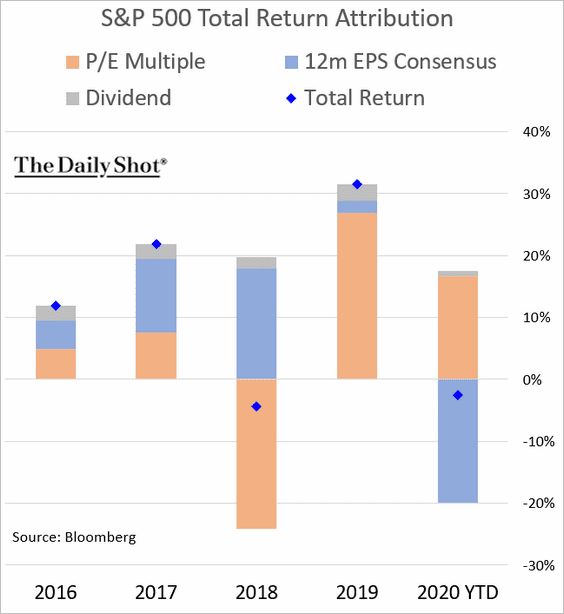
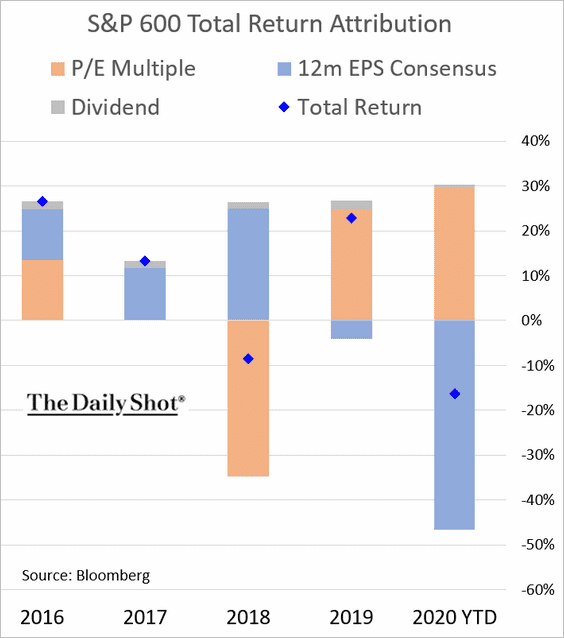
3. Here is the year-to-date performance attribution.
• S&P 500:
• S&P 600 (small caps):
——————–
4. The percent of stocks above their 200-day moving average is still fairly low.
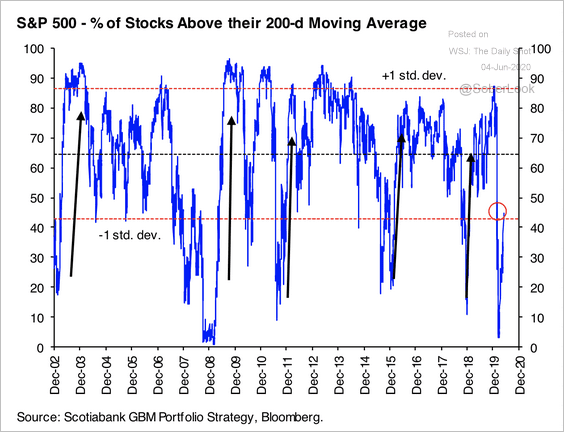 Source: Hugo Ste-Marie, Portfolio & Quantitative Strategy Global Equity Research, Scotia Capital
5. The put/call ratio tumbled amid increased risk appetite.
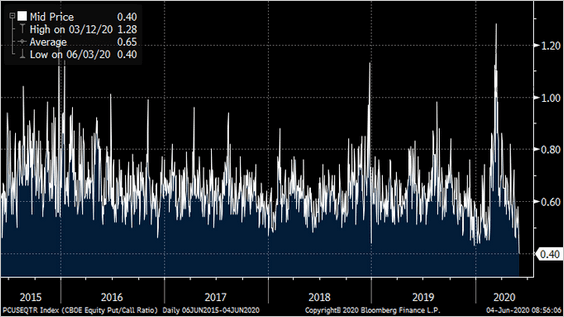 Source: @ThePainReport, @TheTerminal
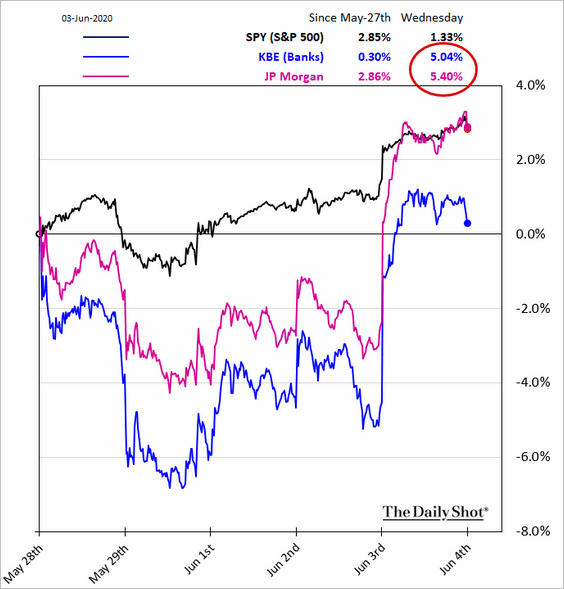
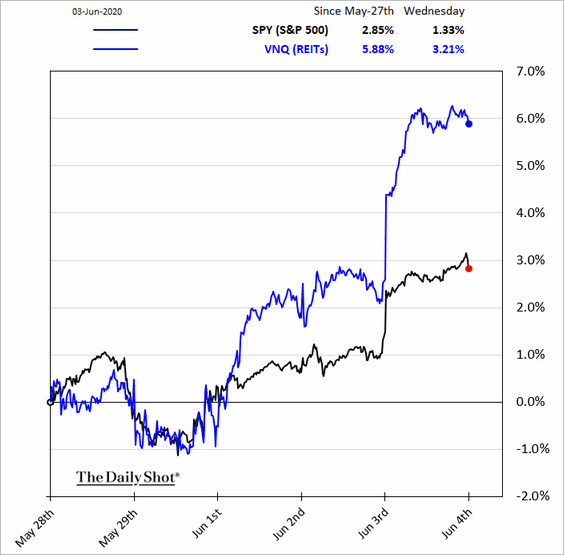
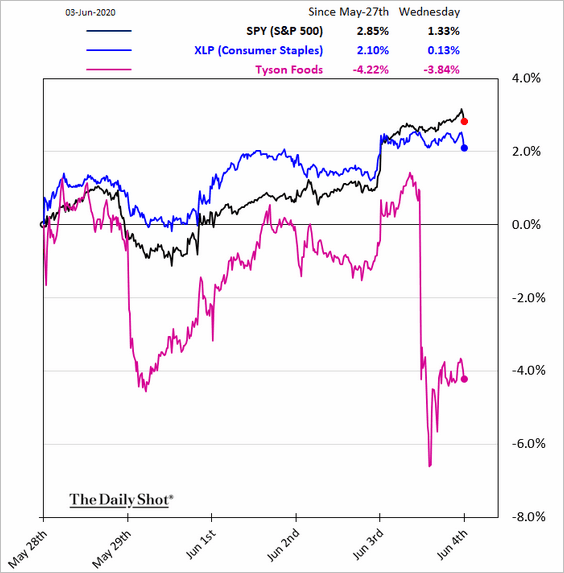
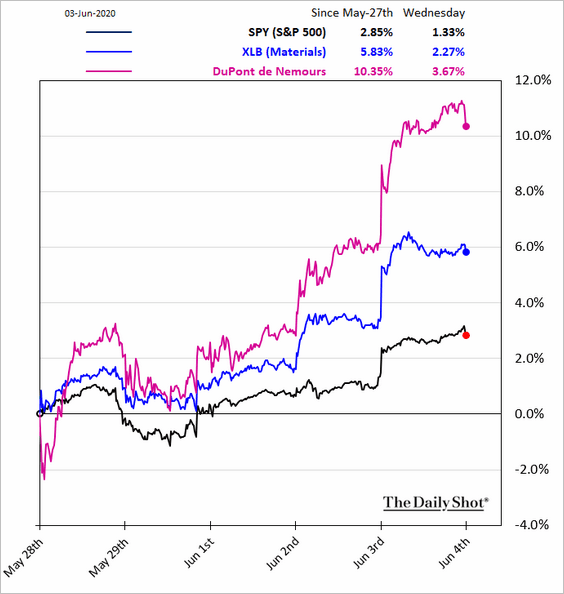
6. Next, we have some sector performance updates.
• Banks:
• REITs:
• Utilities (ETF flows):
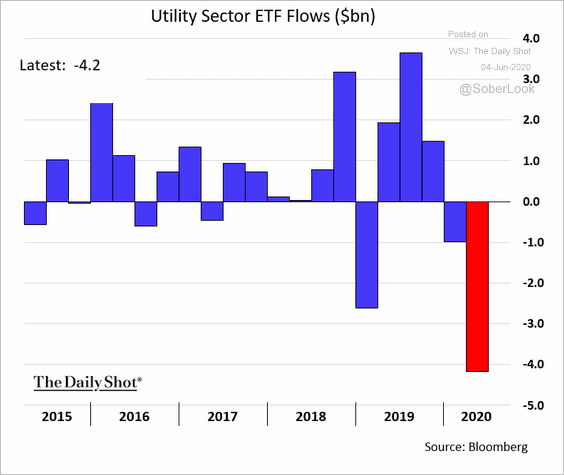 h/t Gerson Freitas
• Consumer Staples:
• Materials:
• Industrials:
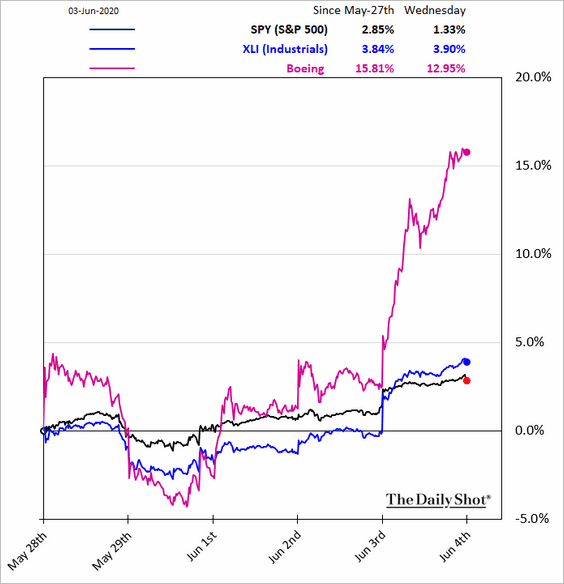
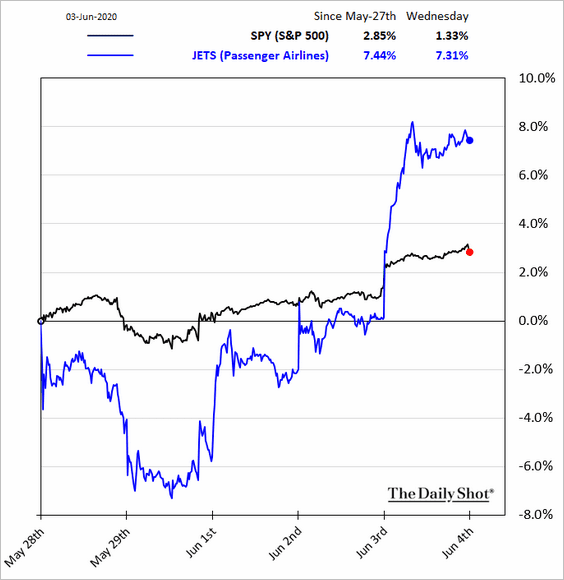
• Transportation (3 charts):
![]()
 Source: Further reading
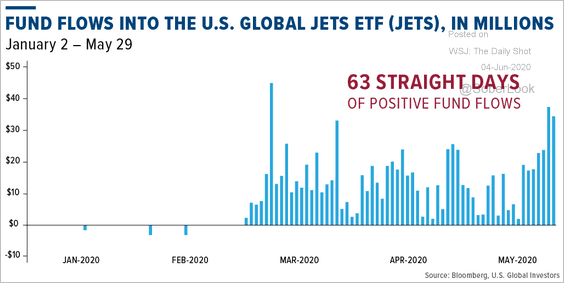 Source: U.S. Global Investors
Rates
1. The spread between consumer expectations and current conditions points to a steeper Treasury curve ahead.
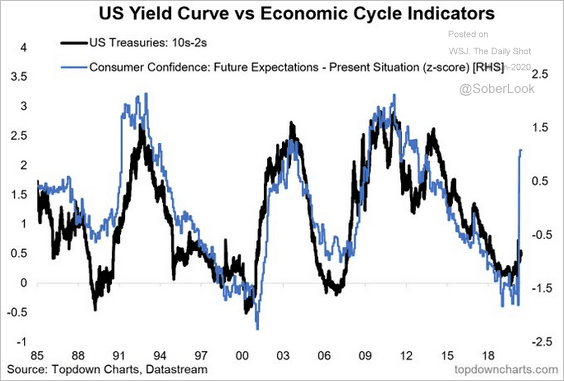 Source: @Callum_Thomas, @topdowncharts
2. 90% of global government debt is yielding less than 1%.
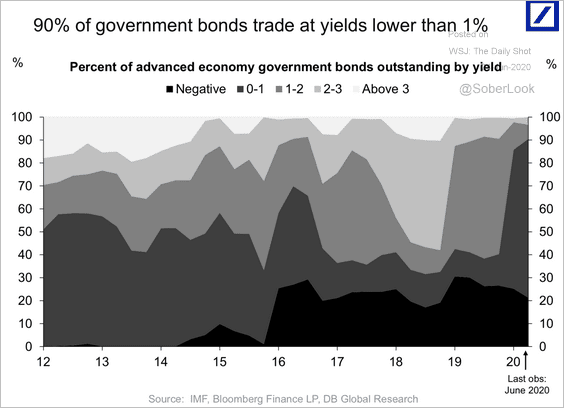 Source: Deutsche Bank Research
3. Despite a weaker US dollar (as risk appetite returns), the 10yr Treasury yield has not budged.
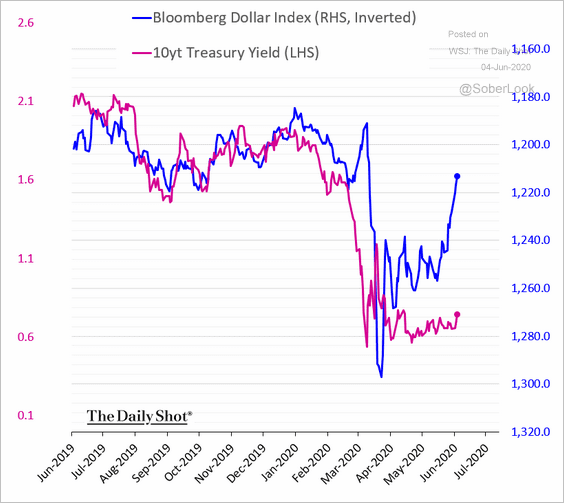 h/t Cormac Mullen
——————–
Food for Thought
1. Consumer expenditures by those under and over 65 years of age:
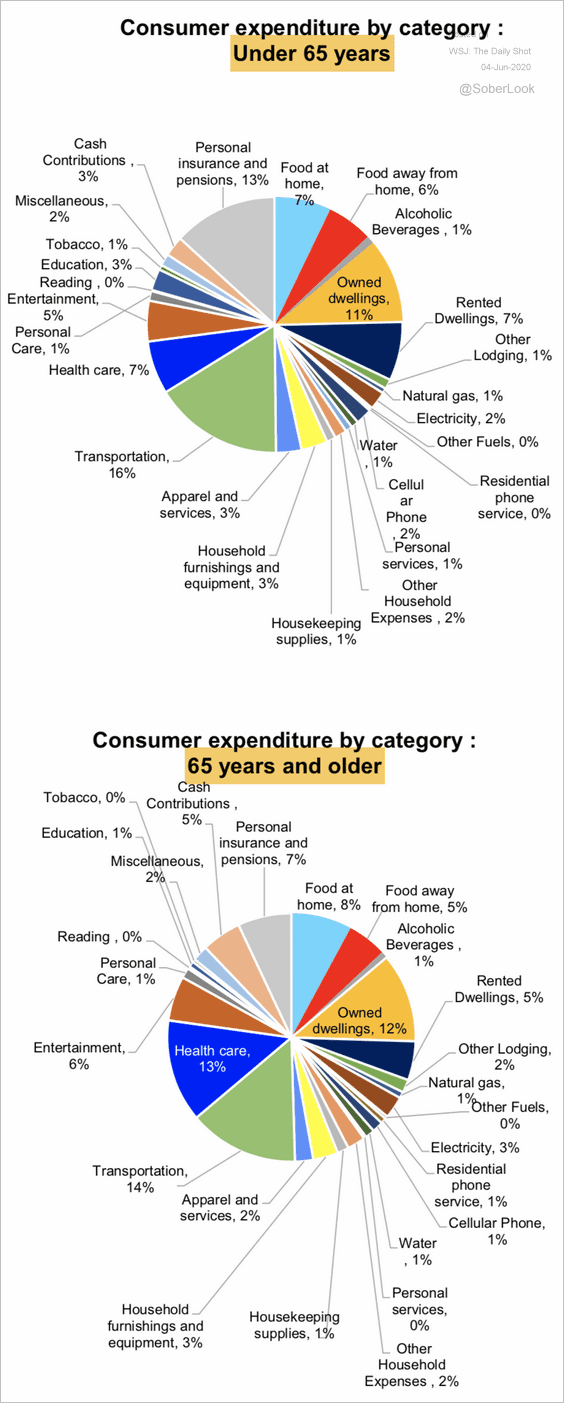 Source: Deutsche Bank Research
2. Growth in the US working-age population:
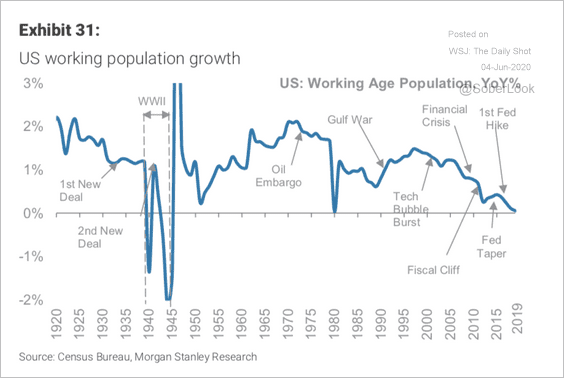 Source: Morgan Stanley Research
3. When will restaurants be back to normal?
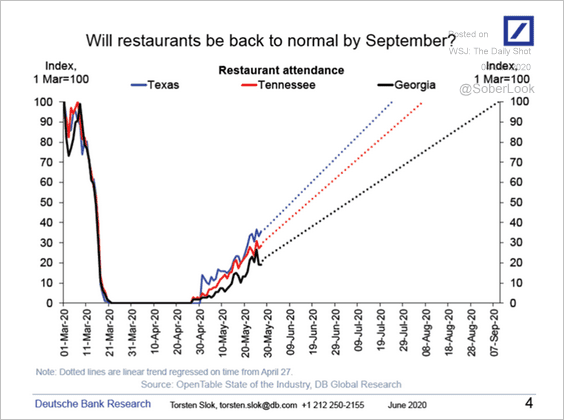 Source: Deutsche Bank Research
4. Small business closures by sector:
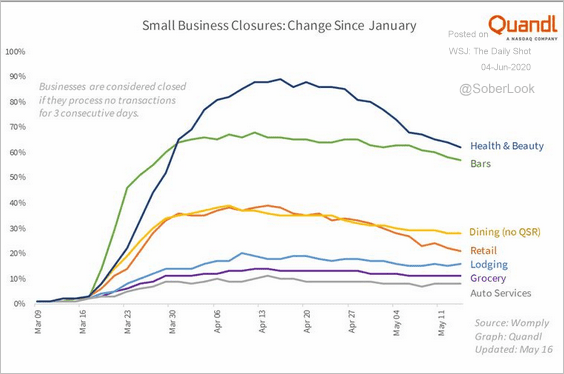 Source: @markets Read full article
5. Iran’s second wave:
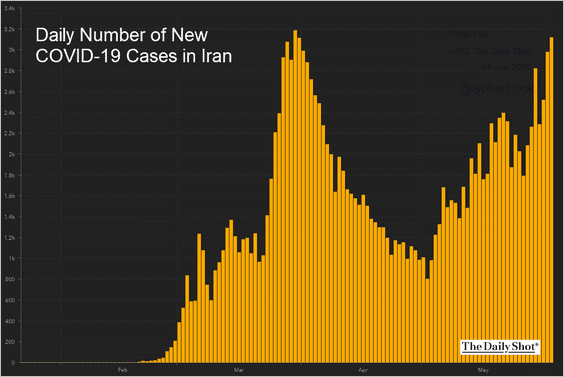 Source: JHU CSSE
6. Vaccine development:
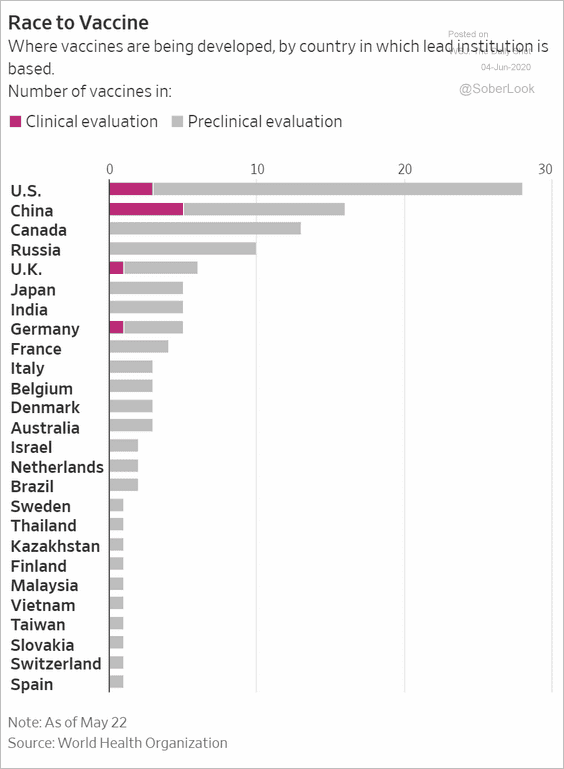 Source: @WSJ Read full article
7. New infections in the US and Europe:
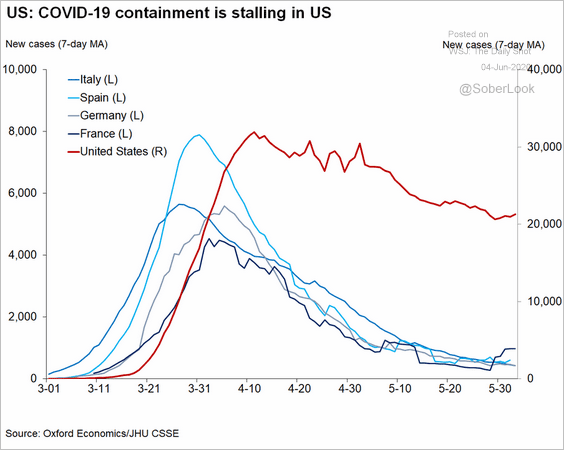 Source: @GregDaco
8. Betting markets’ odds for the US presidential elections:
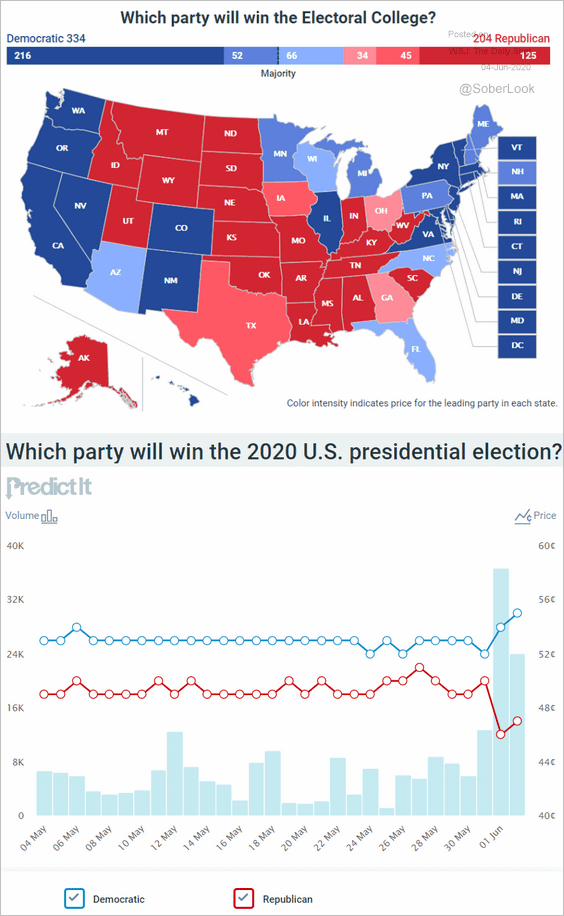 Source: @PredictIt
9. Face mask effectiveness:
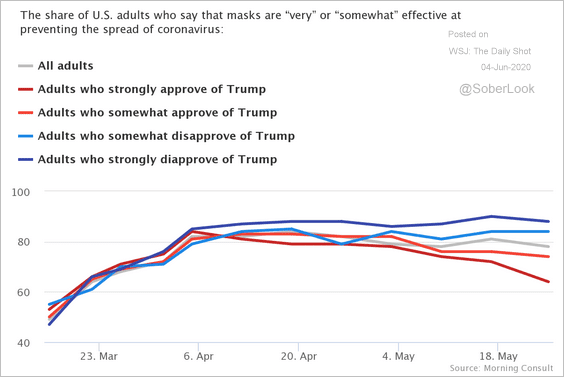 Source: Morning Consult Read full article
10. Survivorship bias:
 Source: @Rakapital Read full article
——————–