
The Daily Shot: 17-Jun-20
• The United States
• The United Kingdom
• The Eurozone
• Europe
• Japan
• Asia – Pacific
• China
• Emerging Markets
• Commodities
• Equities
• Credit
• Global Developments
• Food for Thought
The United States
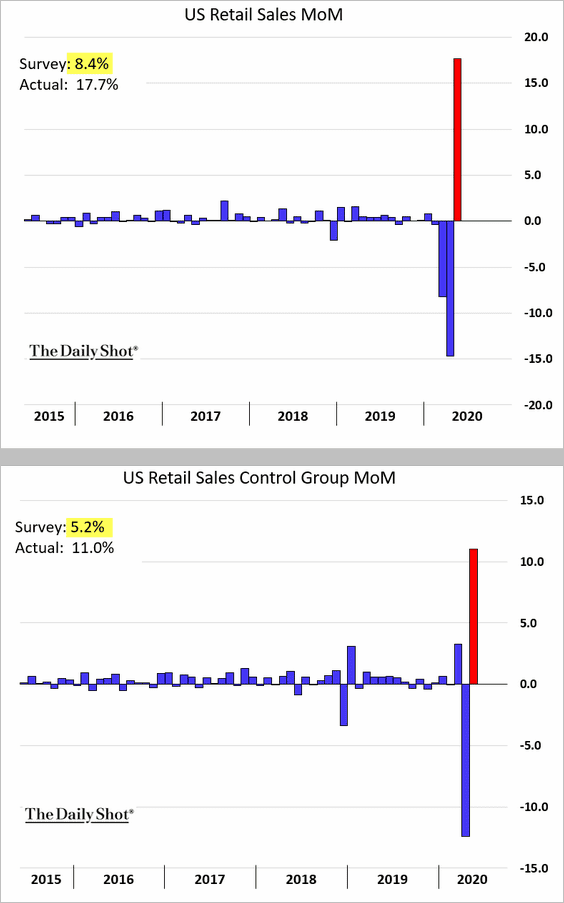
1. Retail sales rebounded sharply in May, topping economists’ forecasts. The “control group” (second chart) excludes volatile sectors such as autos, building materials, gasoline, etc.
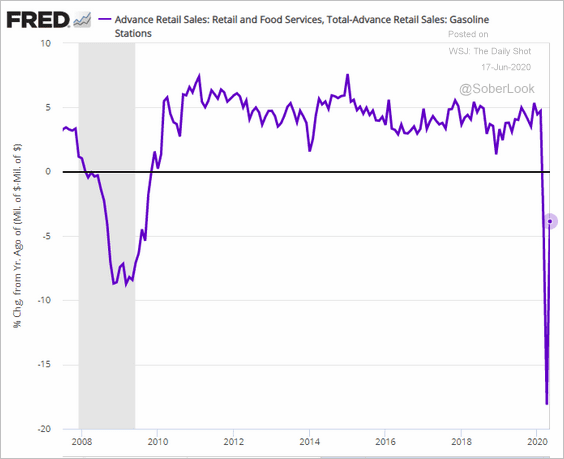
Here is the year-over-year chart (ex. gasoline sales).
How much have retail sales changed since February (by sector)?
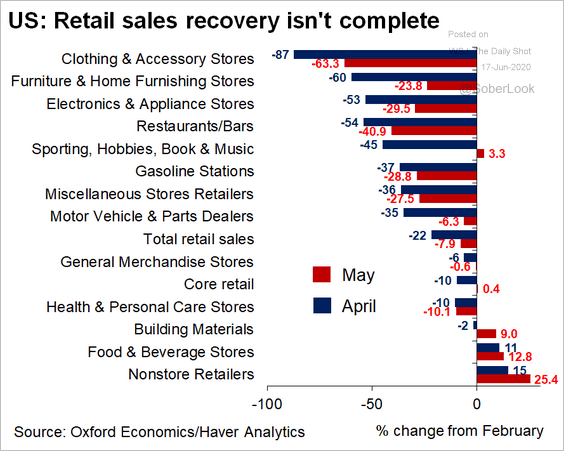 Source: @GregDaco, @OxfordEconomics
These charts show a couple of sector trends in retail sales (dollar amounts).
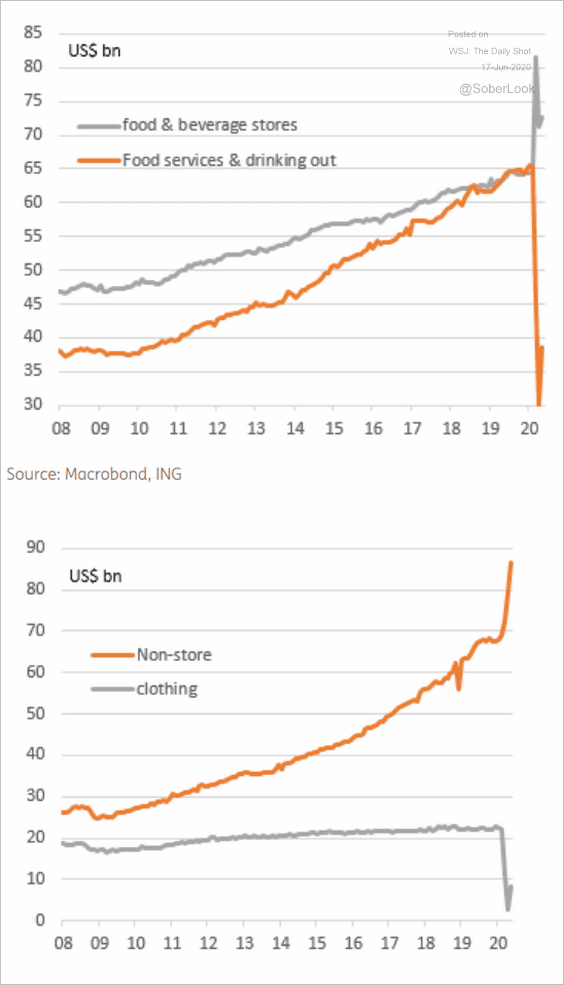 Source: ING
——————–
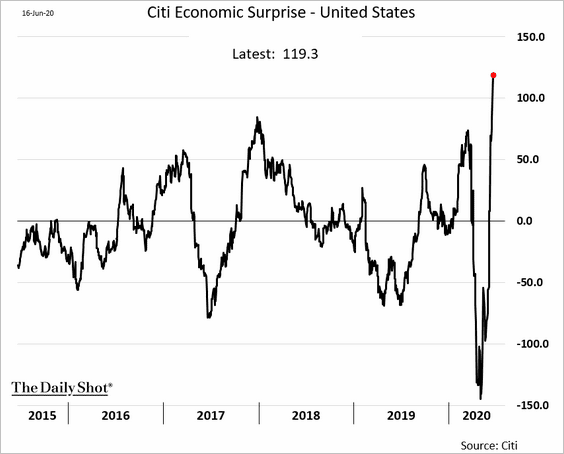
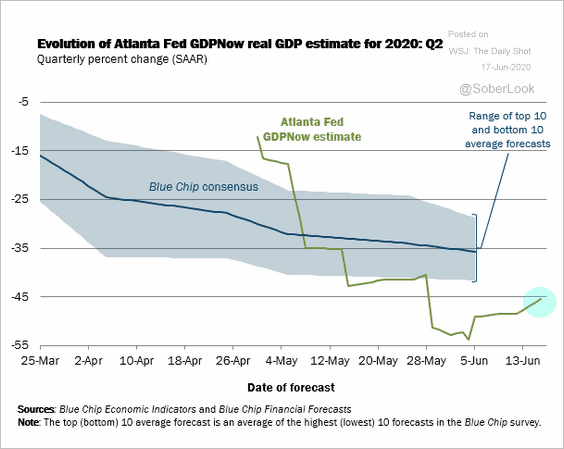
2. The rebound in retail sales sent the Citi Economic Surprise Index to a new high and boosted the Atlanta Fed’s GDPNow Q2 growth forecast (second chart).
 Source: Atlanta Fed
——————–
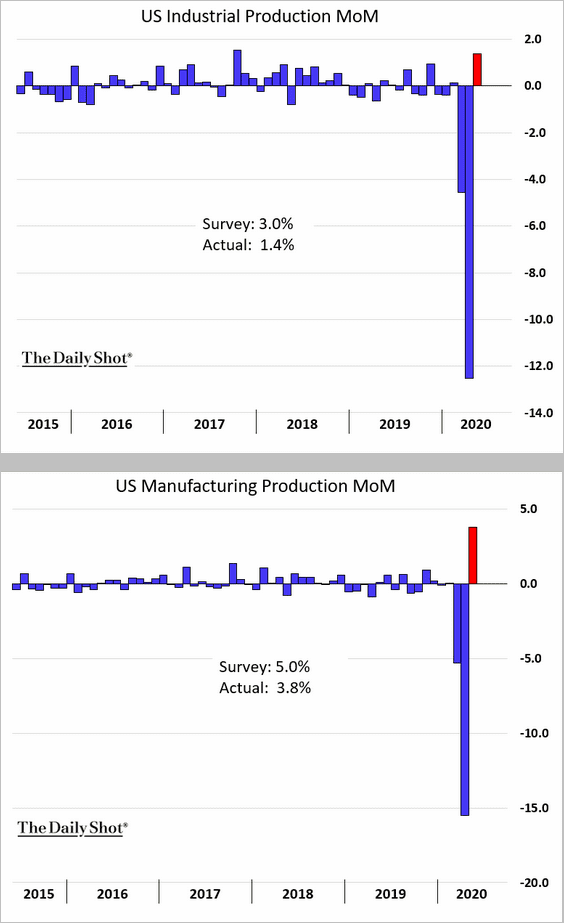
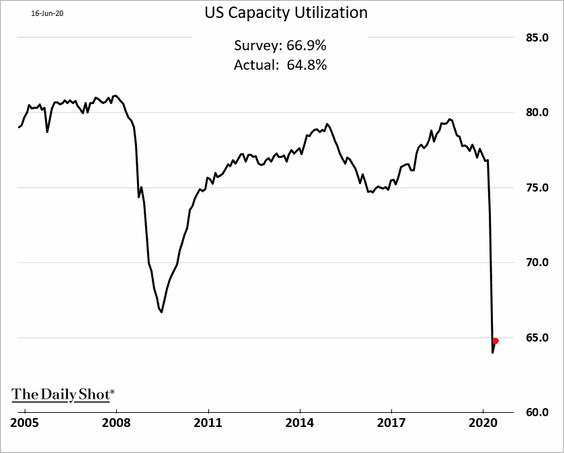
3. Industrial production saw a modest bounce in May.
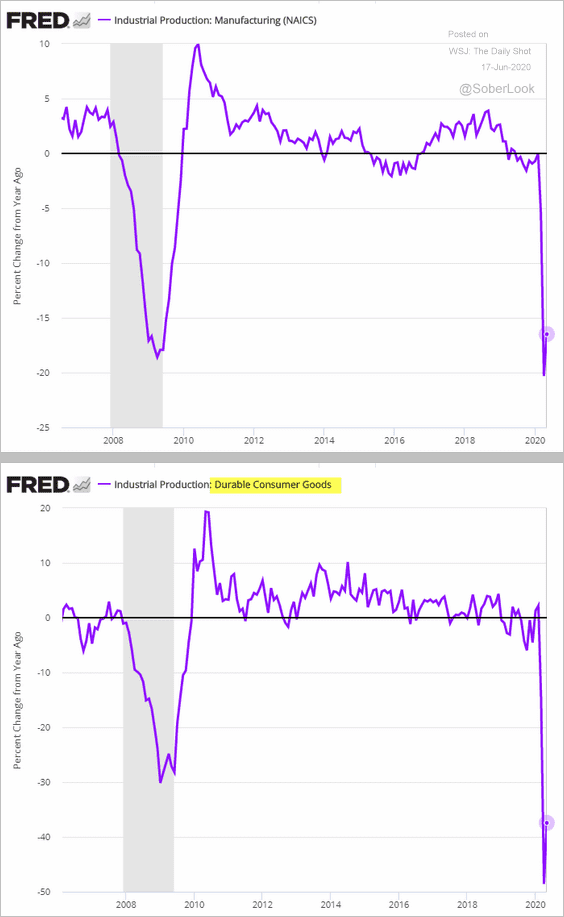
Here is the year-over-year change in manufacturing output.
And this chart shows the components of industrial production (levels).
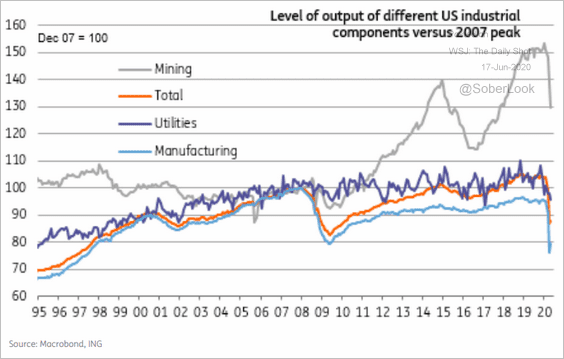 Source: ING
Capacity utilization remains well below the worst levels of 2008/09. As a result, business investment recovery will take a long time.
——————–
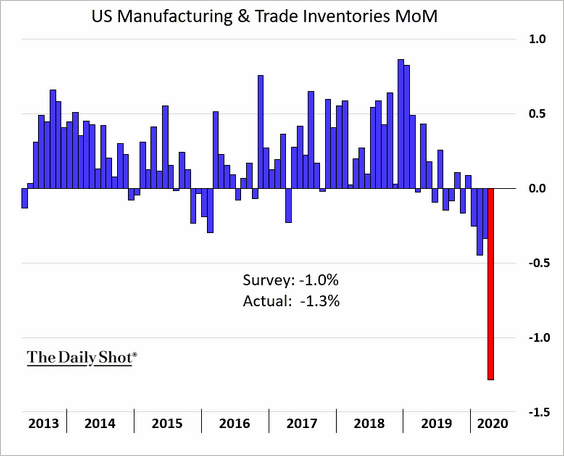
4. Business inventories declined sharply in April.
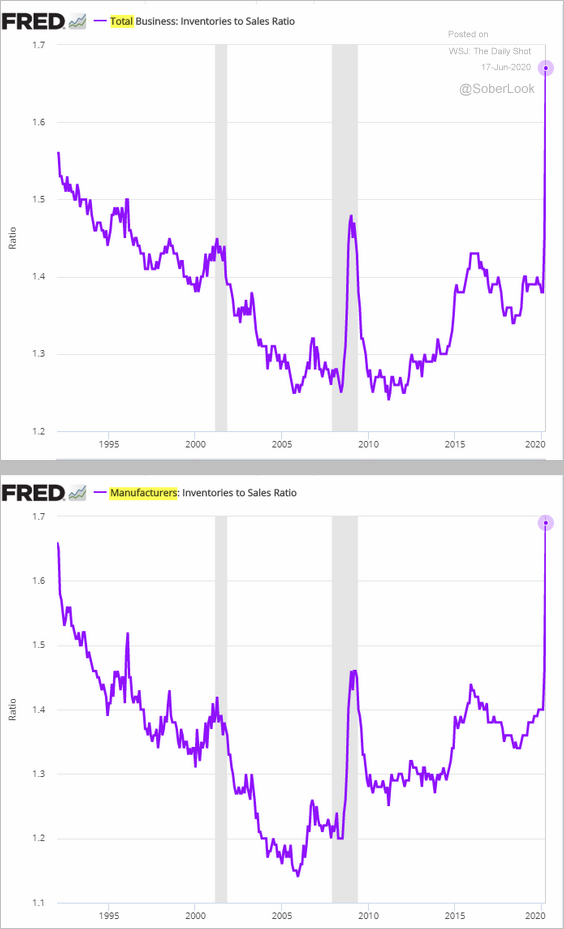
Nonetheless, the inventory-to-sales ratio hit a new high.
——————–
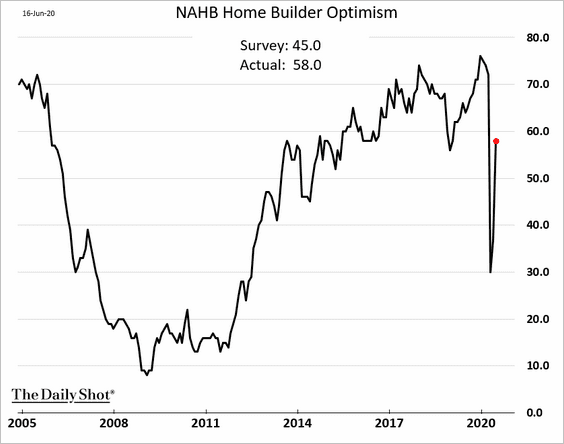
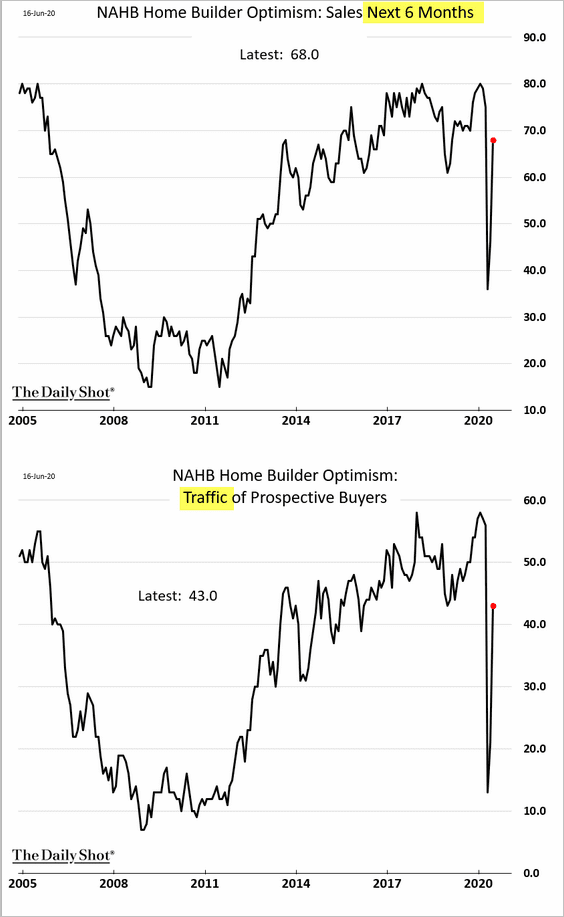
5. Homebuilder optimism recovered further this month as demand picks up (3 charts).
——————–
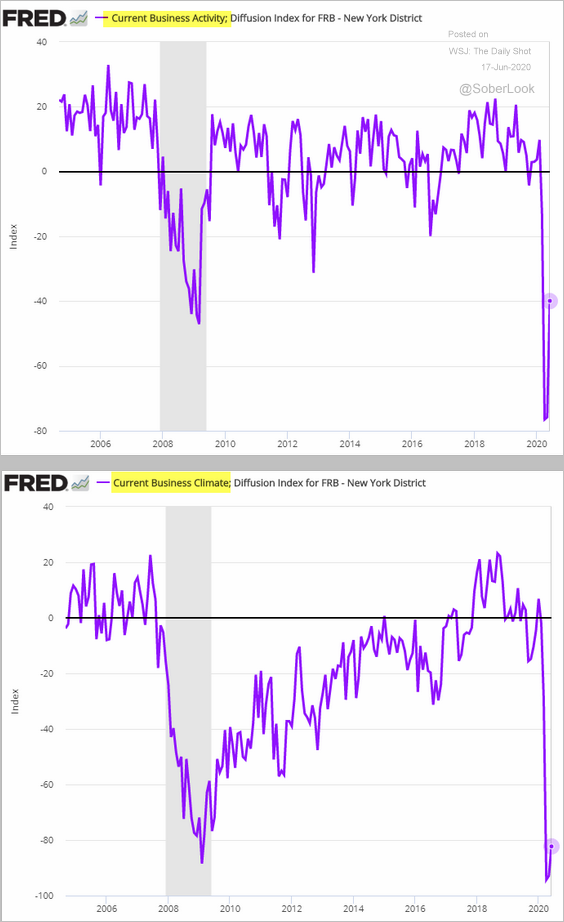
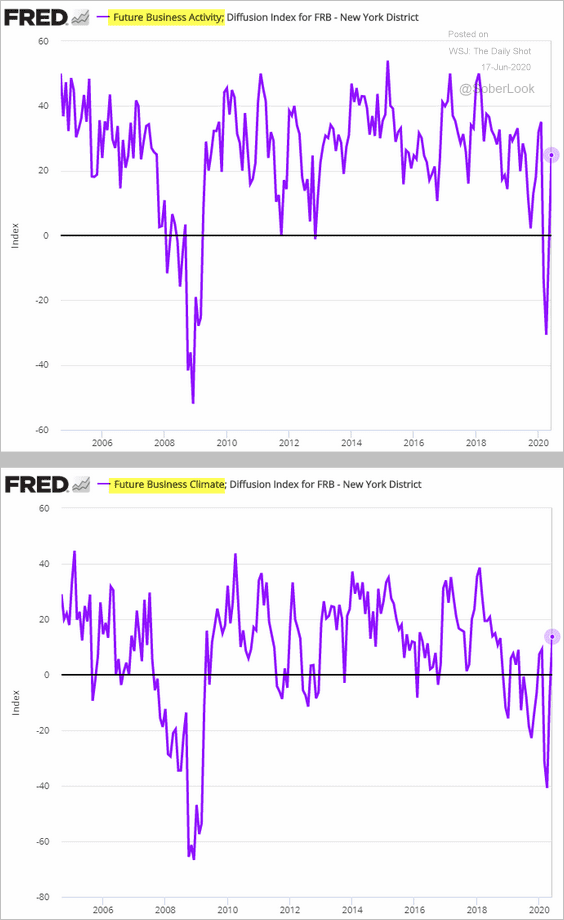
6. The NY Fed’s regional service sector index improved somewhat in June, but activity remains soft.
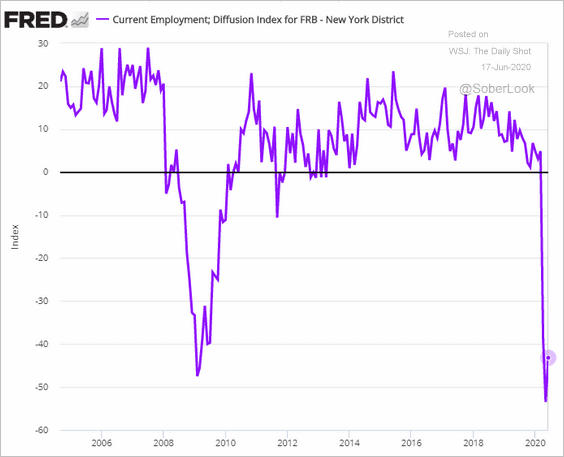
Here is the service-sector employment index.
However, forward-looking indicators show rising optimism.
——————–
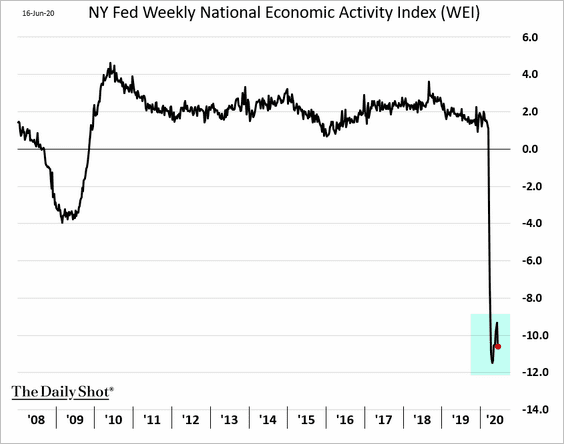
7. Next, let’s take a look at some high-frequency national economic activity trackers.
• From Oxford Economics:
![]() Source: Oxford Economics
Source: Oxford Economics
• From ANZ:
![]() Source: ANZ Research
Source: ANZ Research
• The NY Fed’s economic activity index:
——————–
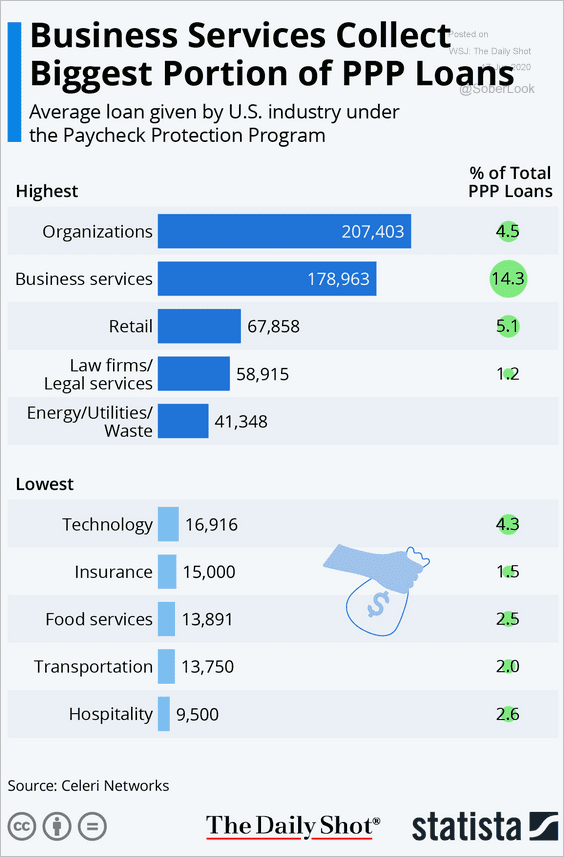
8. Finally, we have some data on the PPP program (from Celeri Networks).
 Source: Statista
The United Kingdom
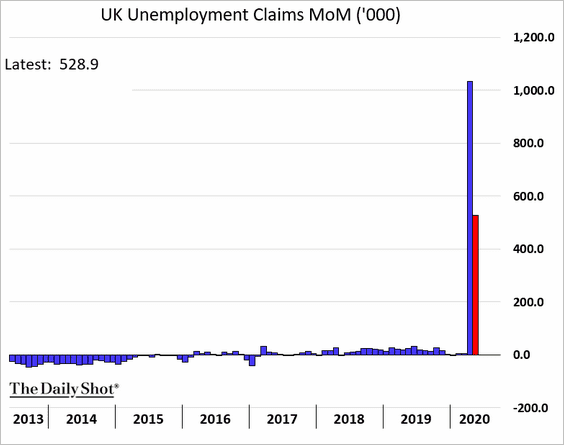
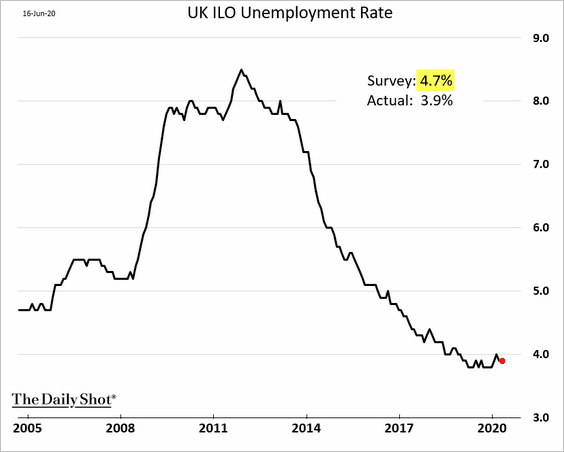
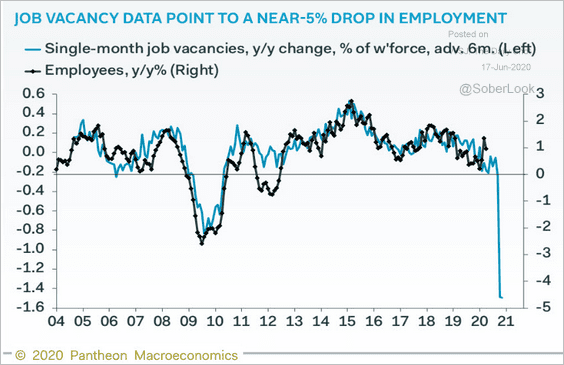
1. Let’s begin with the labor market.
• Unemployment claims rose by over half a million last month.
• Wage growth continues to moderate.
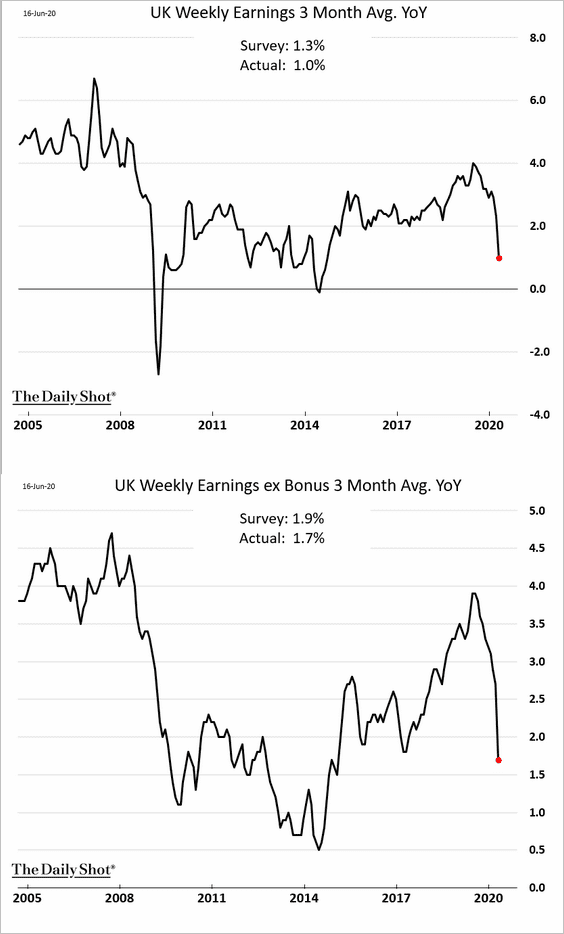
• The unemployment rate remained surprisingly stable in April.
• Here is a comment from Samuel Tombs, Pantheon Macroeconomics.
The UK jobs data have been kept in suspended animation by the furlough scheme, which now has helped 8.7m stay on the payroll. The slump in vacancies points to a second wave of redundancies in autumn, when many furloughed workers will be laid off and unable to find new work.
 Source: @samueltombs
——————–
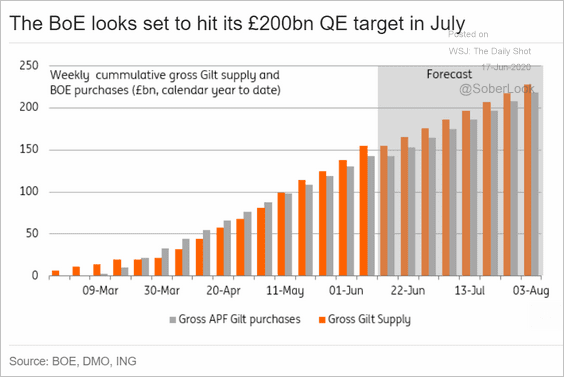
2. The BoE will likely hit its QE target in July but will need to continue buying gilts to keep up with the issuance.
 Source: ING
The Eurozone
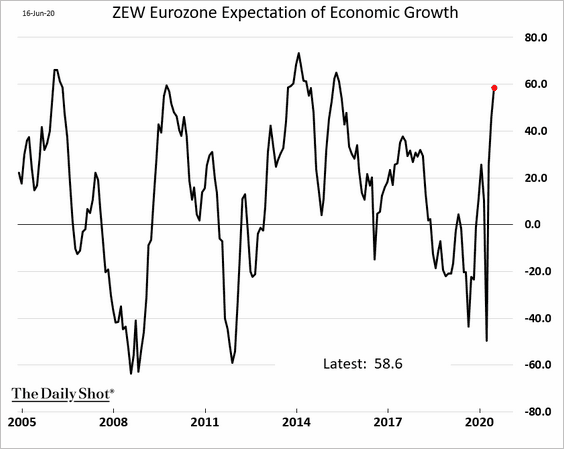
1. The ZEW expectations index shows a sharp rebound in optimism in Germany.
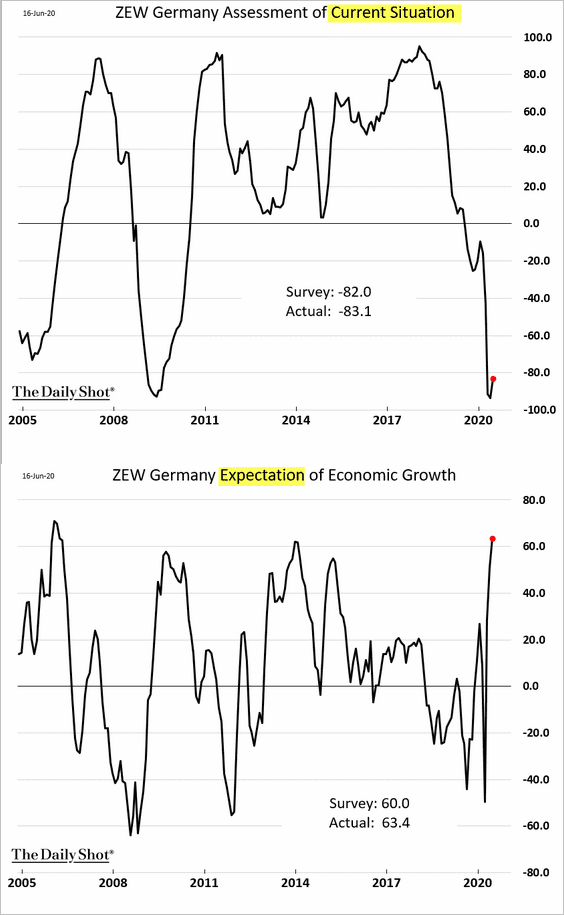
Here is the same index at the Eurozone level.
——————–
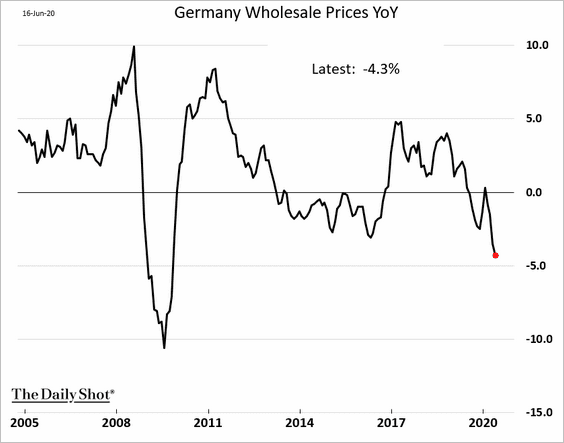
2. Germany’s wholesale deflation deepened in May.
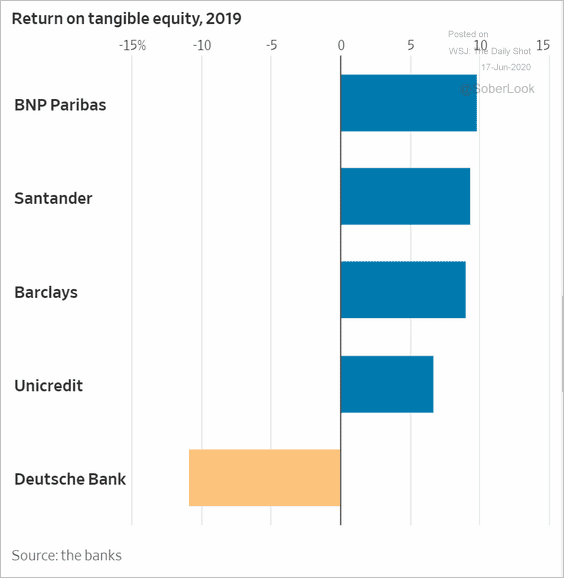
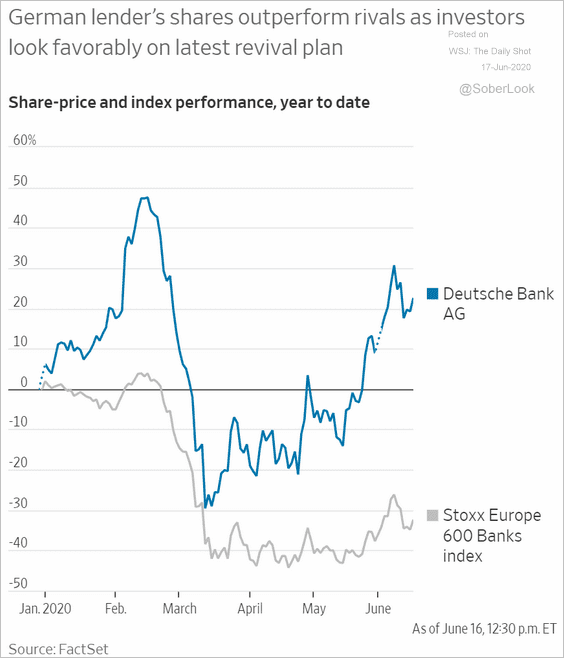
3. After a disastrous 2019 (chart below), Deutsche Bank is now outperforming (second chart).
 Source: @WSJ Read full article
 Source: @WSJ Read full article
——————–
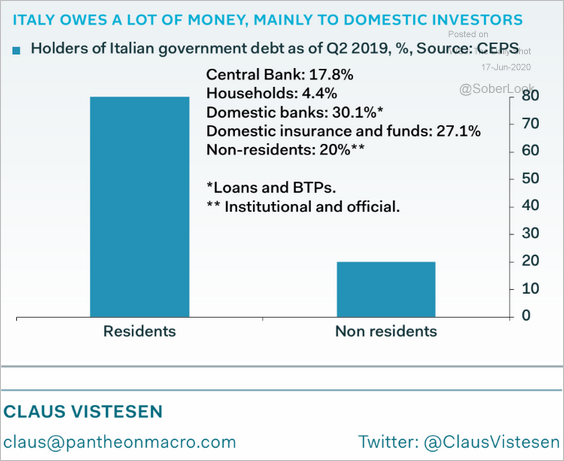
4. Italian government debt is still mostly held by domestic investors.
 Source: Pantheon Macroeconomics
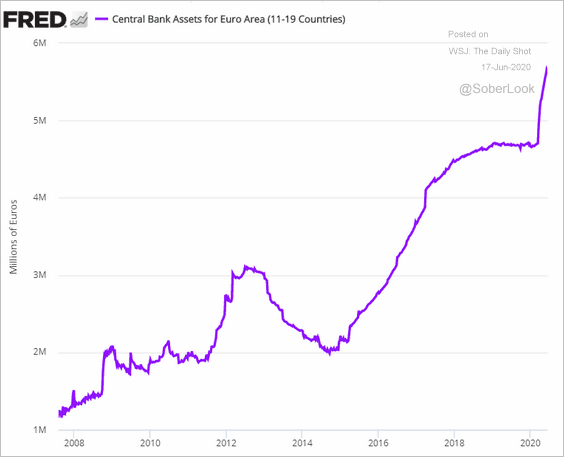
5. The ECB’s (Eurosystem) balance sheet is approaching €6 trillion.
Europe
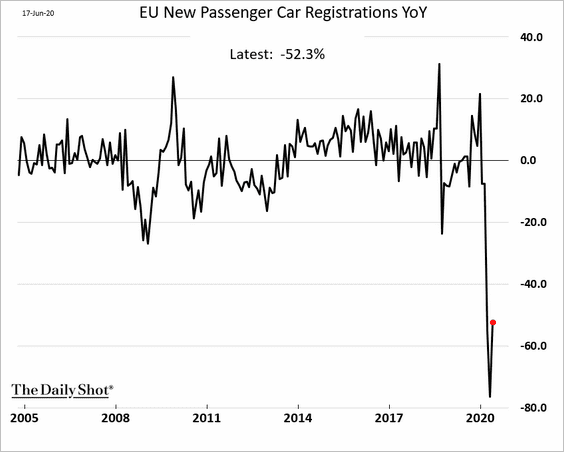
1. EU car registrations bounced from extreme lows but remain depressed.
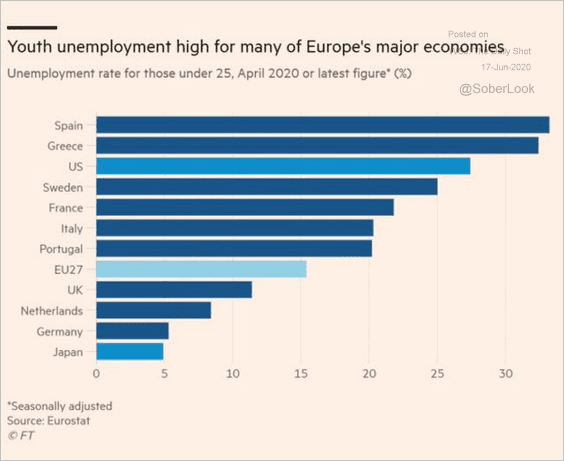
2. This chart shows youth unemployment across Europe (with the US and Japan shown for comparison).
 Source: @adam_tooze, @FT Read full article
Japan
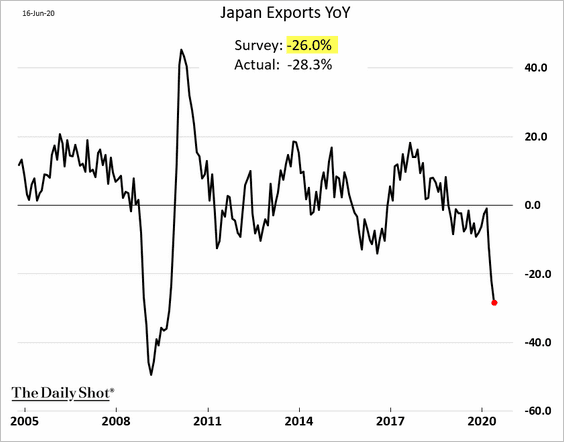
1. Exports deteriorated further in May.
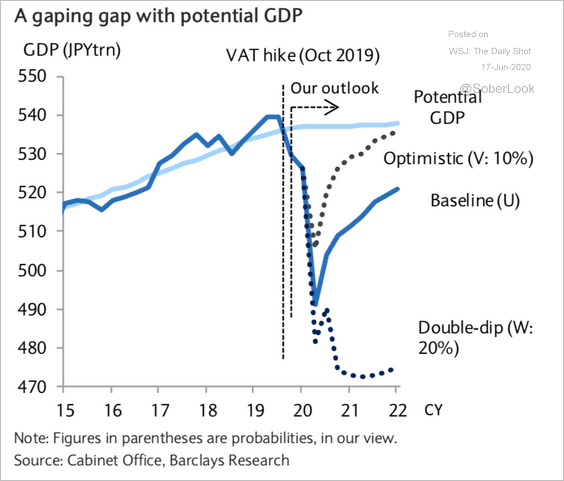
2. Another wave of infections could be devastating for Japan’s economy.
 Source: Barclays Research
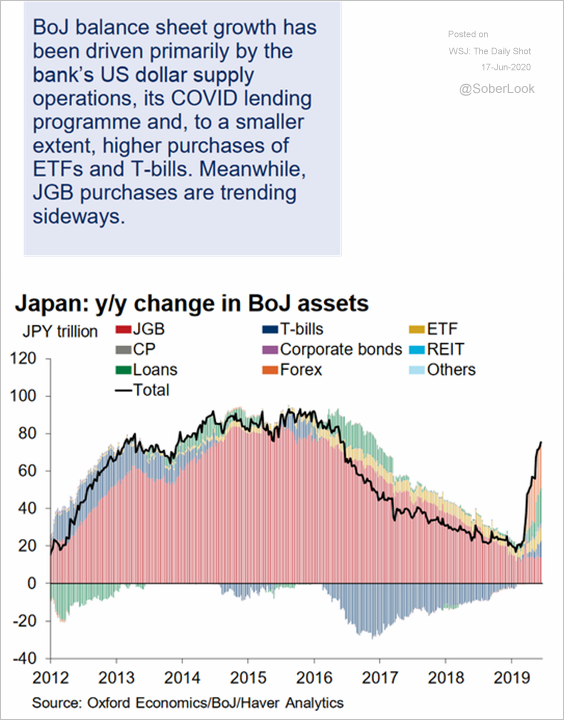
3. This chart shows the year-over-year growth in the BoJ’s balance sheet by asset class.
 Source: @GregDaco, @OxfordEconomics
4. Finally, here is Japan’s distribution of fuel types used for power generation.
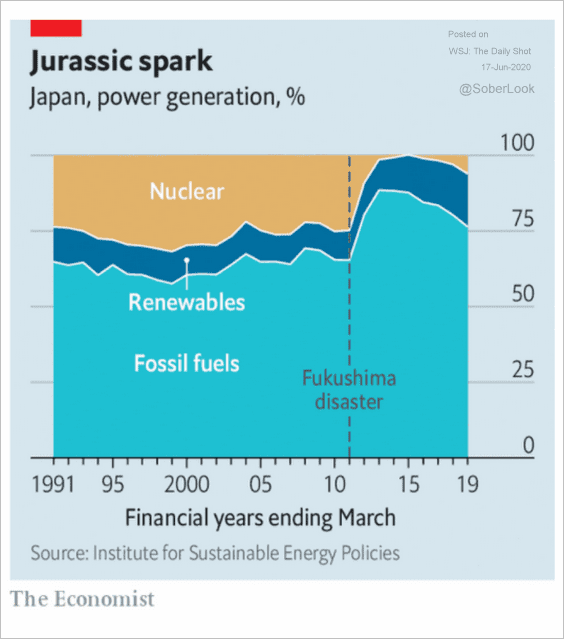 Source: @adam_tooze, @TheEconomist Read full article
Asia – Pacific
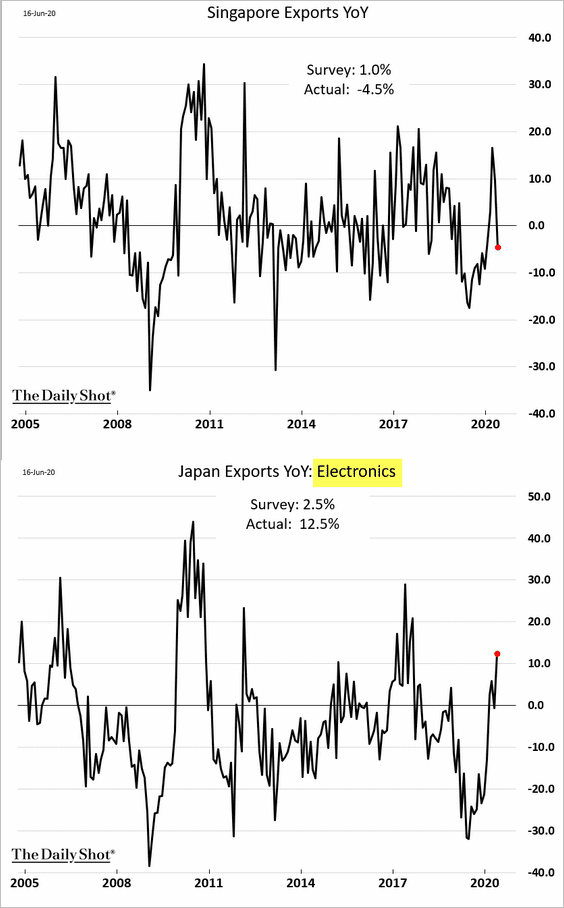
1. Singapore’s exports dipped into negative territory again on a year-over-year basis. However, electronics exports are rebounding.
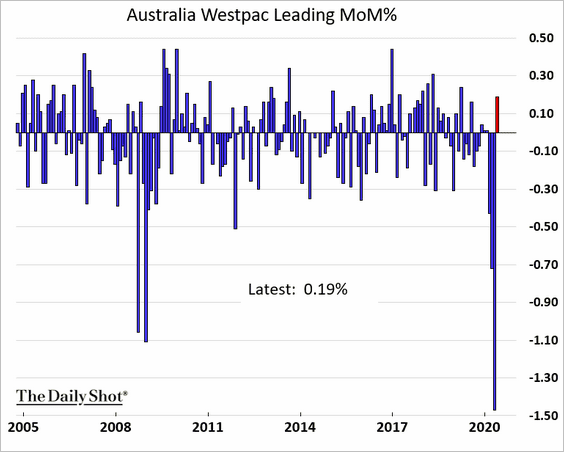
2. Australia’s index of leading indicators finally increased in May after a record decline.
China
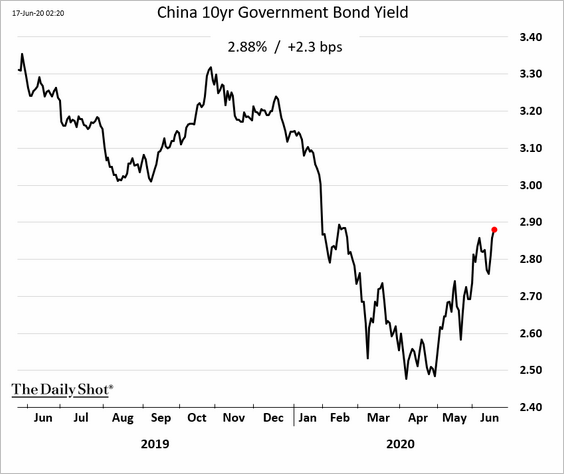
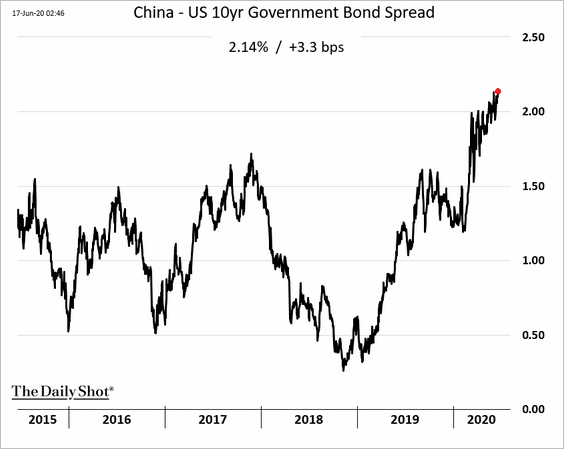
1. Bond yields are still climbing.
Here is the spread between China’s and US 10yr yields.
——————–
2. New home prices keep rising.
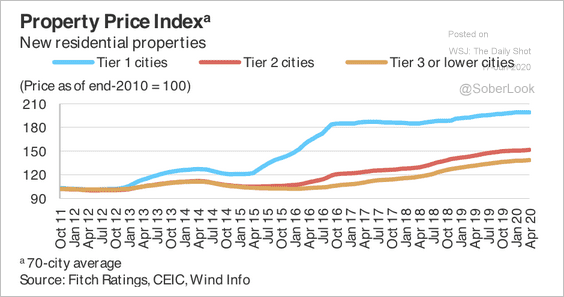 Source: Fitch Ratings
Residential land transactions picked up in April.
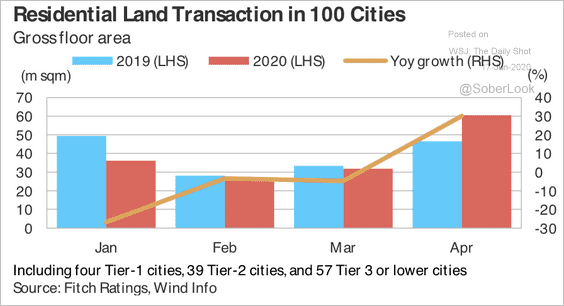 Source: Fitch Ratings
——————–
3. China’s exports have weakened this year except for the COVID-related products.
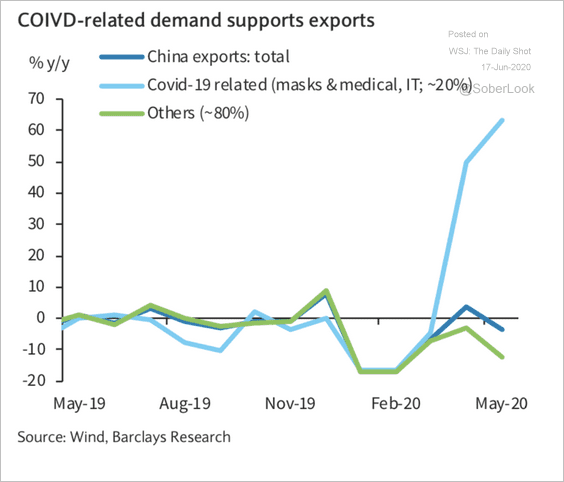 Source: Barclays Research
——————–
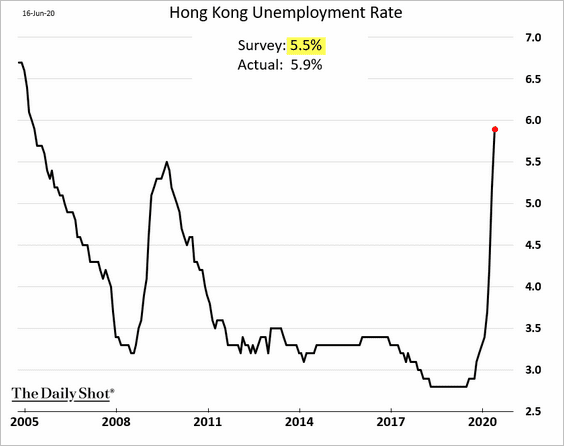
4. Next, we have a couple of updates on Hong Kong.
• Office property values:
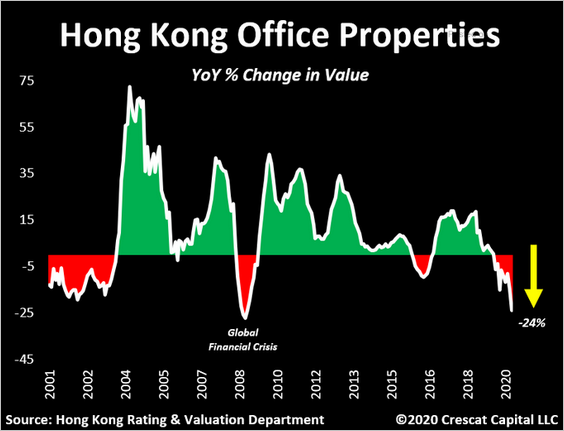 Source: @TaviCosta
• The unemployment rate:
Emerging Markets
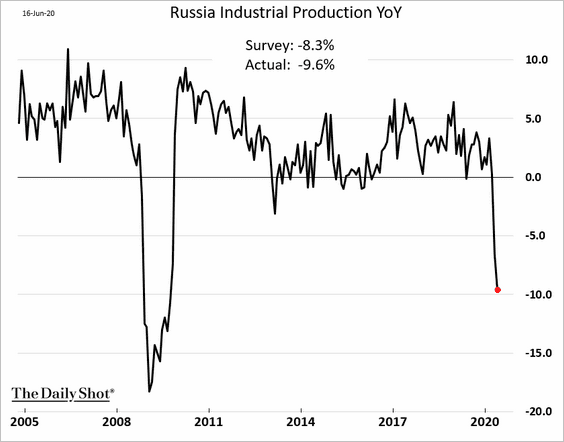
1. Russia’s industrial production weakened further in May.
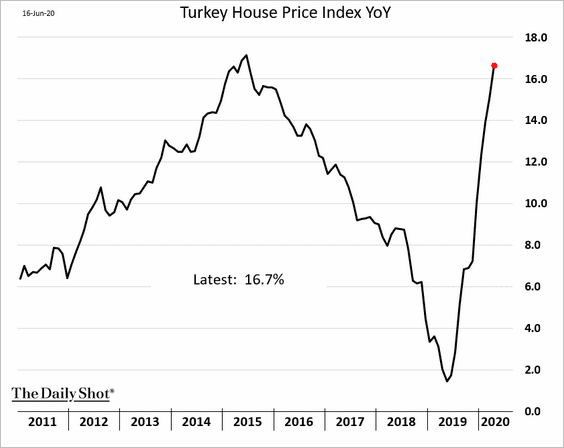
2. Turkey’s home prices are soaring as foreigners take advantage of a weak lira.
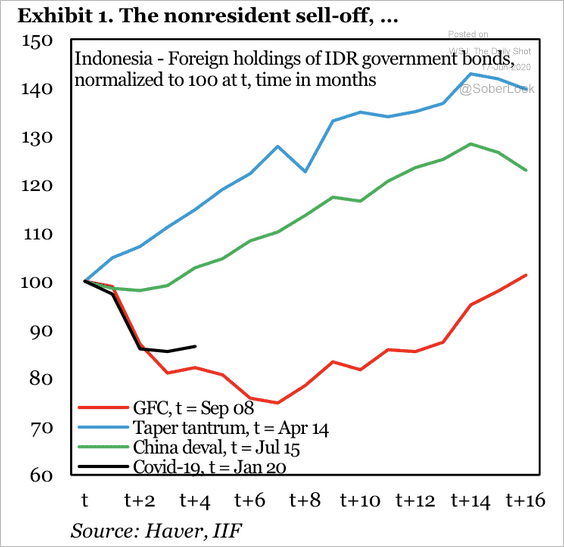
3. Foreign holdings of Indonesian government bonds collapsed during the first few months of this year.
 Source: IIF
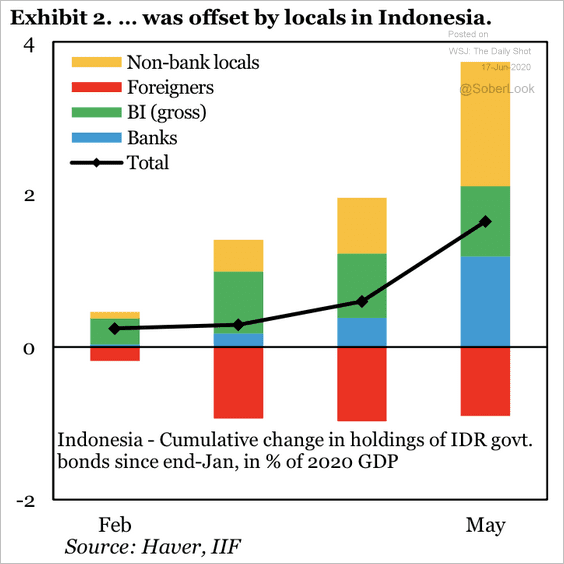
But the local financial system was still able to absorb ample amounts of government debt.
 Source: IIF
Commodities
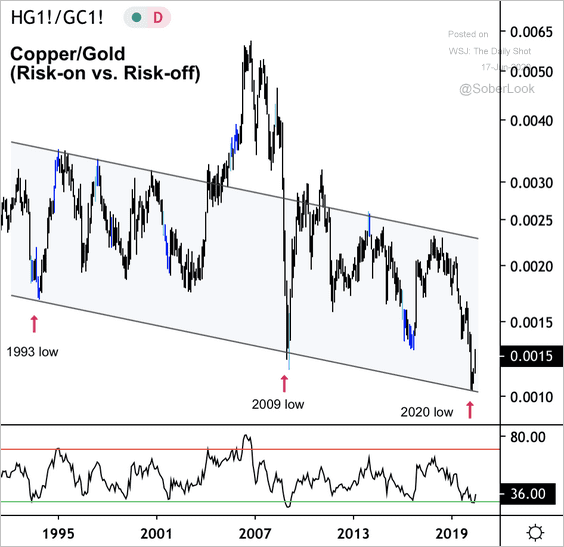
1. The copper/gold ratio is at long-term support.
 Source: @DantesOutlook Further reading
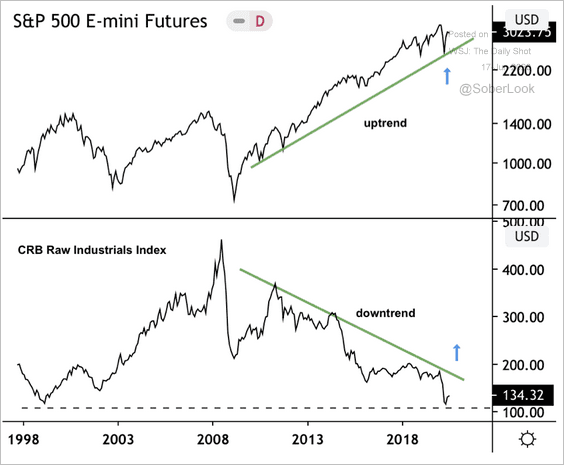
2. The CRB Raw Industrials Index is also at long-term support and has likely bottomed along with the S&P 500.
 Source: @DantesOutlook Further reading
3. US hog futures are testing support.
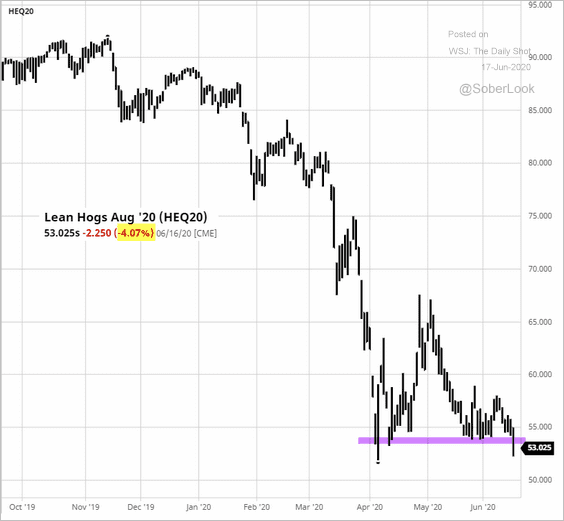 Source: barchart.com
And so are US wheat futures.
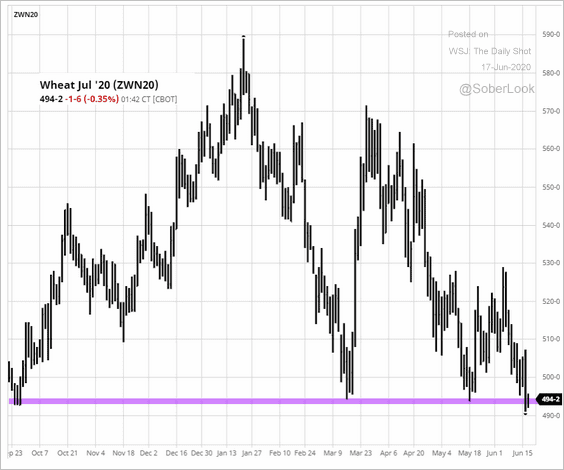 Source: barchart.com
——————–
4. US milk futures keep climbing (class-III milk is mostly used to make cheese).
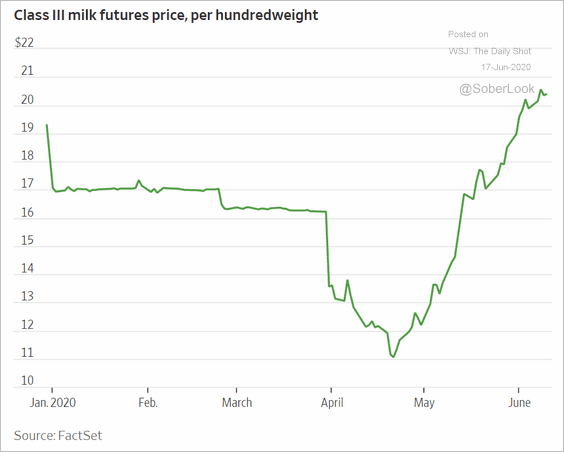 Source: @WSJ Read full article
Equities
1. The S&P 500 technicals look terrible, with 56% of the index members sending sell signals.
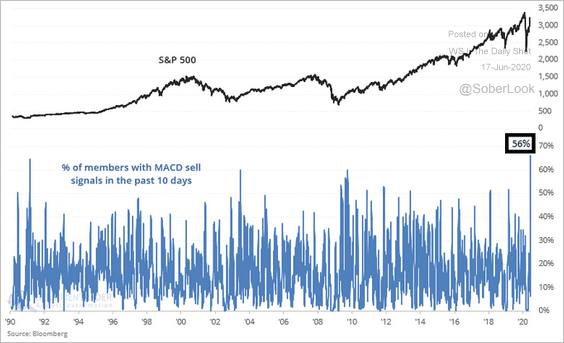 Source: @sentimentrader
2. Here is a summary of sentiment indicators over the past couple of months.
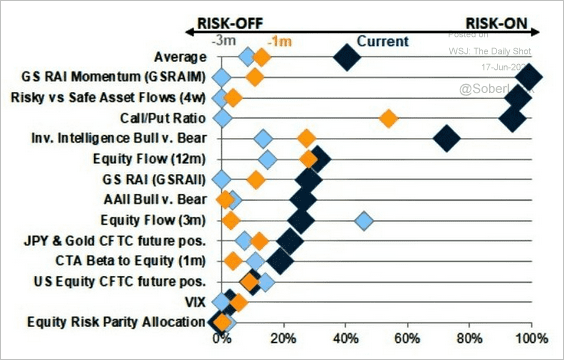 Source: Goldman Sachs, @WallStJesus
3. Equity ETF flows and stock returns have diverged.
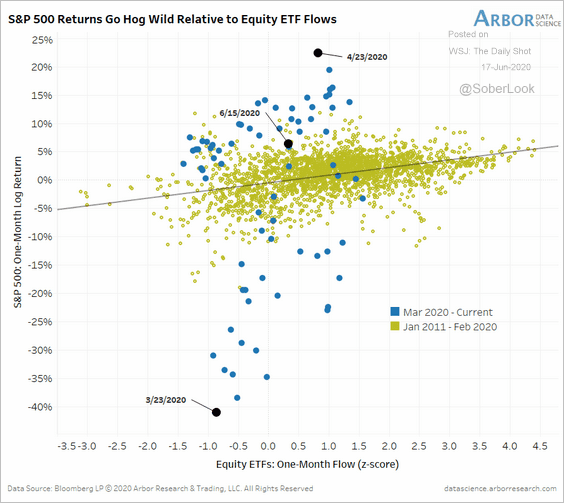 Source: Arbor Research & Trading
4. The S&P 500 earnings-per-share indicator is more cyclical than the broader US corporate profits.
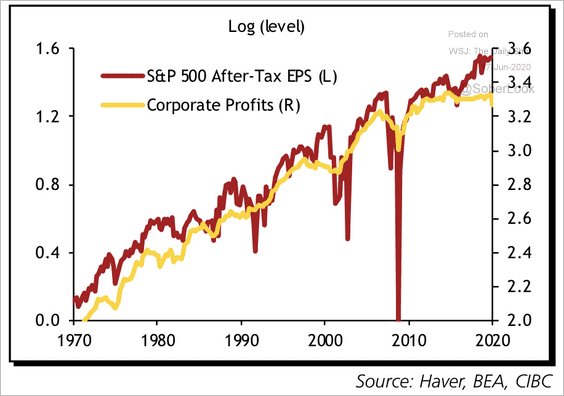 Source: CIBC Capital Markets
5. The AUM of assets indexed to the S&P 500 exceeded $4.5 trillion last year.
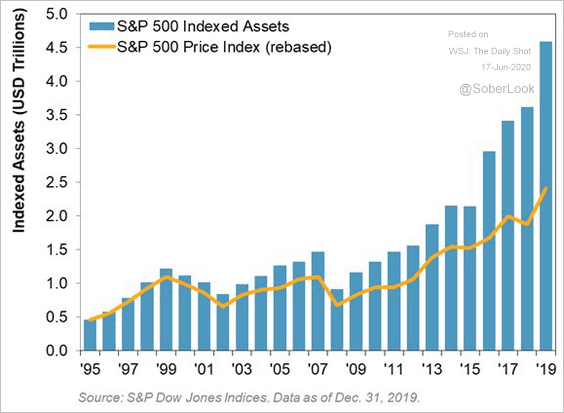 Source: @LizAnnSonders, @SPDJIndices
6. Robinhood’s profits show a spike in retail investor interest in options and smaller stocks.
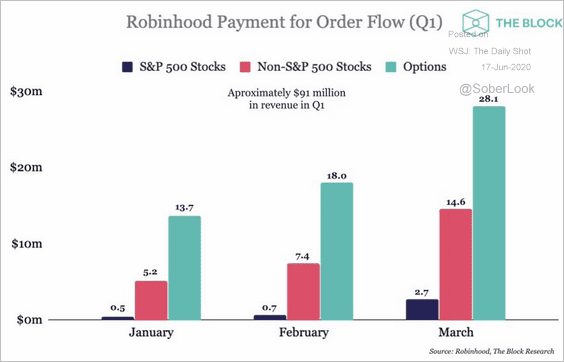 Source: @fintechfrank
Retail investors’ demand for call options has been unprecedented.
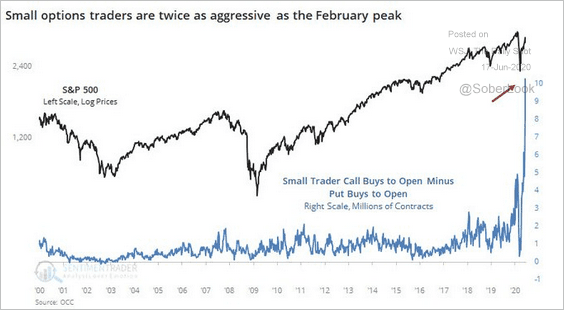 Source: @sentimentrader
——————–
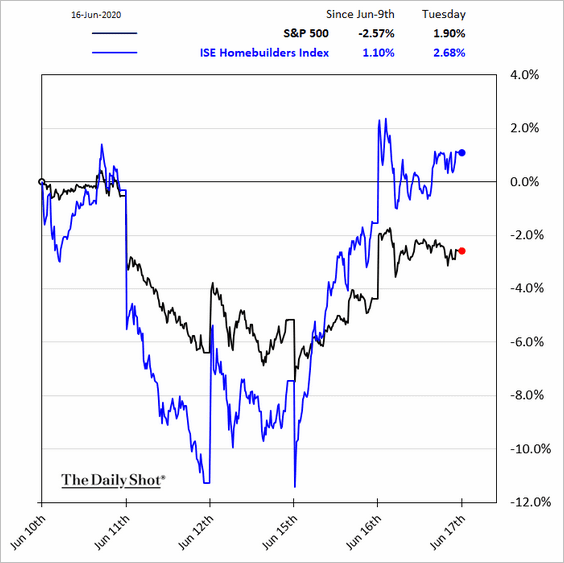
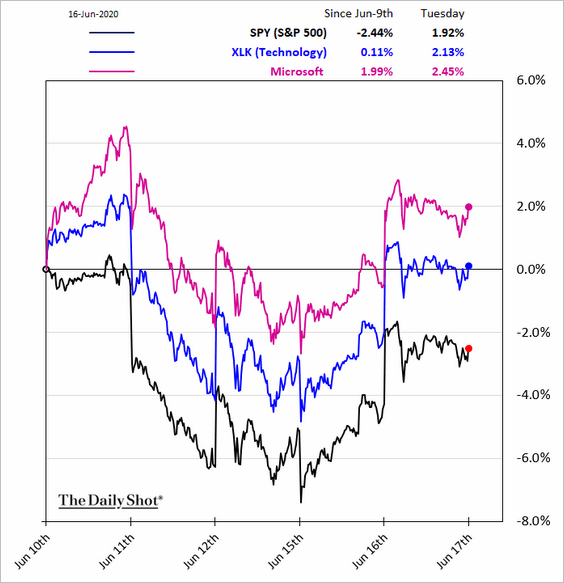
7. Next, we have some sector updates.
• Transportation:
![]()
• Homebuilders:
• Tech:
——————–
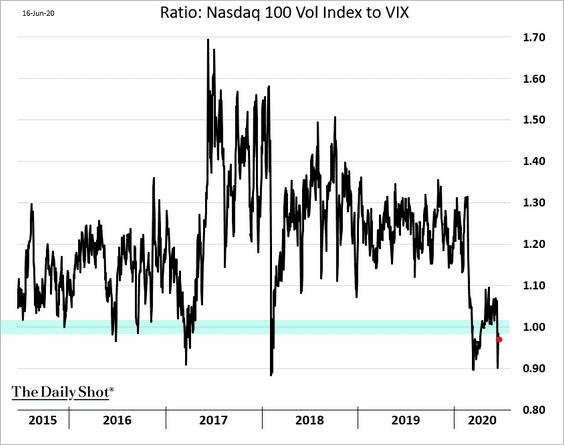
8. The tech mega-caps continue to trade as “safe-haven” assets. The NASDAQ 100 implied volatility remains below that of the S&P 500.
Credit
1. Leveraged loan maturities have been pushed out.
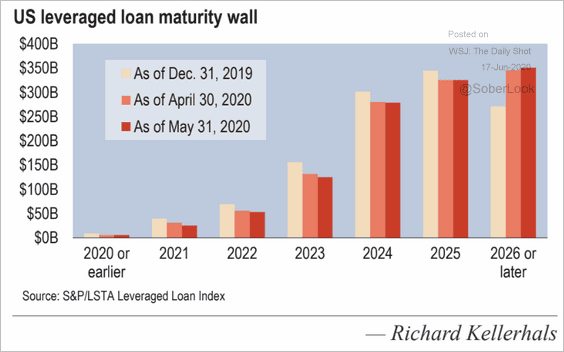 Source: LCD, S&P Global Market Intelligence
2. New CLO reinvestment periods have shortened dramatically. “Static” means that no reinvestment is allowed – the portfolio starts in runoff mode, and loan amortizations are used to pay down liabilities.
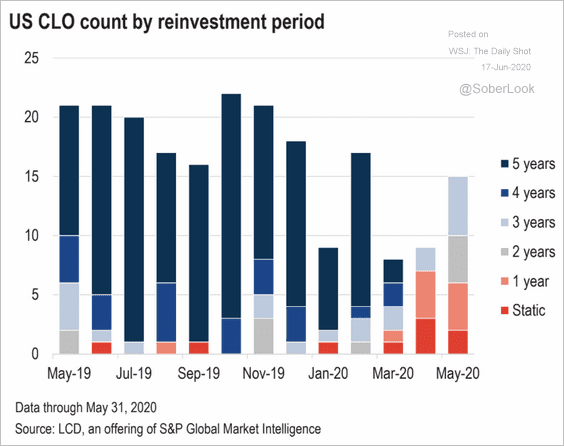 Source: LCD, S&P Global Market Intelligence
3. The forbearance option has kept residential mortgage delinquencies relatively low.
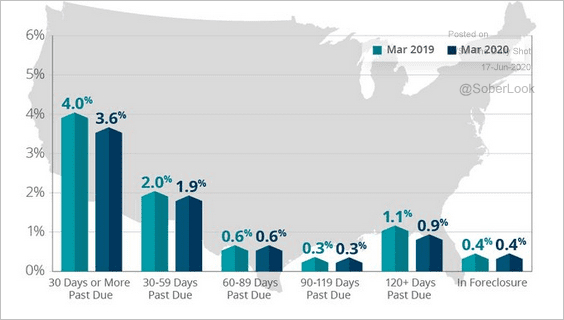 Source: @CoreLogicInc, @TayTayLLP
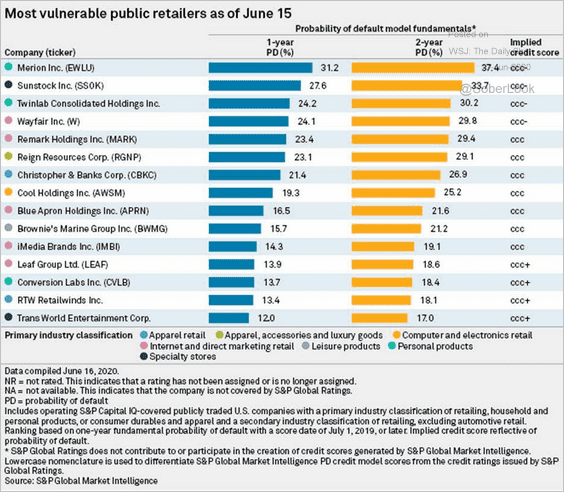
4. Which are the most vulnerable retailers?
 Source: S&P Global Market Intelligence
Global Developments
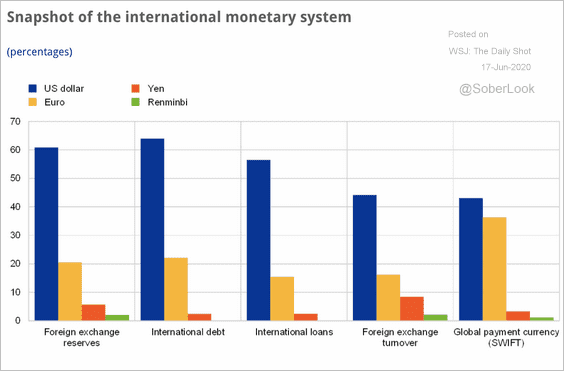
1. This chart shows the prevalence of select currencies in the international monetary system.
 Source: ECB Read full article
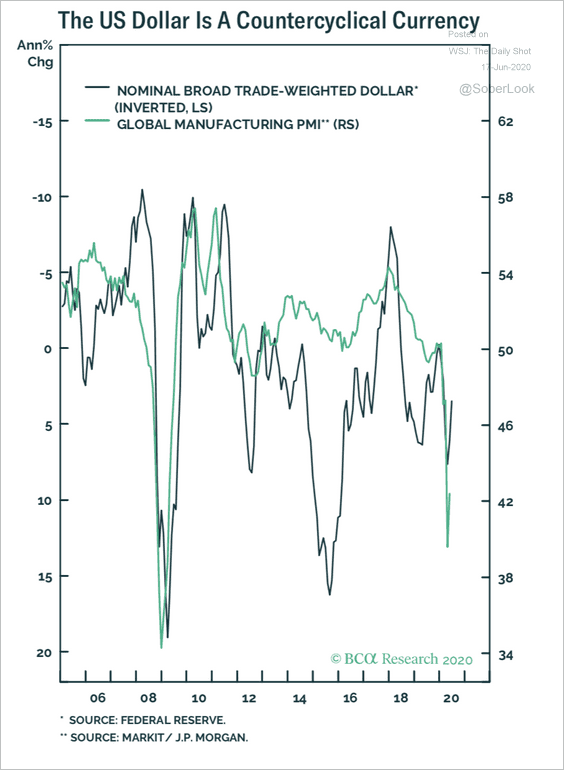
2. According to BCA Research, the dollar is a countercyclical currency (it tends to move in the opposite direction of the global business cycle).
 Source: BCA Research
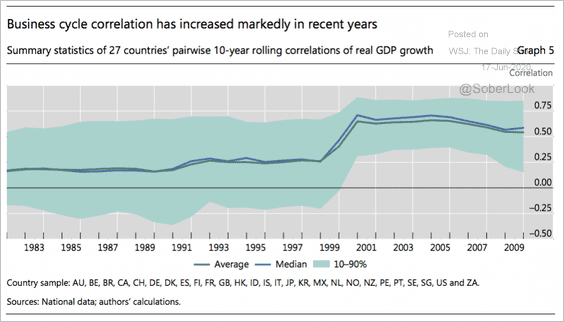
3. Global business cycles have become highly correlated over the past 40 years.
 Source: BIS
4. How does the current crisis compare to SARS?
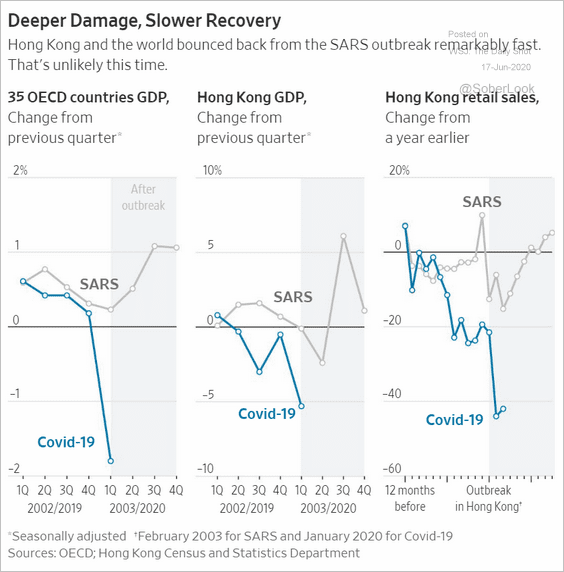 Source: @WSJ Read full article
5. Finally, we have the distribution of central bank policy rates globally.
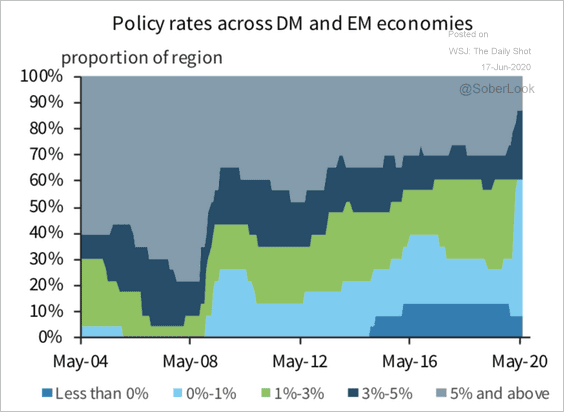 Source: Barclays Research
——————–
Food for Thought
1. Tesla is now the most valuable automaker.
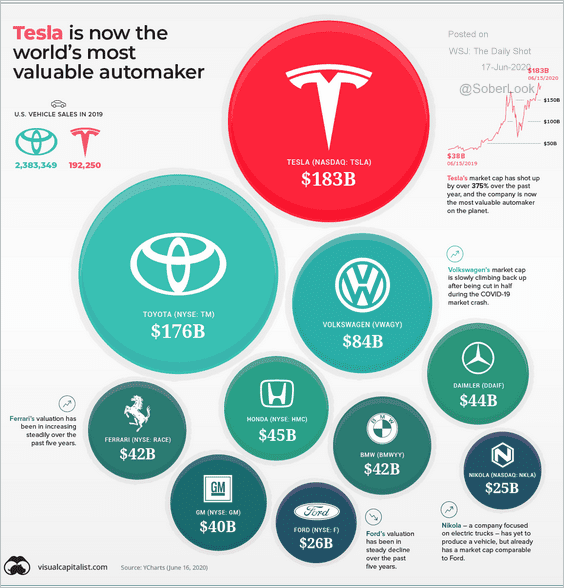 Source: @VisualCap Read full article
2. The most valuable retail brands:
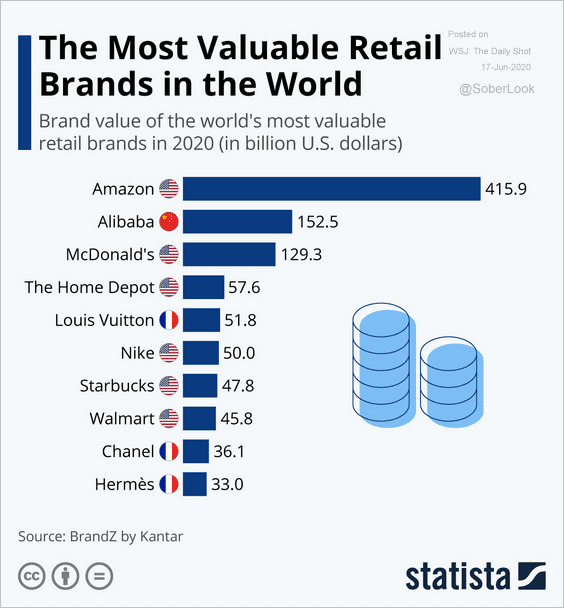 Source: Statista
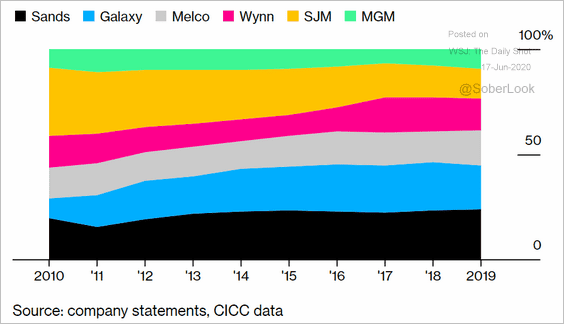
3. The Macau casino market:
 Source: @luxury Read full article
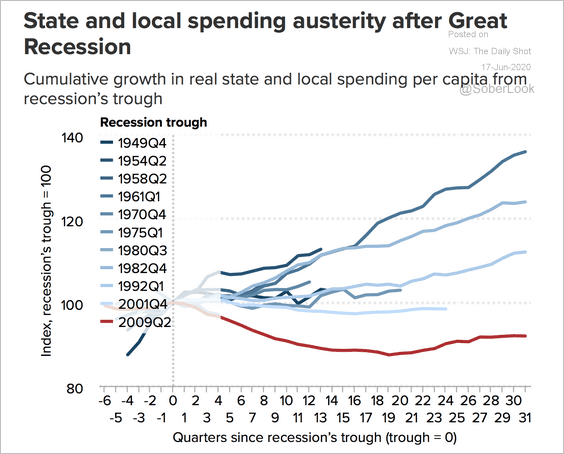
4. State and local government spending per capita in the US:
 Source: @EconomicPolicy Read full article
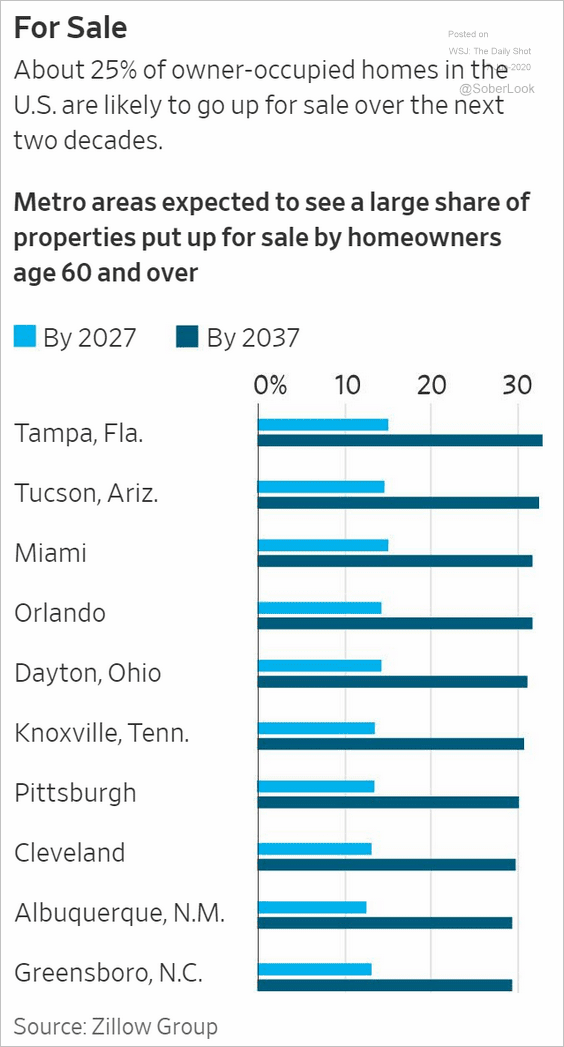
5. Aging homeowners will be selling a lot of homes over the next couple of decades.
 Source: @WSJ Read full article
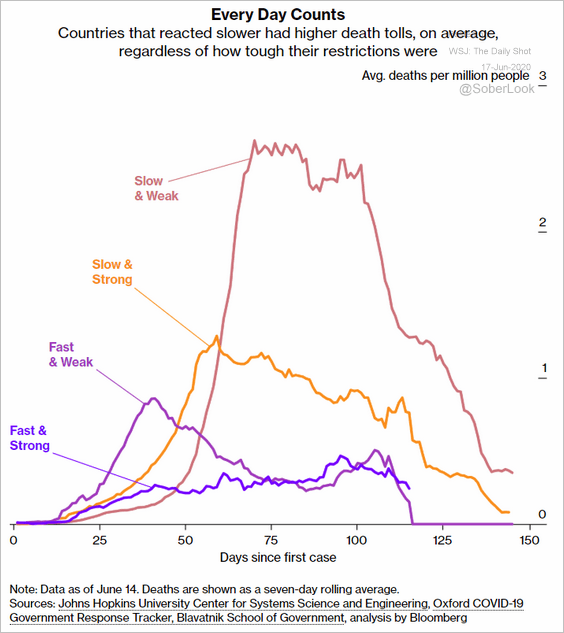
6. Every day counts in initial COVID responses.
 Source: @bbgvisualdata Read full article
7. News coverage mentioning “protests,” “looting,” and “rioting”:
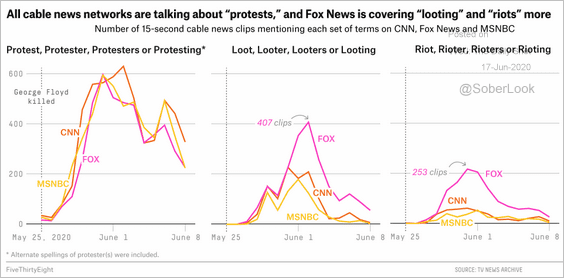 Source: FiveThirtyEight Read full article
8. Satisfaction with the way things are going in the US:
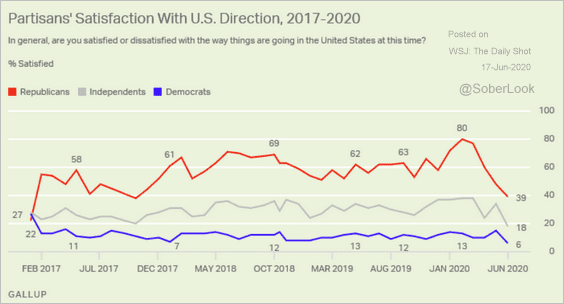 Source: Gallup Read full article
9. The Indo-European language tree:
 Source: Anthropology.net
——————–