
The Daily Shot: 24-Jun-20
• The United States
• The United Kingdom
• The Eurozone
• Asia – Pacific
• Emerging Markets
• Commodities
• Equities
• Credit
• Rates
• Global Developments
• Food for Thought
The United States
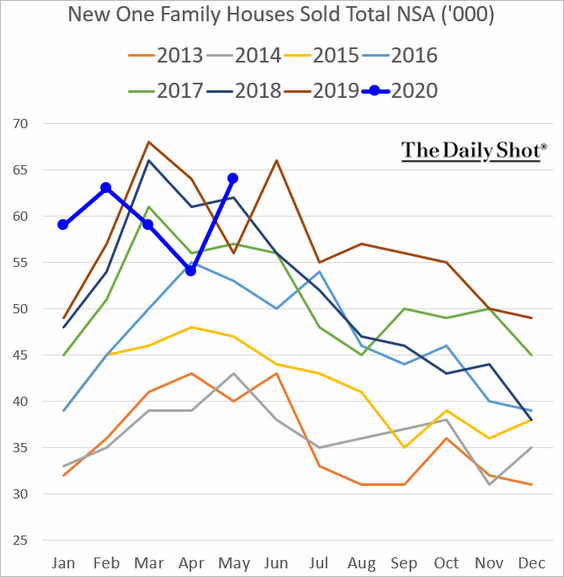
1. Let’s begin with the new residential sales report.
• New home sales rebounded in May.
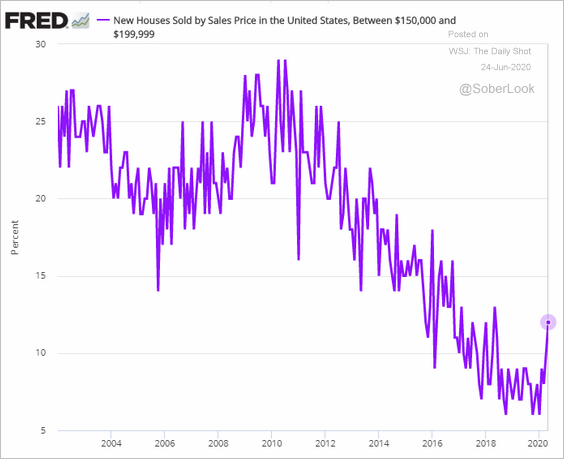
• There was increased activity in starter homes.
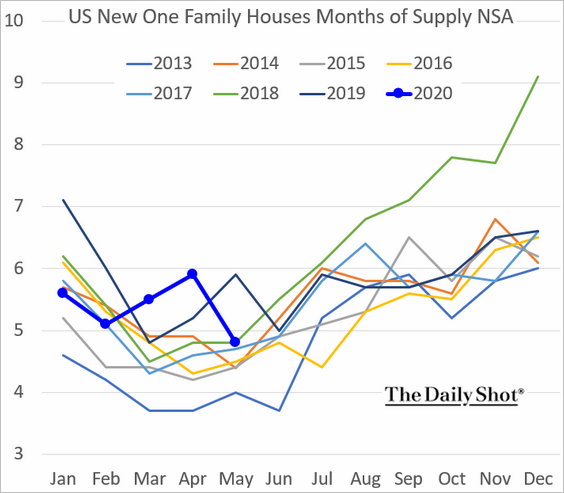
• Inventories, measured in months of supply, tightened to 2018 levels.
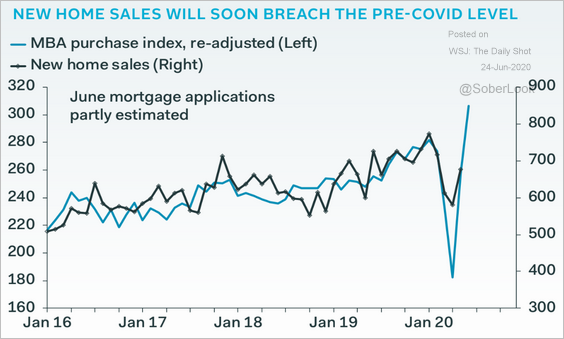
• Mortgage applications point to further improvements in new home sales.
 Source: Pantheon Macroeconomics
——————–
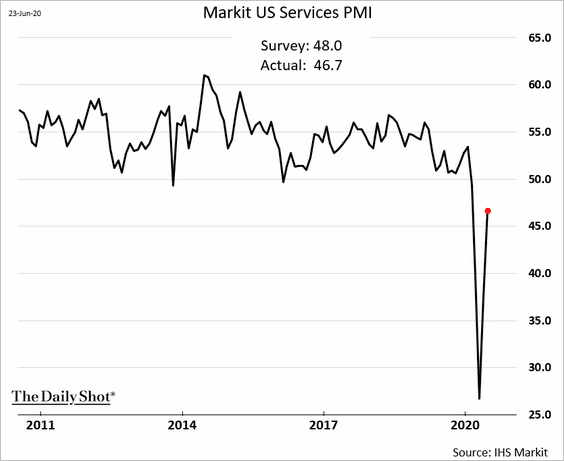
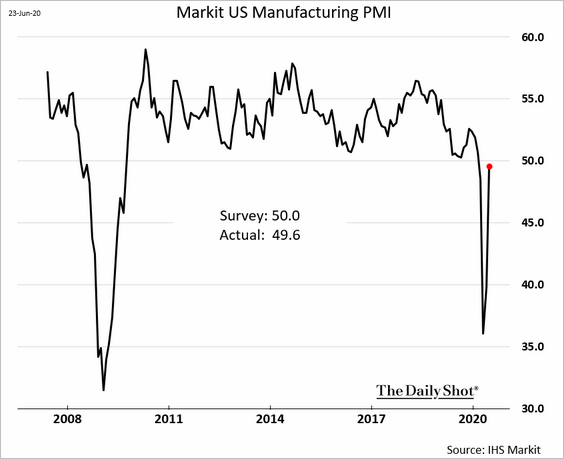
2. The preliminary Markit PMI report showed stabilization in business activity this month (PMI approaching 50).
• Services:
• Manufacturing:
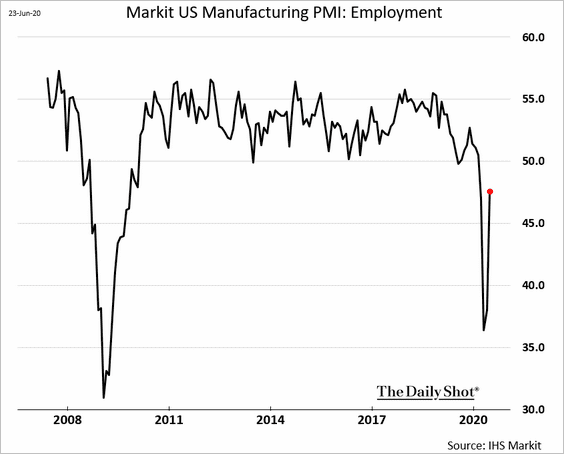
However, factory employment is still soft.
——————–
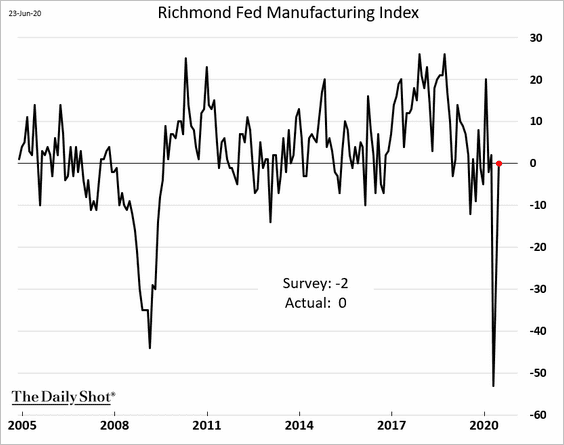
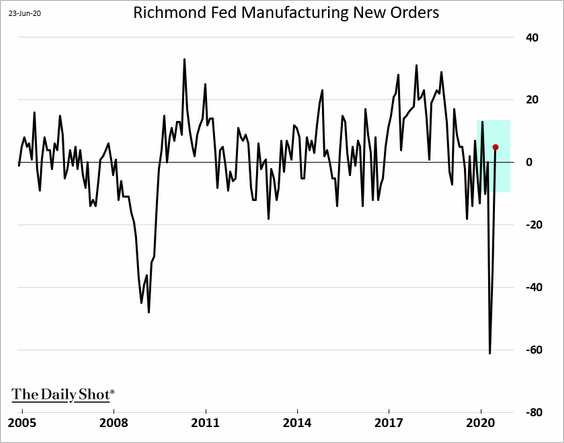
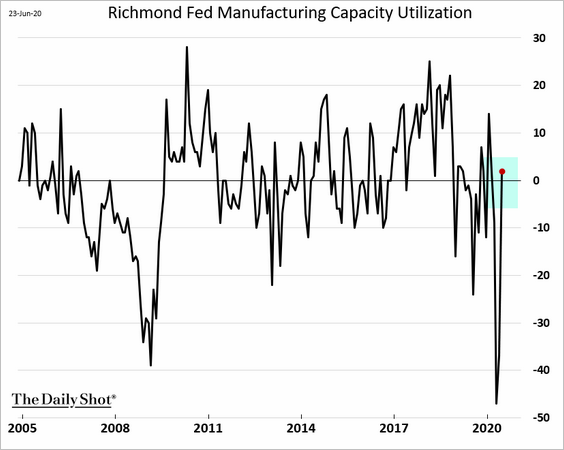
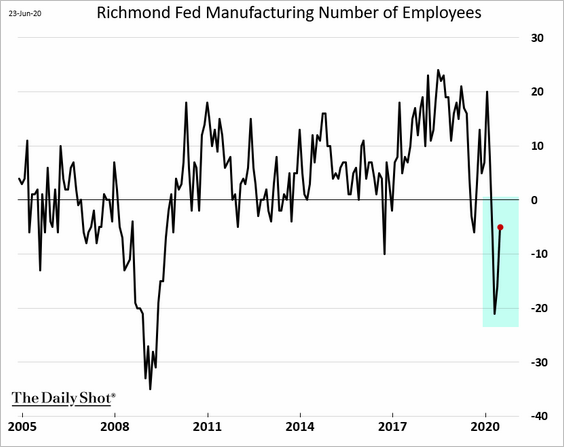
3. There was a sharp improvement in the Richmond Fed’s regional factory activity index.
Here are some of the components.
• New orders:
• Capacity utilization:
• Employment (still soft):
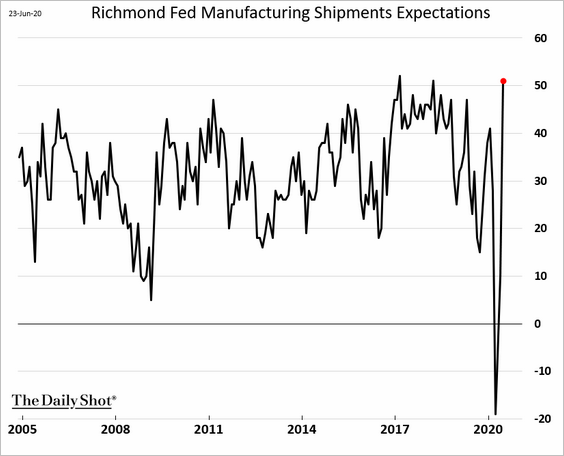
Manufacturers are upbeat about the future.
The charts below combine the NY, Philly, and Richmond Fed manufacturing indices.
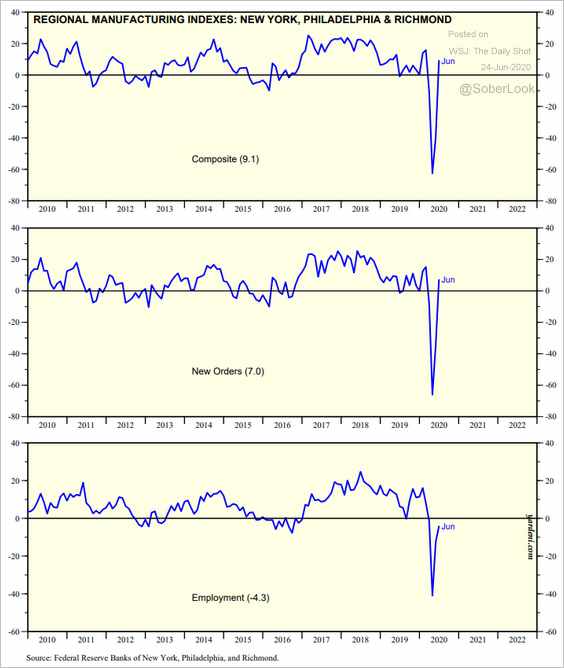 Source: Yardeni Research
——————–
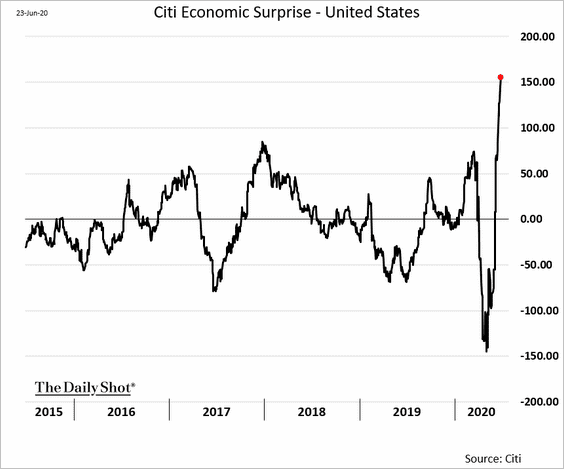
4. The Citi Economic Surprise Index continues to climb.
5. According to Alpine Macro, stronger than expected retail sales in May were partly driven by a temporary boost in consumer incomes (in excess of savings).
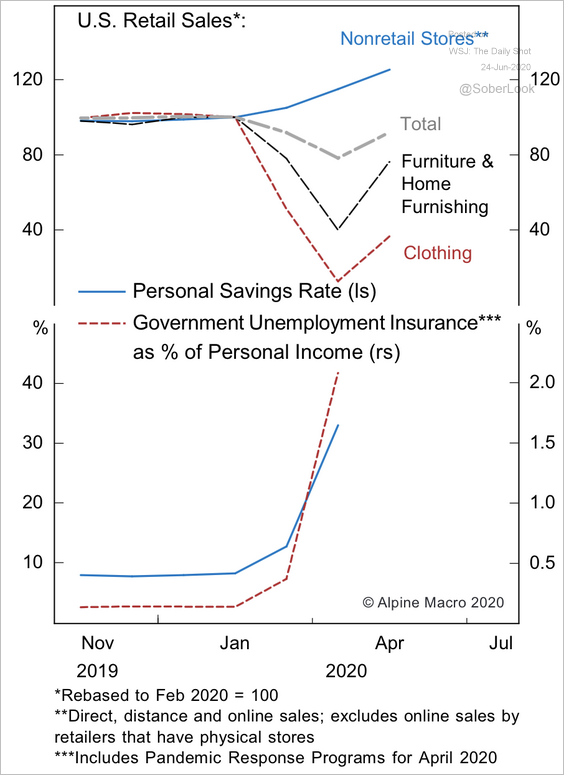 Source: Alpine Macro
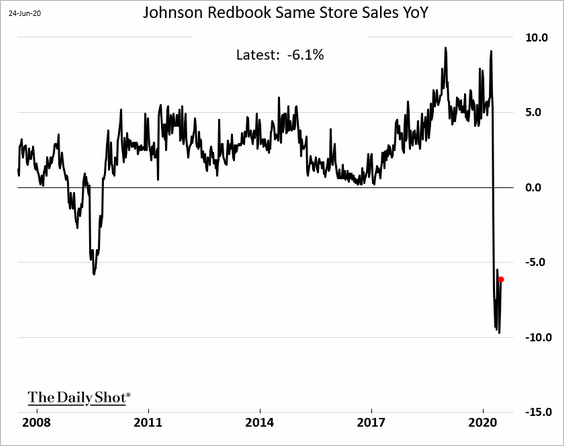
It’s worth noting that the Johnson Redbook Same-Store Sales Index has not rebounded.
——————–
6. This chart shows the industry distribution of PPP loans vs. job losses.
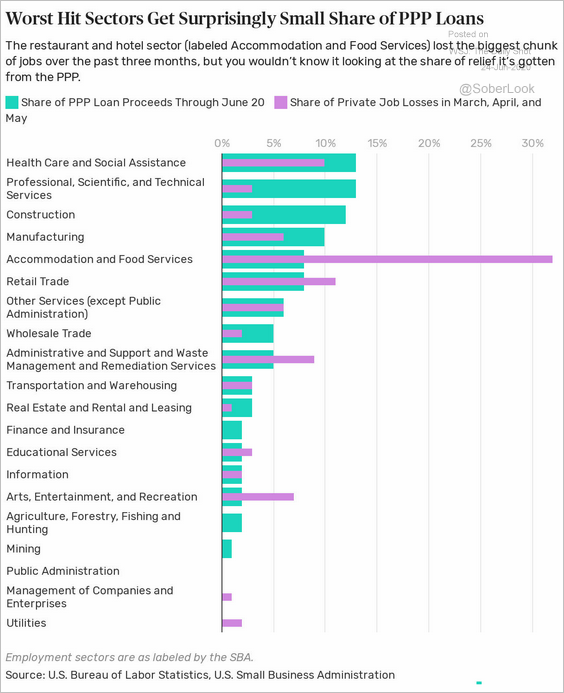 Source: The Balance Read full article
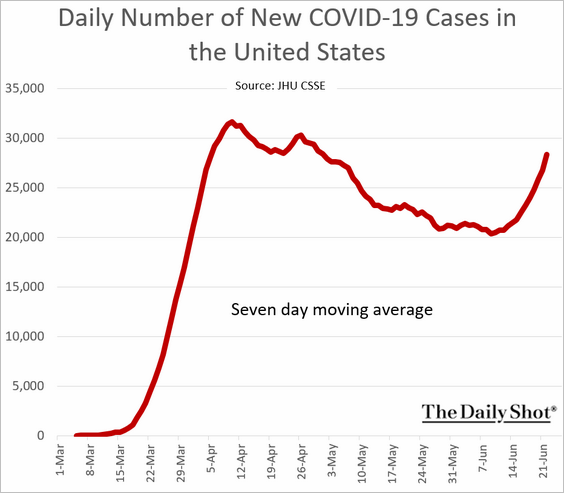
7. The US COVID-19 situation remains challenging.
• Daily new cases:
• The US vs. the EU (note that the EU’s population is substantially higher than the US):
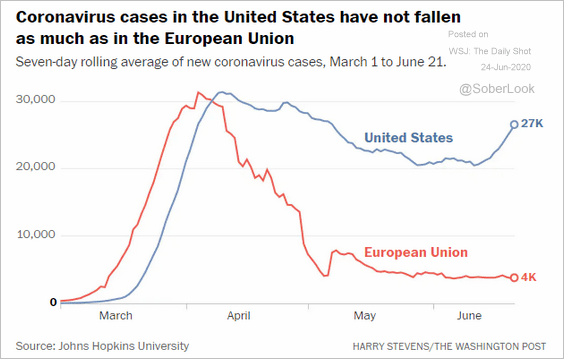 Source: @McFaul
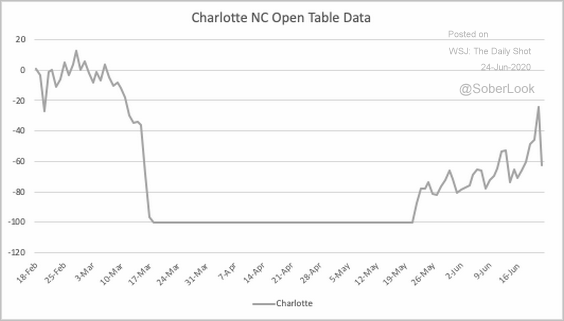
• Restaurant reservation data suggest that consumers are becoming apprehensive again in some communities.
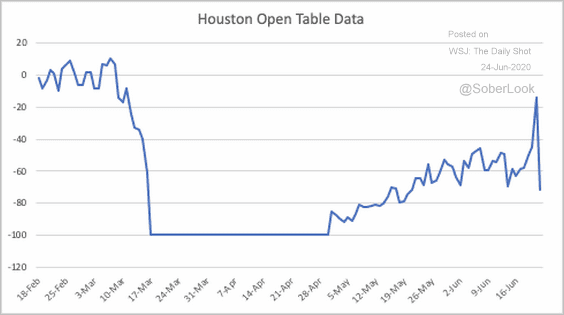 Source: @ModeledBehavior
 Source: @ModeledBehavior
The United Kingdom
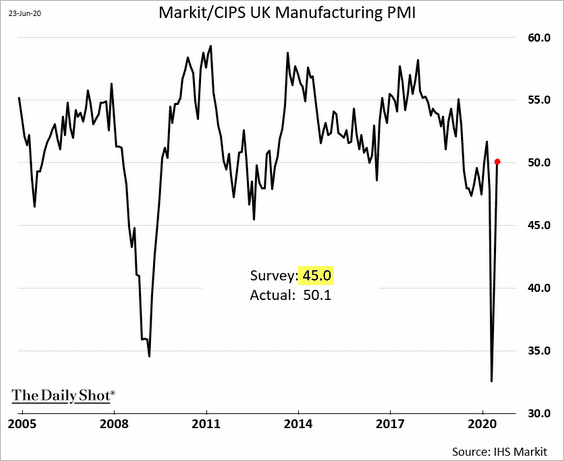
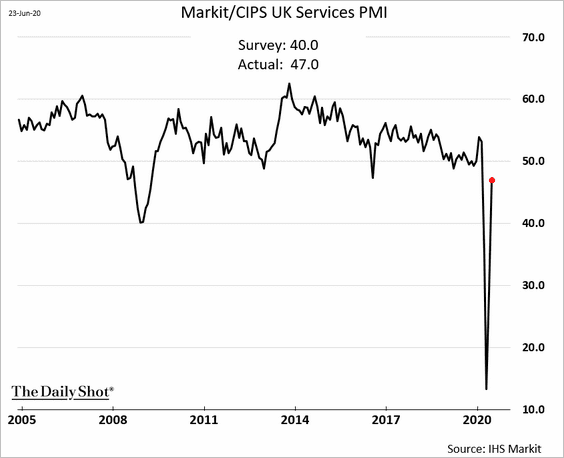
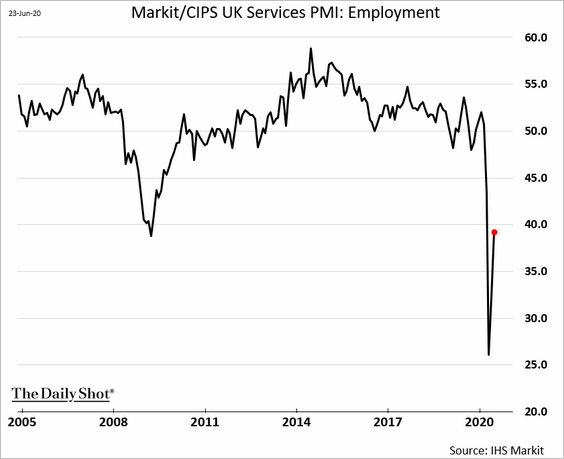
1. The flash June PMI results from Markit topped economists’ estimates, as business activity stabilized (PMI near 50).
• Manufacturing:
• Services:
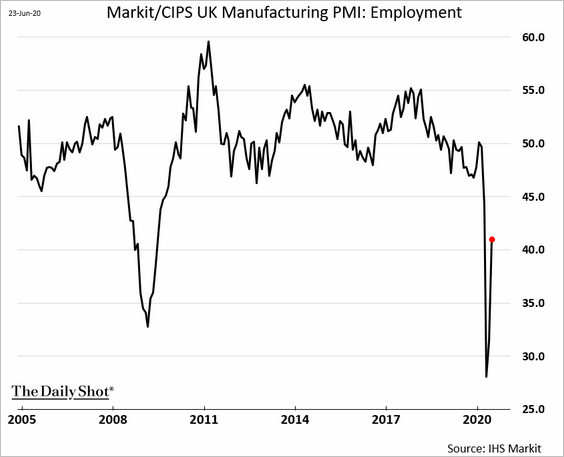
Employment remains soft.
——————–
2. The UK stock market continues to underperform due to Brexit-related concerns.
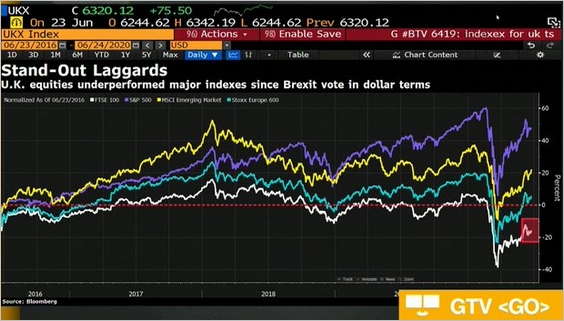 Source: @acemaxx, @BloombergTV
The Eurozone
1. As we saw yesterday, the PMI reports showed marked improvement in business activity, especially in France.
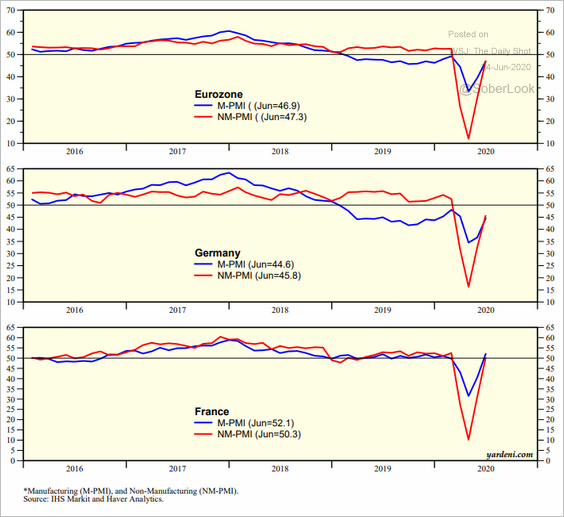 Source: Yardeni Research
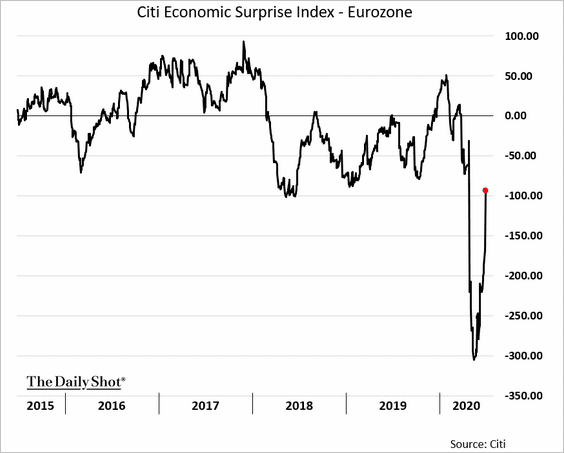
The PMI report topped economists’ forecasts, pulling up the Citi Economic Surprise Index.
——————–
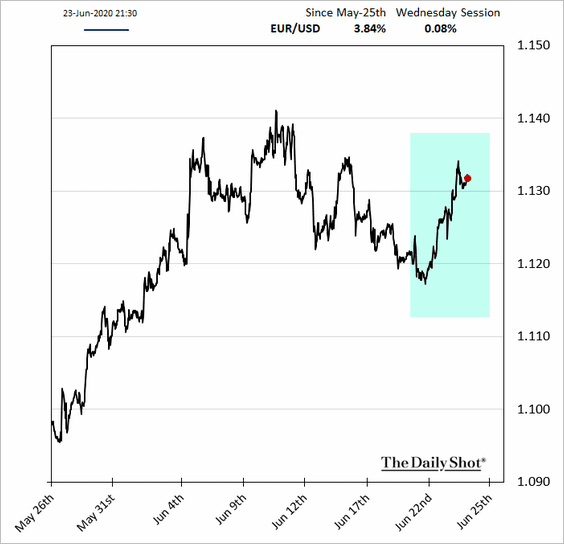
2. The euro jumped.
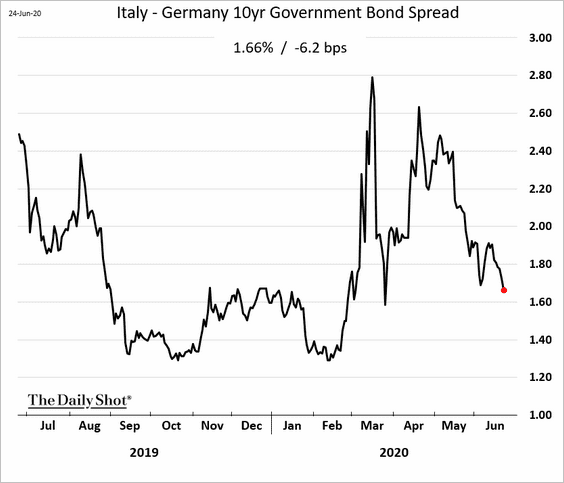
3. Italian bond spreads are drifting lower.
 Source: Tradeweb
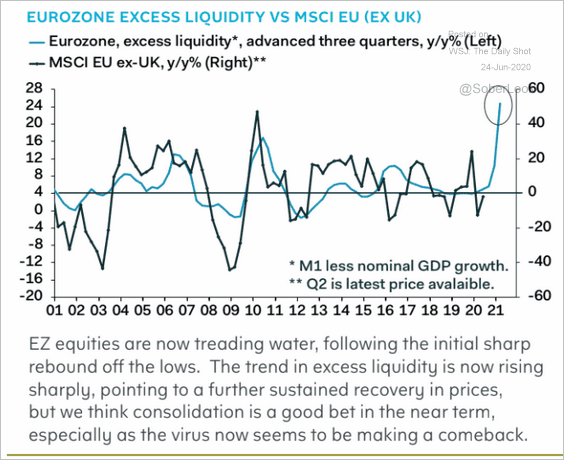
4. Will the sharp increase in the money supply boost European stocks?
 Source: Pantheon Macroeconomics
Asia – Pacific
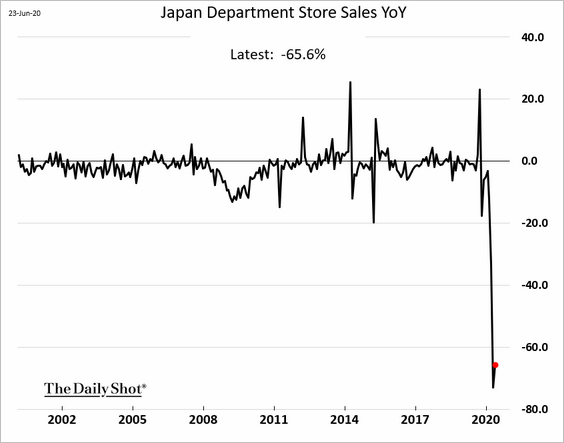
1. There wasn’t much improvement in Japan’s department store sales last month.
2. Export prices are falling, especially in South Korea.
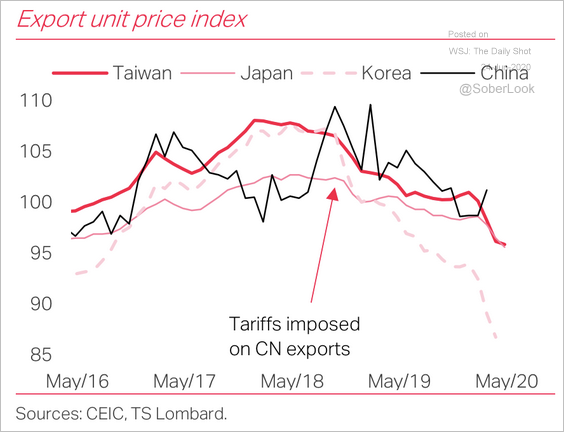 Source: TS Lombard
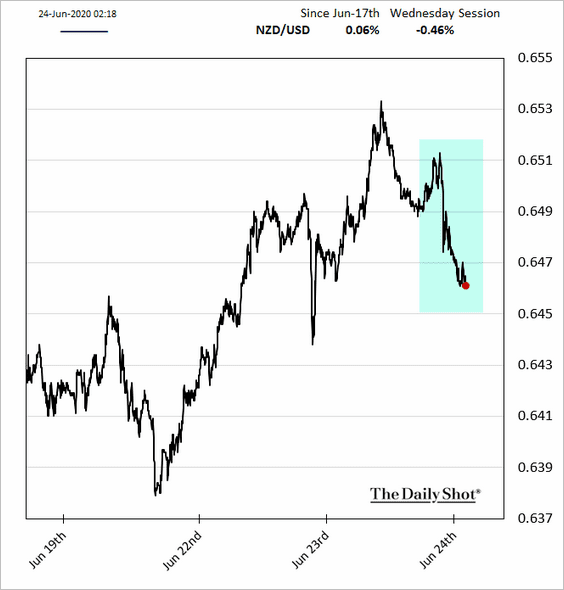
3. The Kiwi dollar is lower after the RBNZ’s dovish comments (hinting at further easing).
Emerging Markets
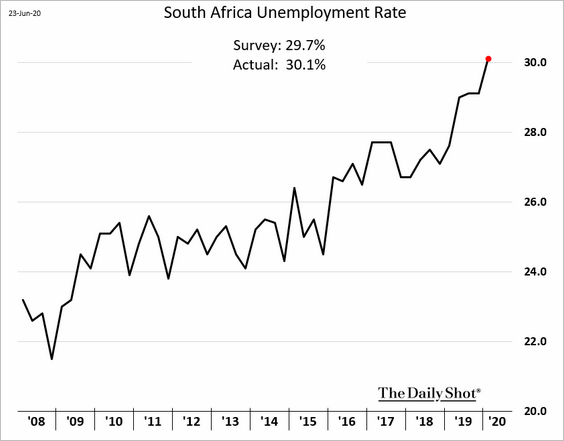
1. South Africa’s unemployment rate climbs above 30%.
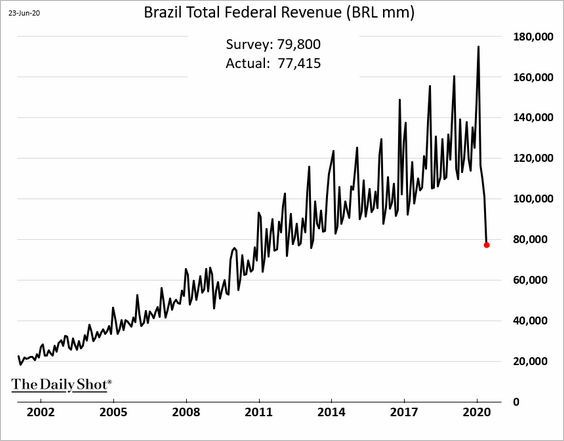
2. Brazil’s tax collections plummetted in May.
3. High-debt companies’ investment growth is less than half the pace of low-debt firms.
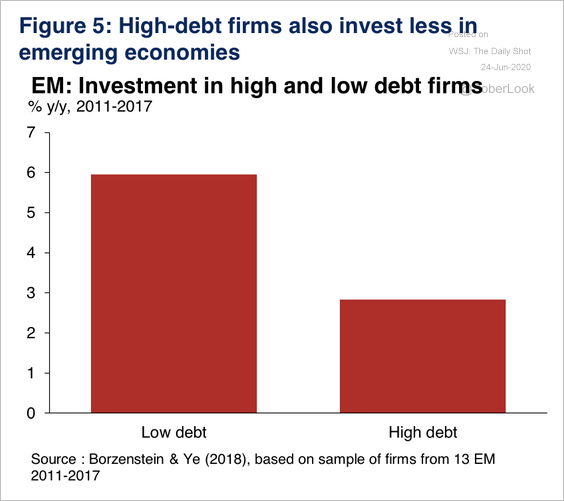 Source: Oxford Economics
4. This chart shows the changes in fiscal balances for select economies.
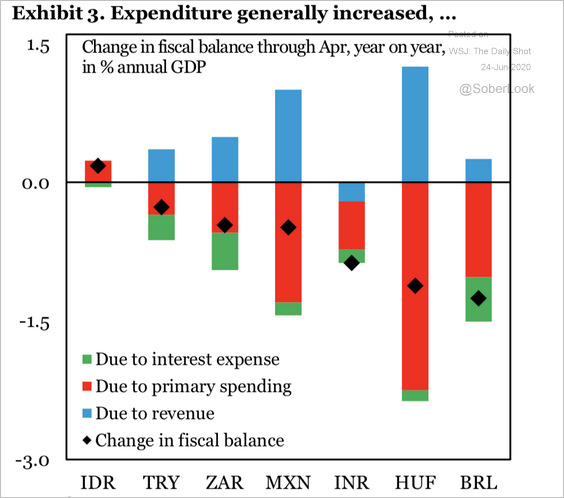 Source: IIF
Commodities
1. Let’s begin with some updates on precious metals.
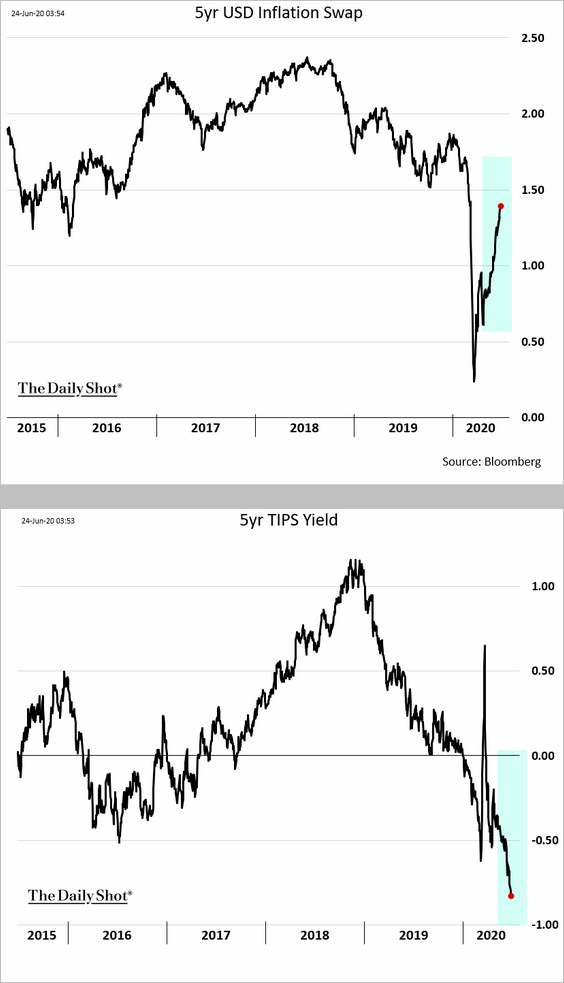
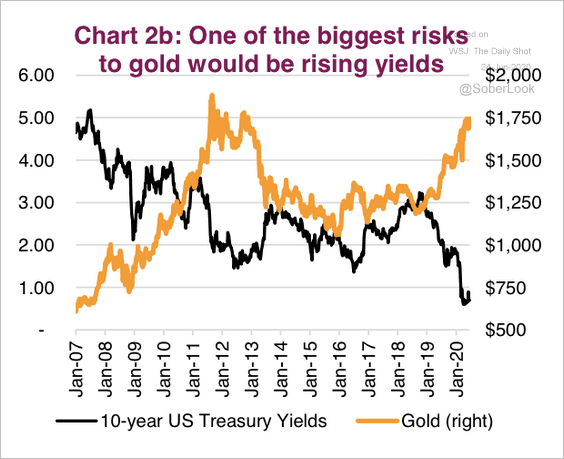
• As inflation expectations rebound (chart below), US effective real rates move deeper into negative territory (second chart). This trend has been a tailwind for gold prices.
• A higher percentage of fund managers have been underweight gold.
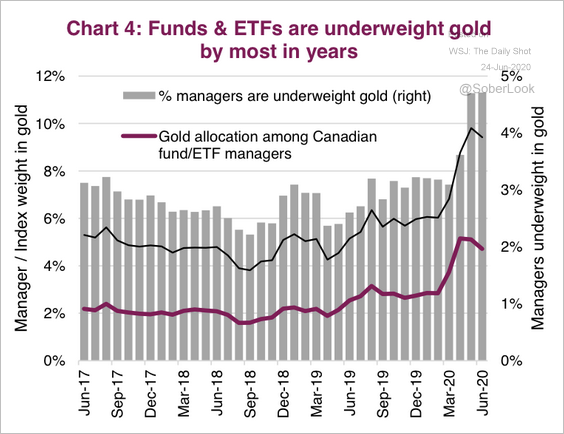 Source: Market Ethos, Richardson GMP
• Gold does not do well during the initial phases of rising yields.
 Source: Market Ethos, Richardson GMP
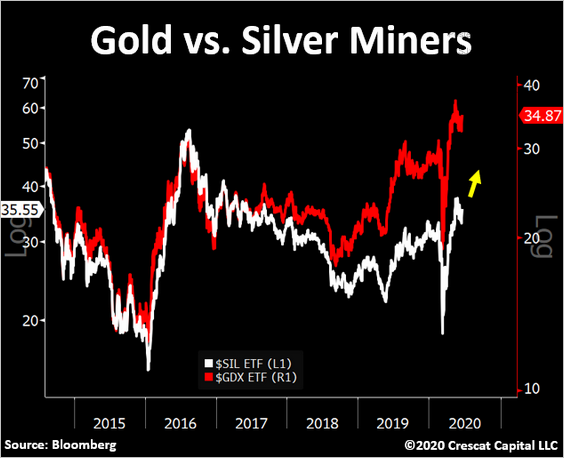
• Silver miners have been underperforming.
 Source: @TaviCosta
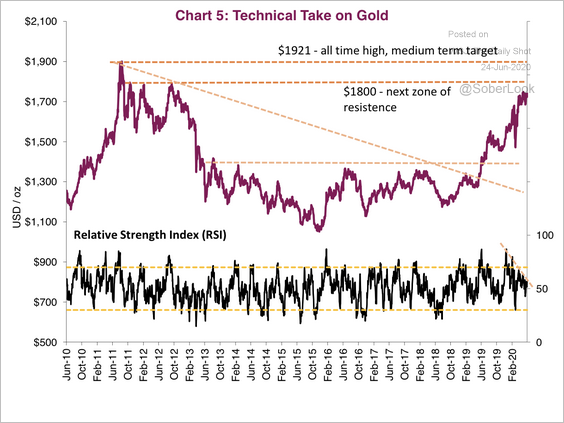
• Gold is approaching long-term resistance.
 Source: Market Ethos, Richardson GMP
——————–
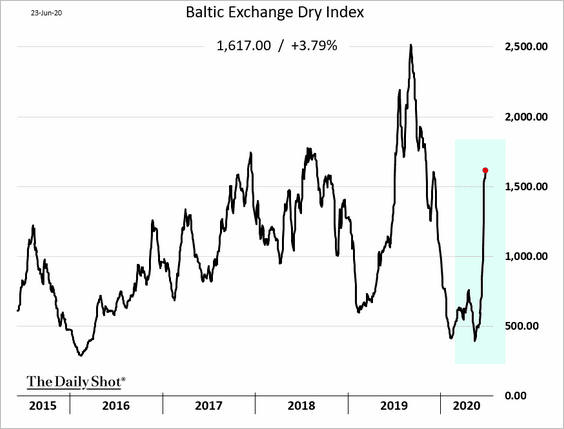
2. Dry bulk shipping costs are rebounding amid improving demand from China (particularly for iron ore).
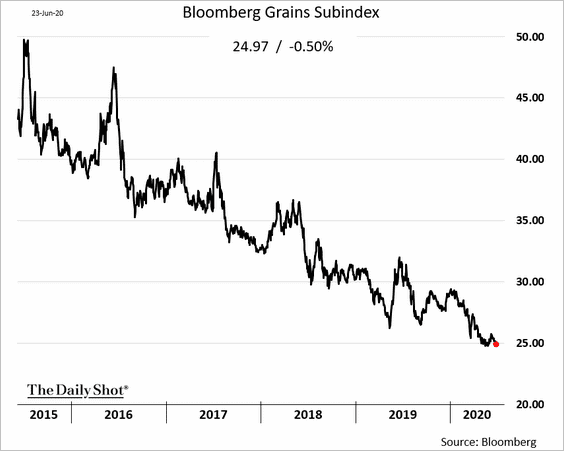
3. This chart shows Bloomberg’s grains index.
Equities
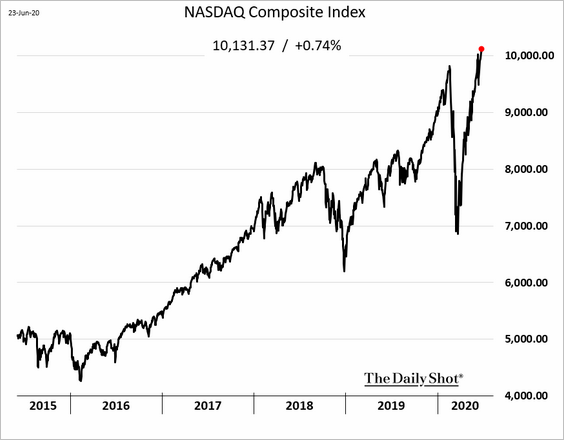
1. The Nasdaq Composite hit a record high.
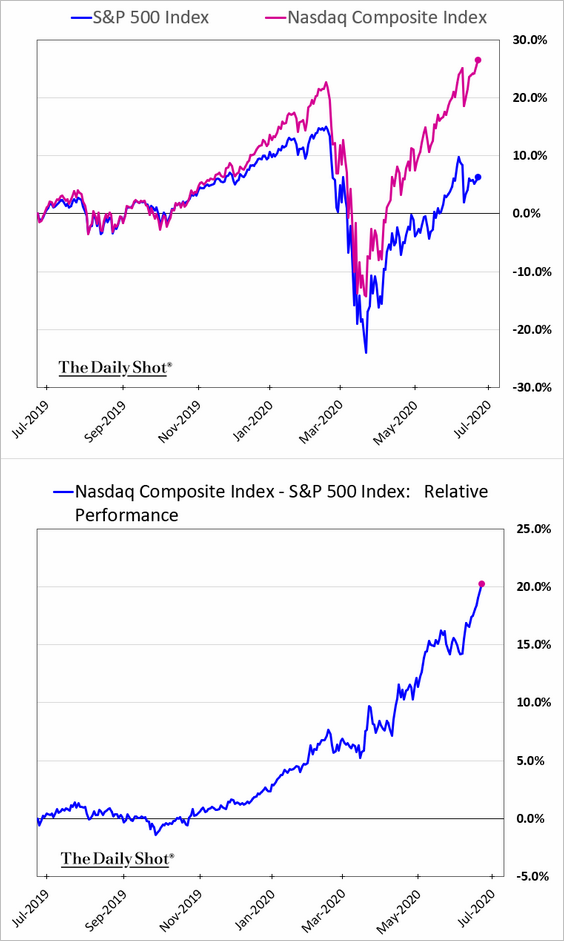
• The index beat the S&P 500 by more than 20% over the past twelve months.
• The tech mega-caps have been driving the outperformance.
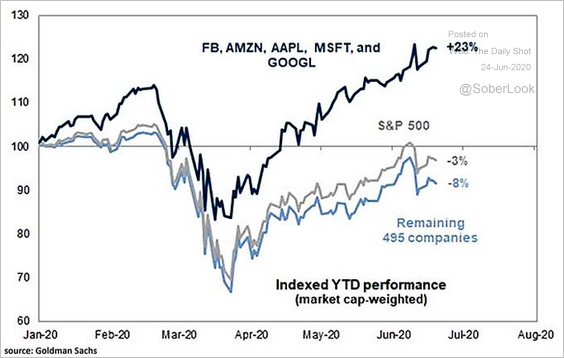 Source: @ISABELNET_SA, @GoldmanSachs
• Here are a couple of comparisons to the dot-com bubble.
– The S&P tech index to the S&P 500 ratio:
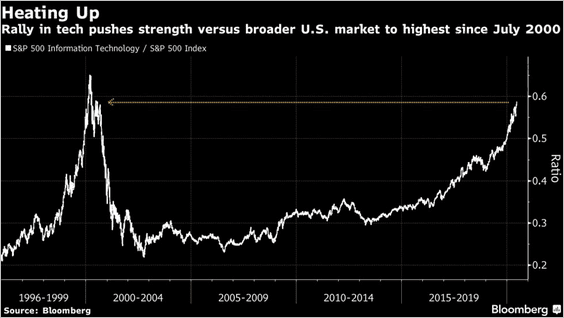 Source: @markets Read full article
– The Nasdaq 100 to the S&P 500 ratio:
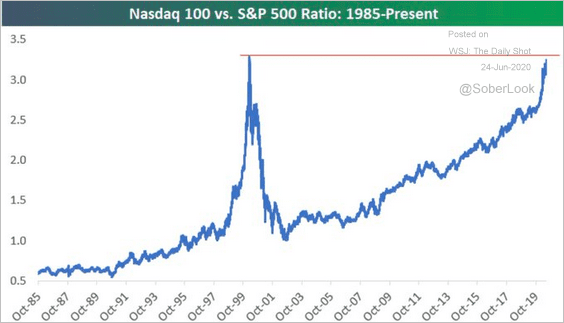 Source: @WallStJesus Read full article
——————–
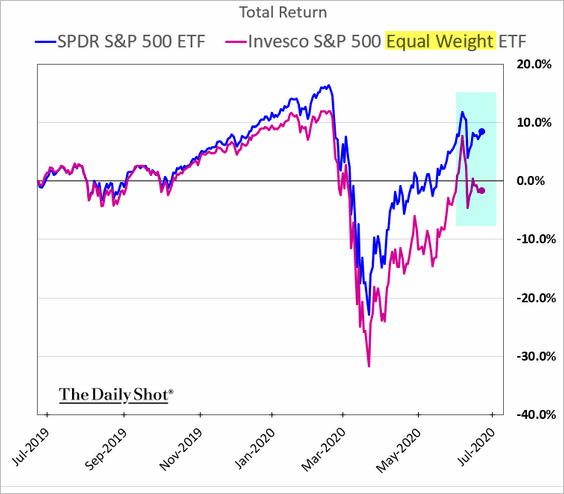
2. After a sharp rebound, the equal-weight index is lagging again. With the COVID-19 situation remaining challenging, investors are betting on the tech mega-caps (the new “safe-haven” asset class) supporting the “stay-home” economy.
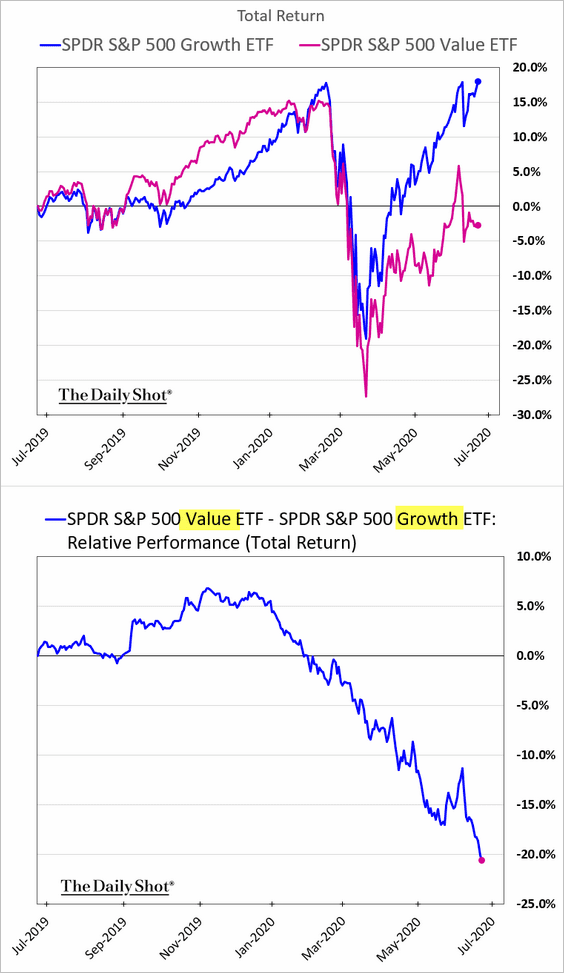
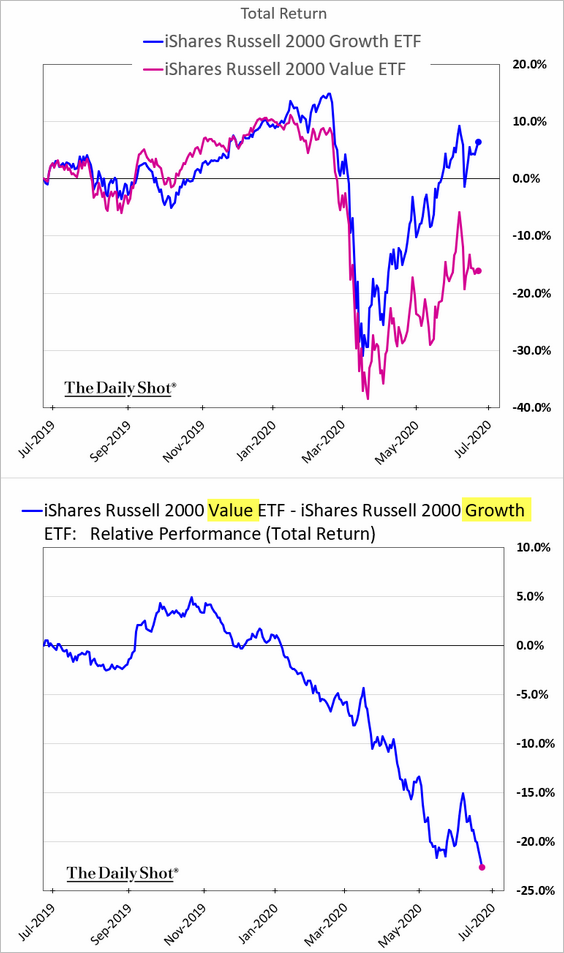
3. The outperformance of growth stocks vs. value keeps widening.
• Large caps:
• Small caps:
——————–
4. Boosted by Amazon, the consumer discretionary sector has been outpacing consumer staples.
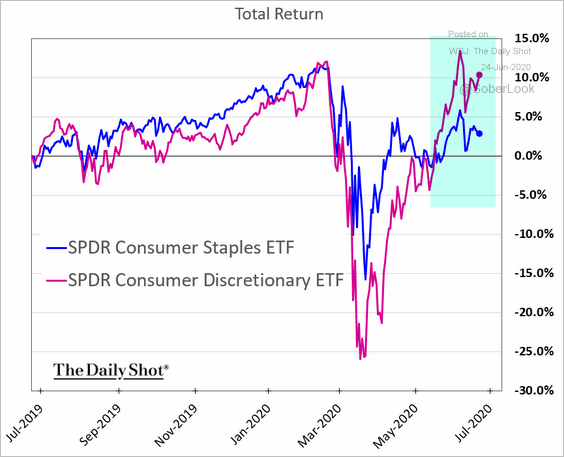 h/t Nancy Moran
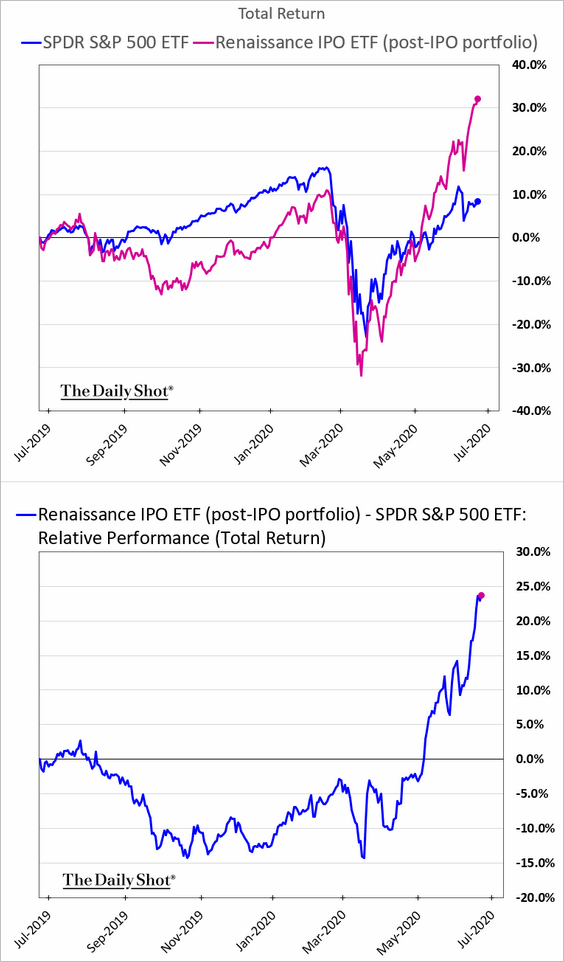
5. Post-IPO stocks have massively outperformed the S&P 500, making it a great time to launch an IPO.
6. Here are some style/factor trends.
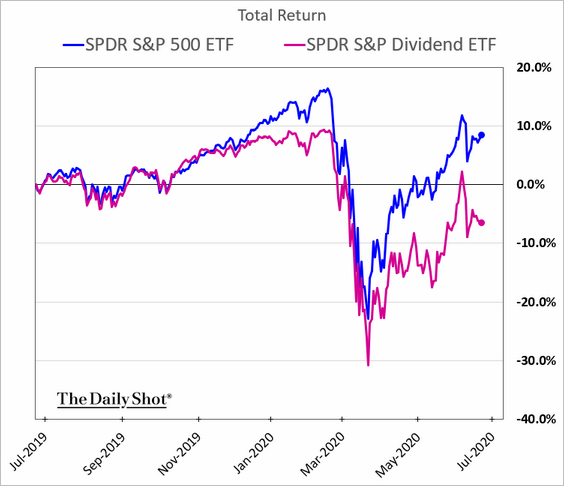
• High coupon shares:
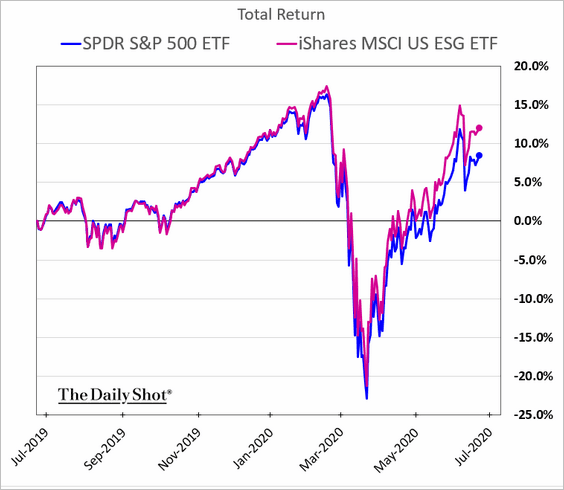
• ESG strategy:
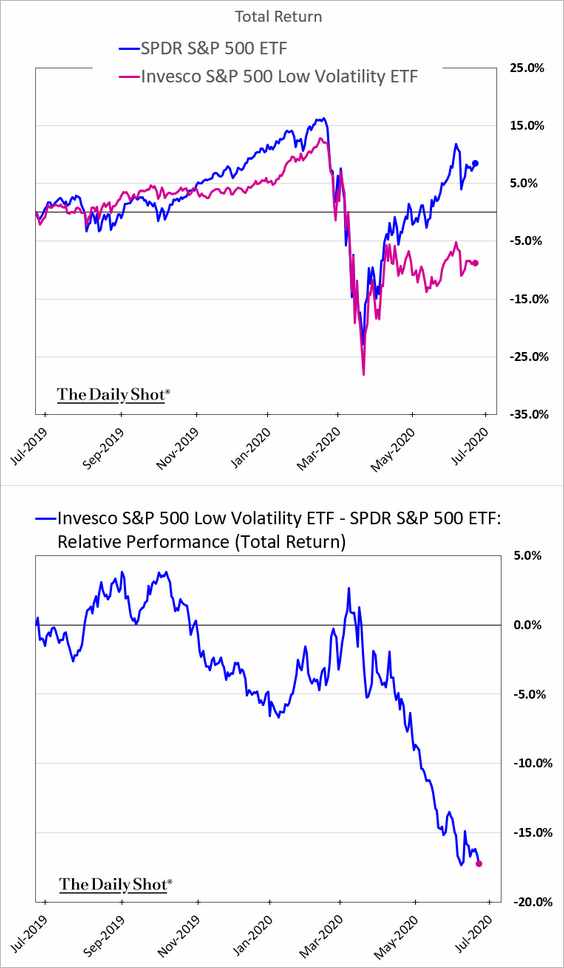
• Low-vol strategy:
——————–
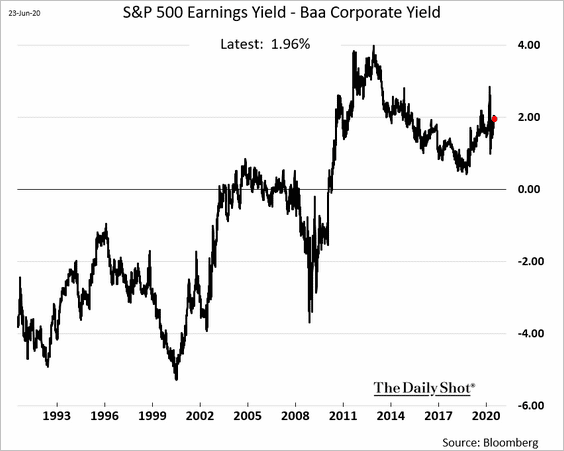
7. The stock market is attractive relative to credit as investment-grade yields hover near record lows.
8. The put/call ratio has diverged from the AAII sentiment indicator. Investors say they are cautious, but the options market activity says otherwise.
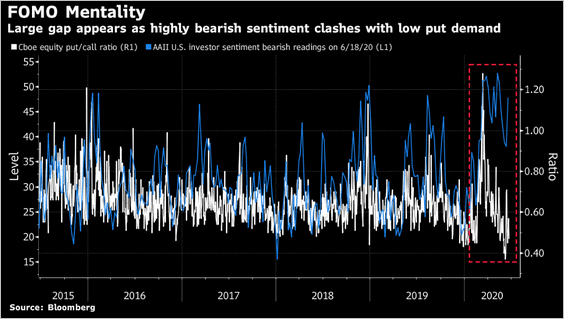 Source: Cormac Mullen, @TheTerminal Read full article
9. The cheapest three quintiles of stocks are trading below their 20-year average, while the most expensive quintile is trading above average.
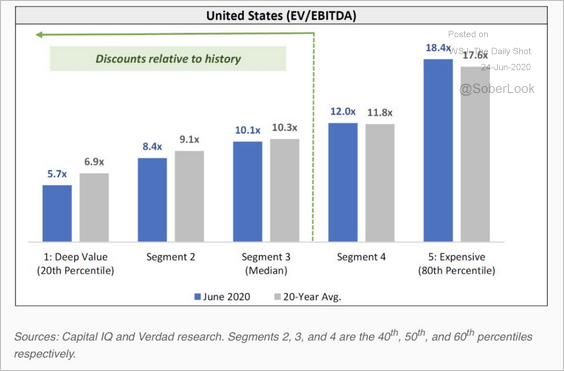 Source: @verdadcap
10. Globally, 80% of the markets trade with valuations in the upper quartile relative to historical averages.
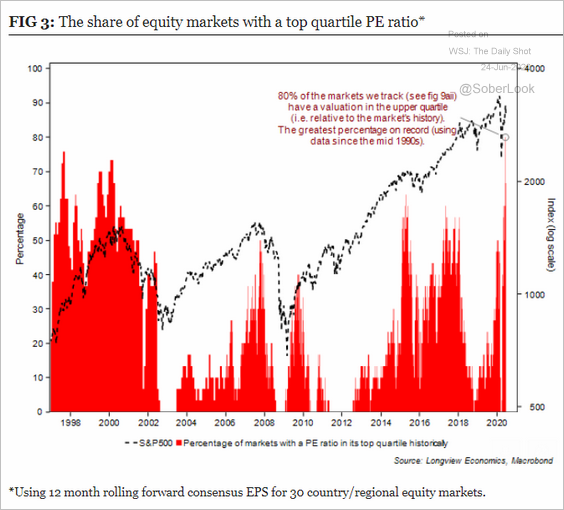 Source: Longview Economics Further reading
11. Share buybacks have slowed sharply.
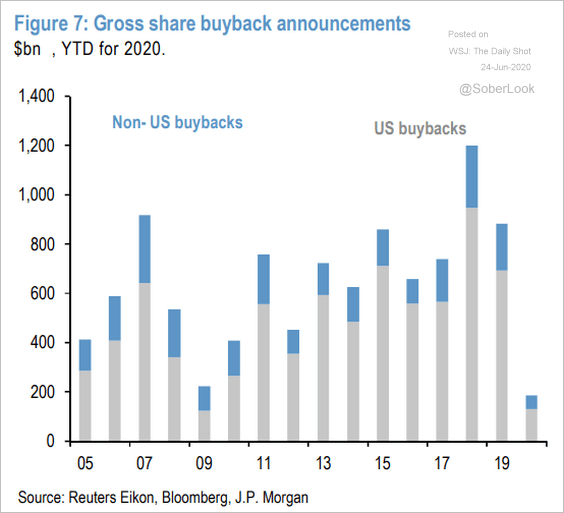 Source: @ISABELNET_SA, @jpmorgan
12. REITs have managed to recover from the abyss, but retail and lodging segments continue to lag.
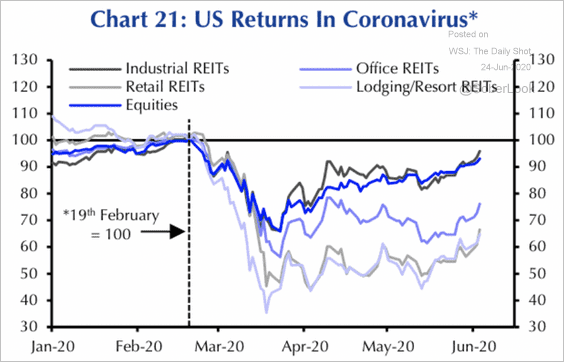 Source: Capital Economics
Credit
1. Bankruptcies spiked over the past week.
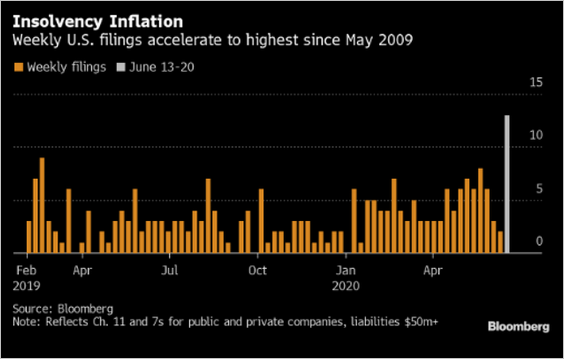 Source: @lisaabramowicz1, @jtcrombie, @theterminal
2. Credit expansion is expected to be a tailwind for growth.
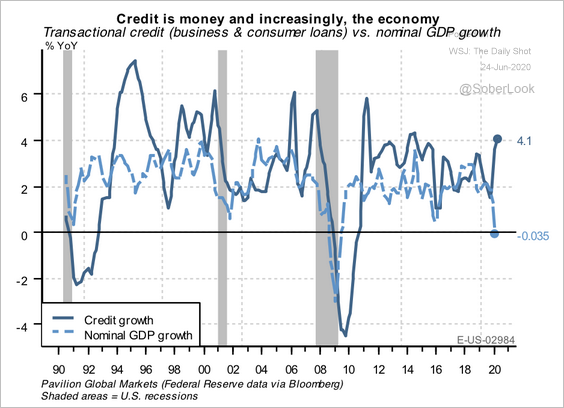 Source: Pavilion Global Markets
3. Foreign firms are taking advantage of the Fed’s accommodative policy that boosted demand for dollar-denominated credit.
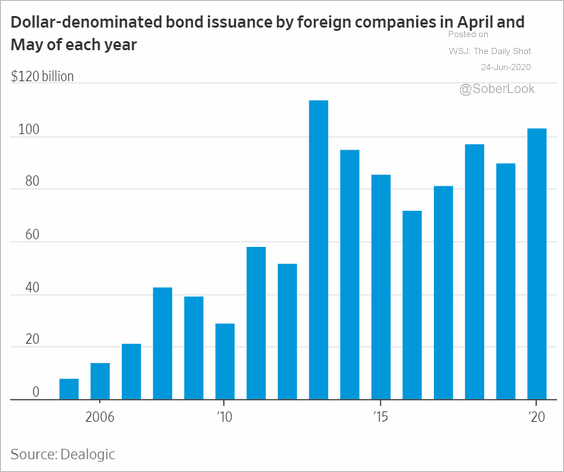 Source: @WSJ Read full article
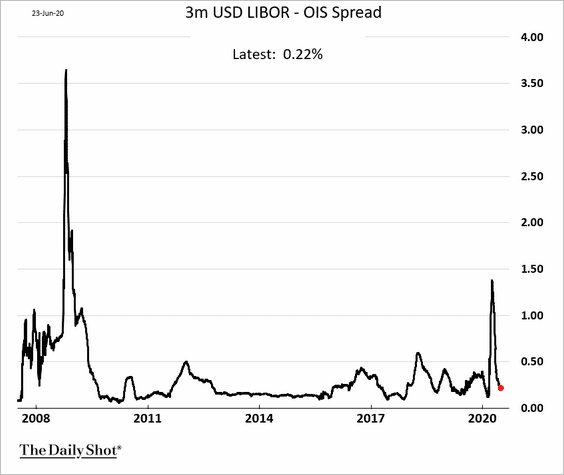
4. The LIBOR-OIS spread returned to normal once it became clear that the banking system is awash with liquidity.
5. Leveraged loans experienced substantial outflows during this crisis.
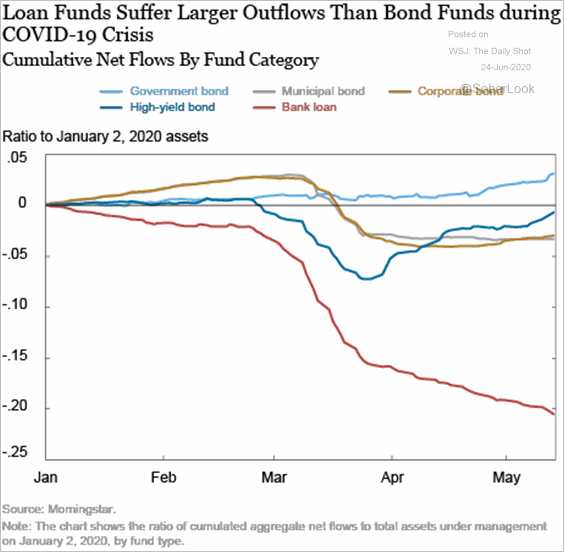 Source: Liberty Street Economics Read full article
6. LIBOR floors on new leveraged loans are back after the Fed took rates to zero.
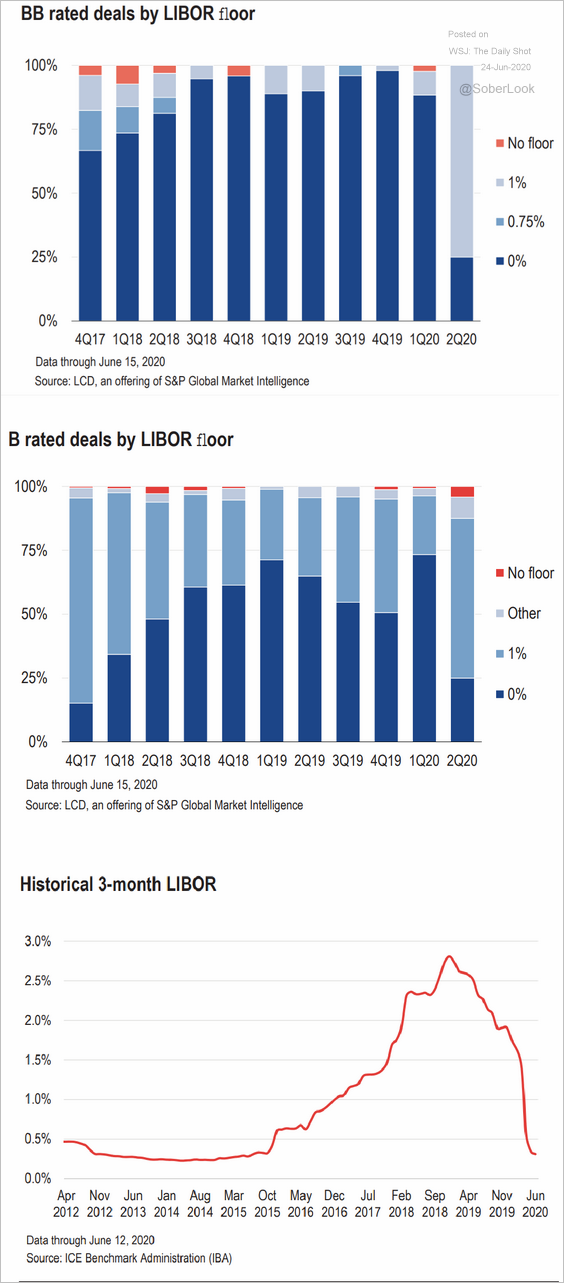 Source: LCD/S&P Global Market Intelligence
7. CLOs still provide the bulk of the demand for leveraged loans.
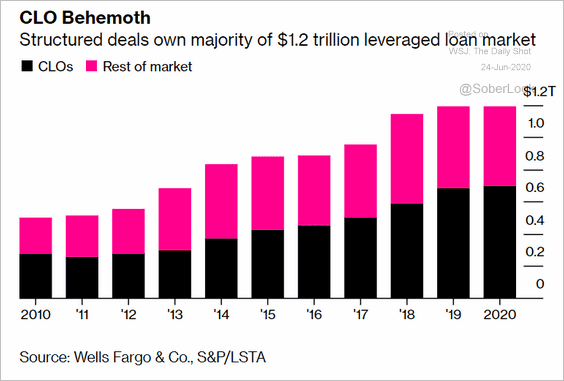 Source: @markets Read full article
8. Insurance companies have pulled back on CLO investing this year.
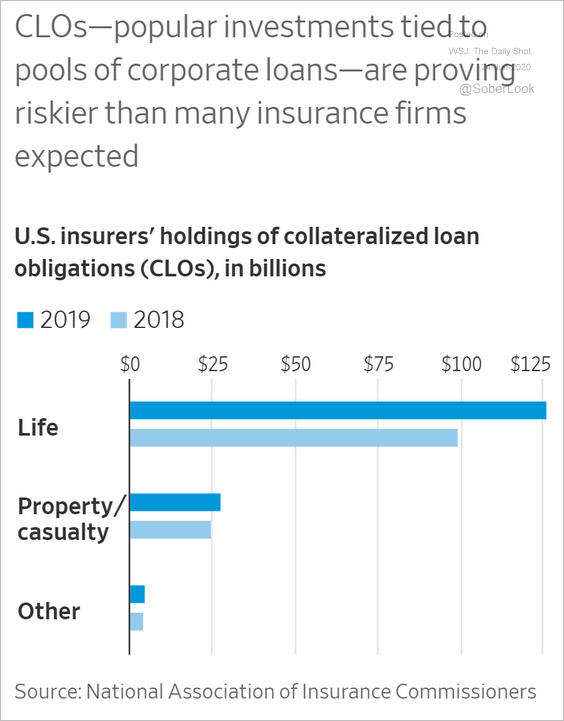 Source: @WSJ Read full article
Rates
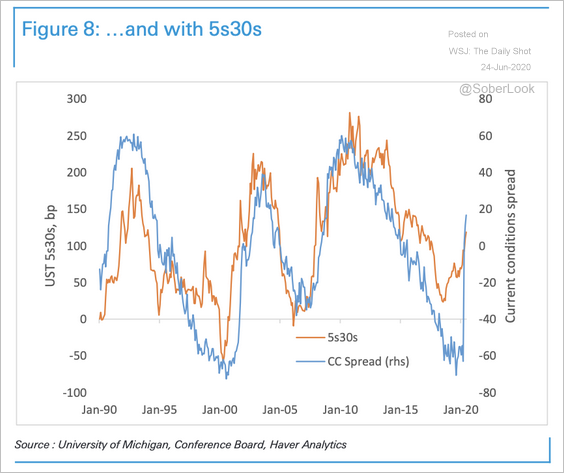
1. The difference between the University of Michigan’s current conditions index and the Conference Board’s survey has been correlated with the 2s10s and 5s30s segments of the treasury yield curve.
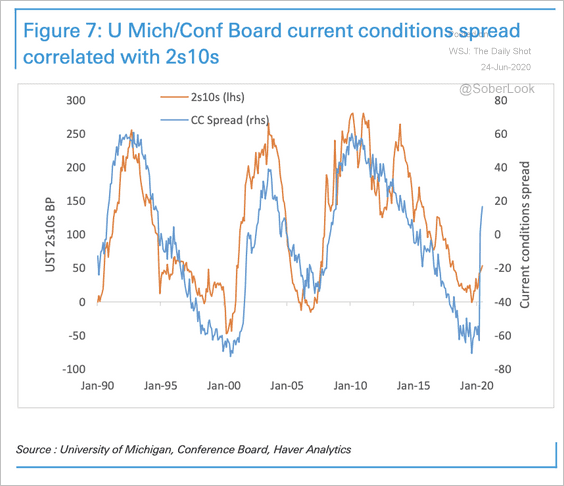 Source: Deutsche Bank Research
 Source: Deutsche Bank Research
——————–
2. Nearly half of all banks in the Fed’s Senior Loan Officer Survey are seeing loan yields greater than the cost of funds. This is a result of a steepening yield curve.
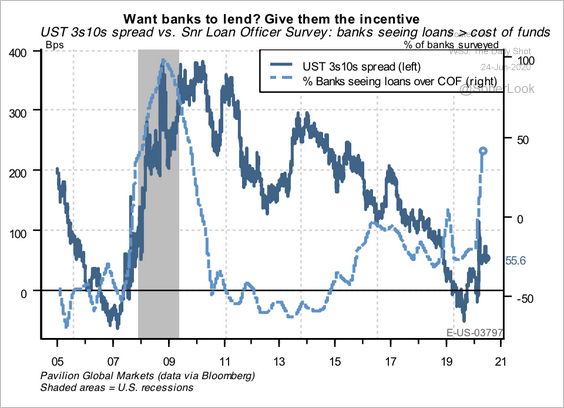 Source: Pavilion Global Markets
3. Here is the trajectory of the 10yr Treasury yield vs. 2009.
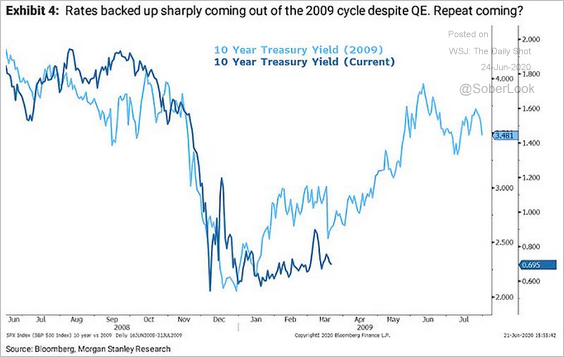 Source: @ISABELNET_SA, @MorganStanley
4. Falling inflation will moderate the bond sell-off, according to Alpine Macro.
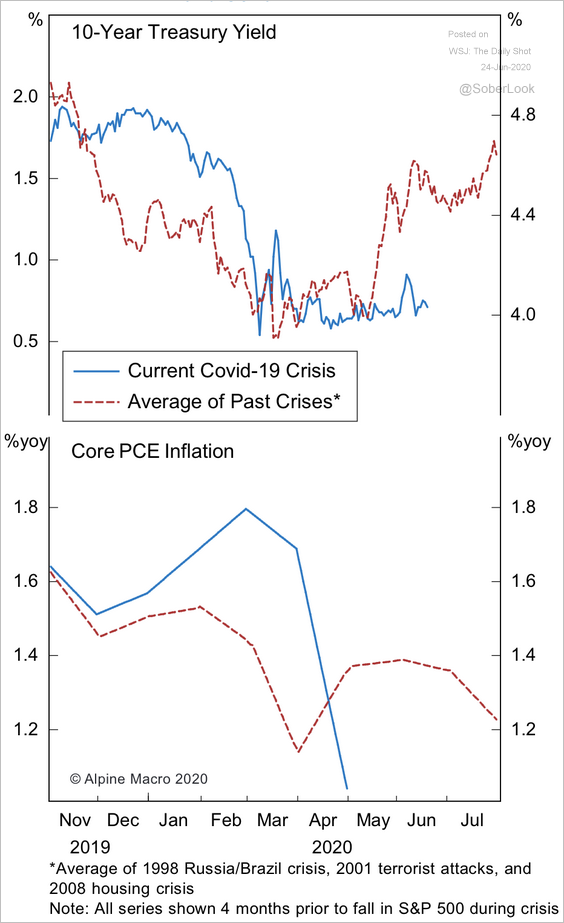 Source: Alpine Macro
5. Treasury volatility has stayed low even as FX volatility has picked up recently.
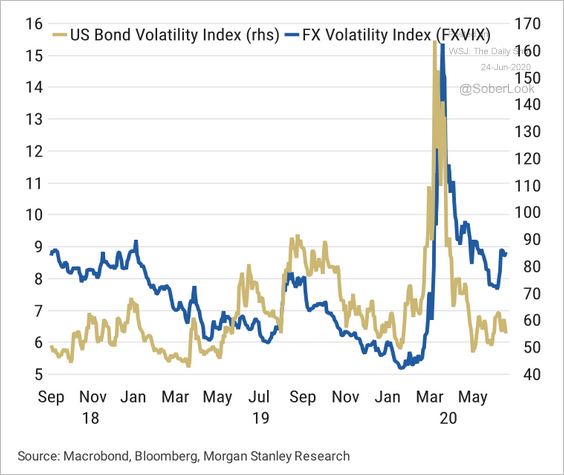 Source: Morgan Stanley Research
Global Developments
1. Advanced economies have delivered more fiscal stimulus than what we see in emerging markets.
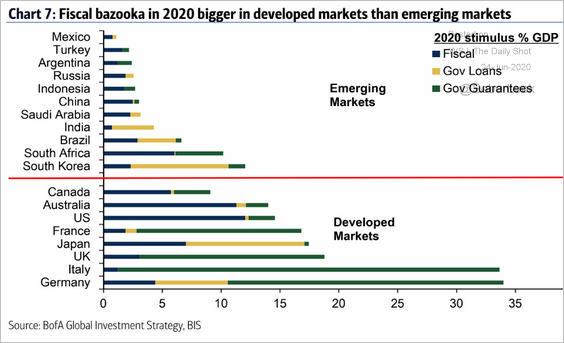 Source: BofA Merrill Lynch Global Research
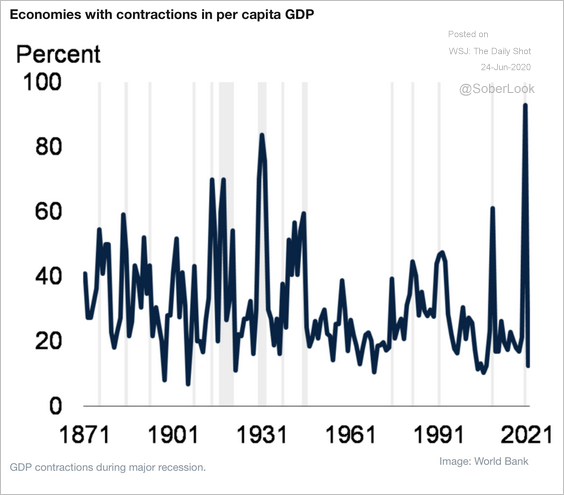
2. This chart shows the global recessions since 1876.
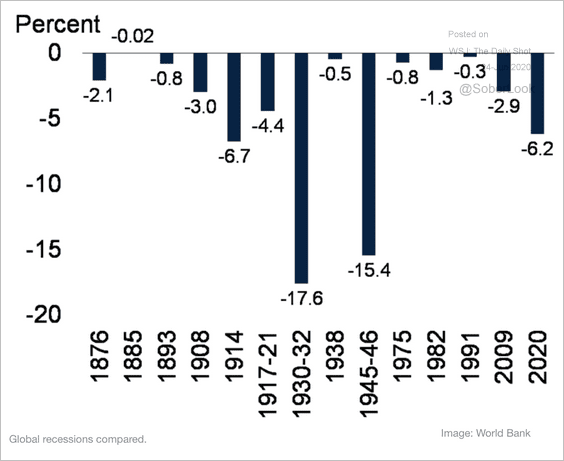 Source: WEF Read full article
This year will have the highest synchronization of national recessions since 1870.
 Source: WEF Read full article
It’s the sharpest contraction across multiple measures of economic activity.
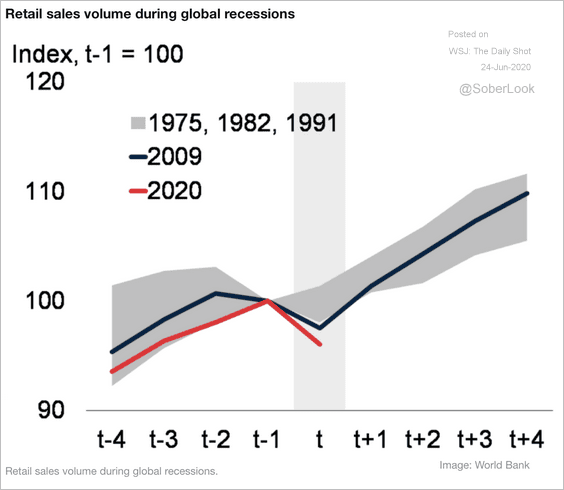 Source: WEF Read full article
——————–
Food for Thought
1. Which firms are most affected by H-1B visa restrictions?
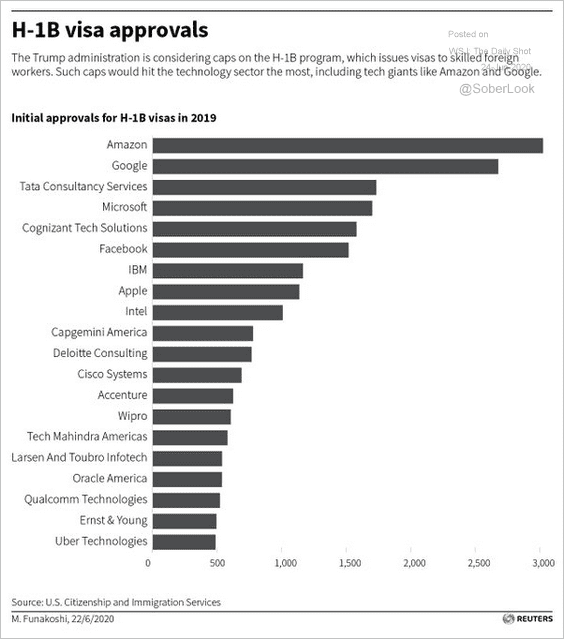 Source: @Reuters, @dvdwyer Read full article
2. How states verify absentee/mailed ballots:
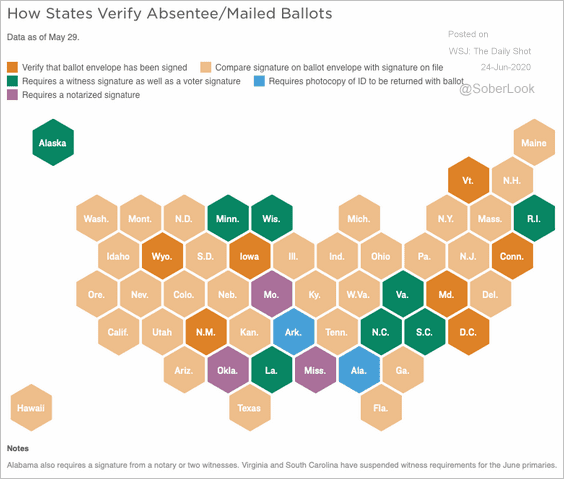 Source: Morning Consult Read full article
3. The shift in religious affiliation:
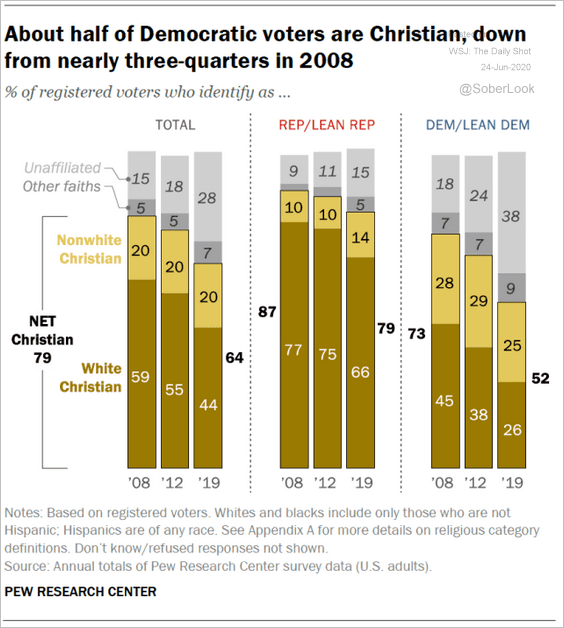 Source: @PewReligion Read full article
4. Trends in national pride:
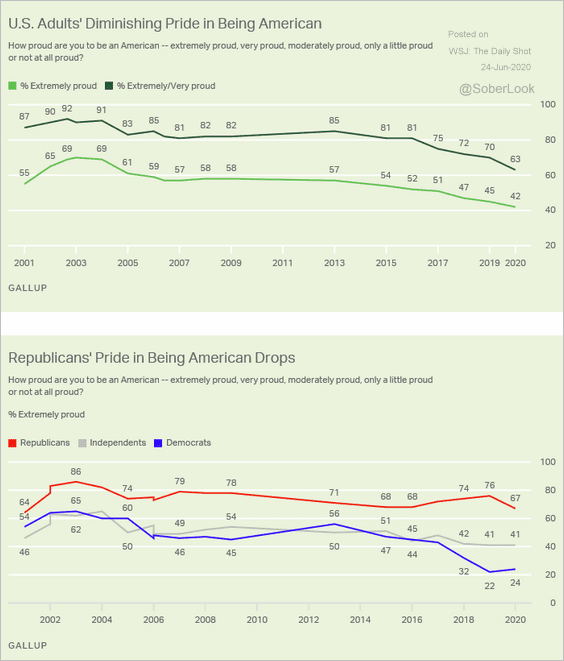 Source: Gallup Read full article
5. The median age of Floridians who tested positive for COVID-19:
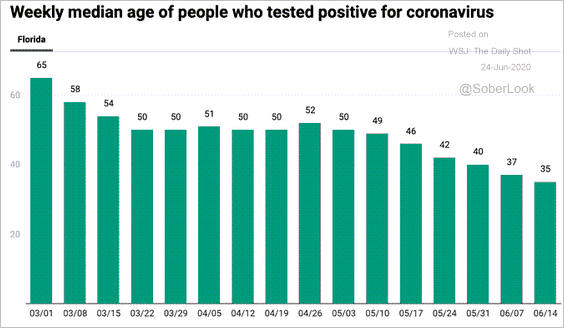 Source: @nataliexdean, @ScottGottliebMD
6. COVID-19 in US prisons:
 Source: Statista
7. India-China military conflicts:
 Source: BCA Research
The two nations’ armed forces:
 Source: @WSJ Read full article
——————–
8. Social mobility vs. income inequality:
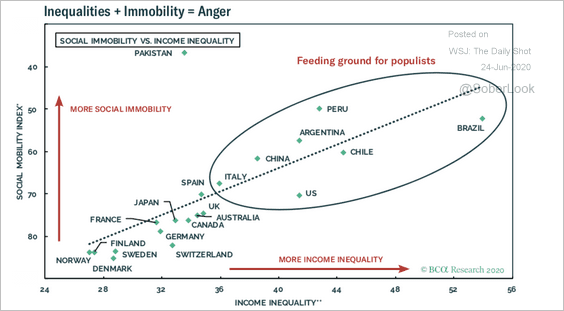 Source: BCA Research
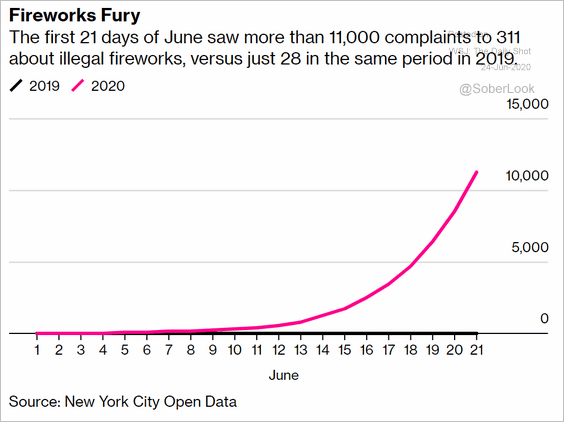
9. Complaints about illegal fireworks in New York City (now vs. 2019):
 Source: @business Read full article
——————–