
The Daily Shot: 26-Jun-20
• The United States
• Canada
• The United Kingdom
• Asia – Pacific
• China
• Emerging Markets
• Energy
• Equities
• Credit
• Global Developments
• Food for Thought
The United States
1. Durable goods orders rebounded in May.
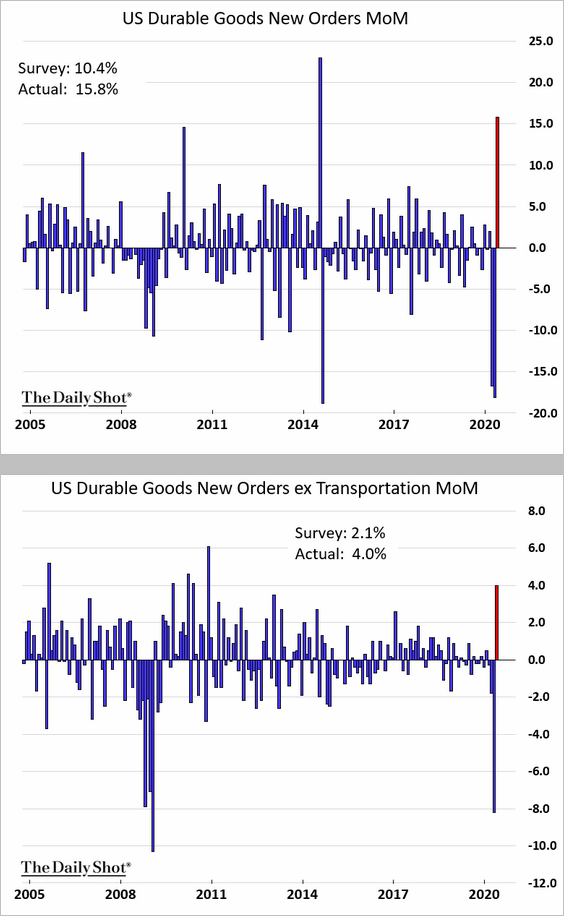
Capital goods orders (machinery, equipment, etc.) also showed improvement.
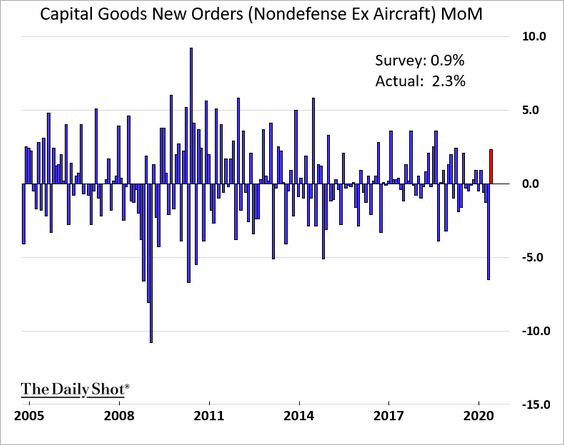
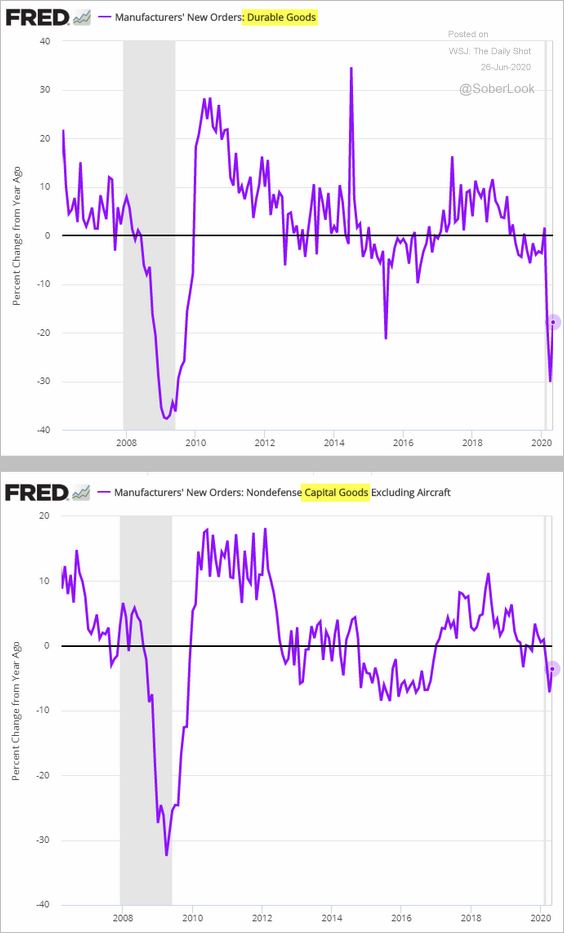
Orders are still substantially below 2019 levels. Here is what the situation looks like on a year-over-year basis.
——————–
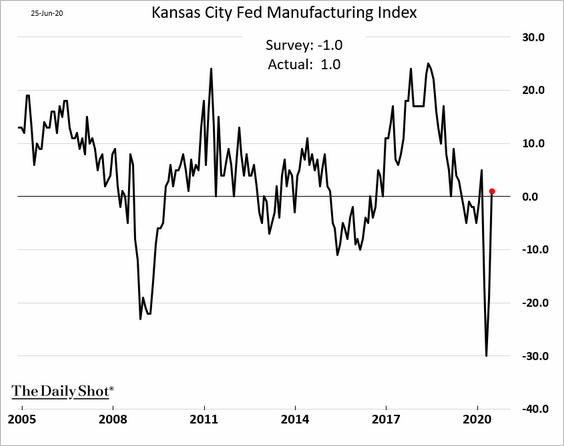
2. The Kansas Citi Fed’s regional factory index recovered in June. As discussed previously, some of this improvement is due to pent-up demand from the lockdowns.
Employment is still soft.
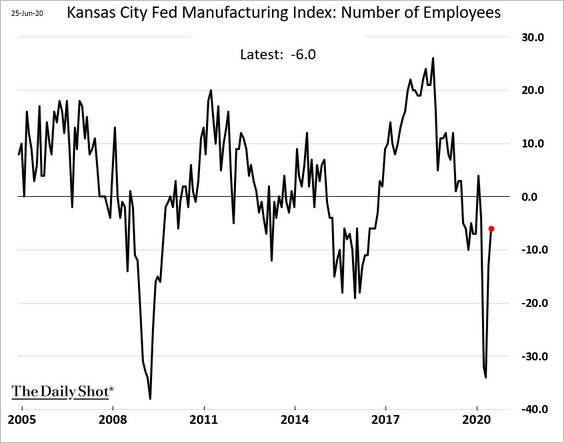
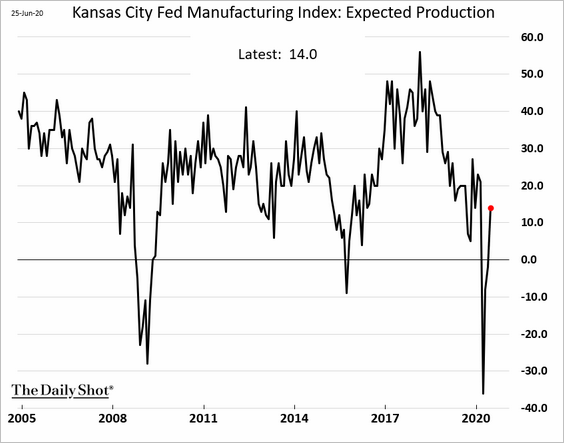
But manufacturers are upbeat about the future.
——————–
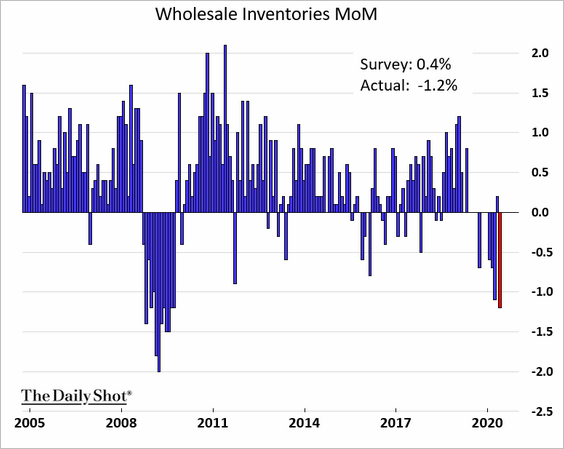
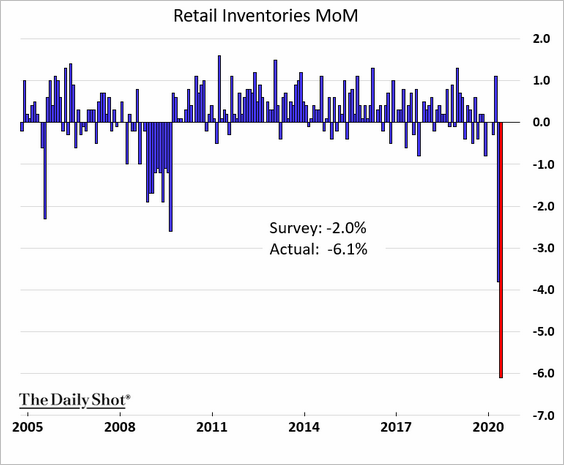
3. Inventory reductions continued in May.
• Wholesale inventories (monthly changes):
• Retail inventories:
——————–
4. The trade gap widened more than expected.
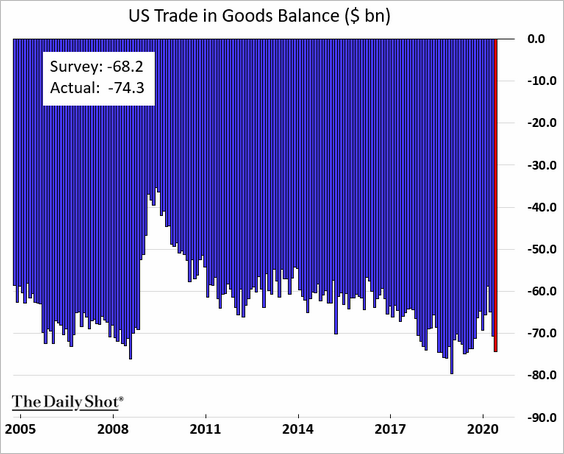
Trade activity remains depressed.
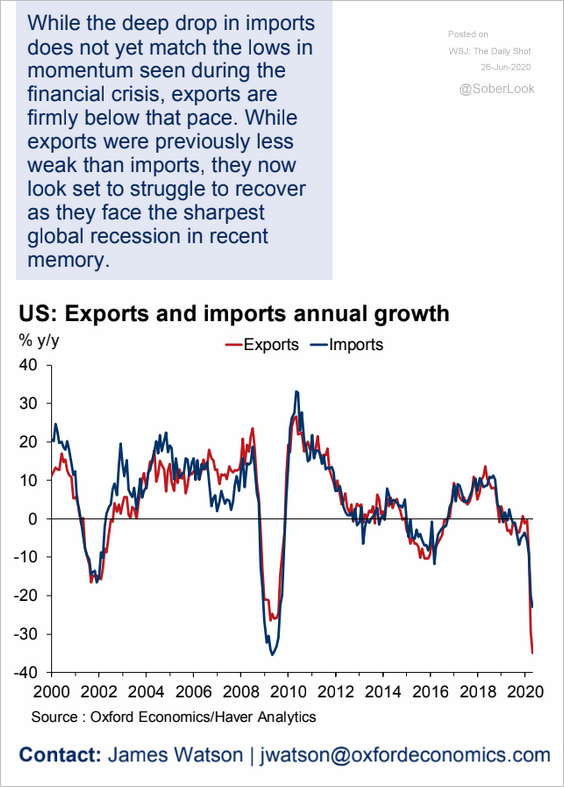 Source: Oxford Economics
——————–
5. Next, we have some updates on the labor market.
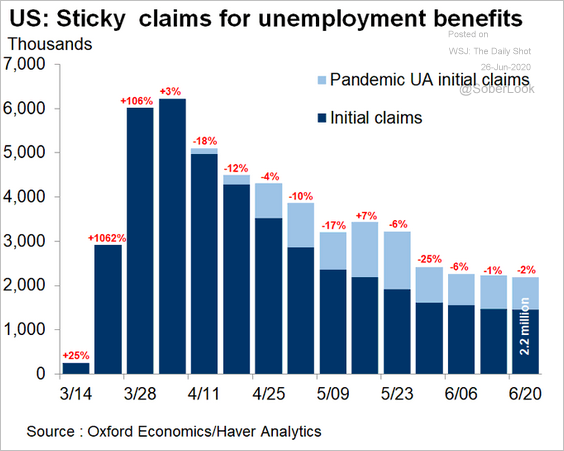
• The declines in initial unemployment claims have stalled (the chart below is not seasonally adjusted).
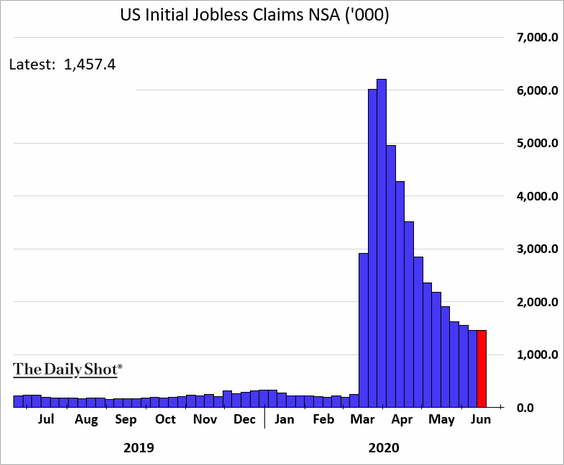
Including the Pandemic Unemployment Assistance (PUA) claims, new filings are holding above two million per week.
 Source: @GregDaco
• The total continuing claims are stuck near 30 million, which is almost 15% of the nation’s working-age population.
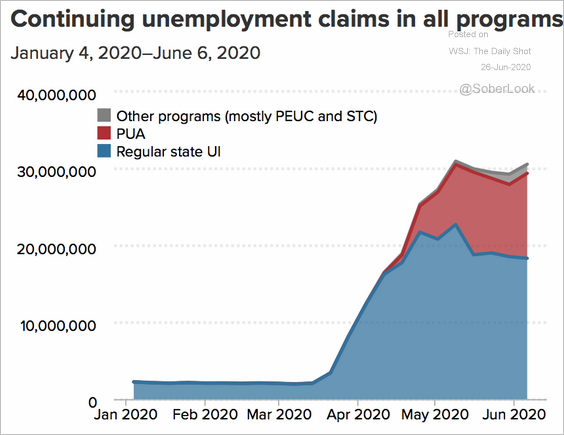 Source: EPI, @hshierholz
• New job postings continue to improve.
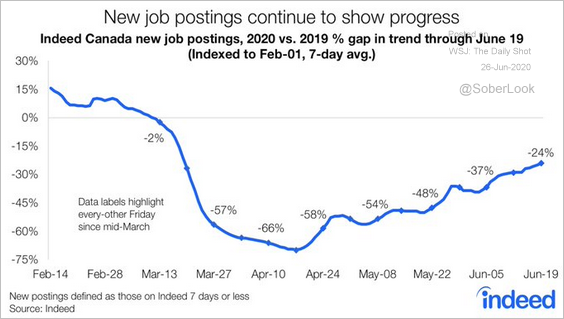 Source: @BrendonBernard_, @IndeedCanada
• Here is the probability of a wage cut or freeze by wage category (2020 vs. 2019).
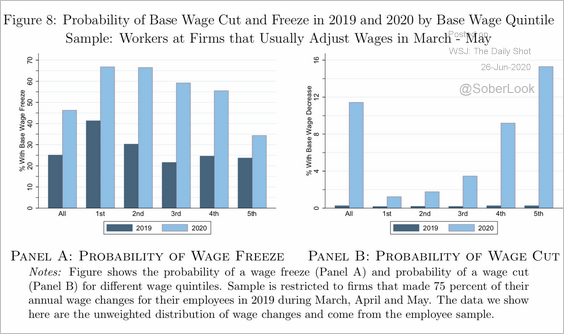 Source: Brookings Papers on Economic Activity Read full article
• Small firm employment recovery in states with rising COVID-19 cases appears to have peaked. Will we start seeing declines.
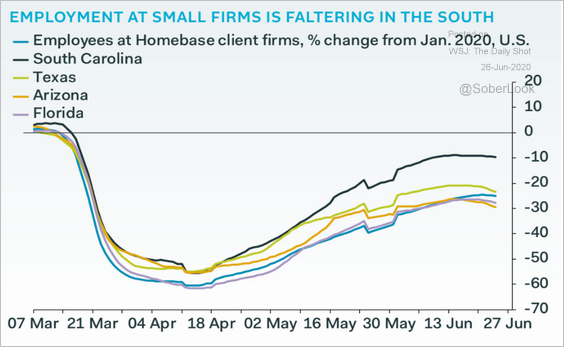 Source: Pantheon Macroeconomics
——————–
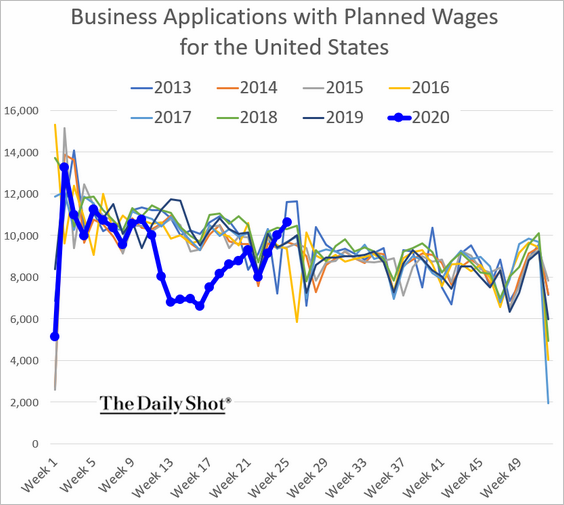
6. Business applications soared over the past few weeks.
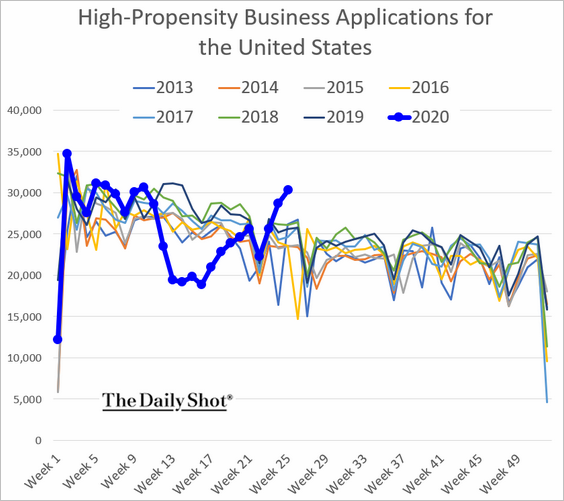
There are fewer applications for companies with payroll, but the trend remains positive.
——————–
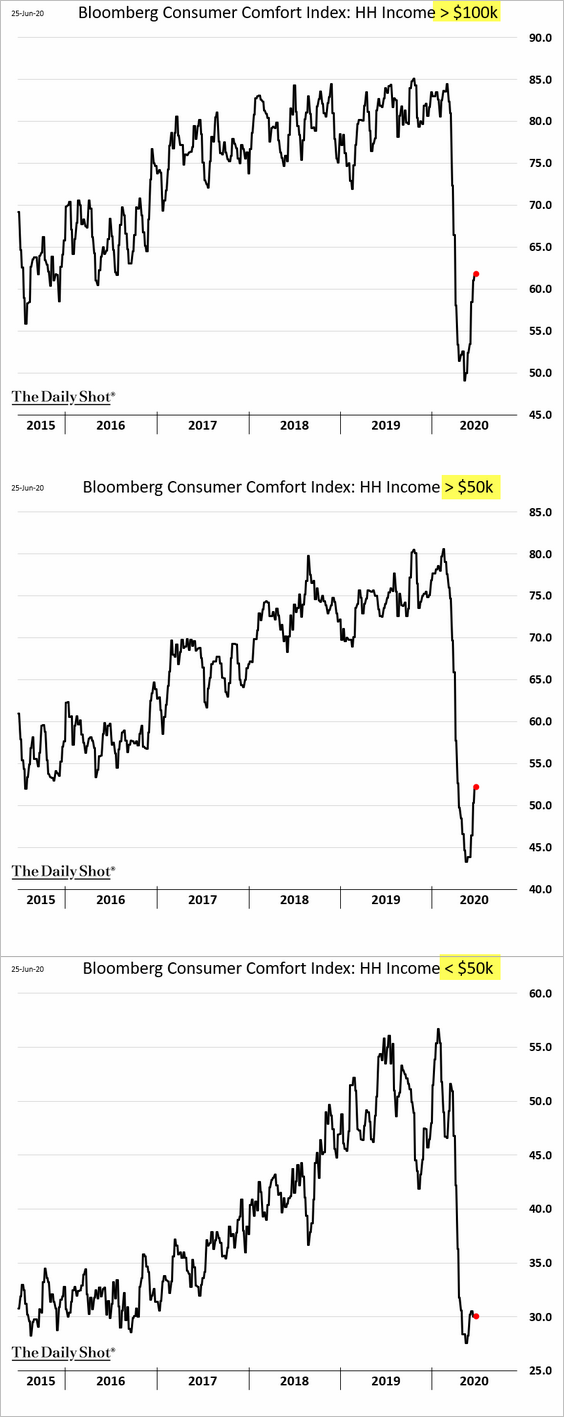
7. Bloomberg’s consumer sentiment index is off the lows.
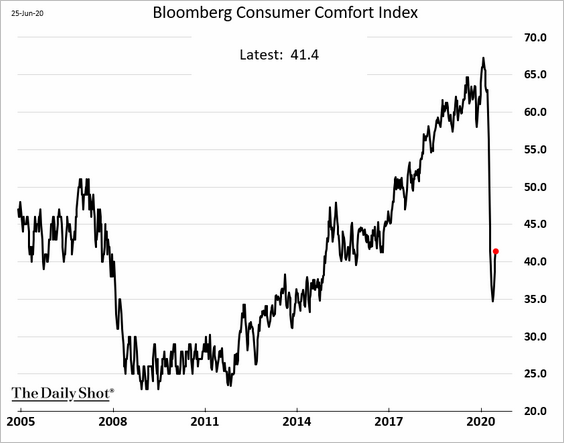
But the bounce in confidence has been uneven across income categories.
——————–
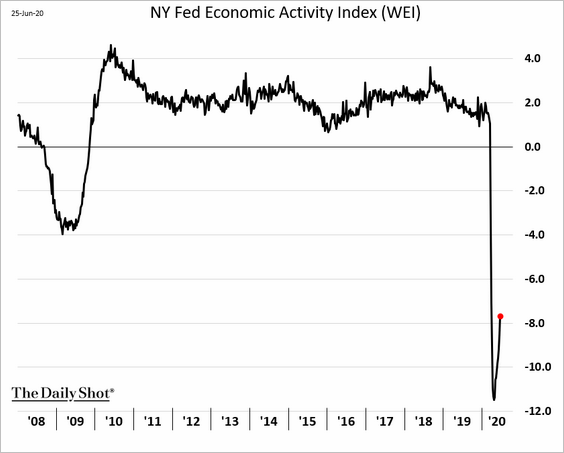
7. Here is the NY Fed’s weekly economic activity index (at the national level).
8. Consumers returned to the “social sector” of the economy in recent weeks.
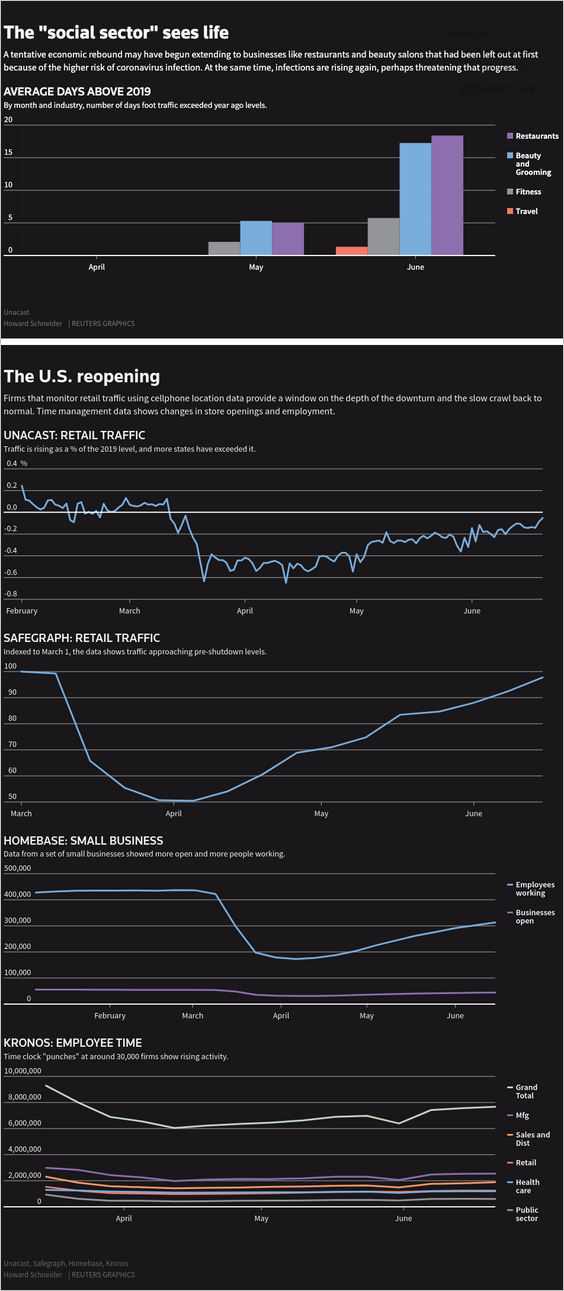 Source: Reuters Read full article
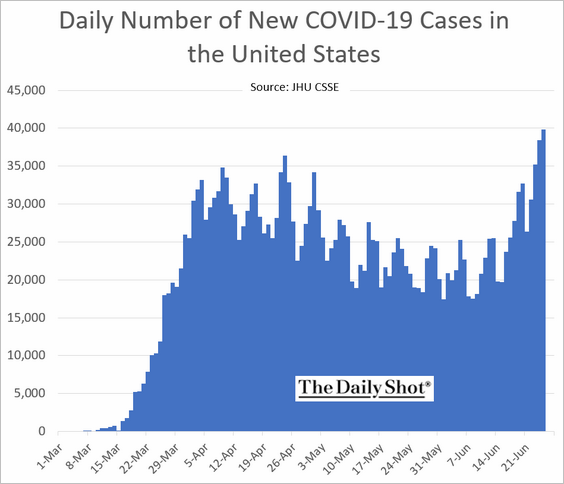
However, the increased rates of social interactions have reignited the COVID-19 pandemic in the US. The daily cases hit a record, approaching 40k new infections each day. This trend will have a substantial drag on the nation’s economic recovery.
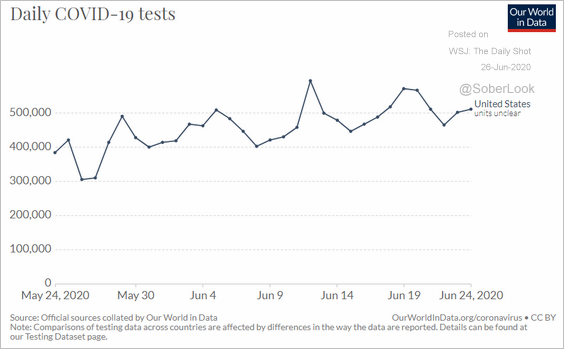
The latest spike in infections is not about increased testing, which has been relatively stable this month.
 Source: @OurWorldInData
The percentage of positive test results is soaring.
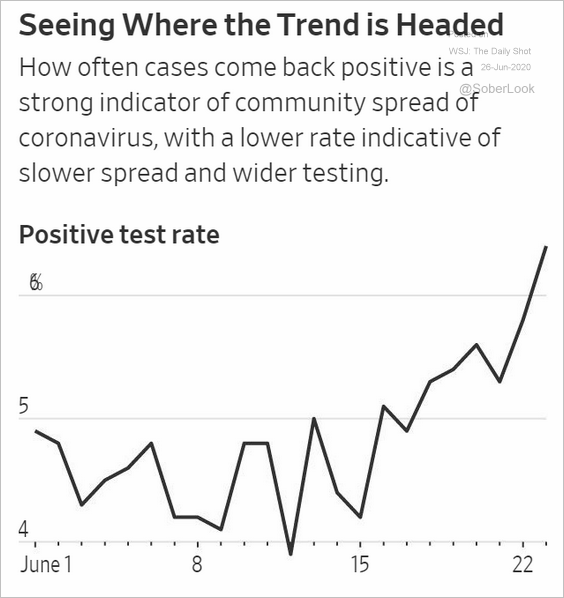 Source: @WSJ Read full article
Here are the regional trends.
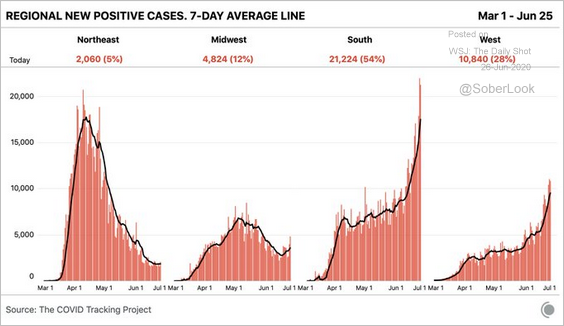 Source: @COVID19Tracking
 Source: Commerzbank Research Read full article
Canada
Activity levels at small and medium-sized businesses (SMEs) have improved substantially.
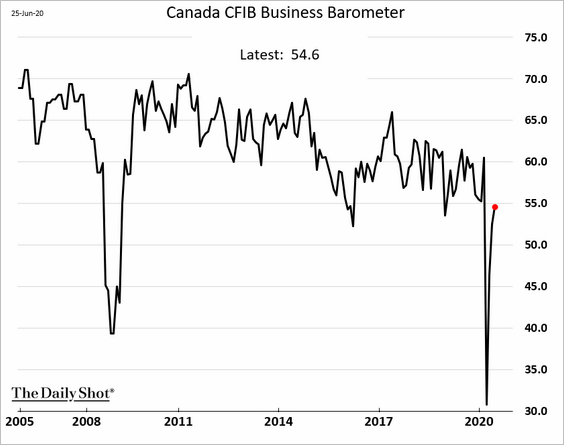
Not all sectors registered gains in June. Here is construction, for example.
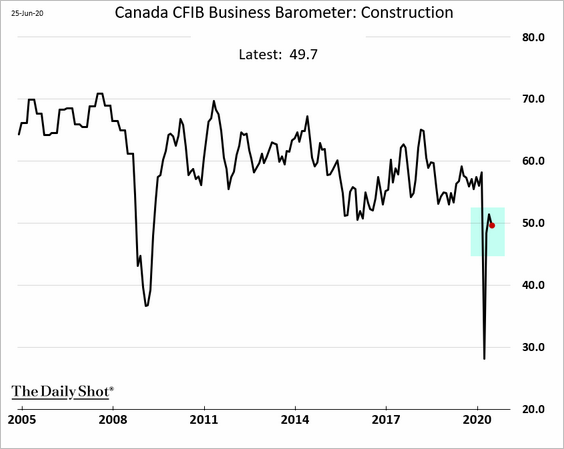
The charts below show other SME trends (from the CFIB report).
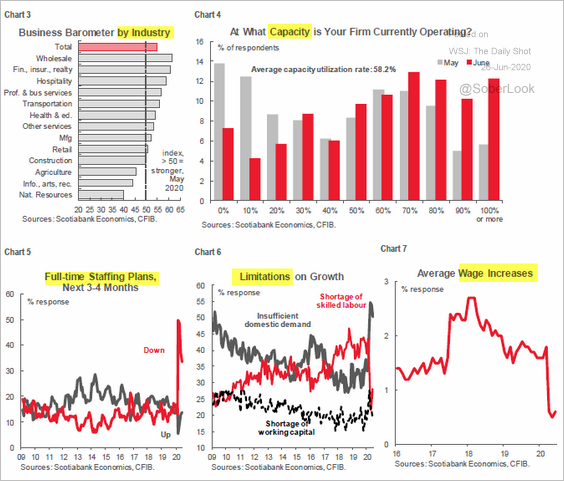 Source: Scotiabank Economics
The United Kingdom
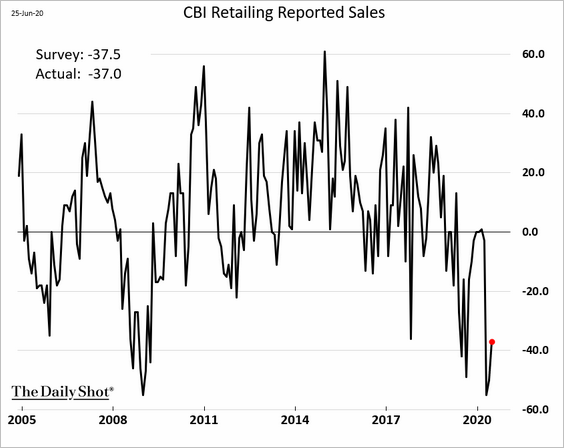
1. Retailers continue to struggle.
 Source: Retail Gazette Read full article
——————–
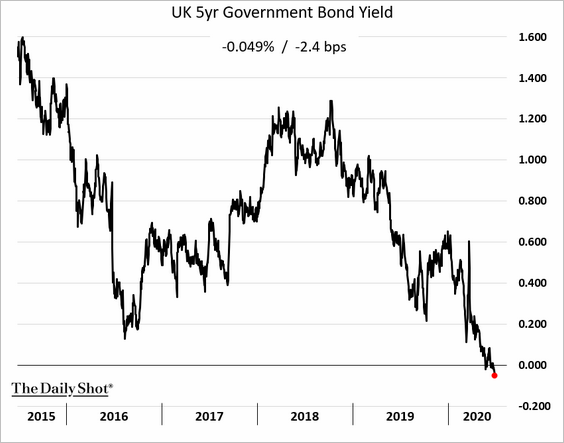
2. Gilt yields are tumbling, with the 5-year rate hitting a record low.
Asia – Pacific
1. Foot traffic in Japan is starting to stall and remains below pre-crisis levels.
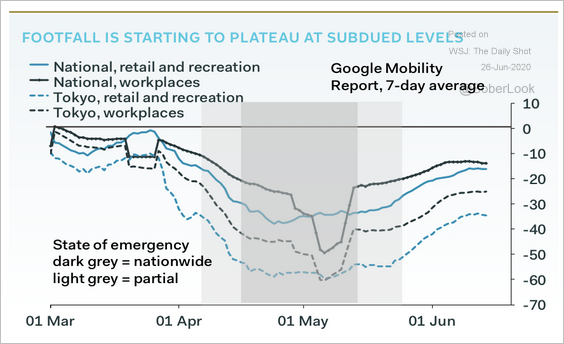 Source: Pantheon Macroeconomics
More downside is expected for merchandise sales.
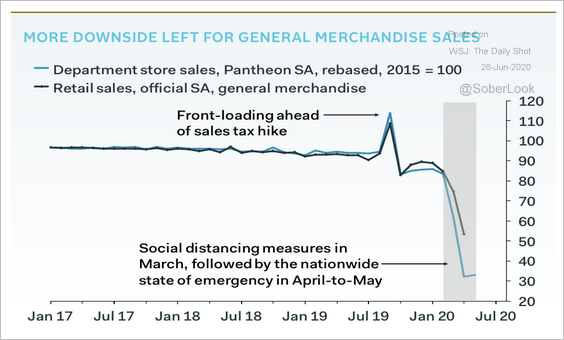 Source: Pantheon Macroeconomics
——————–
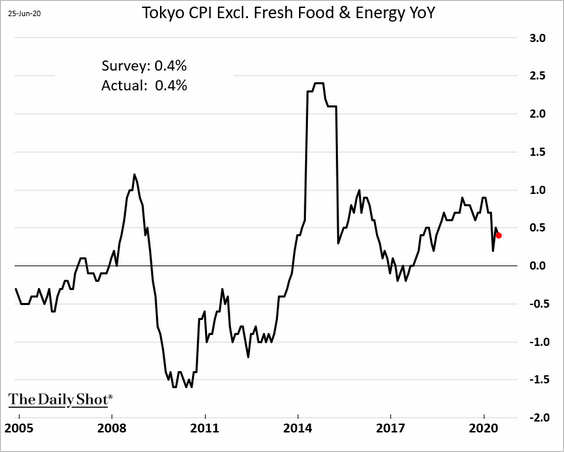
2. Tokyo’s June core CPI is holding below 0.5%.
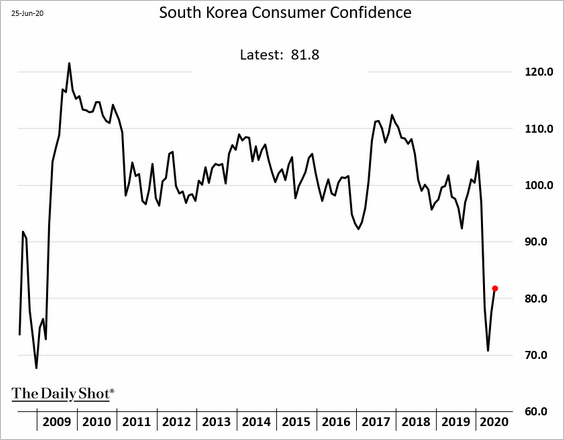
3. South Korea’s consumer confidence bounced from the lowest level in over a decade.
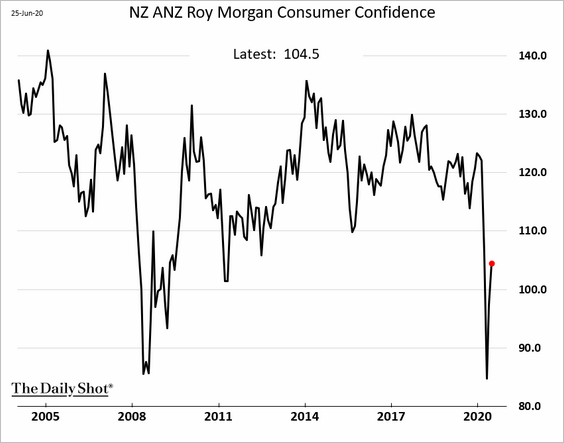
4. New Zealand’s consumer confidence is recovering as well.
China
1. Let’s begin with China’s monetary situation.
• Credit growth has accelerated over the past year, …
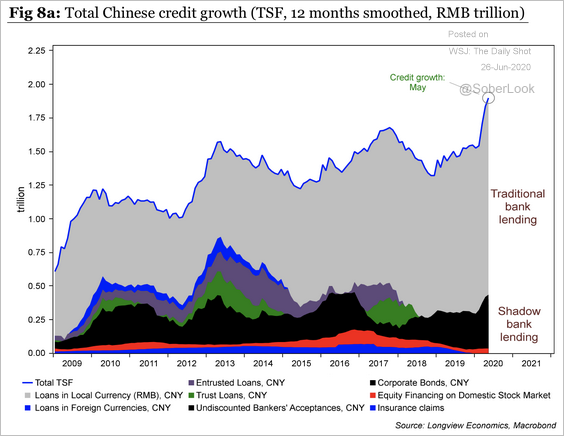 Source: Longview Economics
… and so have loan approvals.
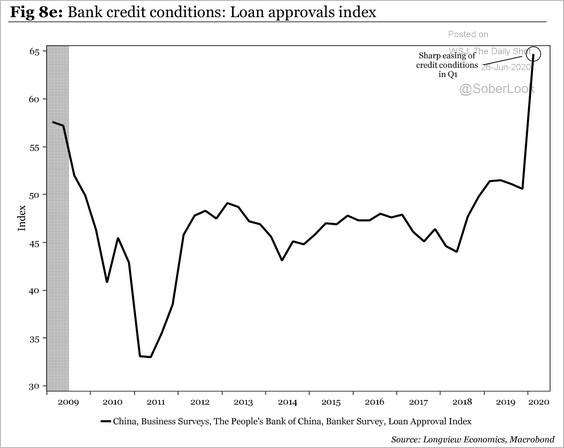 Source: Longview Economics
• Continued cuts in reserve requirements (RRR) should help banks free up lending capacity.
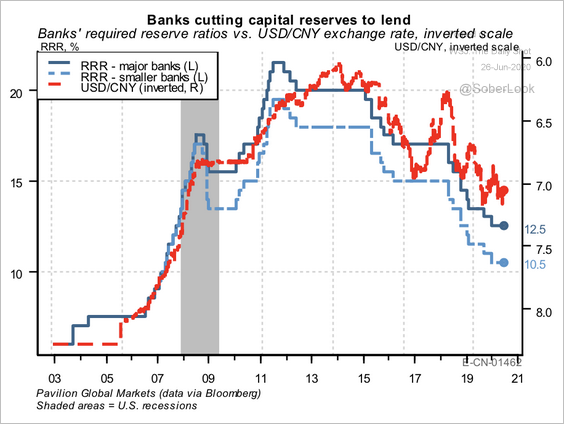 Source: Pavilion Global Markets
• But non-performing loans remain a big risk.
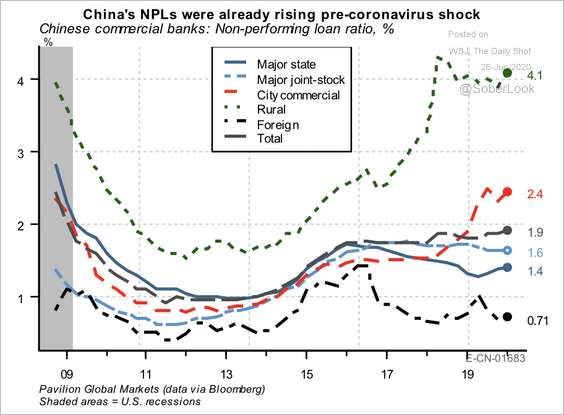 Source: Pavilion Global Markets
——————–
2. The increase in local government bond issuance, coupled with fiscal and monetary stimulus, could bolster industrial production.
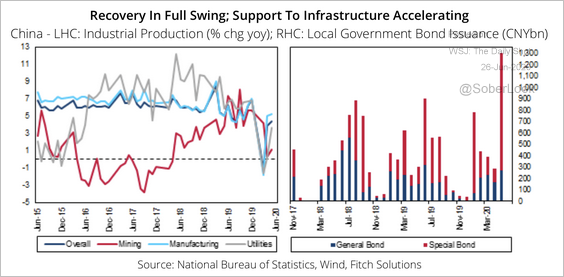 Source: Fitch Solutions Macro Research
3. Next, we have a couple of updates on Hong Kong.
• Mainland companies opening offices in Hong Kong:
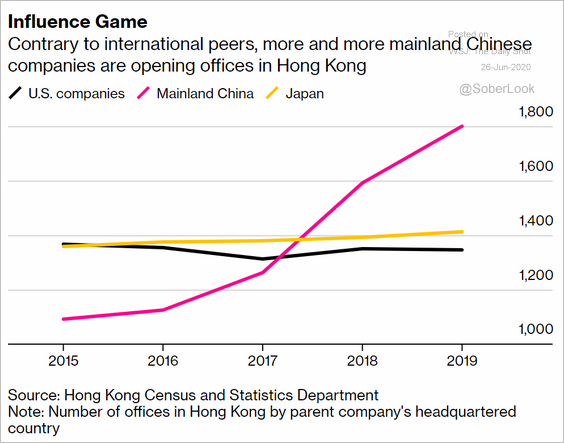 Source: @business Read full article
• Renewed retail activity:
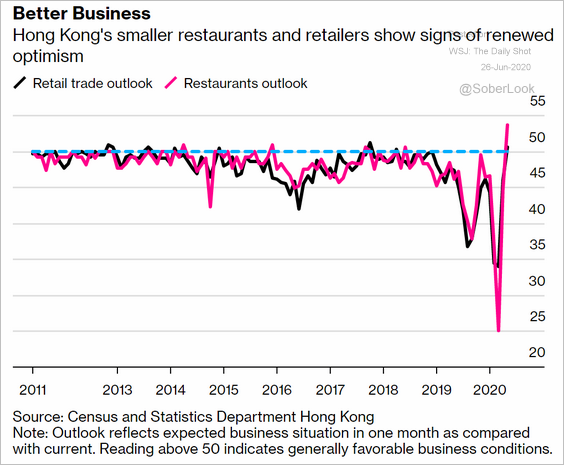 Source: @business Read full article
Emerging Markets
1. Banxico cut rates again.
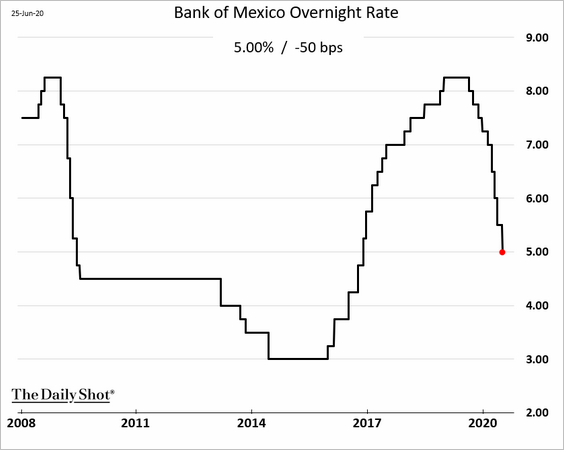
Mexico’s central bank has no choice but to keep easing.
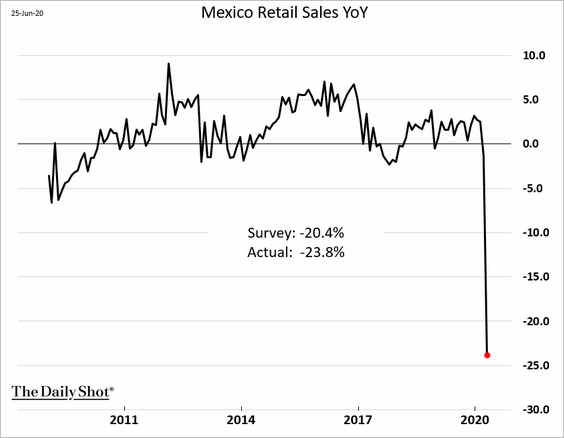
• Retail sales:
• Employment:
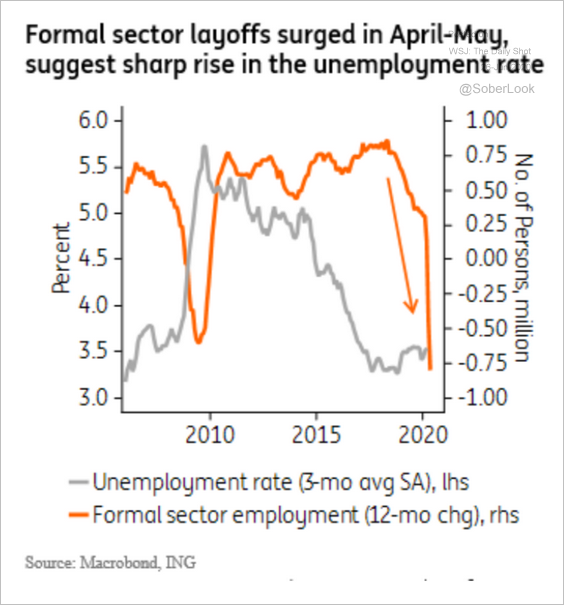 Source: ING
• The pandemic:
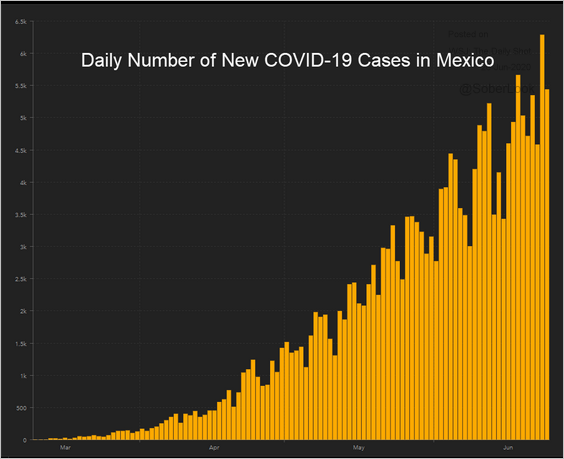 Source: JHU CSSE
——————–
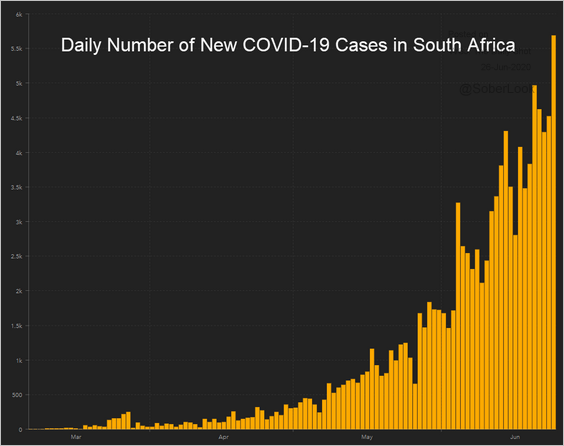
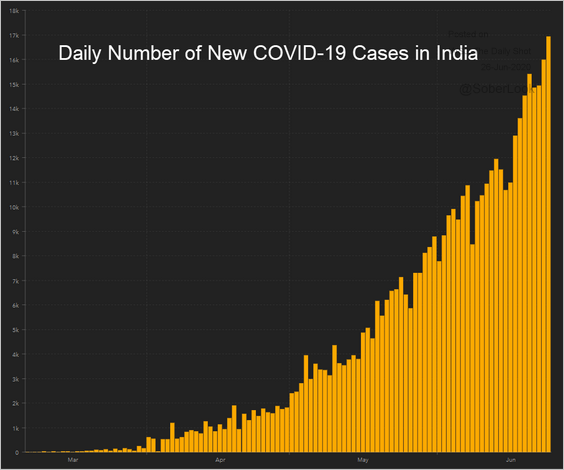
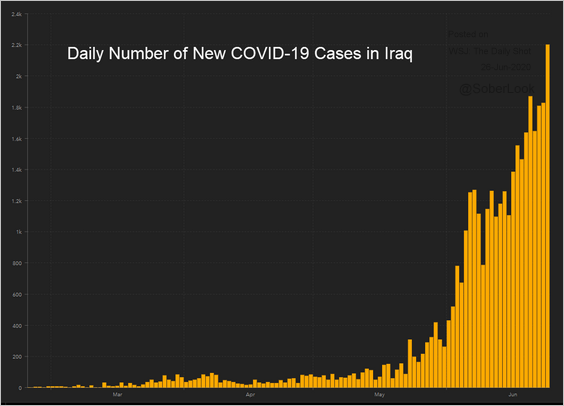
2. New infections are accelerating in several other developing economies.
• Argentina:
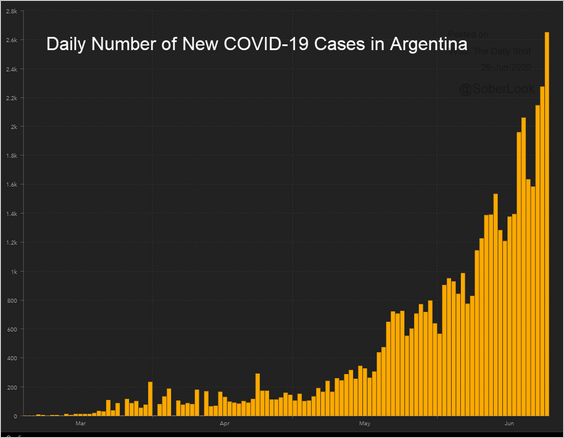 Source: JHU CSSE
• South Africa:
 Source: JHU CSSE
• India:
 Source: JHU CSSE
• Iraq:
 Source: JHU CSSE
——————–
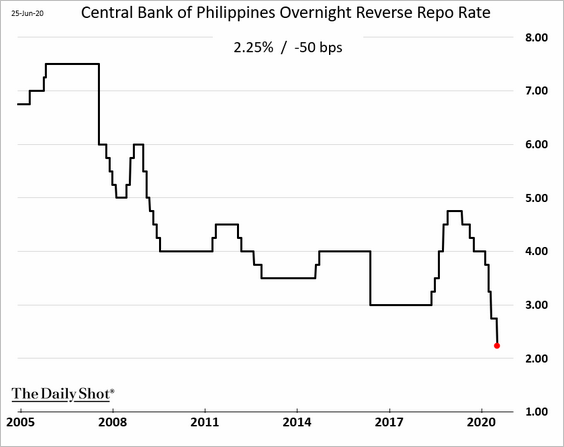
3. The Central Bank of the Philippines unexpectedly cut rates to record lows.
 Source: Nikkei Asian Review Read full article
——————–
4. Massive liquidity injections by central banks could trigger portfolio flows into EM Asia.
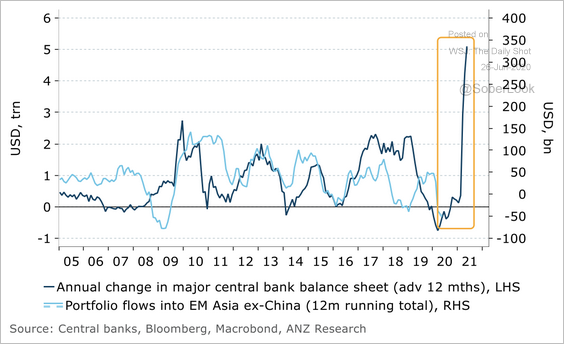 Source: ANZ Research
5. Trade has deteriorated across EM economies.
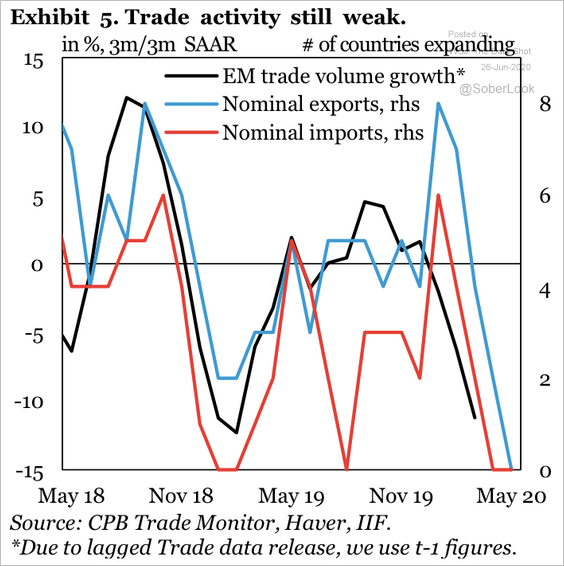 Source: IIF
Energy
1. Here is how the latest decline in global oil demand compares to previous recessions.
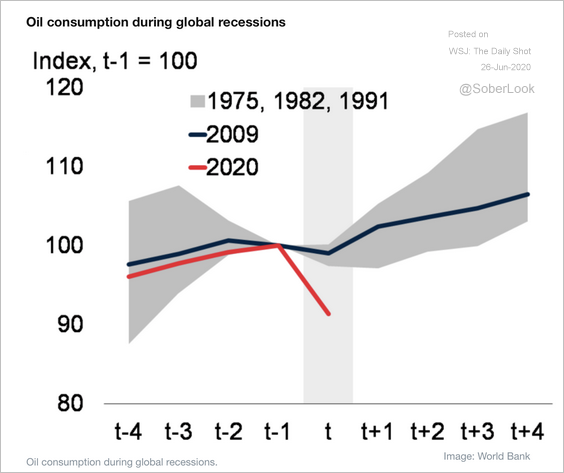 Source: WEF Read full article
2. US shale firms have burned through a great deal of cash.
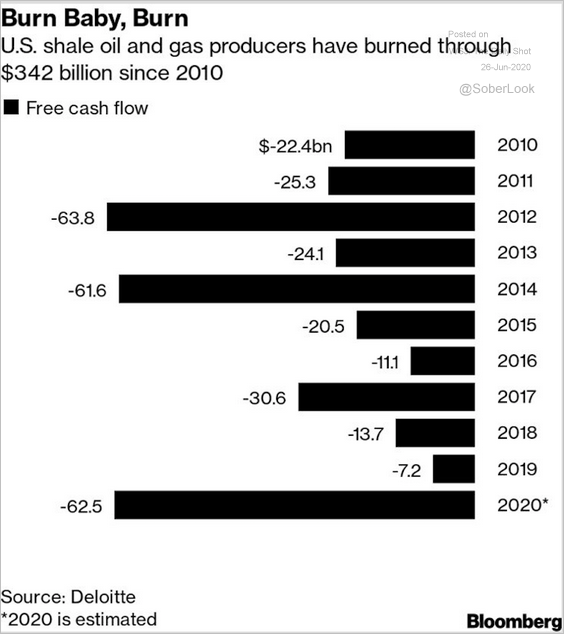 Source: @technology Read full article
3. Morgan Stanley expects only a modest increase in oil prices over the next couple of years.
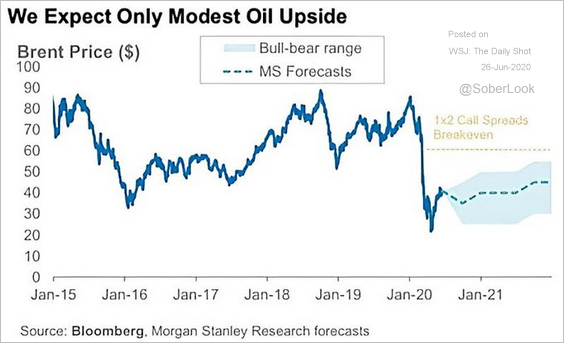 Source: @ISABELNET_SA, @MorganStanley
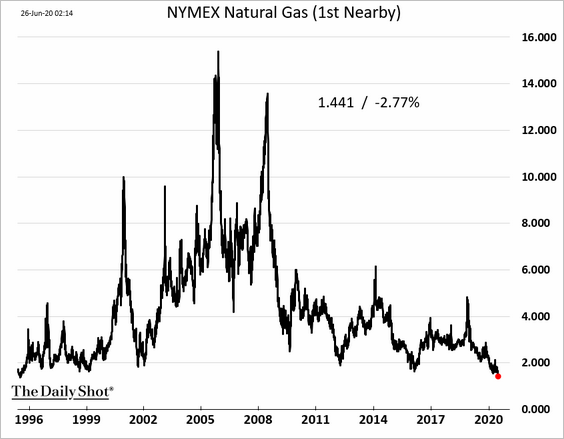
4. US natural gas prices hit the lowest level since 1995.
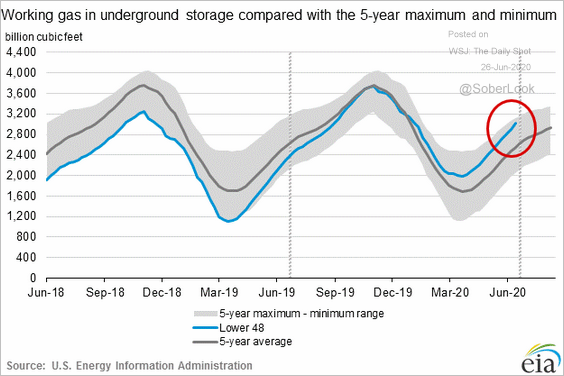
Natural gas in storage is approaching a five-year high.
Equities
1. Bank shares got whipsawed by two key events.
• A less restrictive Volcker rule:
 Source: CNBC Read full article
• The Fed’s stress tests (which will restrict dividends):
 Source: CNBC Read full article
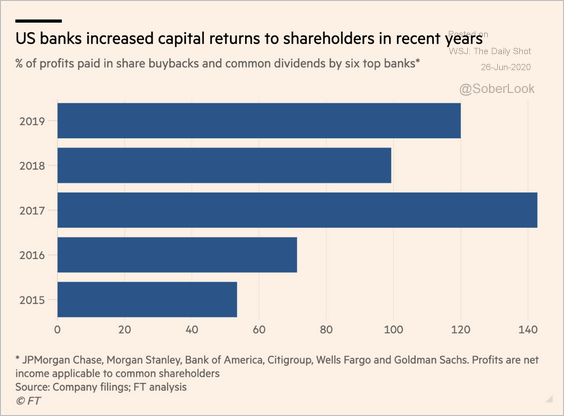 Source: @financialtimes Read full article
Here is Wells Fargo.
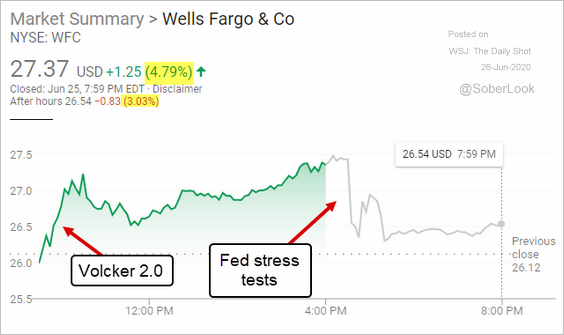 Source: Google
——————–
2. Equity allocations across sectors have rebounded.
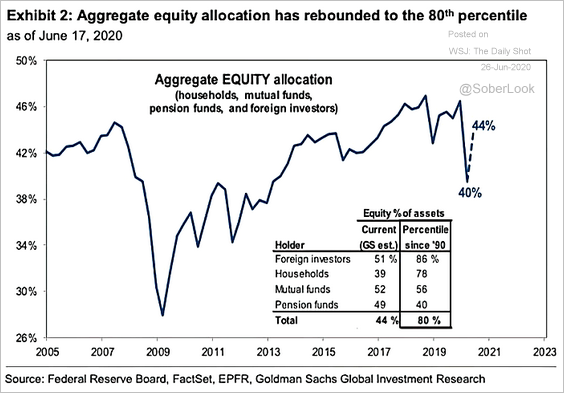 Source: @ISABELNET_SA, @GoldmanSachs
However, risk parity funds’ allocations remain extremely low.
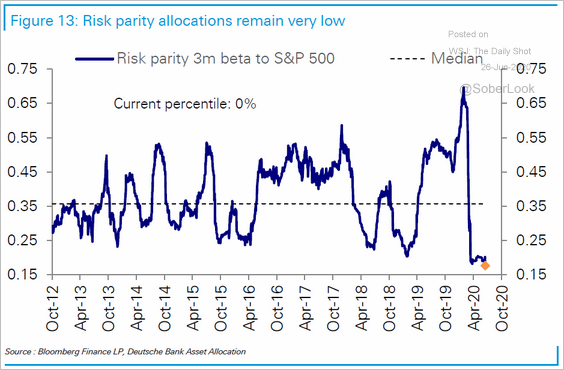 Source: Deutsche Bank Research
——————–
3. How long does it take for earnings-per-share to get back to peak levels?
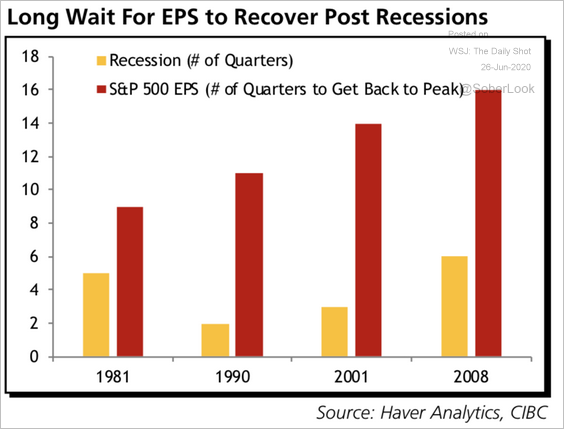 Source: CIBC Capital Markets
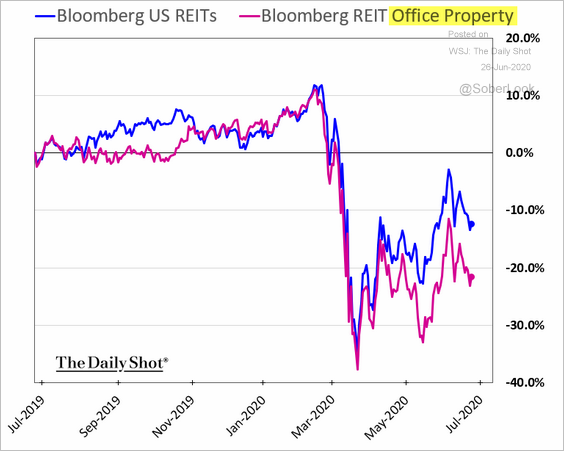
4. With more Americans working from home, office property REITs have been lagging.
 h/t Max Reyes
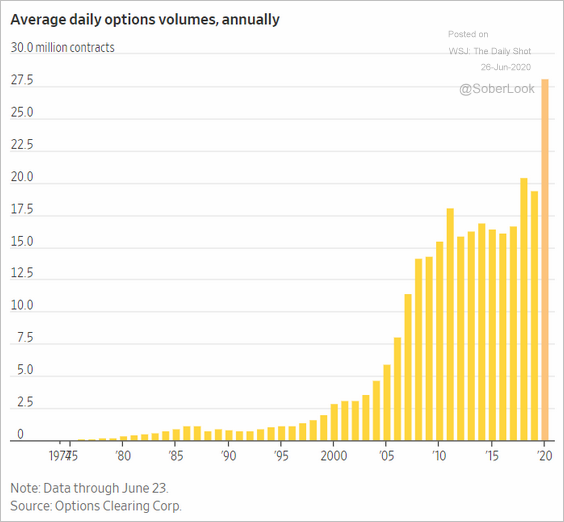
5. The spike in options volume has been unprecedented.
 Source: @WSJ Read full article
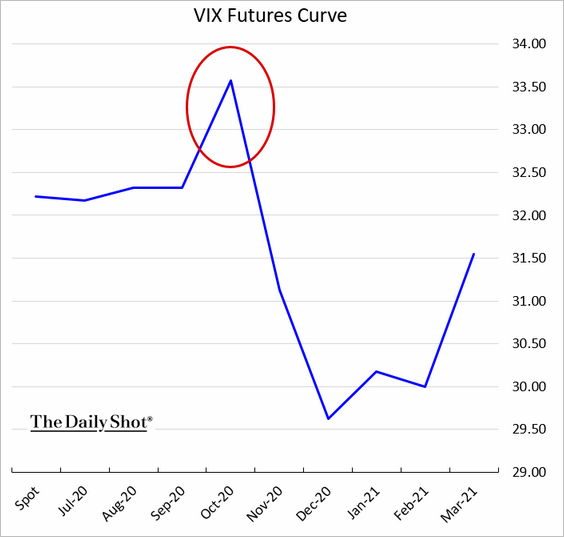
6. Options traders are increasingly nervous about the November elections. Here is the VIX futures curve.
 h/t @bennpeifert
Credit
1. Investment-grade corporate credit has massively outperformed other asset classes.
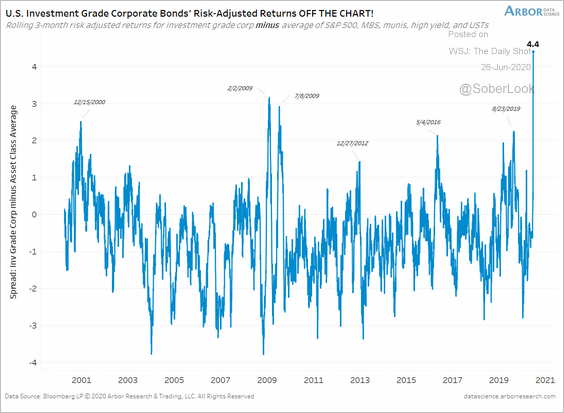 Source: Arbor Research & Trading
Flows into corporate bond ETFs have been impressive.
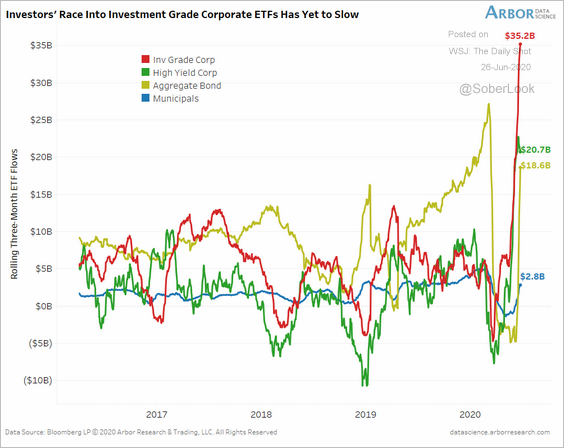 Source: Arbor Research & Trading
——————–
2. Industrials’ credit quality has deteriorated.
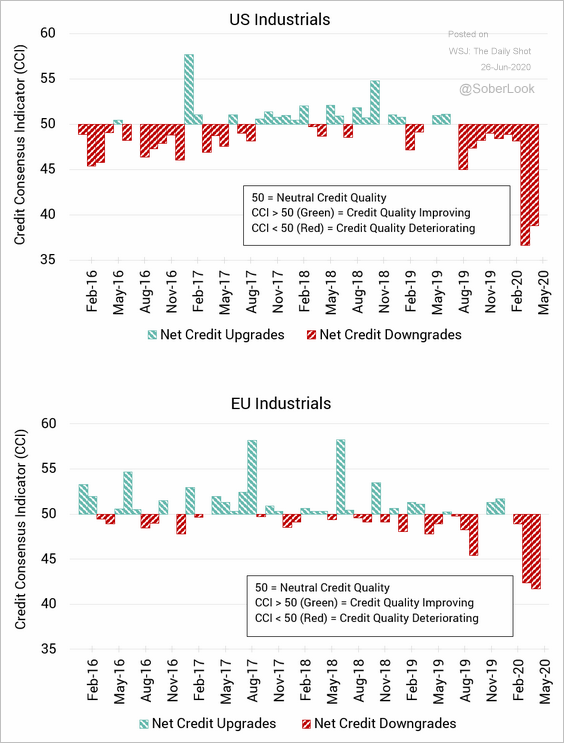 Source: Credit Benchmark Read full article
3. The pace of leveraged loan rating downgrades has been unprecedented.
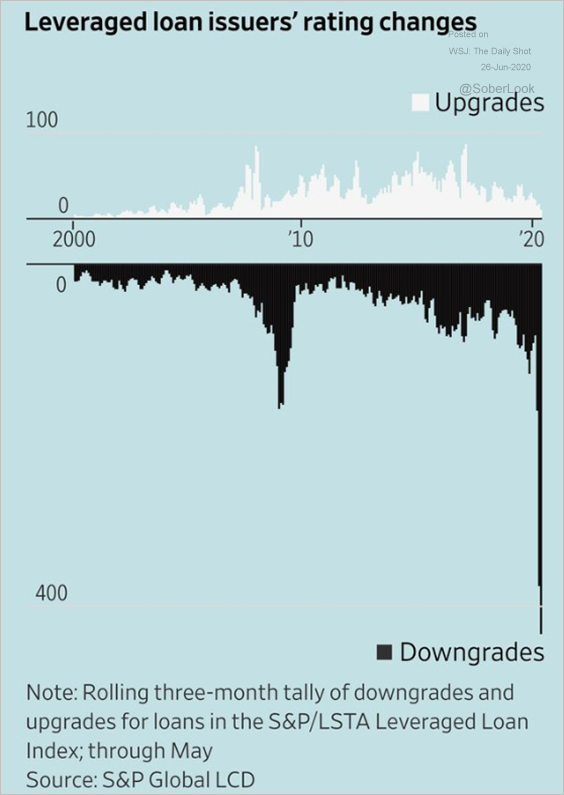 Source: @WSJ Read full article
4. Bond portfolio trades on Tradeweb are approaching $100bn (see story).
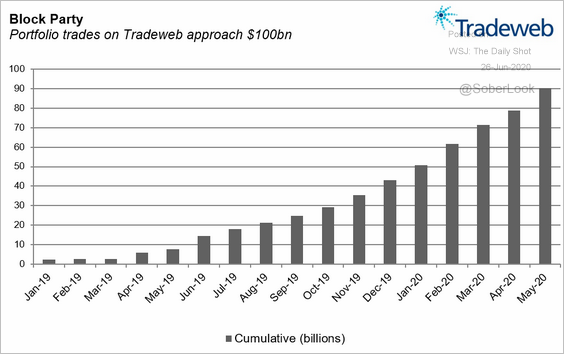 Source: Tradeweb
Global Developments
1. This chart shows the percentage of positive COVID-19 tests.
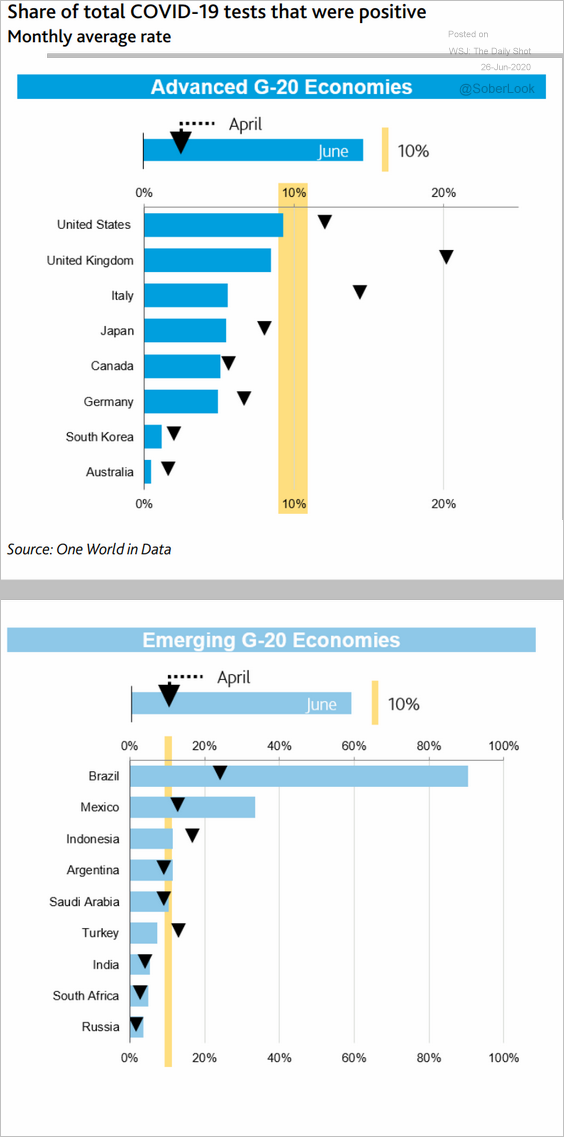 Source: Moody’s Investors Service
2. Here is the regional distribution of Apple’s supply chain.
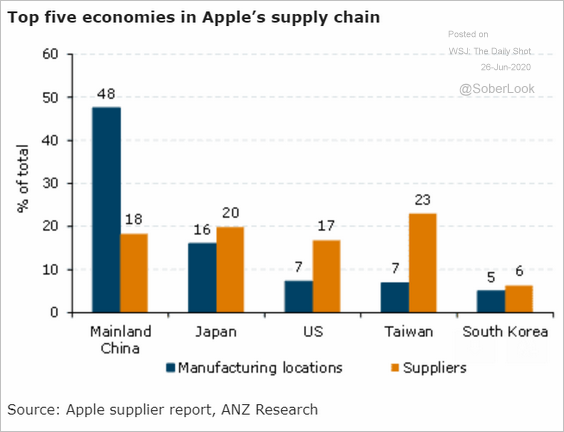 Source: ANZ Research
3. Finally, we have some data on ESG funds.
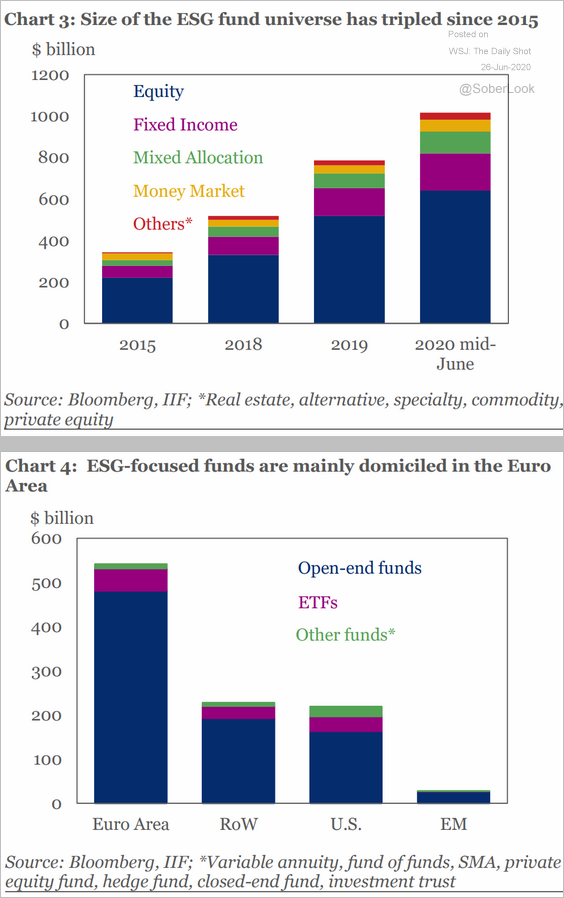 Source: IIF
——————–
Food for Thought
1. Sources of income for older US adults:
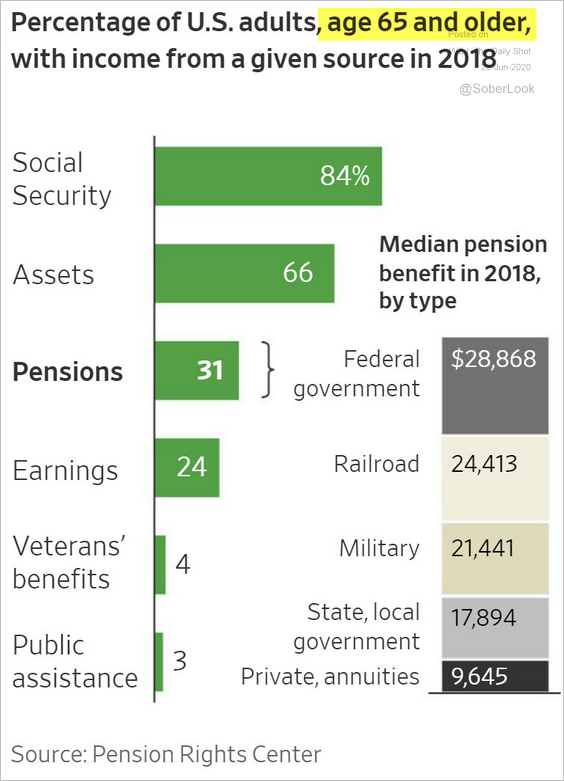 Source: @WSJ Read full article
2. Job satisfaction in select economies:
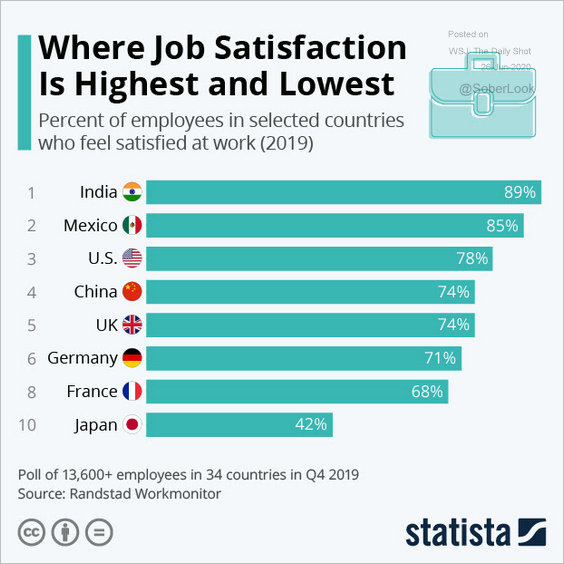 Source: Statista
3. Views on DACA:
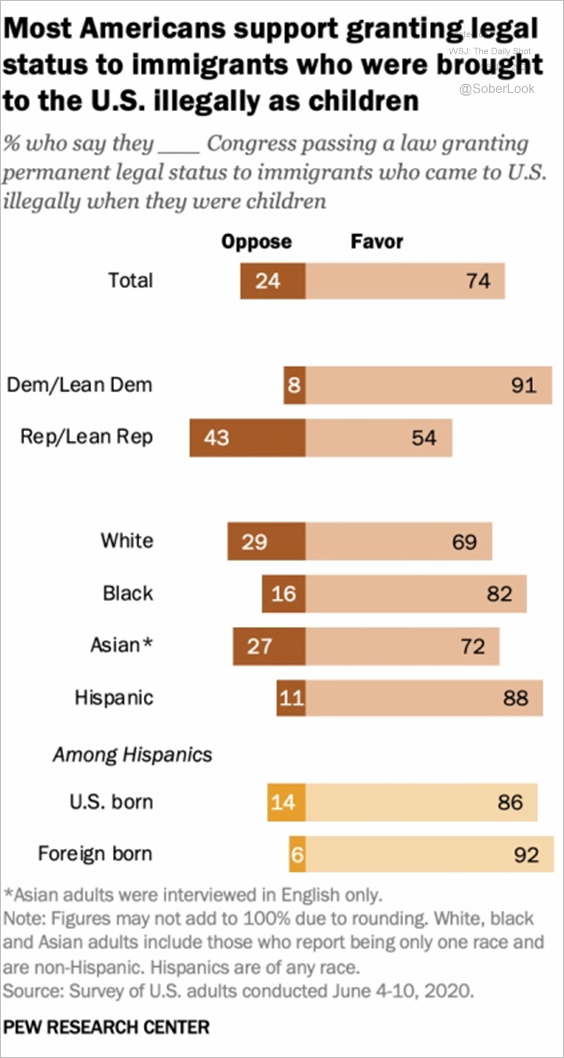 Source: Pew Research Center Read full article
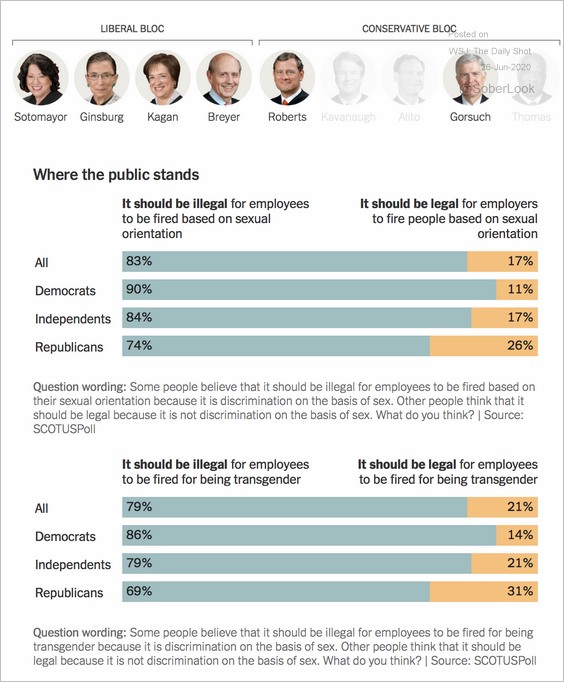
4. Views on the recent Supreme Court decisions:
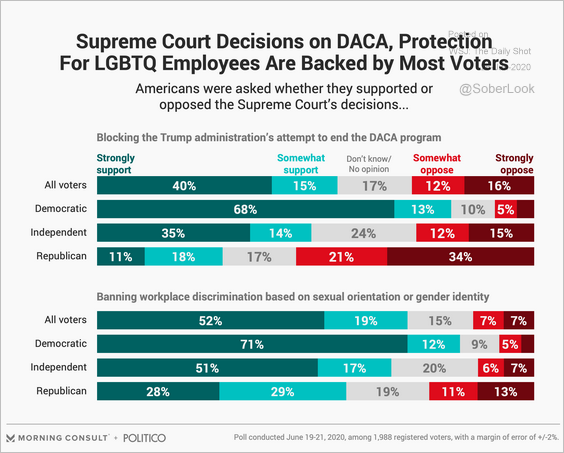 Source: Morning Consult Read full article
 Source: The New York Times Read full article
——————–
5. Political ads can be effective.
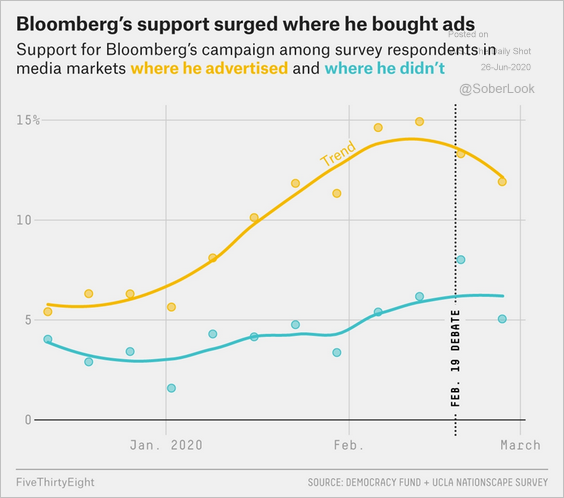 Source: FiveThirtyEight Read full article
6. Students without a reliable internet connection:
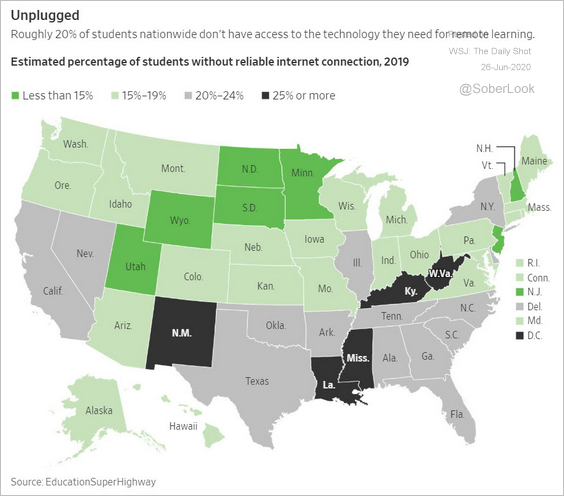 Source: @WSJ Read full article
7. Downloads of health-related apps:
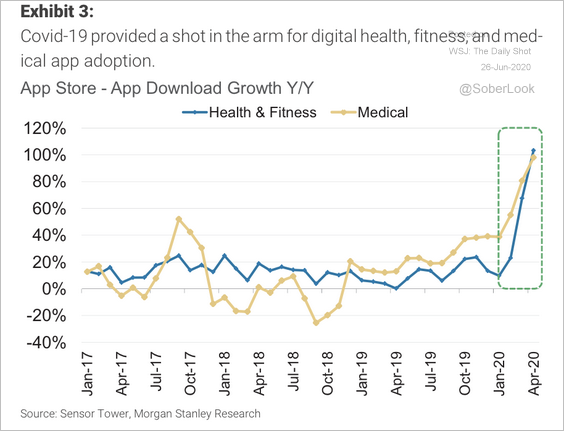 Source: Morgan Stanley Research
8. Board games funded on Kickstarter:
 Source: @Kick_Agency Read full article
9. The most common last name by country:
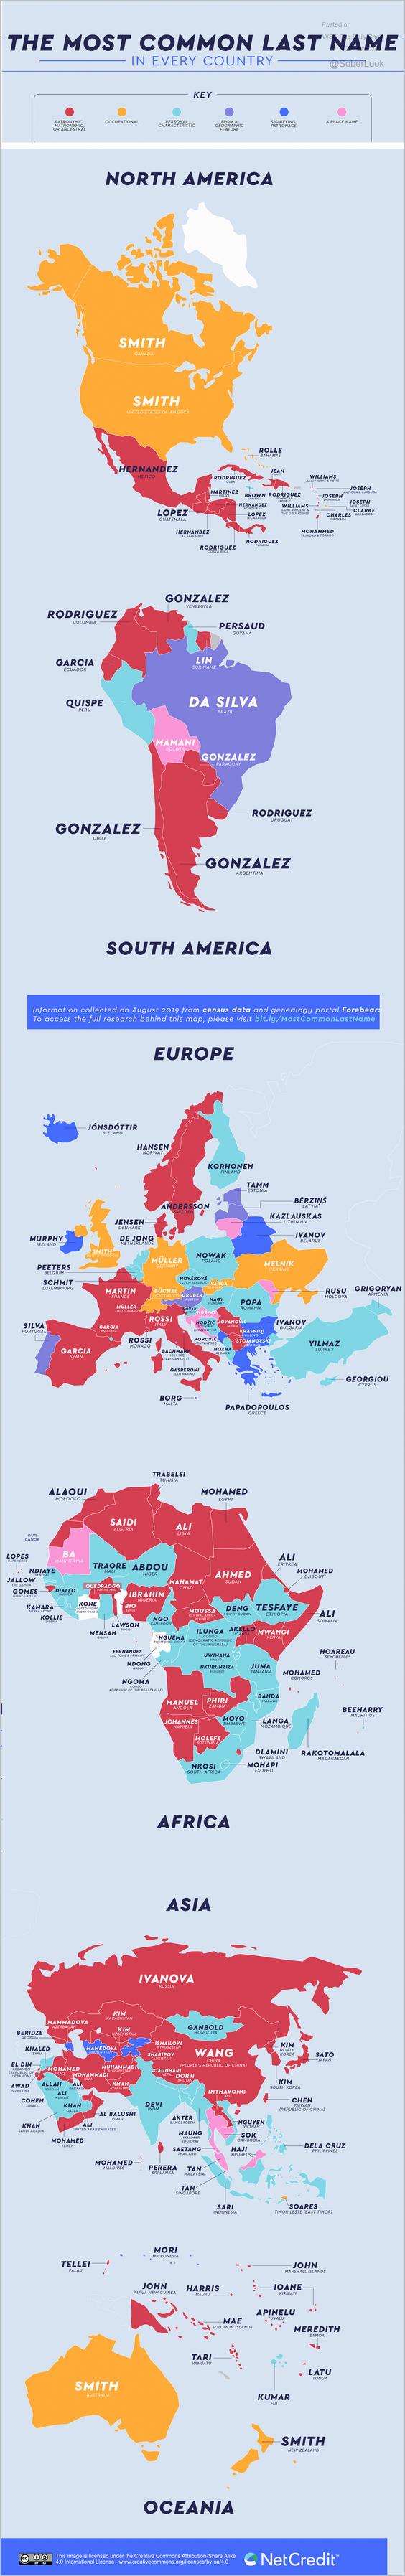 Source: NetCredit
——————–
Have a great weekend!