
The Daily Shot: 29-Jun-20
• Administrative Update
• Rates
• Credit
• Equities
• Energy
• Commodities
• Emerging Markets
• China
• Asia – Pacific
• The Eurozone
• The United States
• Global Developments
• Food for Thought
Administrative Update
Please note that the Daily Shot will not be published on Friday, July 3rd.
Rates
1. Flows into inflation-protected bond funds soared as investors hedge against a potential inflation shock.
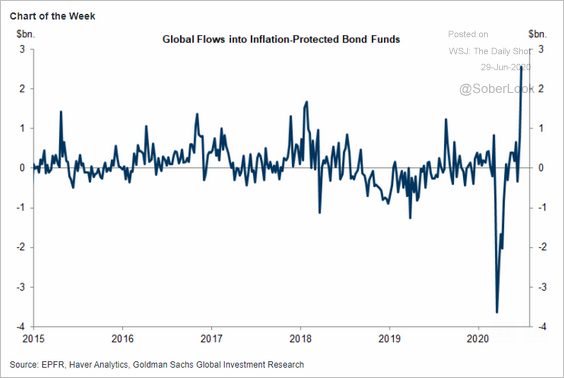 Source: Goldman Sachs
There is some concern that the combination of global monetary and fiscal stimulus will propel consumer prices higher. However, Japan provides a case study of a decade-long stimulus that didn’t result in inflationary pressures.
 Source: @bpolitics Read full article
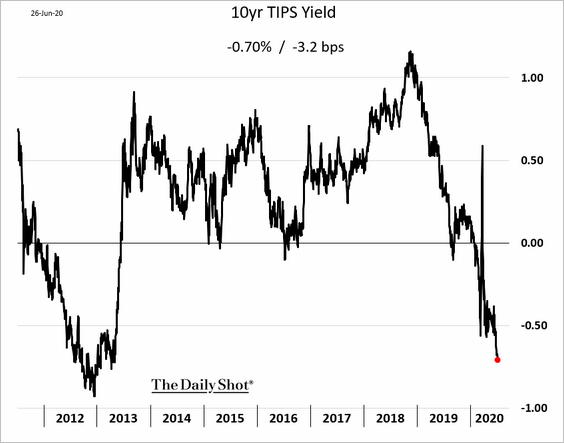
As a result of this demand for inflation product, yields on inflation-linked Treasuries (TIPS) continue to fall. These yields are a measure of effective real rates in the US (and have been moving deeper into negative territory).
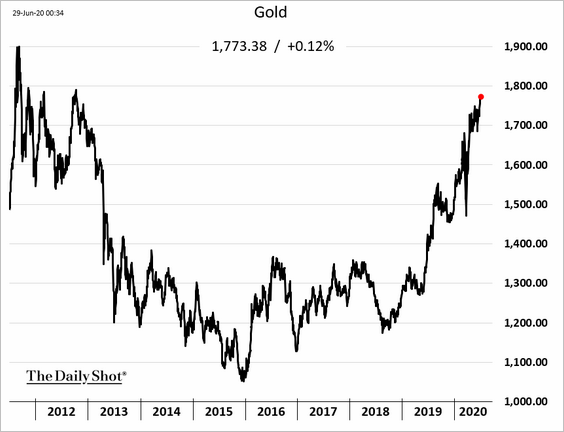
Declining real rates have been a tailwind for gold.
——————–
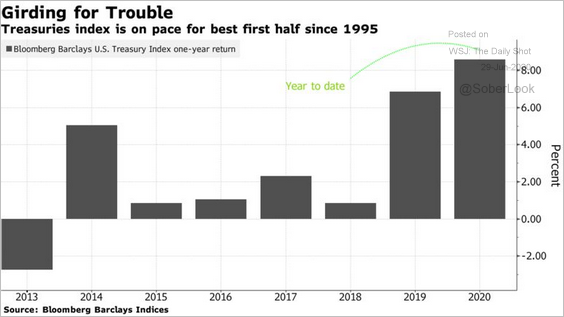
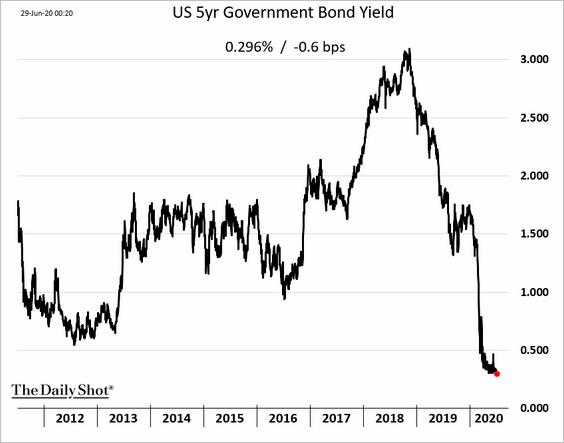
2. So far, it’s been a good year for Treasuries.
 Source: @markets Read full article
The 5yr note yield dipped below 0.3% – the lowest on record.
——————–
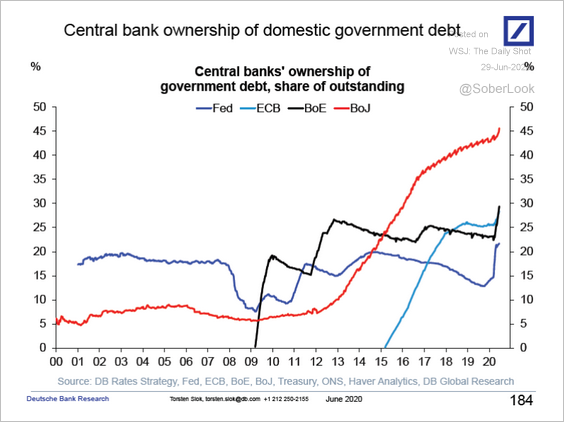
3. This chart shows the major central banks’ ownership of domestic government debt.
 Source: Deutsche Bank Research
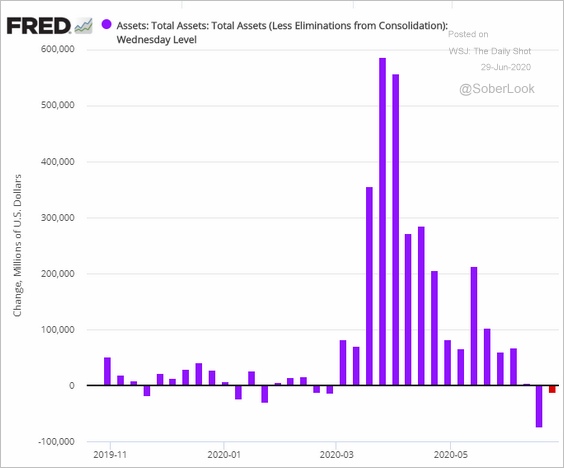
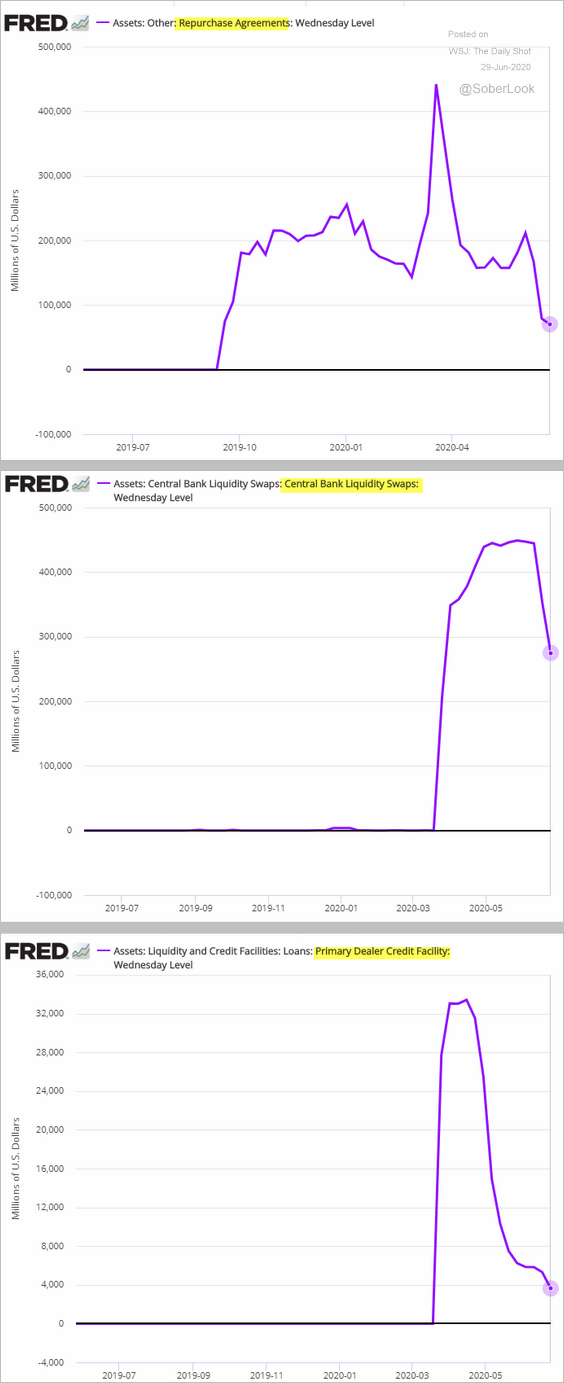
4. The Fed’s balance sheet declined again last week.
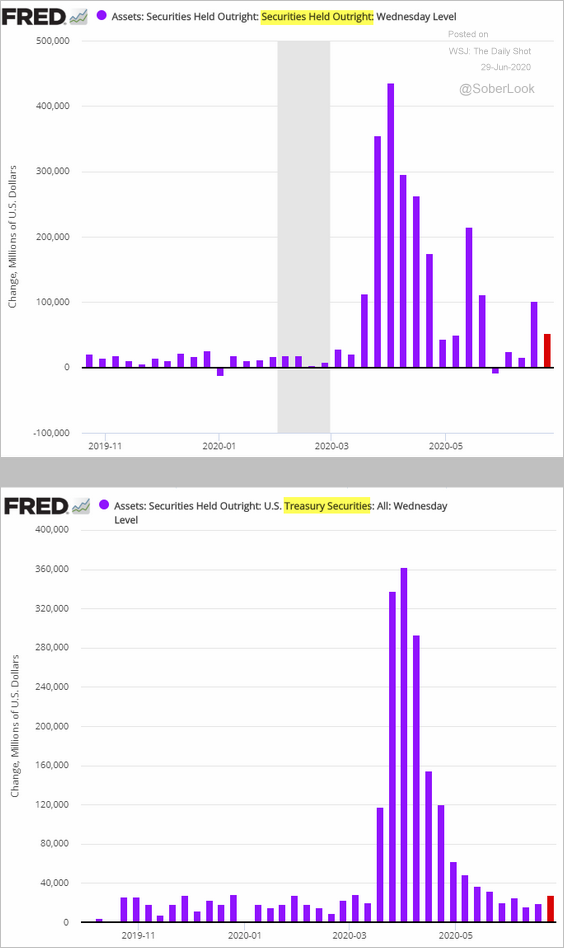
While the central bank’s securities holdings continue to climb, …
… there is less demand for some of the Fed’s facilities, as liquidity and risk appetite return.
• The utilization of the Fed’s crisis-fighting measures remains extremely low.
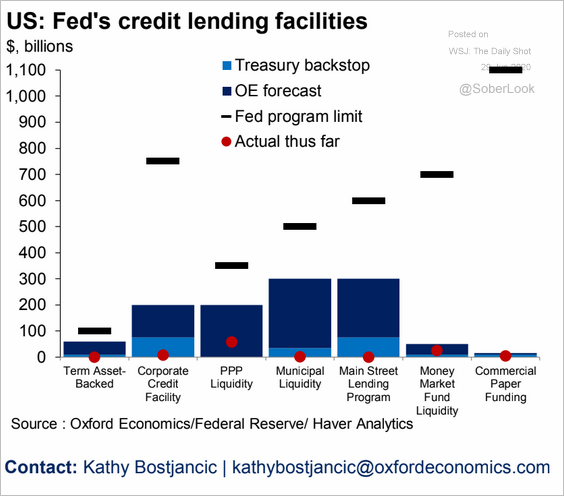 Source: Oxford Economics
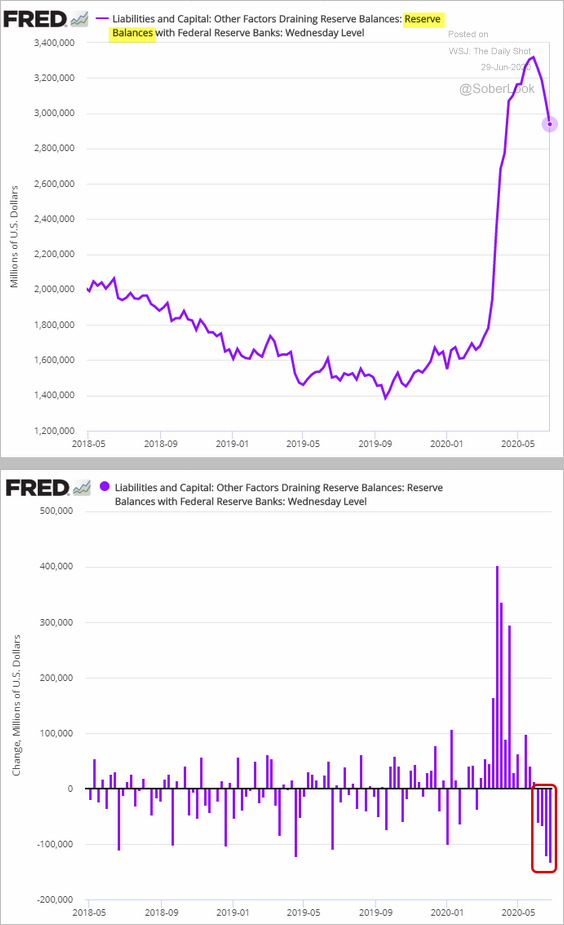
• Reserves have retreated from the peak as the Fed’s balance sheet shrinks.
——————–
5. There is a substantial imbalance among the Federal Reserve banks (similar to the TARGET2 imbalances in the Eurozone).
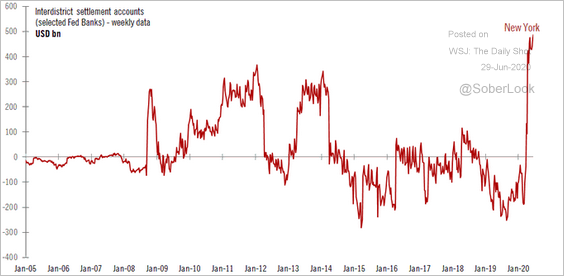 Source: @TCosterg
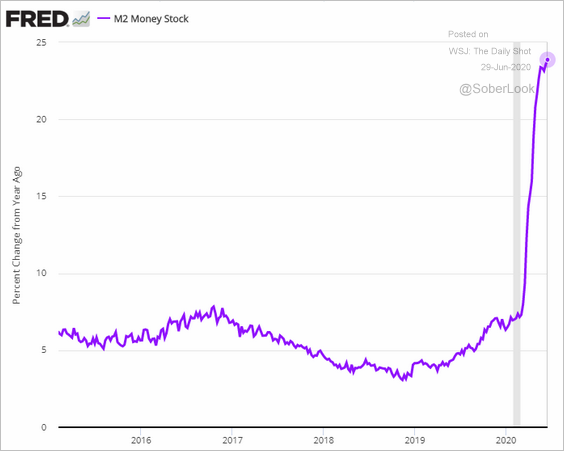
6. The US broad money supply (M2) growth rate hit another record high.
7. 47% of Barclays fixed-income clients surveyed expect a short delay by which Libor will phase out.
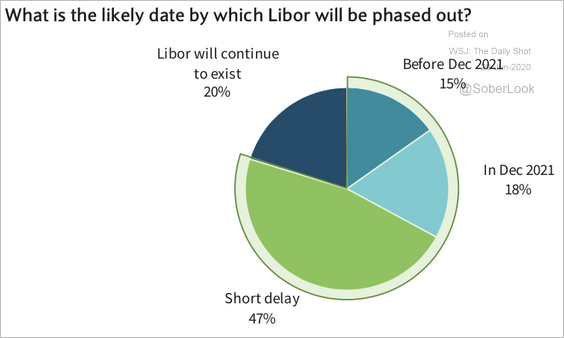 Source: Barclays Research
And 55% expect SOFR derivatives will be the primary mechanism for interest rate risk transfer by the end of 2021.
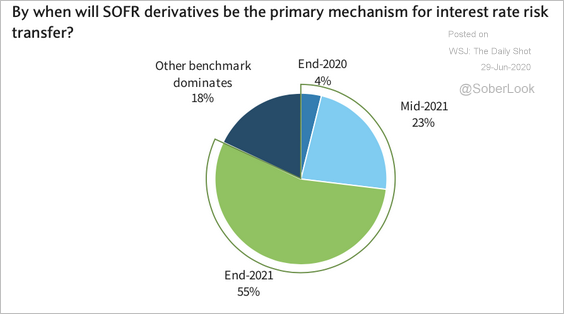 Source: Barclays Research
Credit
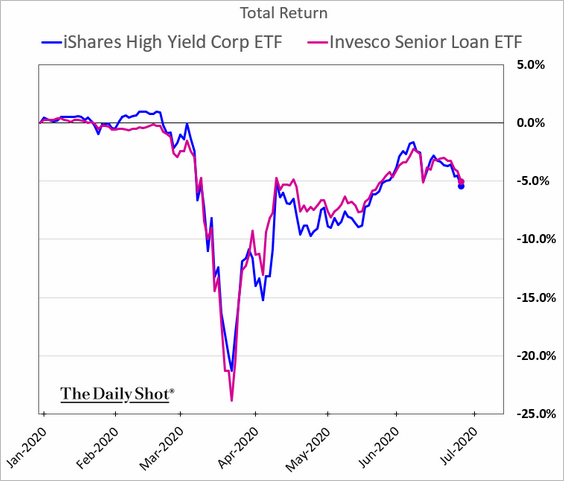
1. The performance trends of US high-yield bonds and leveraged loans have been nearly identical this year.
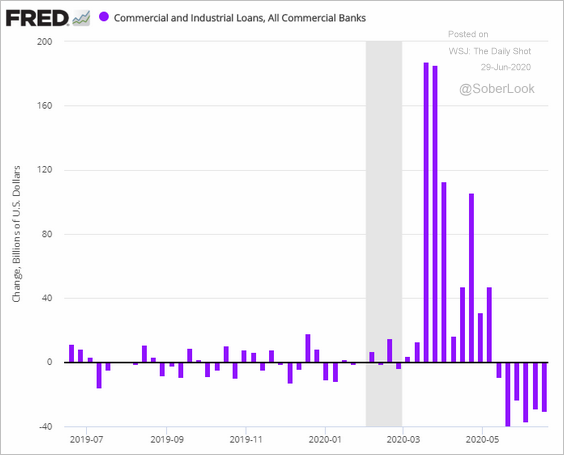
2. Business loan balances have been declining as companies reduce their drawn amounts at banks. Part of this trend is the rapid-fire bond issuance, which allowed firms to pay down their revolving credit facilities.
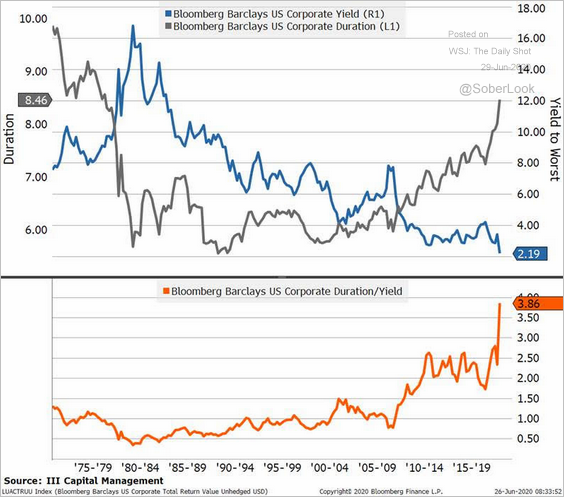
3. All the newly-issued investment-grade debt sent the average duration of US corporate bonds soaring. The second chart below shows the duration-to-yield ratio. Investors are taking more duration risk while getting paid less.
 Source: III Capital Management
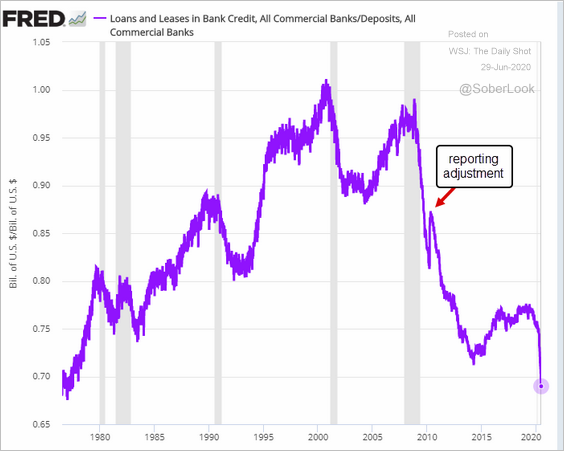
4. Despite lower corporate loan balances, US banks’ loan-to-deposit (LTD) ratio hit the lowest level since the 1970s.
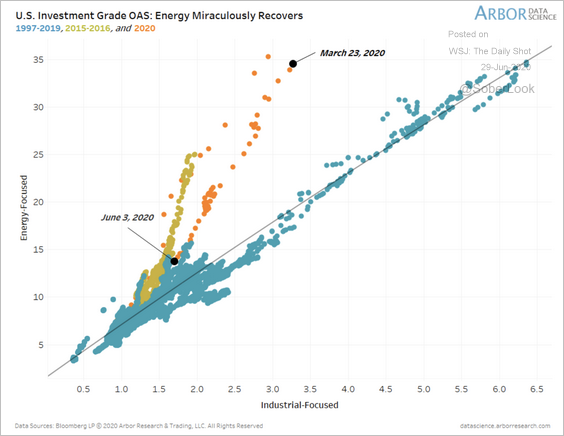
5. Energy credit spreads have recovered at an unprecedented pace over the past few months.
 Source: Arbor Research & Trading
• However, a large number of energy companies (red dots below) continue to see high probabilities of classifying as junk.
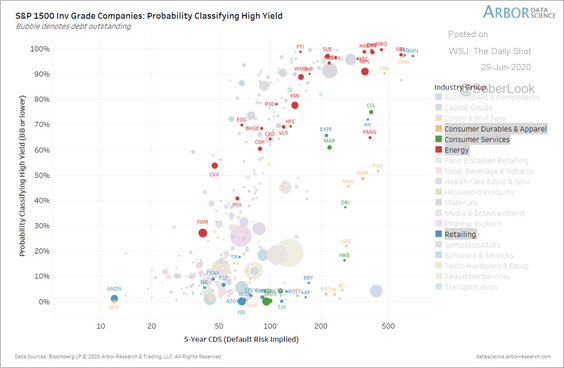 Source: Arbor Research & Trading
• Chesapeake Energy officially filed for bankruptcy protection (which was widely expected).
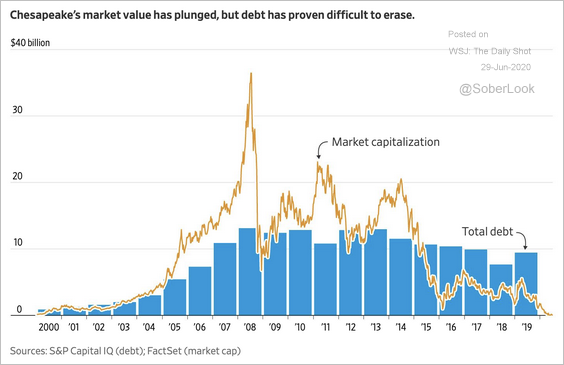 Source: @WSJ Read full article
• This chart shows the percentage of US shale firms that would be insolvent or stressed under two different oil price scenarios.
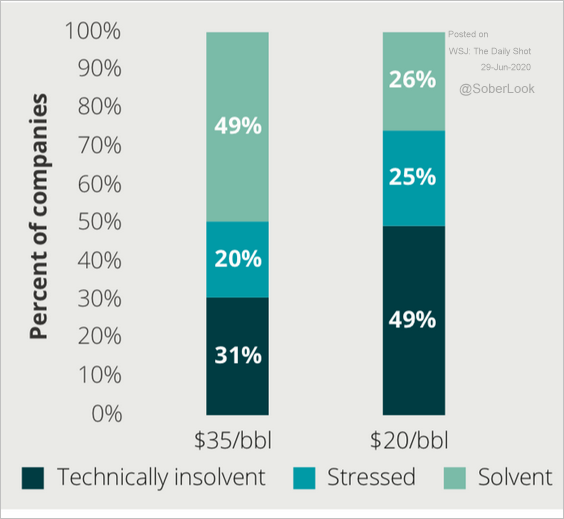 Source: Deloitte Read full article
——————–
6. European CLO deals have been much smaller this quarter.
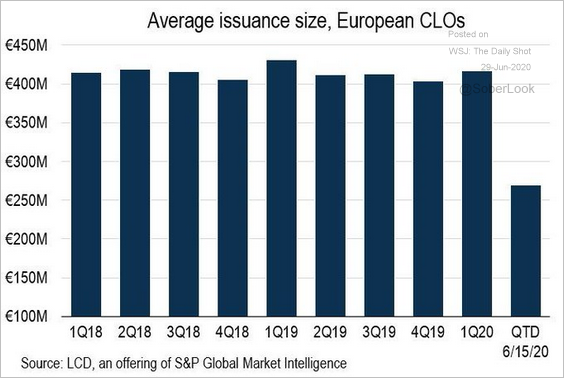 Source: @lcdnews, @millarlr
Equities
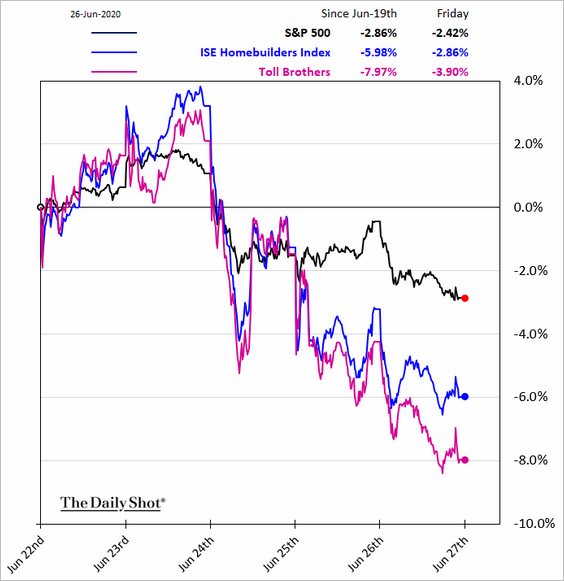
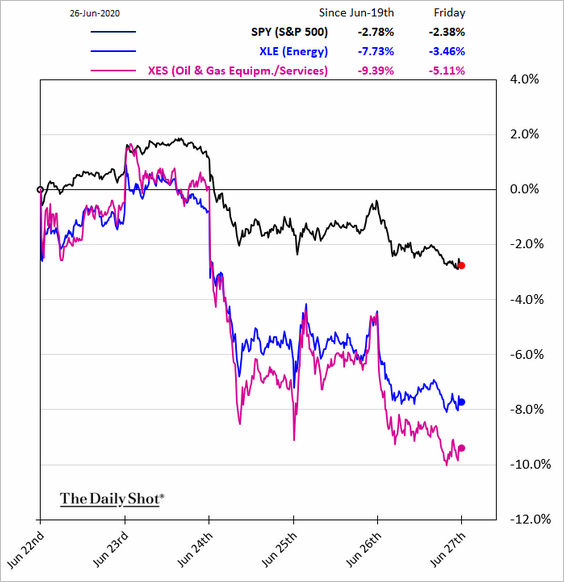
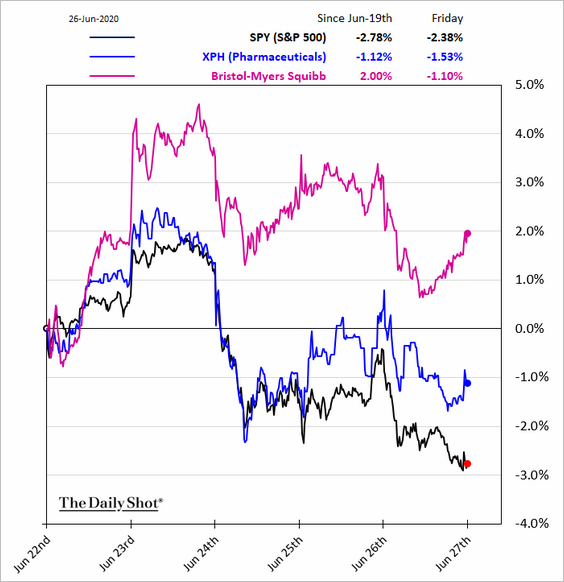
1. Friday was a rough day for the market as the S&P 500 retests support.
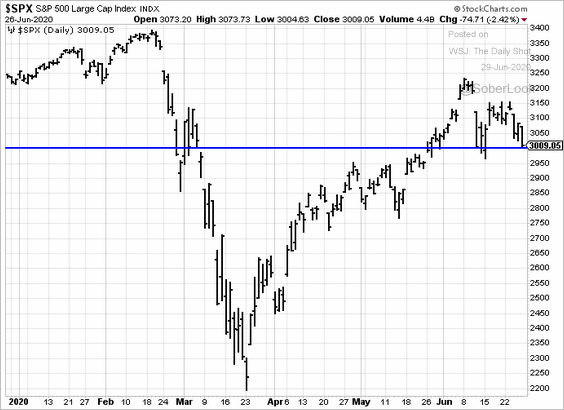
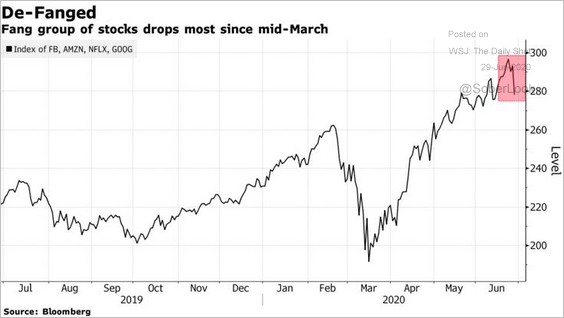
Tech mega-caps declined sharply, led by Facebook (see story).
 Source: @markets Read full article
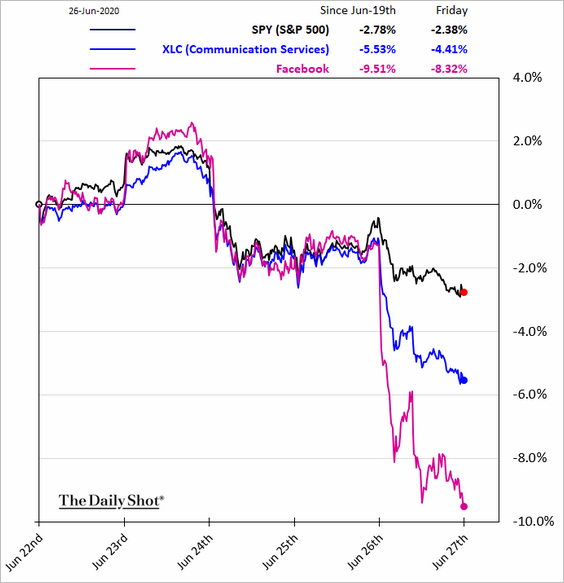
Here are some sector trends.
• Communication Services:
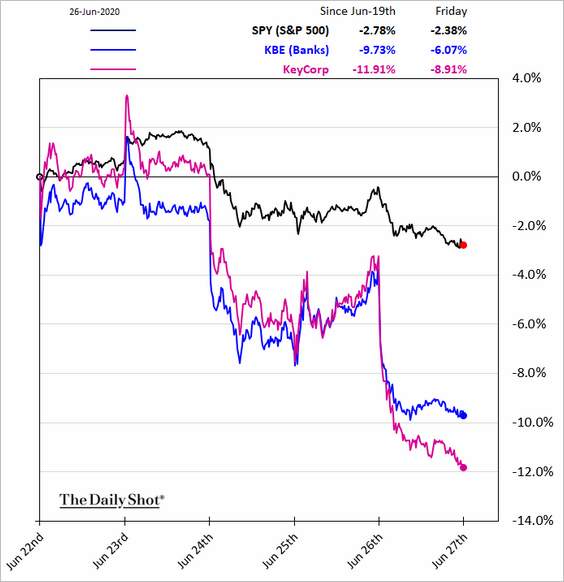
• Banks:
• Homebuilders:
• Energy:
• Pharma:
——————–
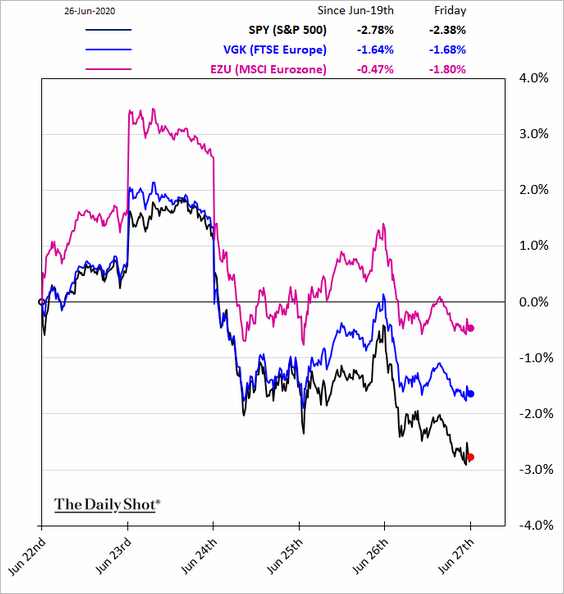
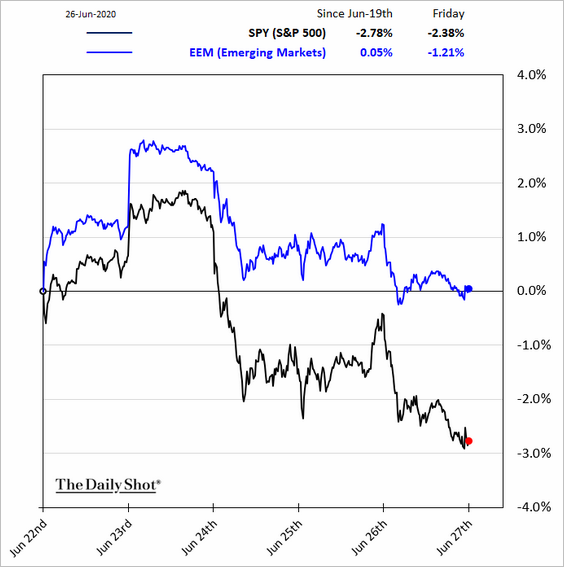
2. US shares lagged global peers last week.
• Europe:
• Japan:
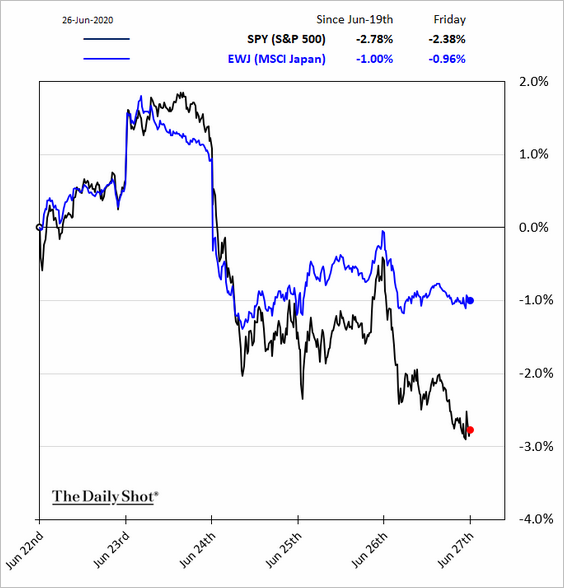
• Emerging markets:
——————–
3. Which sectors have seen the largest market cap losses this year?
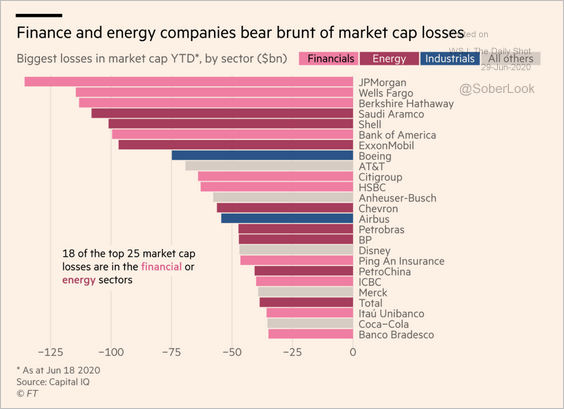 Source: @financialtimes Read full article
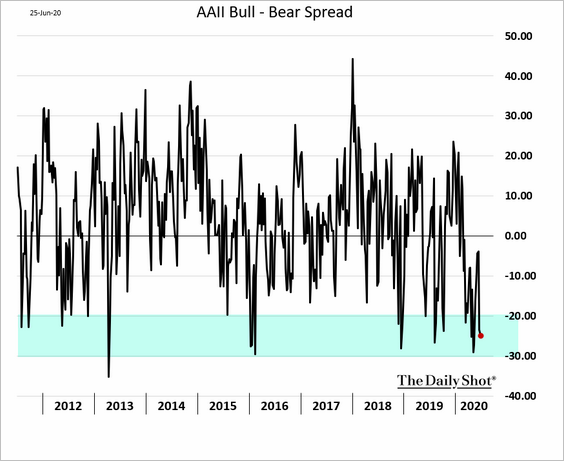
4. The AAII bull-bear spread shows that investors remain cautious.
5. The market expects the high-volatility regime to persist.
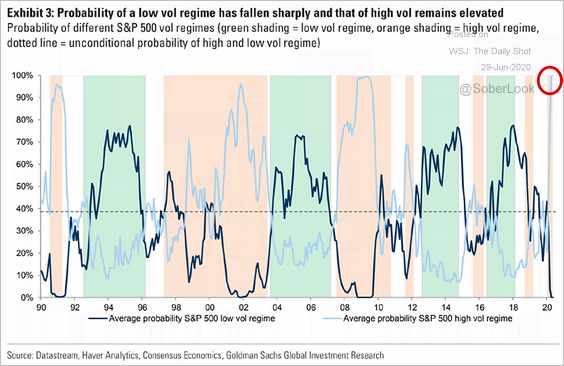 Source: @ISABELNET_SA, @GoldmanSachs
Energy
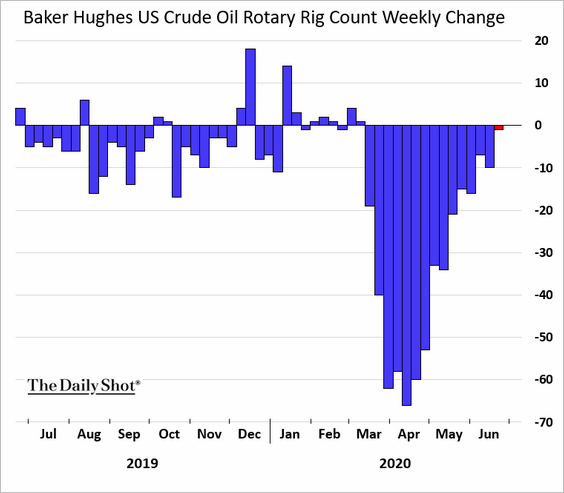
1. The US oil rig count appears to be bottoming.
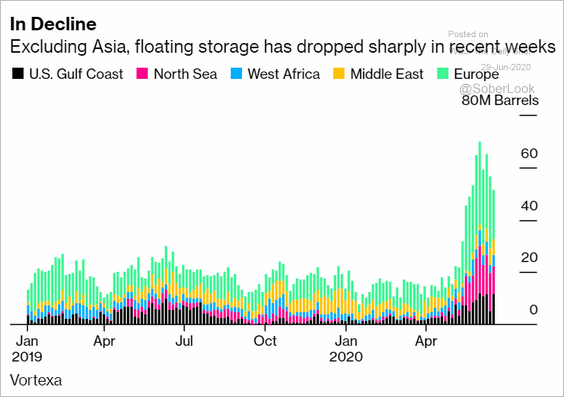
2. Floating storage has been declining.
 Source: @markets Read full article
Commodities
1. Copper continues to rally, exceeding expectations.
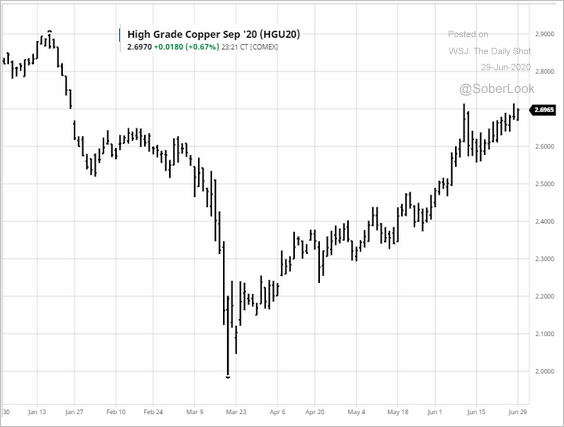 Source: barchart.com
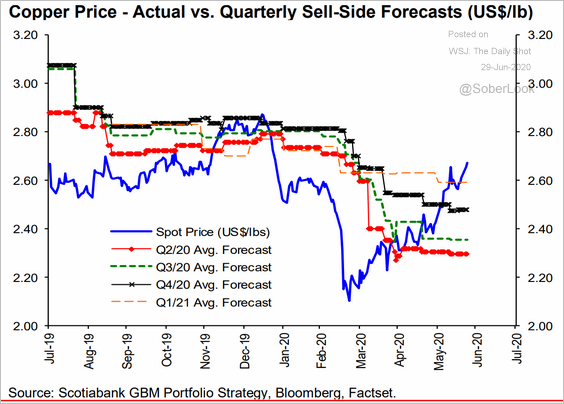 Source: Hugo Ste-Marie, Portfolio & Quantitative Strategy Global Equity Research, Scotia Capital
——————–
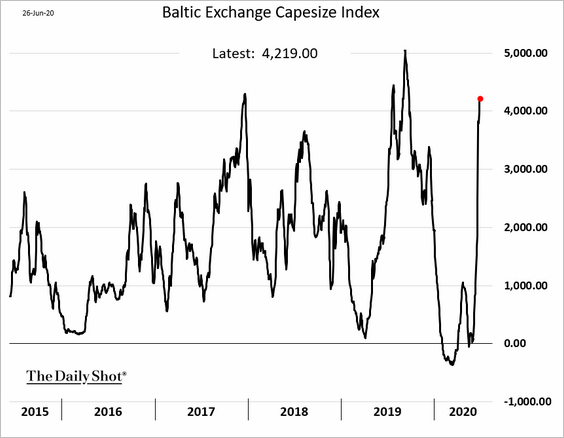
2. Demand for large-sized bulk carriers sent shipping costs soaring. Here is the Baltic Capesize Index.
3. Cocoa prices are tumbling, which has been a major setback for Ghana.
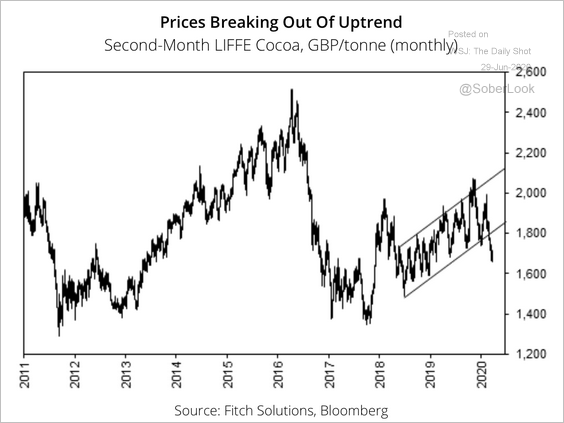 Source: Fitch Solutions Macro Research
4. US winter wheat futures have been under pressure.
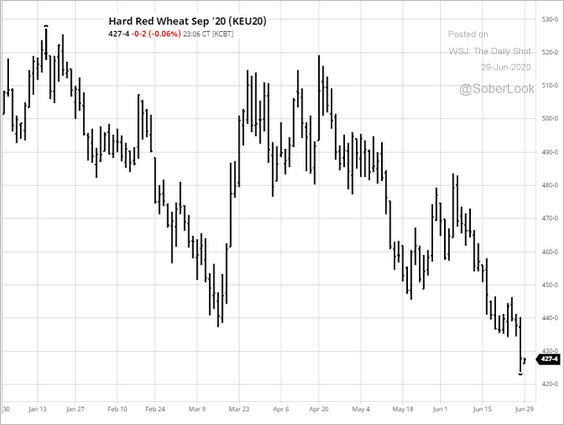 Source: barchart.com
5. Chicago hog prices continue to tumble.
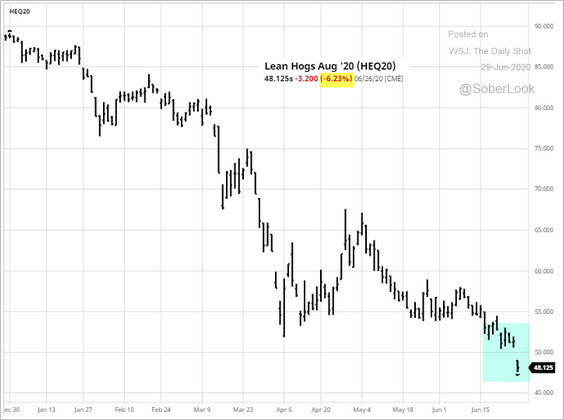 Source: barchart.com
Emerging Markets
1. The Brazilian real’s rebound was short-lived.
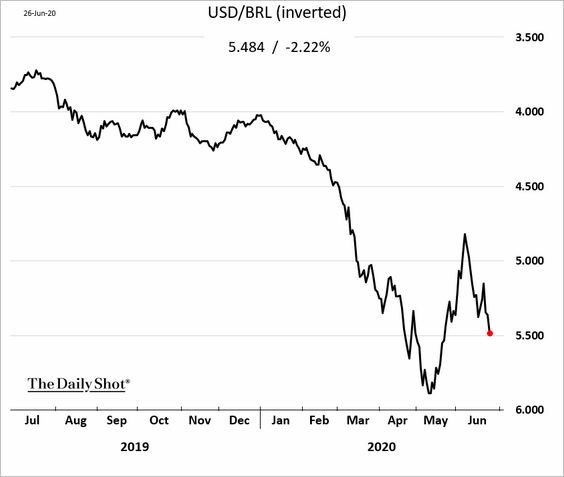
Separately, Brazil’s Ibovespa index has significantly underperformed the rest of the world during the pandemic.
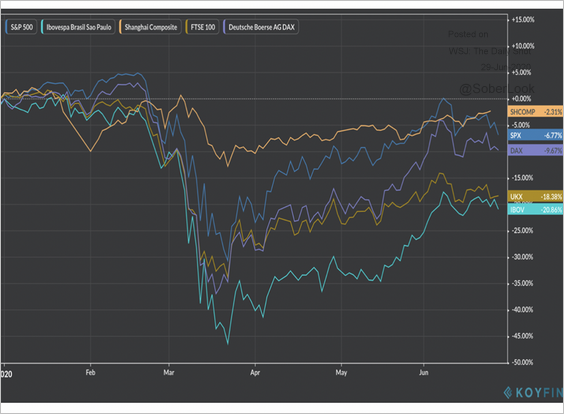 Source: Koyfin
——————–
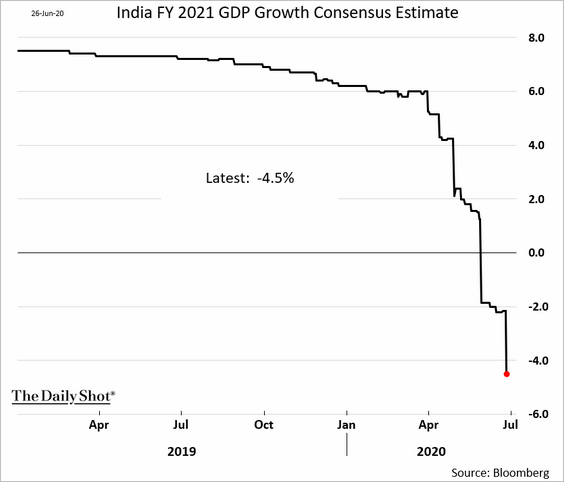
2. Economists continue to downgrade India’s 2021 fiscal year GDP estimates. The chart below is based on Bloomberg’s survey.
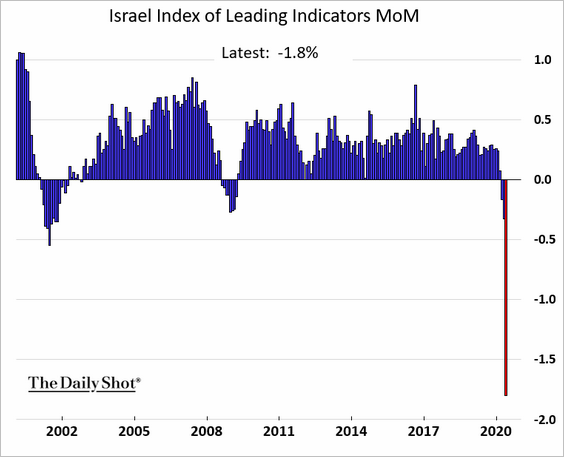
3. Israel’s index of leading indicators experienced a record drop last month.
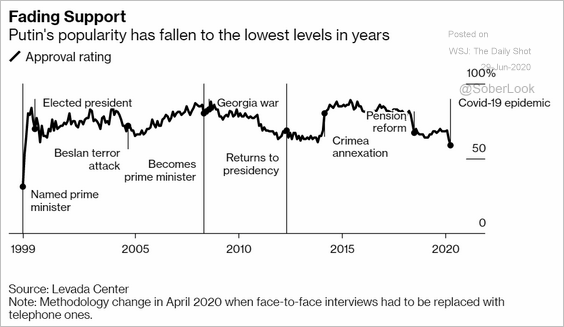
4. Putin’s popularity has declined this year.
 Source: @bpolitics Read full article
China
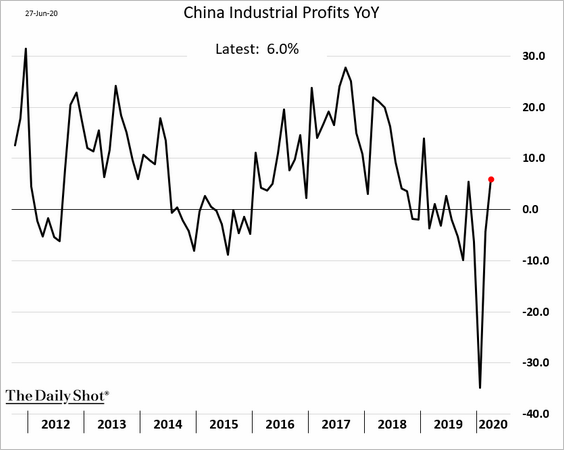
1. Industrial profits have rebounded.
2. Consumer sentiment seems to be deteriorating again.
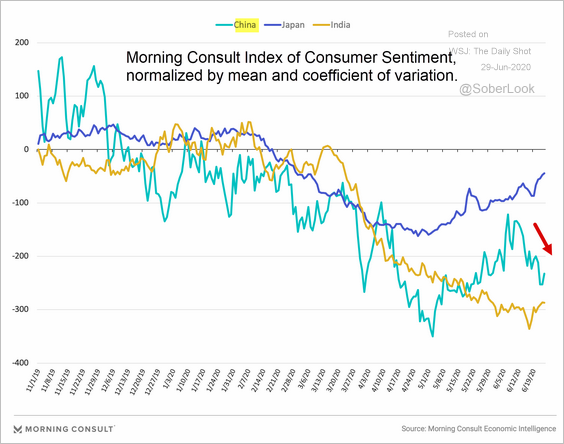 Source: Morning Consult Read full article
3. China is increasingly dominating in innovation (PCT = Patent Cooperation Treaty).
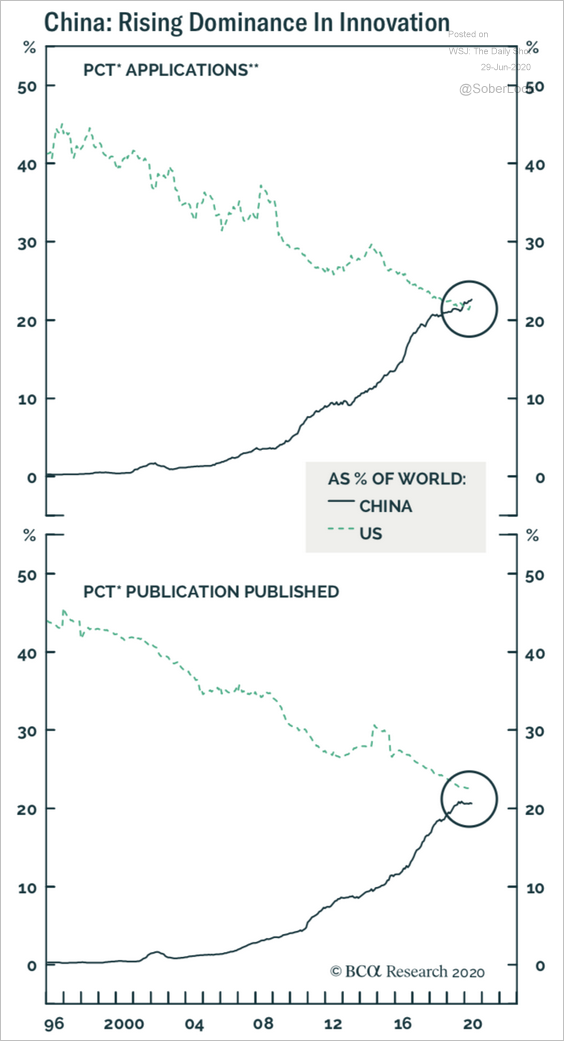 Source: BCA Research
Asia – Pacific
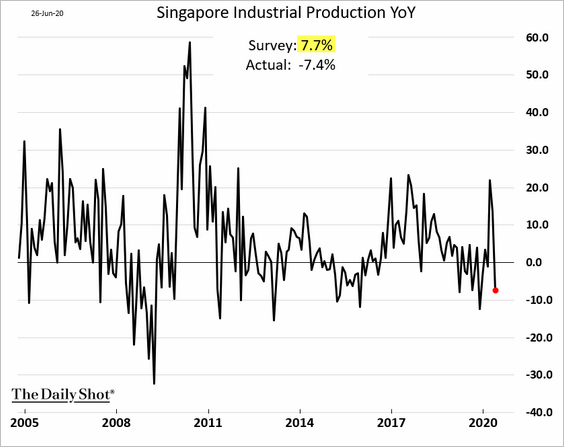
1. Singapore’s industrial production unexpectedly declined last month.
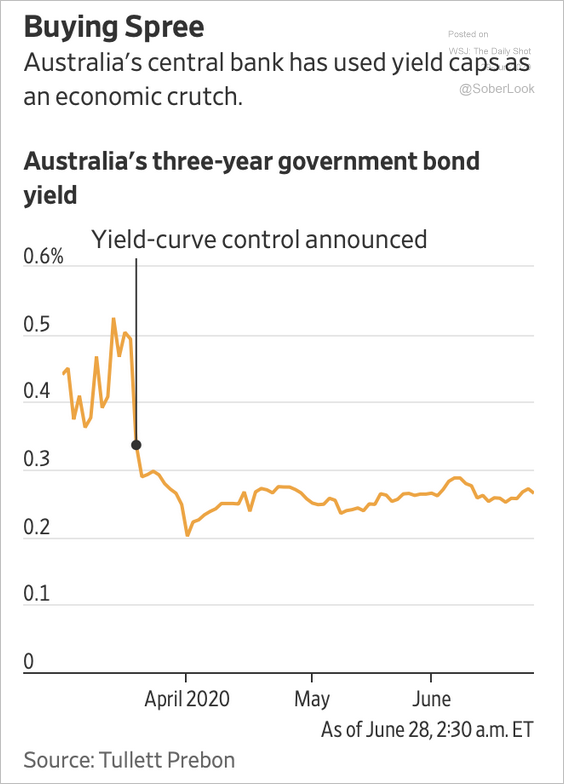
2. The Australian government’s 3-year bond yield has stabilized in a tight range around the RBA’s 0.25% target level.
 Source: Fitch Solutions Macro Research Read full article
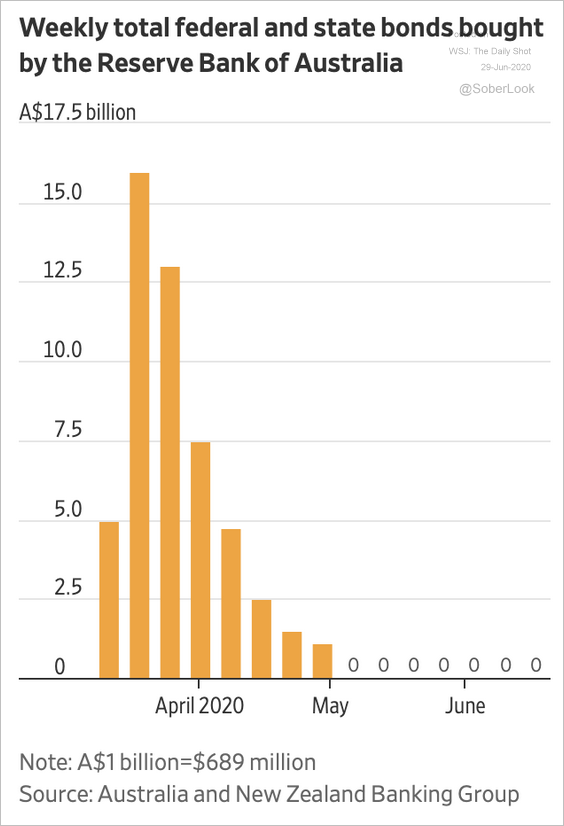
The central bank frontloaded federal and state bond purchases as lockdowns stopped economic activity.
 Source: Fitch Solutions Macro Research Read full article
——————–
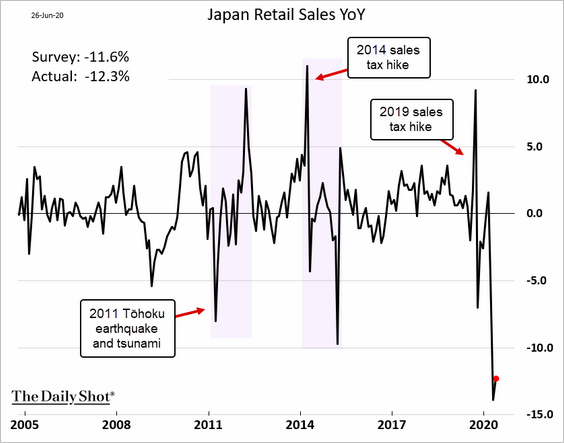
3. Japan’s May retail sales were 12% below last year’s level. It’s going to be a slow recovery.
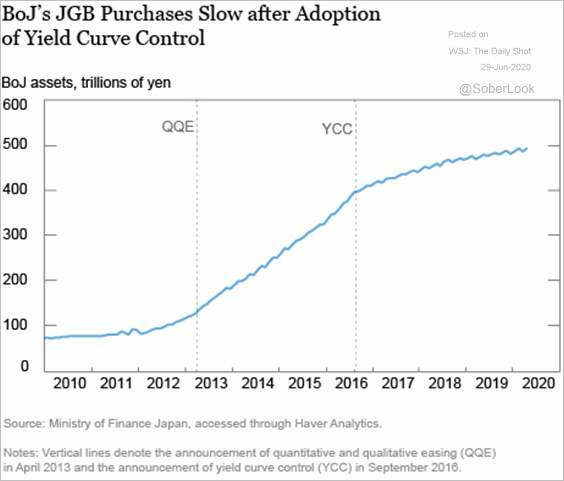
4. This chart shows how the pace of JGB purchases slowed after the BoJ implemented yield curve control. Will the Fed implement a similar strategy?
 Source: Liberty Street Economics Read full article
The Eurozone
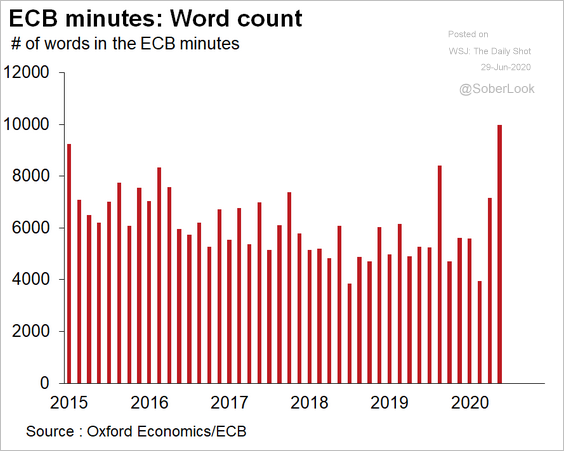
1. Let’s start with some charts on the ECB minutes (from Oxford Economics).
• The total word count:
 Source: @OliverRakau, @ecb
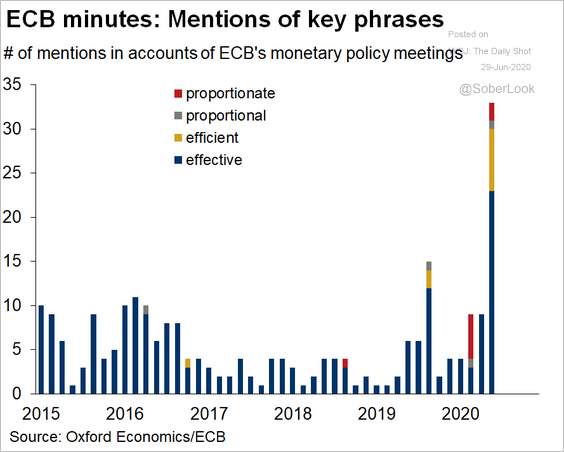
• Mentions of the words “proportionate,” “proportional,” “efficient,” and “effective”:
 Source: @OliverRakau, @ecb
• “fiscal” (meaning the governments need to step up stimulus):
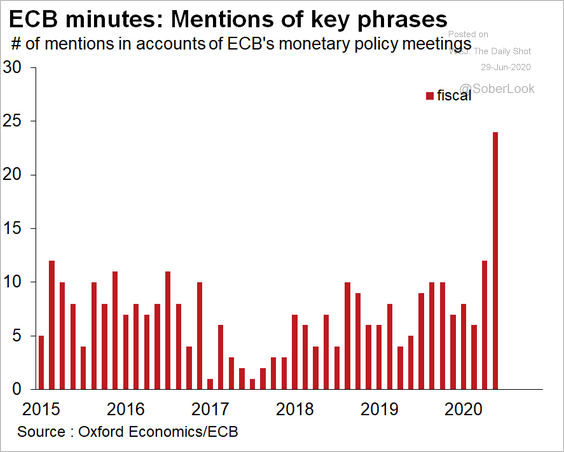 Source: @OliverRakau, @ecb
• “uncertainty” and “financial conditions”:
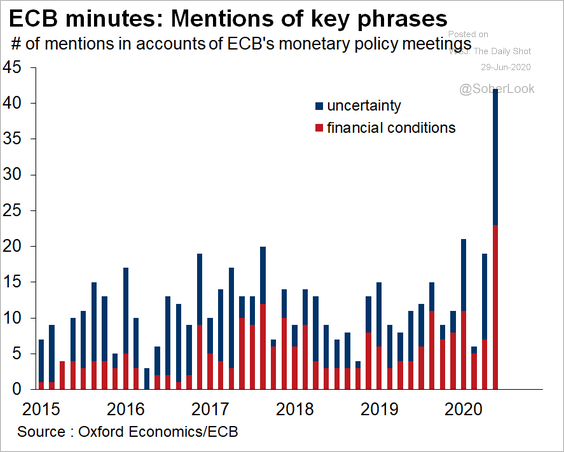 Source: @OliverRakau, @ecb
——————–
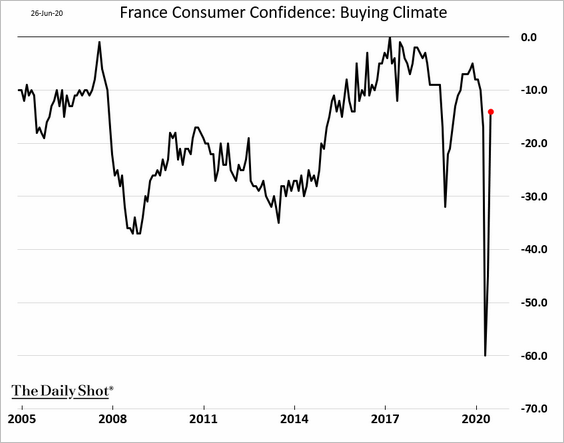
2. French consumer sentiment has been resilient.
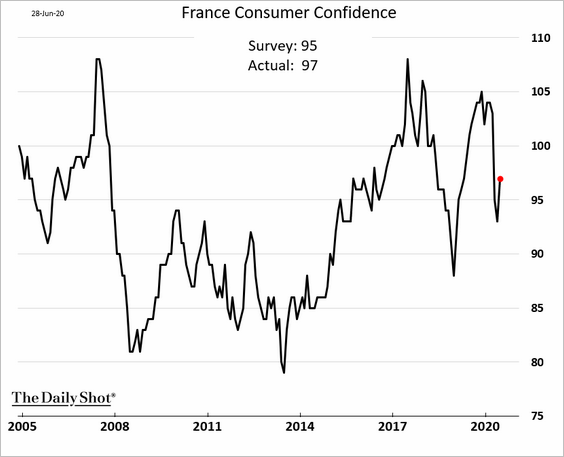
The buying climate measure rebounded.
——————–
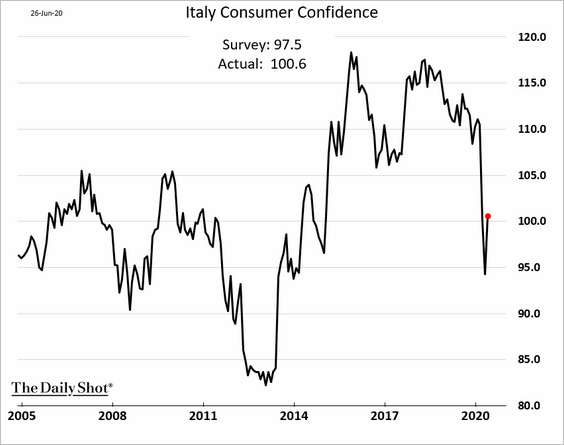
3. Italian consumer confidence bounced from multi-year lows.
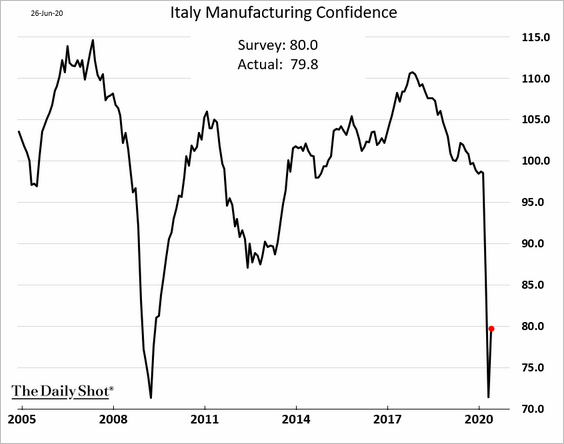
Manufacturing sentiment remains weak.
——————–
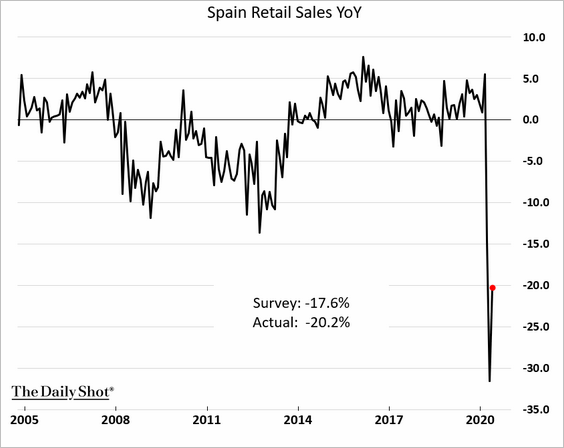
4. After a rebound, Spain’s May retail sales were still 20% below last year’s level.
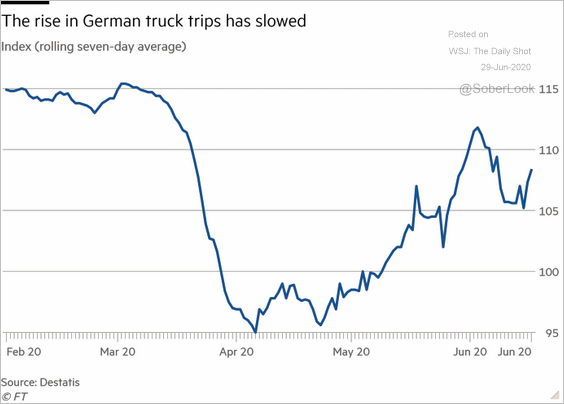
5. The recovery in the German truck trip index has stalled.
 Source: @financialtimes Read full article
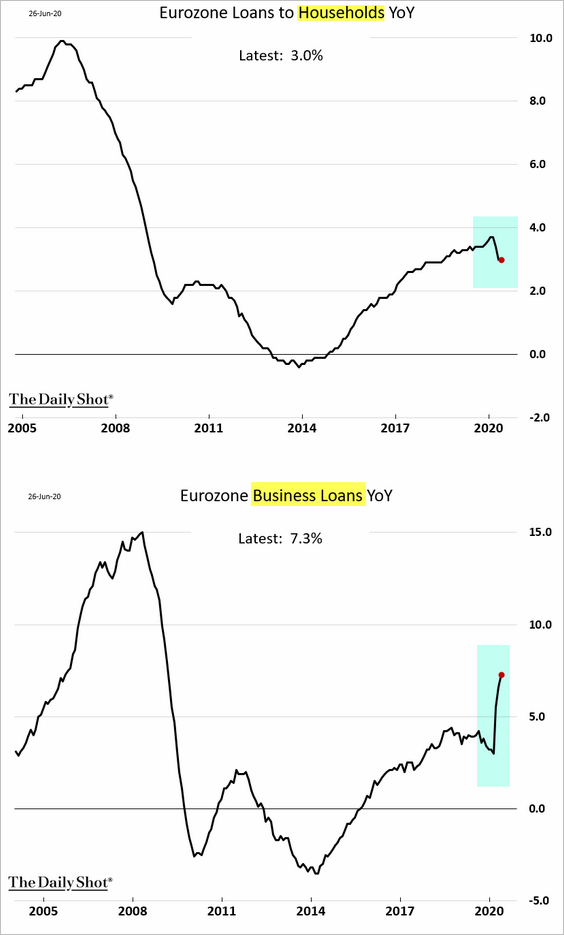
6. Loan growth trends diverged further in May. While household finance slowed, companies tapped credit lines to meet cash needs.
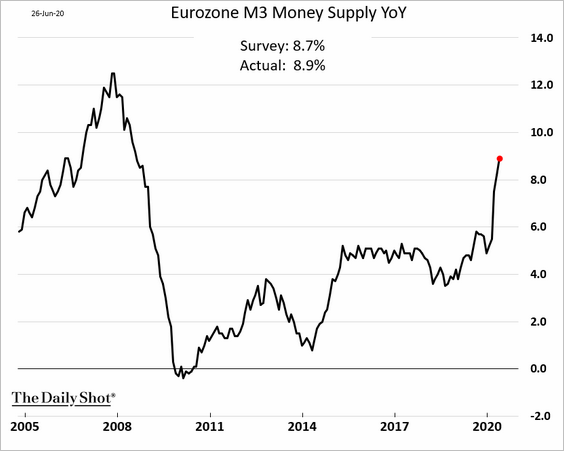
The broad money supply (M3) growth accelerated.
Here is the growth in M1 (mostly bank deposits) by country.
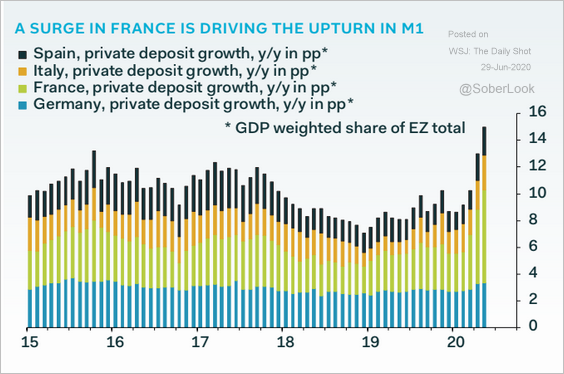 Source: Pantheon Macroeconomics
The United States
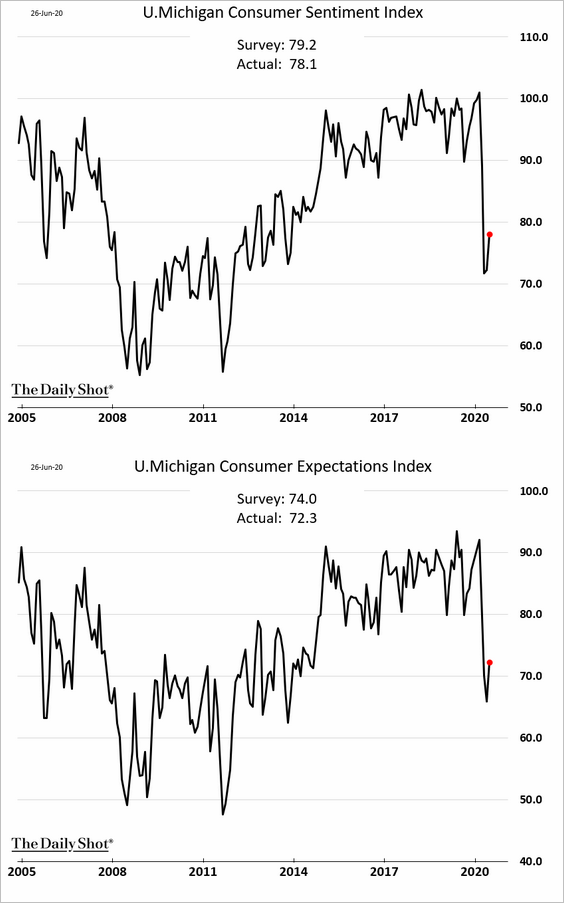
1. The final U. Michigan consumer sentiment report was below the earlier estimate, suggesting that confidence deteriorated in the latter part of June.
2. Consumption bounced from multi-year lows in May. The second chart shows net changes since February (by sector).

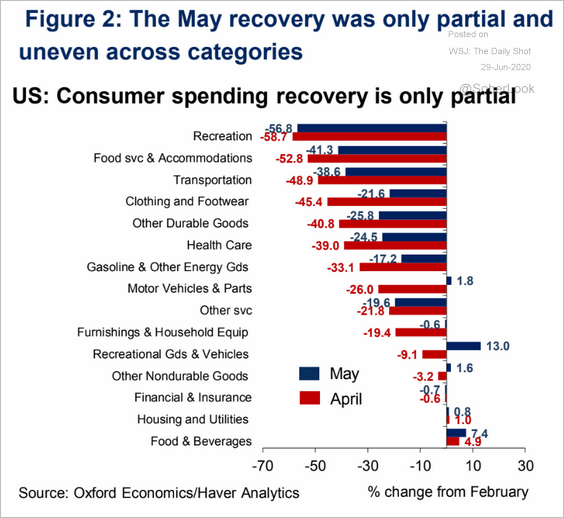 Source: Oxford Economics
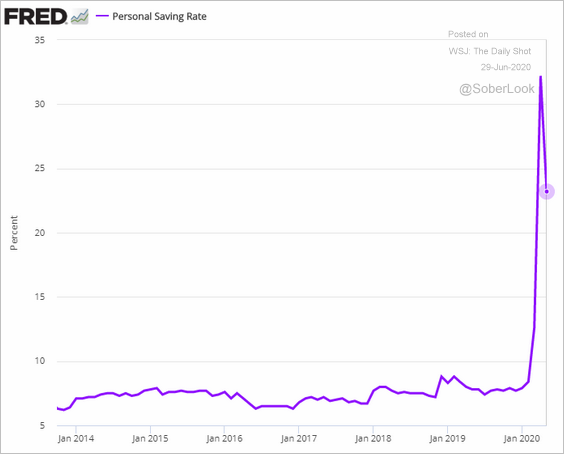
The savings rate came off the highs.
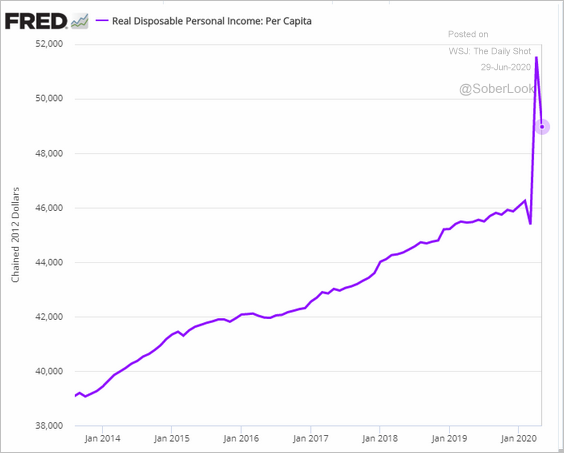
Disposable income declined.
Here are the drivers of swings in personal income. The three key components are the stimulus checks (dark blue), unemployment benefits (light blue), and compensation (red).
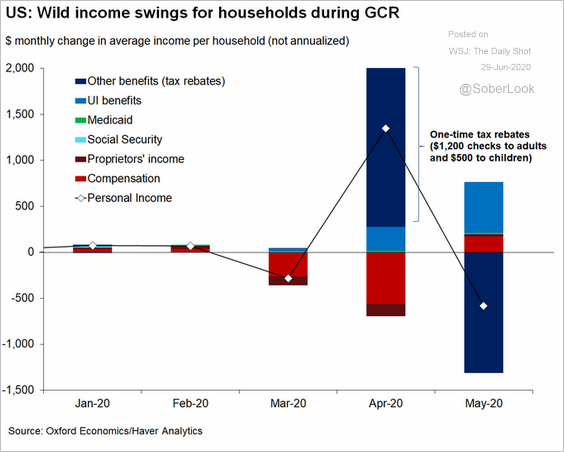 Source: @GregDaco
——————–
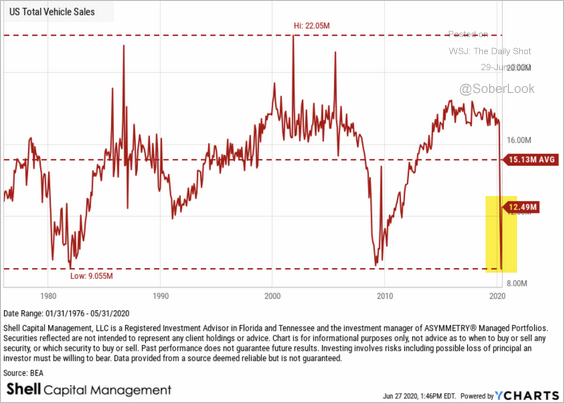
3. How do the current trends in consumption and retail sales compare to 2008?
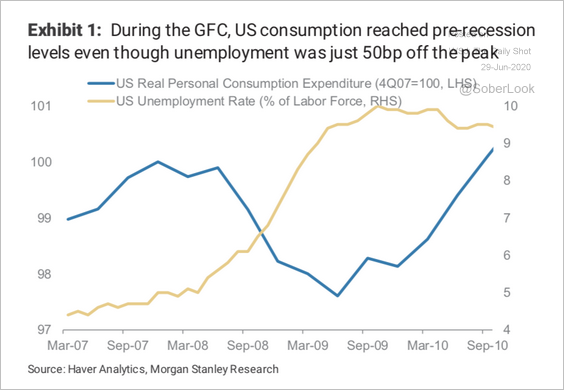 Source: Morgan Stanley Research
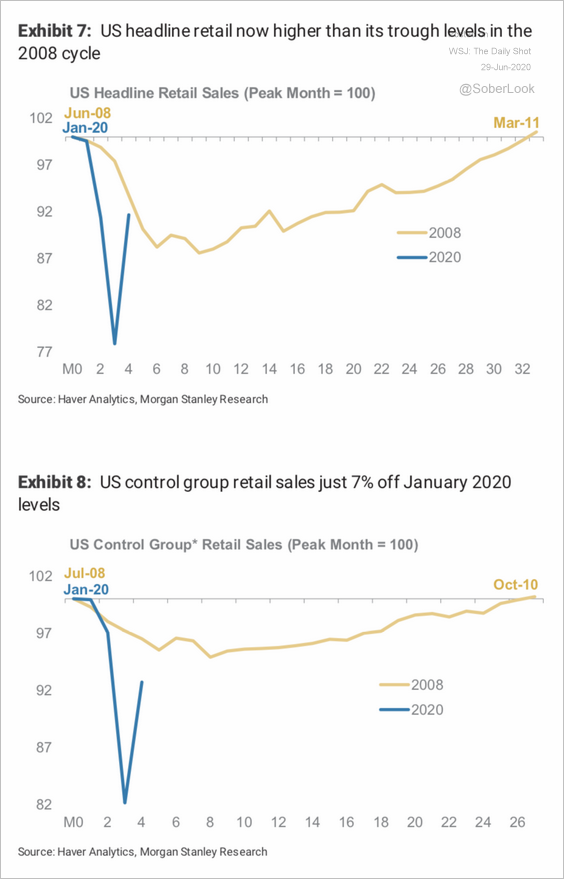 Source: Morgan Stanley Research
——————–
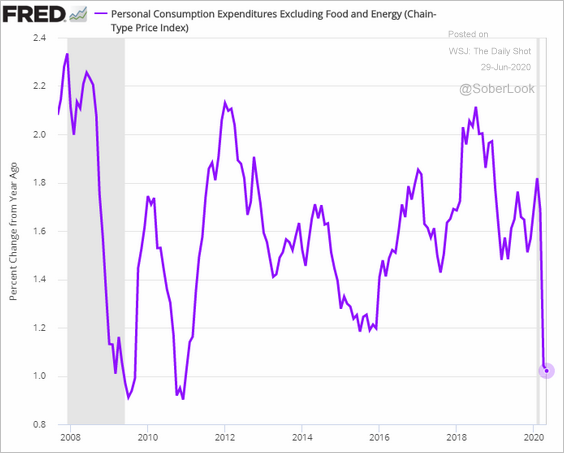
4. Here is a long-term chart of US vehicle sales.
 Source: ASYMMETRY Observations Read full article
5. The core PCE inflation hit the lowest level since 2011. Is it bottoming?
6. Next, we have some high-frequency indicators tracking the recovery.
• Businesses still closed:
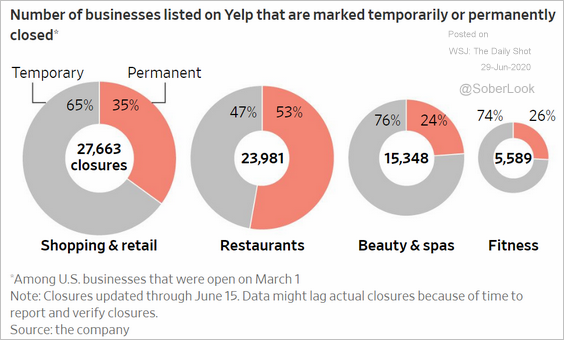 Source: @WSJ Read full article
• Daily revenues by sector:
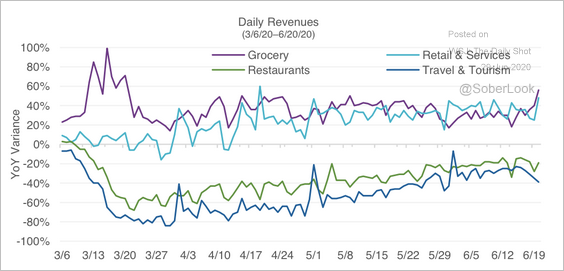 Source: Natixis Investment Managers
• Rent payments vs. 2019:
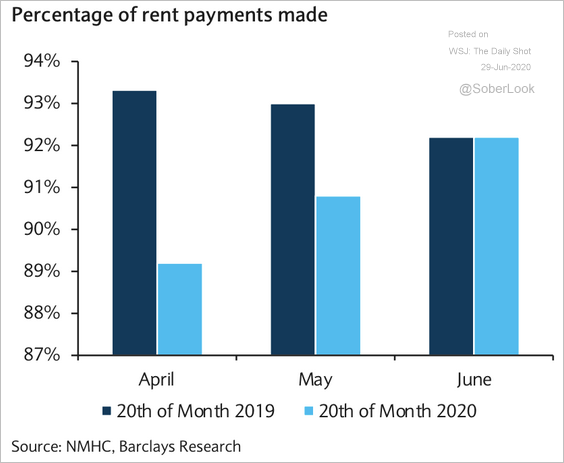 Source: Barclays Research
• The pace of recovery vs. the number of new infections:
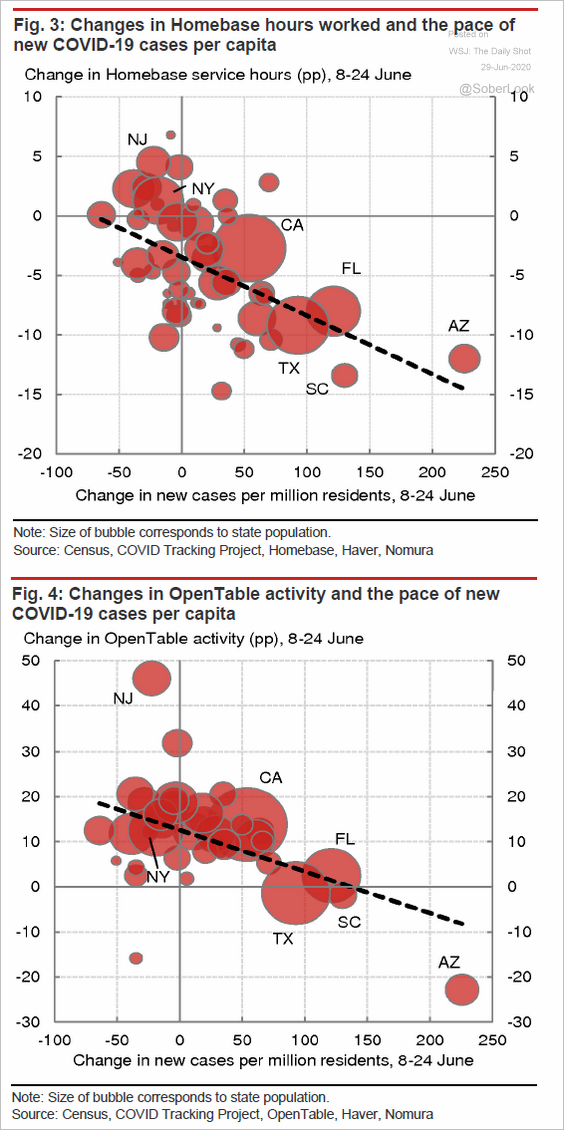 Source: Nomura Securities, @tracyalloway
• Tightening or halting reopening measures:
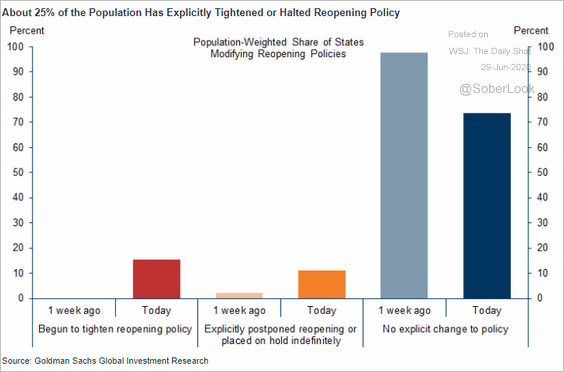 Source: Goldman Sachs
Global Developments
1. Leveraged funds and asset managers are increasingly glum on the US dollar.
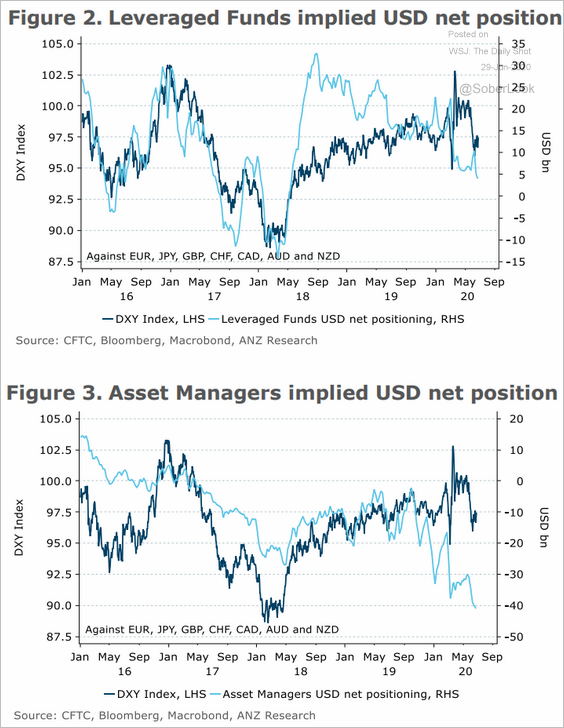 Source: ANZ Research
By the way, the dollar (trade-weighted index) is correlated to the US GDP growth relative to the rest of G7 (see this story on “dollar smile”).
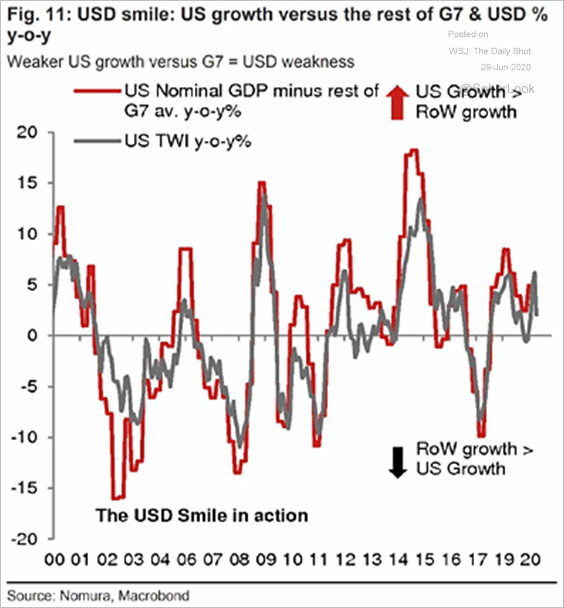 Source: @ISABELNET_SA, @Nomura
——————–
2. Global stocks have been pricing in a lot of good news, leading to soaring valuations.
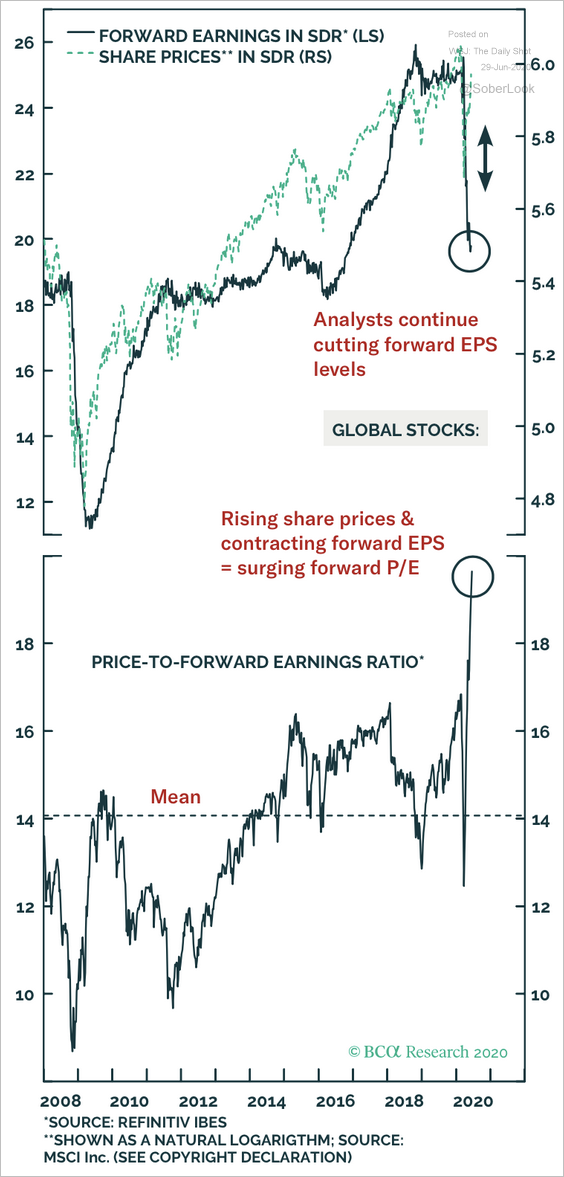 Source: BCA Research
3. Here is the global manufacturing PMI.
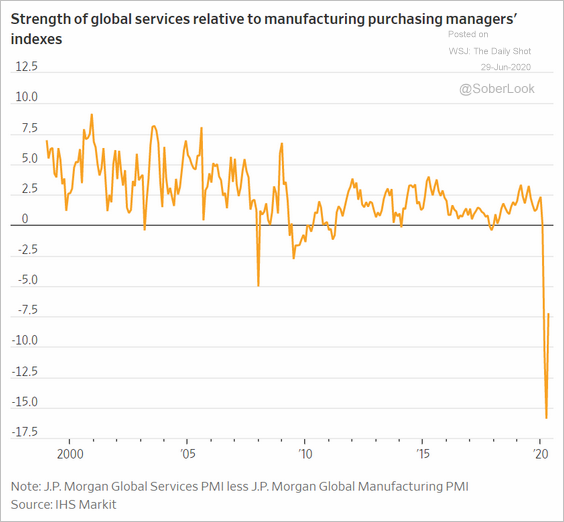 Source: @WSJ Read full article
——————–
Food for Thought
1. US employment-to-population ratio since 1948:
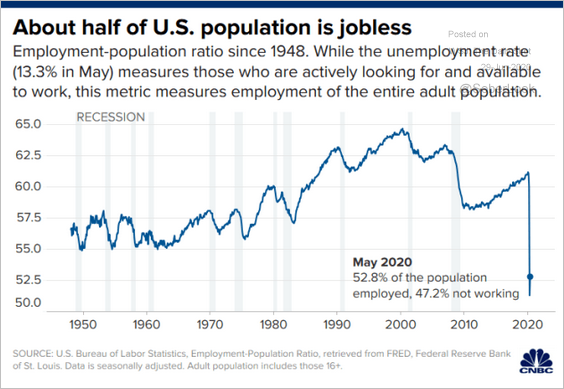 Source: CNBC Read full article
2. US average employment, by age:
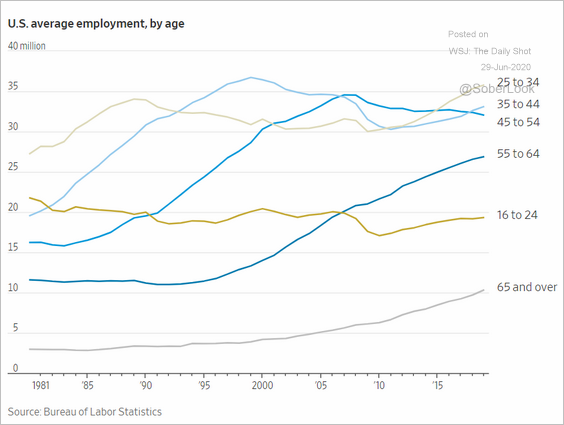 Source: @WSJ Read full article
3. US exports by state:
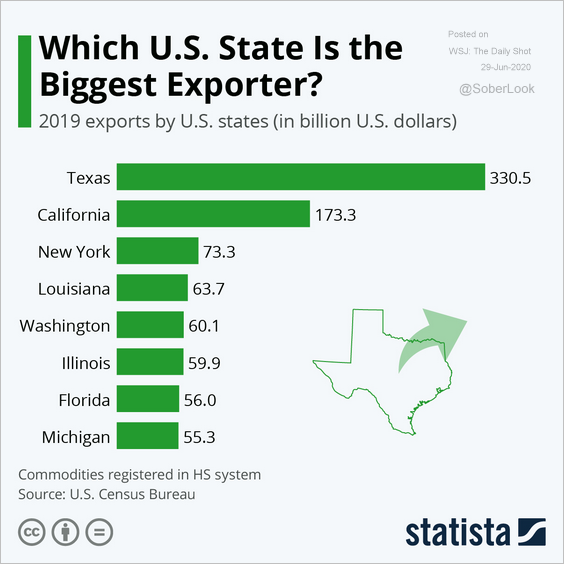 Source: Statista
4. GDP by metro area:
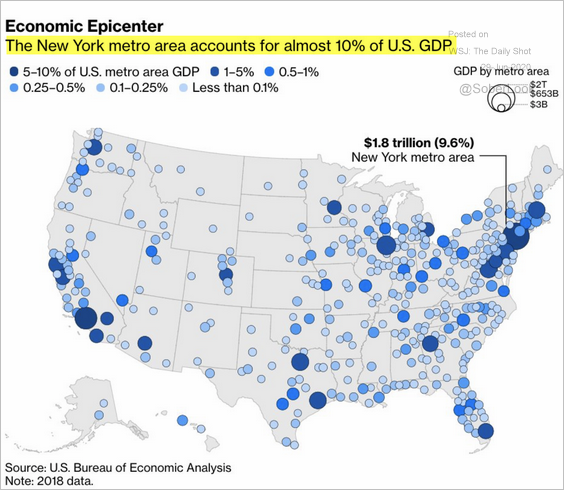 Source: @adam_tooze, @bopinion Read full article
5. Reopening in the US vs. Europe:
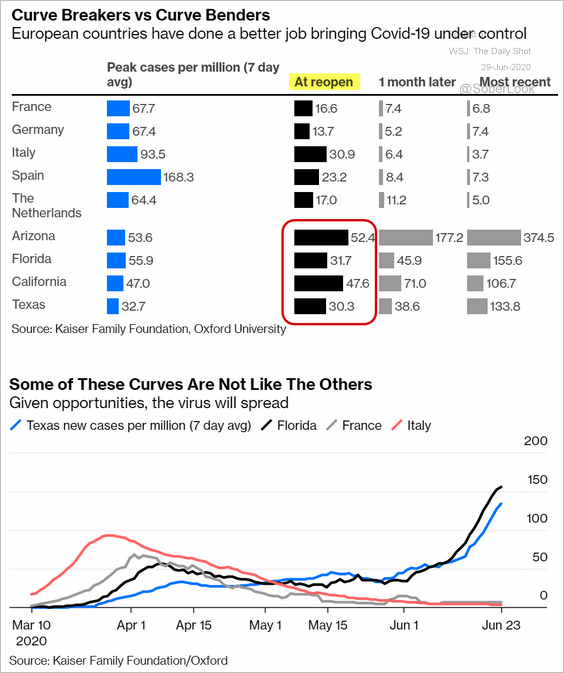 Source: @bopinion Read full article
6. The medicinal cannabis industry:
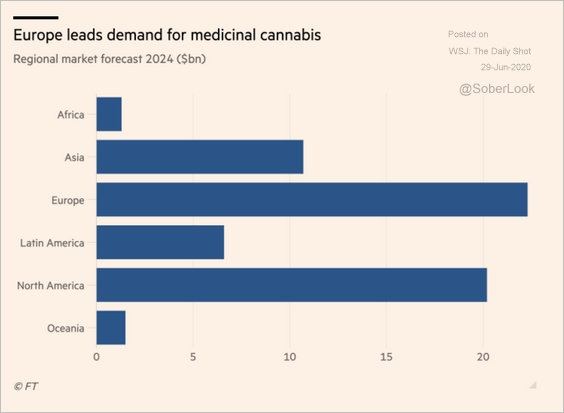 Source: @financialtimes Read full article
7. Views on police reform:
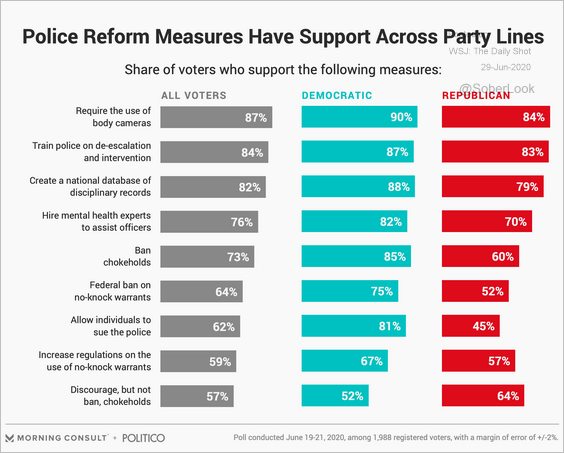 Source: Morning Consult Read full article
8. Inter-Korean dialogue:
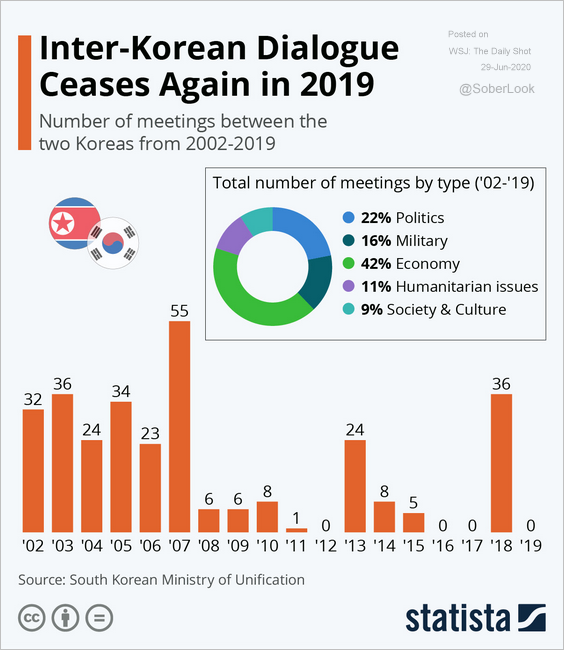 Source: Statista
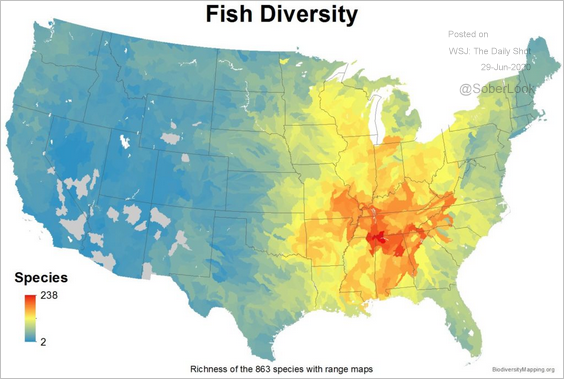
9. Bird, fish, and tree diversity in the continental US:
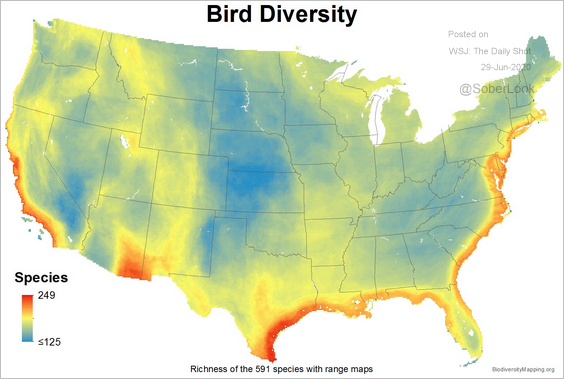 Source: Instituto de Pesquisas Ecológicas
 Source: Instituto de Pesquisas Ecológicas
 Source: Instituto de Pesquisas Ecológicas
——————–