
The Daily Shot: 01-Jul-20
• The United States
• Canada
• The United Kingdom
• The Eurozone
• Europe
• Asia – Pacific
• China
• Emerging Markets
• Commodities
• Energy
• Equities
• Credit
• Global Developments
• Food for Thought
The United States
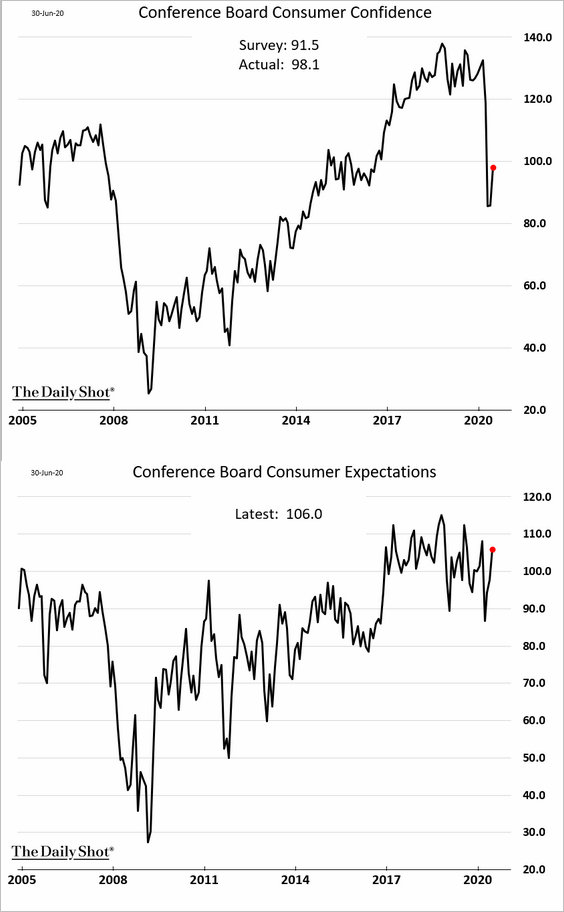
1. The Conference Board’s consumer confidence index rebounded in June, topping economists’ forecasts.
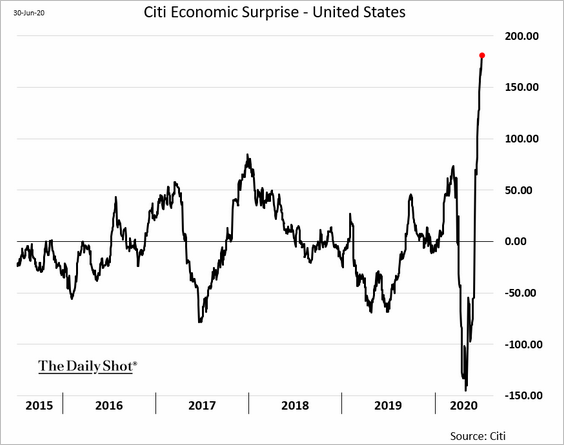
• The consumer confidence upside surprise sent the Citi Economic Surprise Index to a new record.
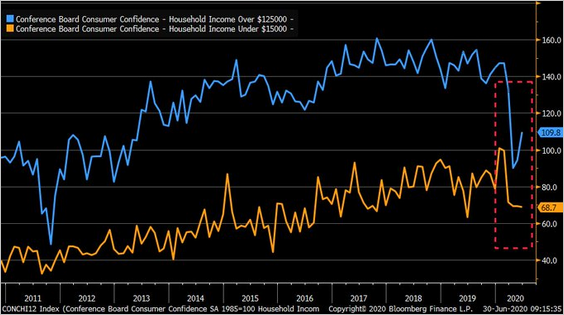
• Wealthier households showed more improvement in sentiment than those with lower incomes.
 Source: @LizAnnSonders, @Conferenceboard
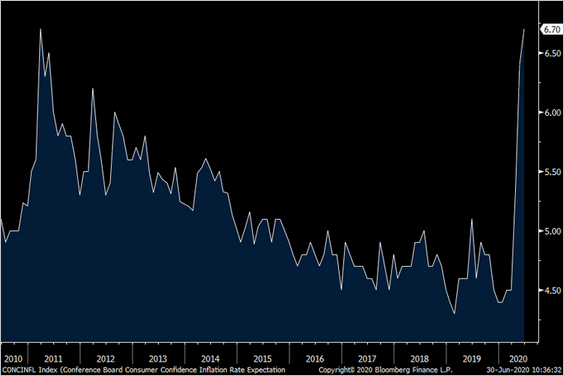
• Consumer inflation expectations rose further.
 Source: @pboockvar
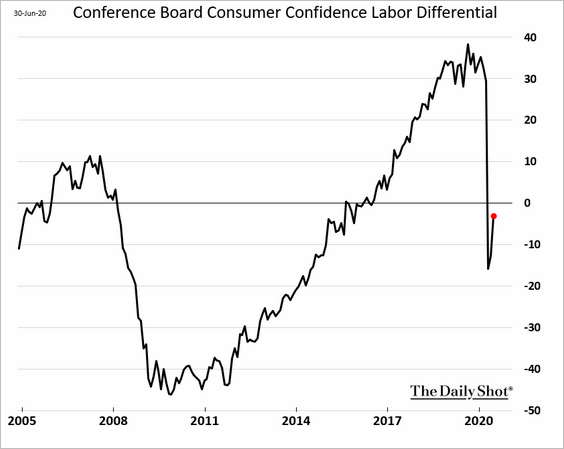
• The Labor Differential index improved. It’s the spread between “jobs plentiful” and “jobs hard to get” indicators.
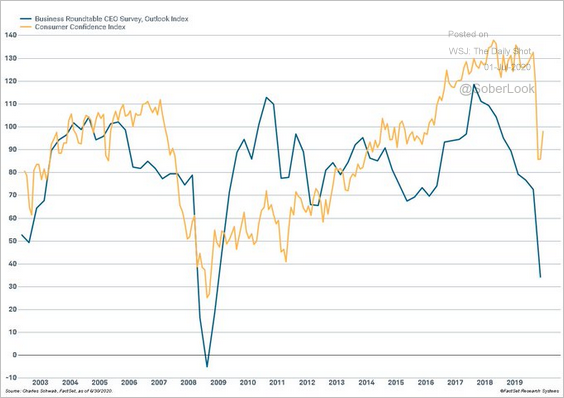
• Consumer and business confidence indices have diverged.
 Source: @LizAnnSonders, @Conferenceboard, @roundtablepnw
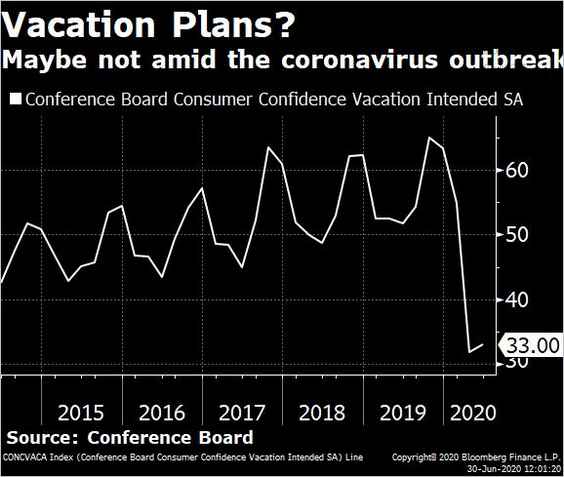
• Americans are not yet ready to go on vacation.
 Source: @SteveMatthews12, @livrockeman, @economics Read full article
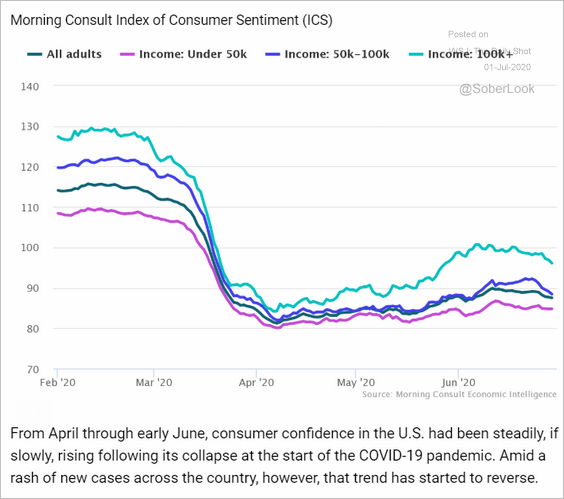
As discussed previously, high-frequency indicators show that sentiment peaked in late June.
 Source: Morning Consult Read full article
——————–
2. High-frequency small business metrics (from Homebase) show activity peaking in late June.
• Hours worked, businesses open, and employees working:
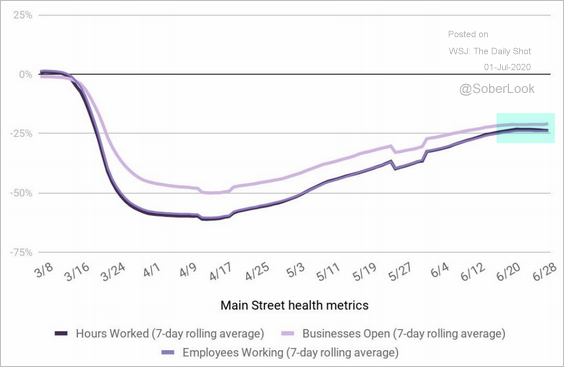 Source: Homebase
• Retail and food/drink businesses:
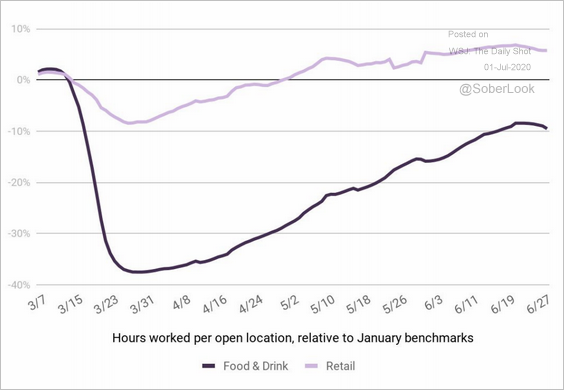 Source: Homebase
• States hit the hardest by the latest wave of infections:
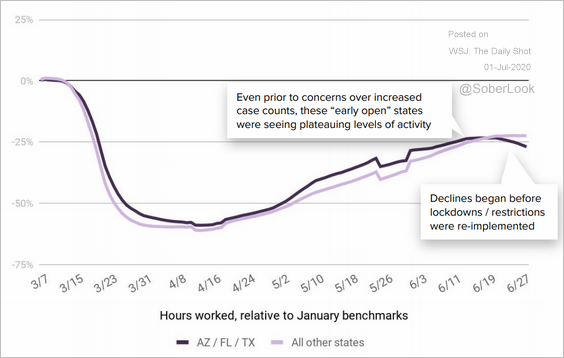 Source: Homebase
——————–
3. The Paychex/IHS Markit Small Business Employment Index shows no signs of a rebound.
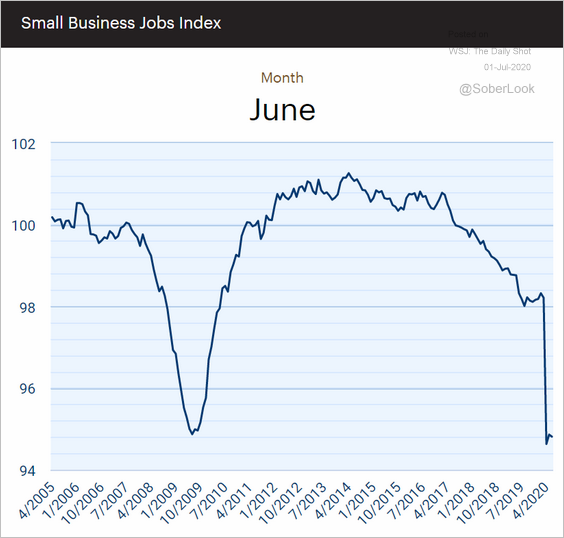 Source: Paychex/IHS Markit Small Business Employment Watch
4. At this point, over 40% of the population has seen reopening halted or reversed (2 charts).
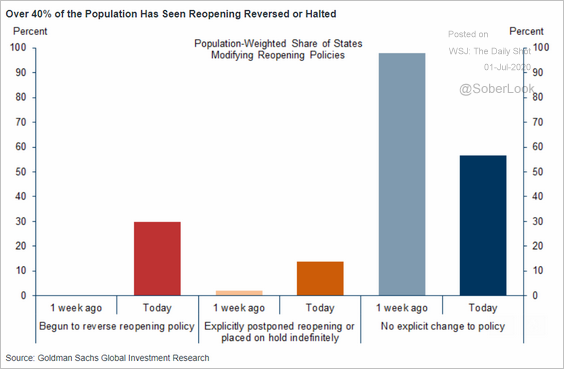 Source: Goldman Sachs
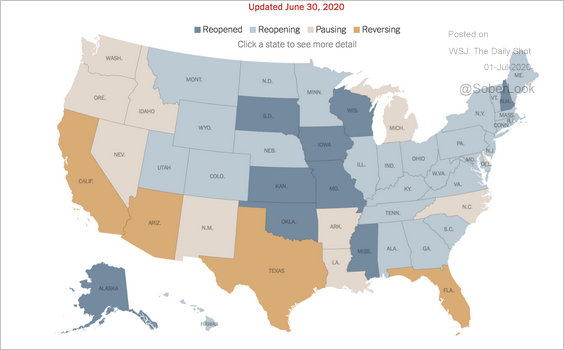 Source: The New York Times Read full article
——————–
5. Concerned about consumer credit, banks have pulled back on credit card offers.
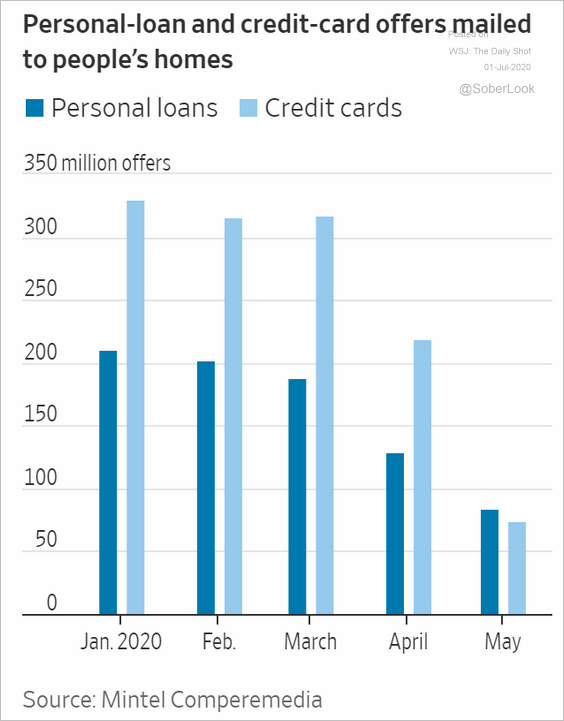 Source: @WSJ Read full article
6. Economists are worried about the “income cliff” at the end of the month. That’s when the $600/week of additional unemployment benefits run out.
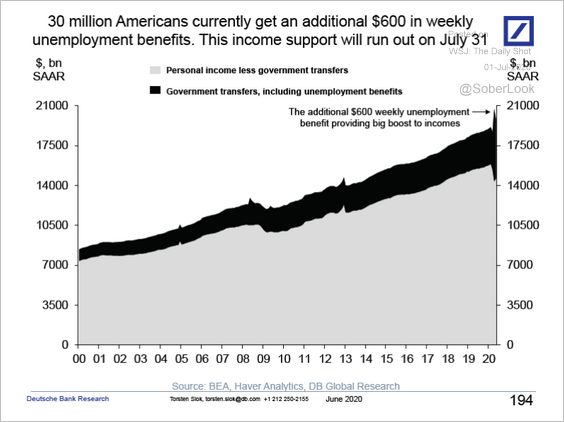 Source: Deutsche Bank Research
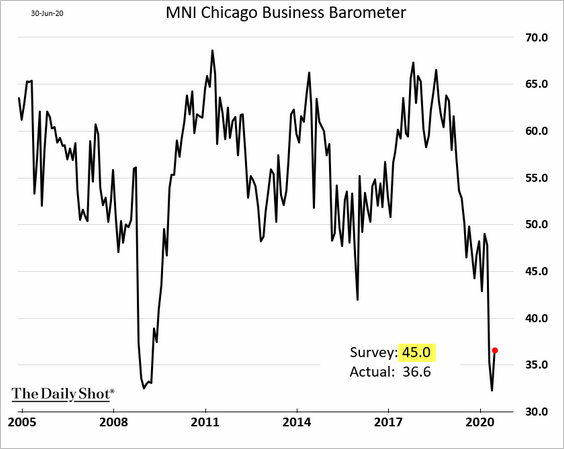
7. In contrast with the sharp improvements in the regional Fed manufacturing surveys, the Chicago PMI index surprised to the downside. This result dampened expectations for the ISM manufacturing report at the national level.
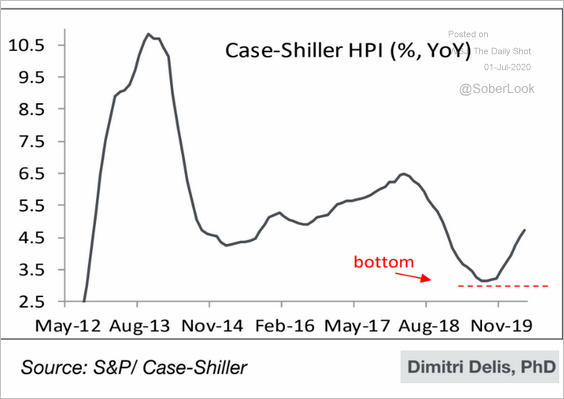
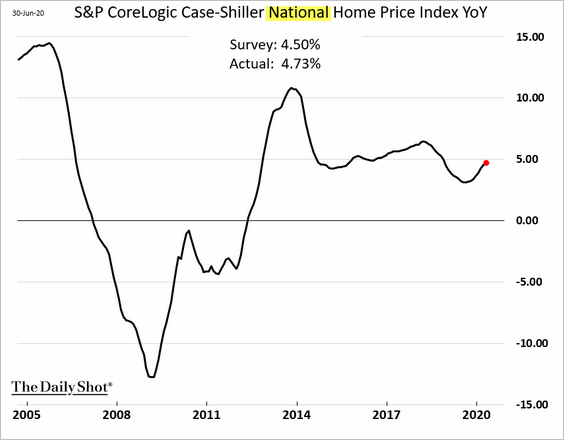
8. Home price appreciation had bottomed late last year and continues to improve.
 Source: Piper Sandler
Canada
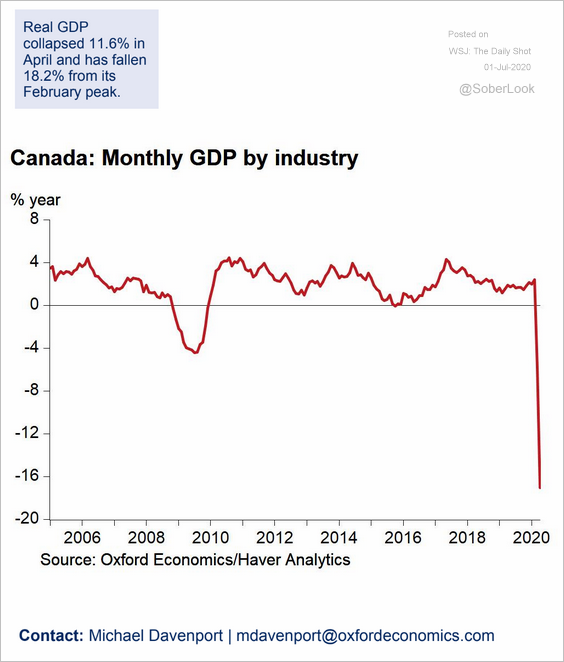
1. In April, the GDP was down 18% from February.
 Source: Oxford Economics
2. Companies with less financial leverage have performed better year-to-date.
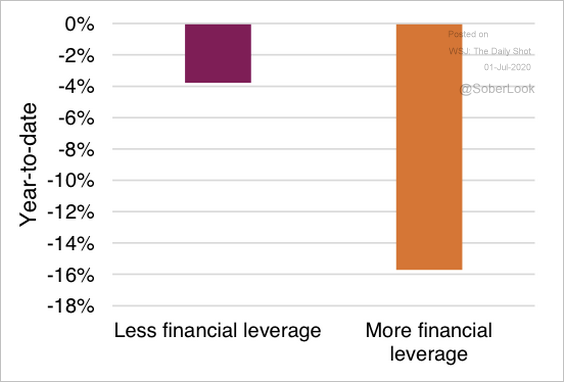 Source: Market Ethos, Richardson GMP
3. Canadian dividend-paying companies are inexpensive.
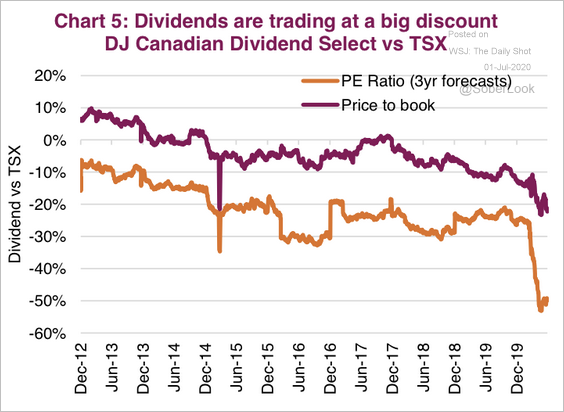 Source: Market Ethos, Richardson GMP
4. Mortgage credit growth has accelerated as rates declined (2 charts).
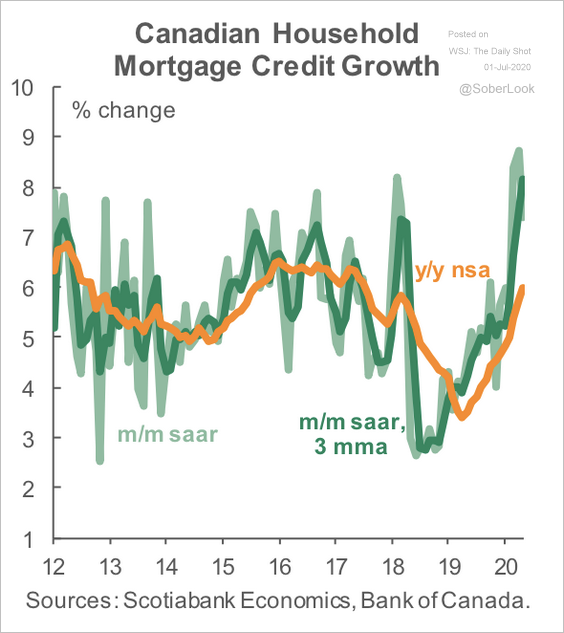 Source: Scotiabank Economics
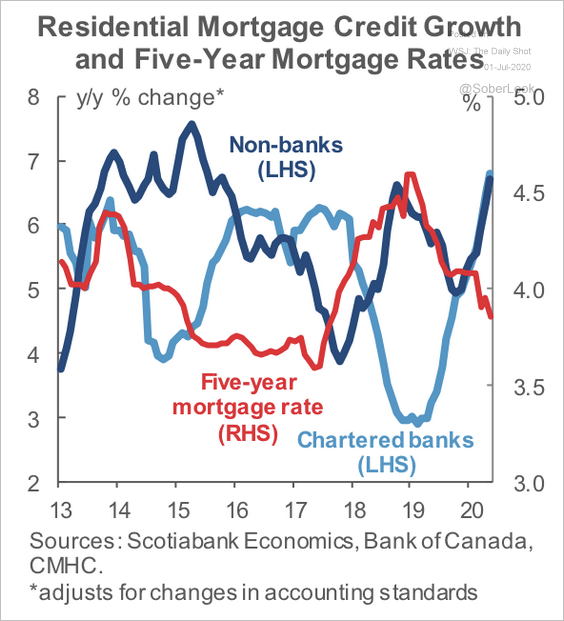 Source: Scotiabank Economics
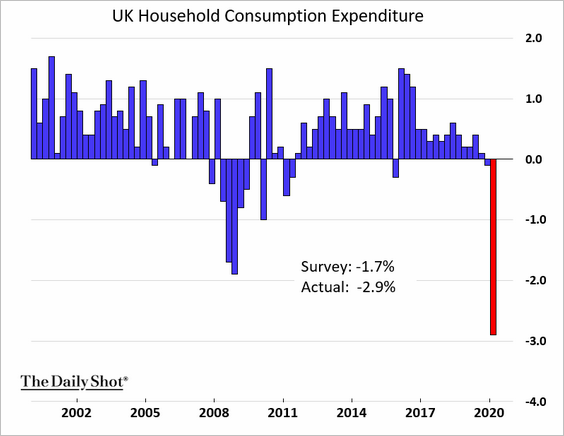
The United Kingdom
1. The revised Q1 GDP figures were worse than initially reported.
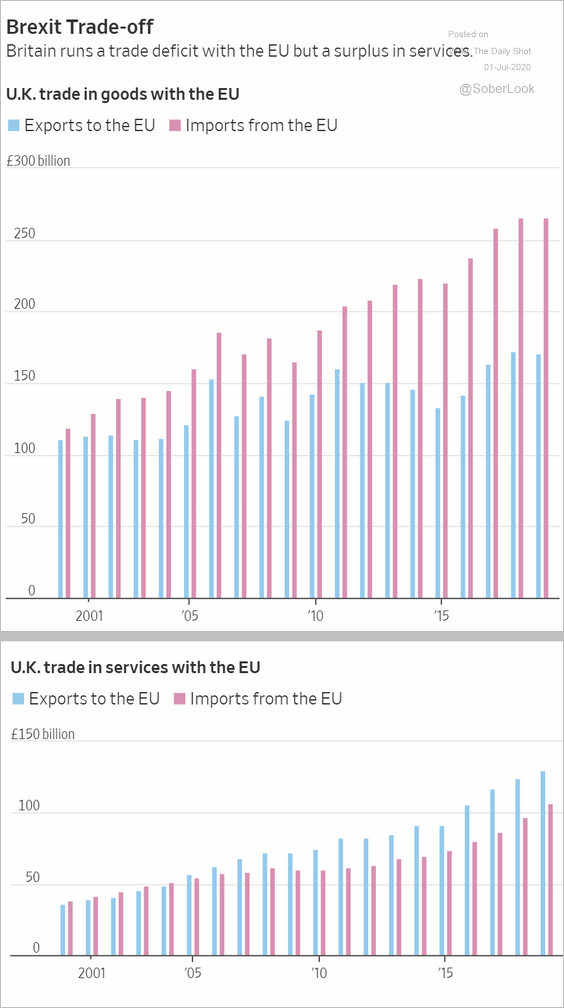
2. These charts show the UK-EU trade in goods and services.
 Source: @WSJ Read full article
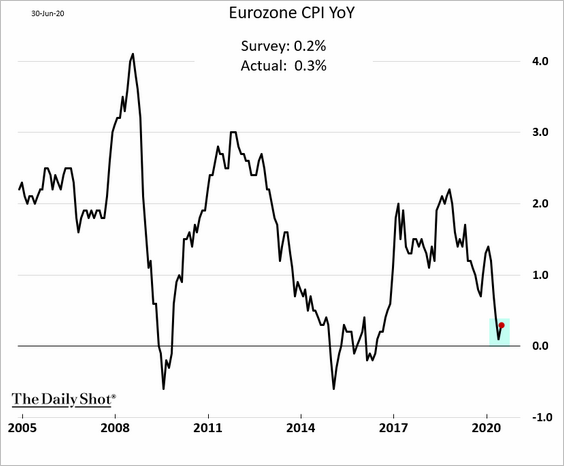
The Eurozone
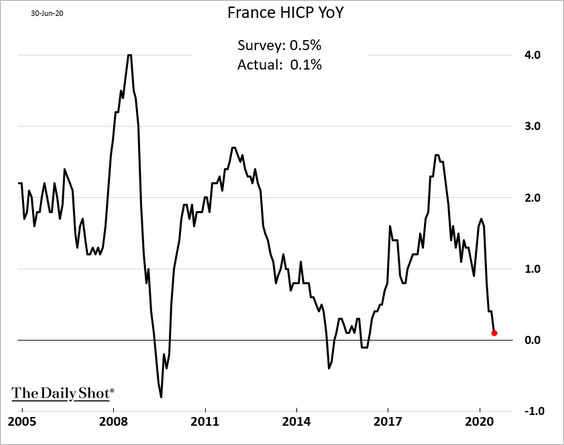
1. Unlike Germany and Spain, France and Italy reported lower inflation in June.
• France (near zero):
• Italy (deeper in deflation):
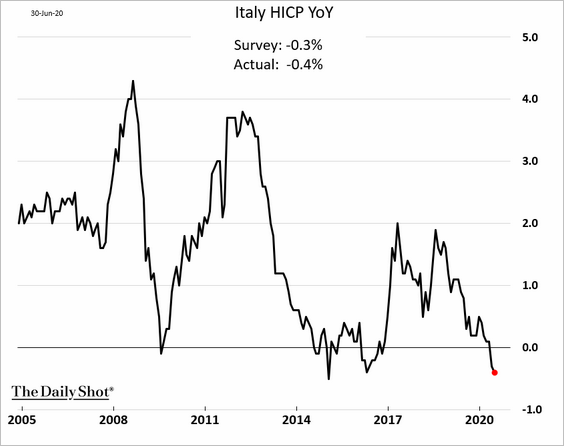
Nonetheless, there was an uptick at the Eurozone level.
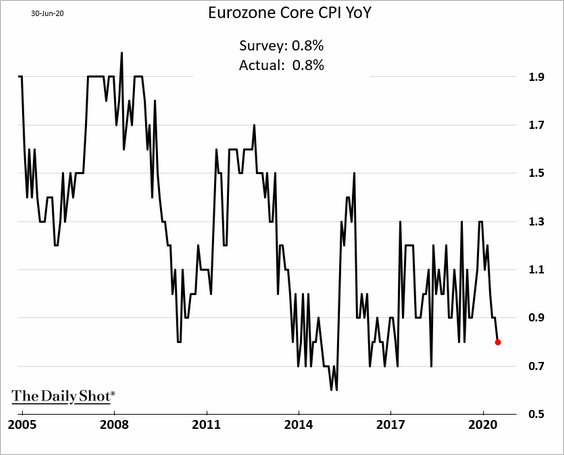
Here is the core CPI.
——————–
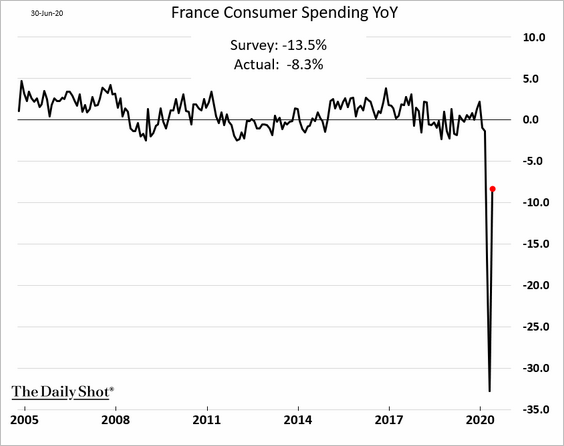
2. French consumer spending rebounded sharply in May.
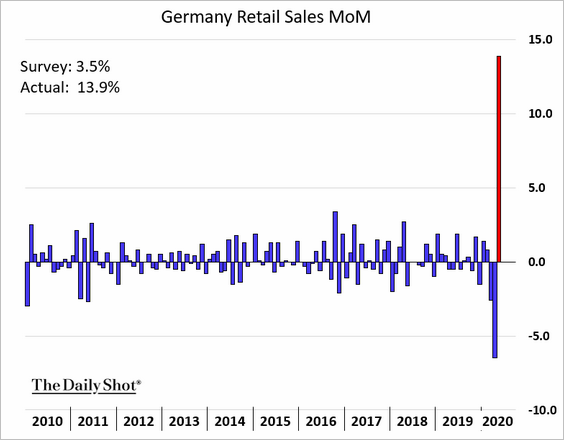
3. German May retail sales also topped economists’ forecasts.
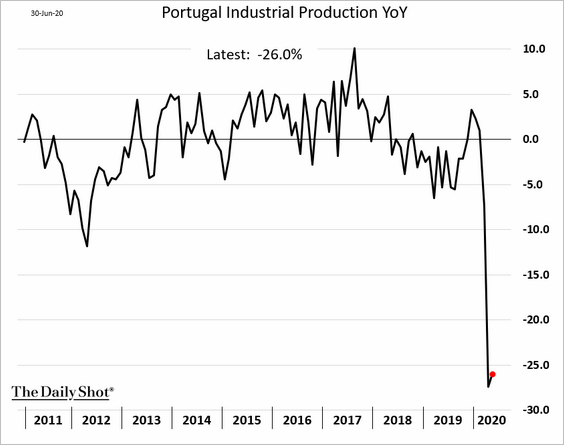
4. Portugal’s industrial production remains depressed.
Europe
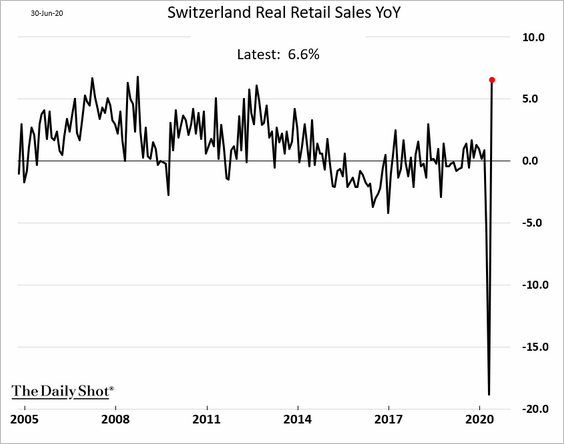
1. Swiss retail sales staged an unprecedented rebound in May.
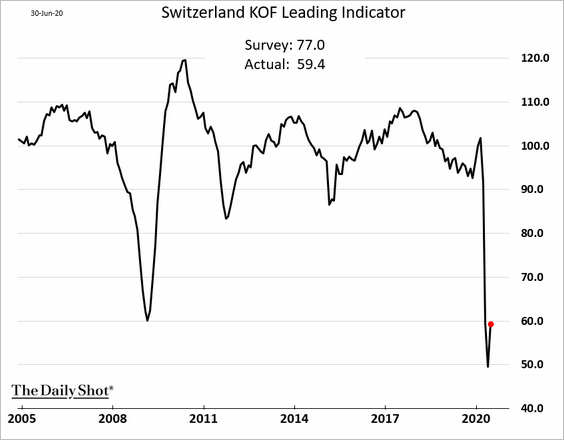
However, the June index of leading indicators remains below the worst levels of the 2008 recession.
——————–
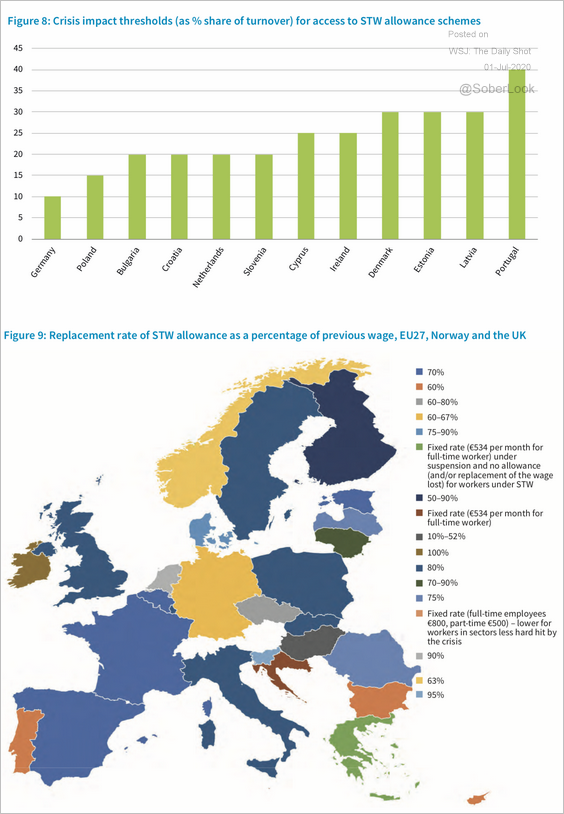
2. Next, we have some data on the use of the short-time work (STW) scheme used to preserve jobs across EU member states.
 Source: Eurofound Read full article
Asia – Pacific
1. Japan’s factories were struggling in the second quarter.
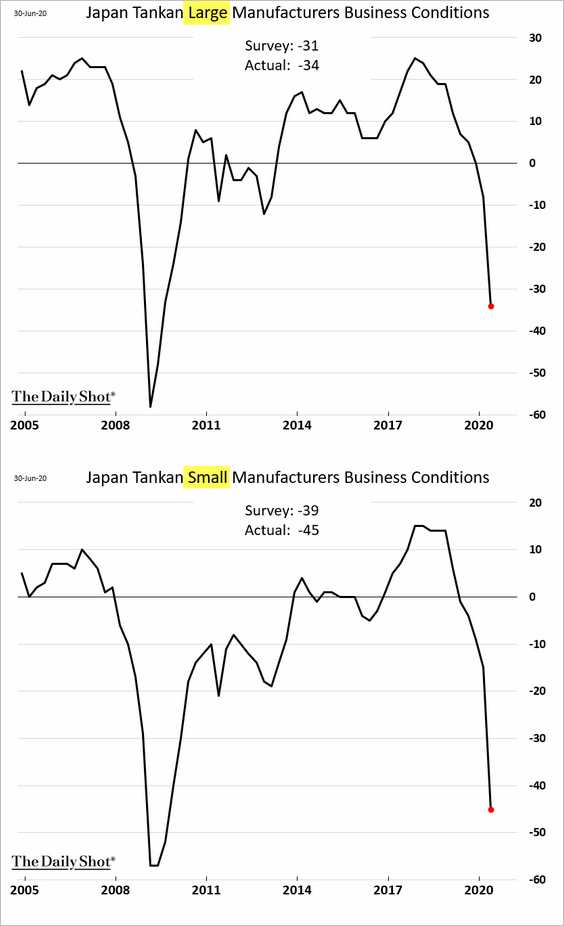
The manufacturing sector’s pain is reflected in the Markit PMI report.
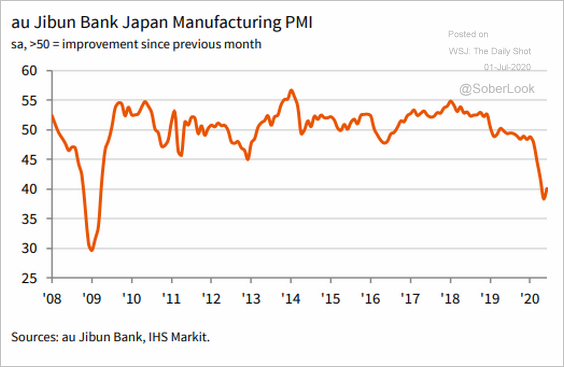 Source: @IHSMarkitPMI Read full article
——————–
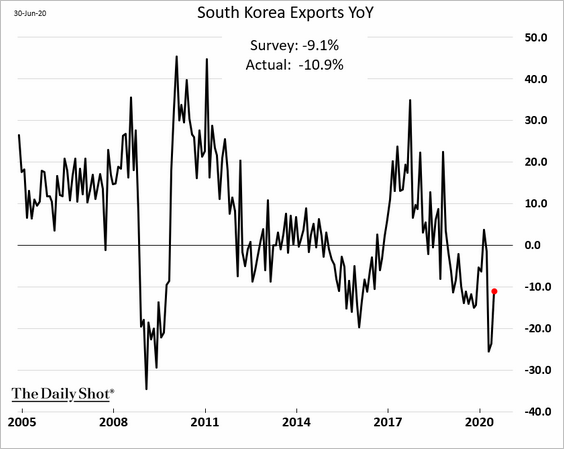
2. South Korea’s factory activity is still deep in contraction mode, according to Markit PMI.
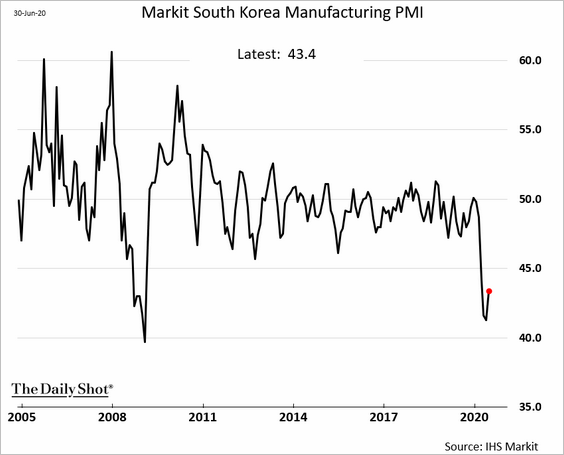
Exports remain soft.
——————–
3. Taiwan’s June PMI showed improvement but no growth.
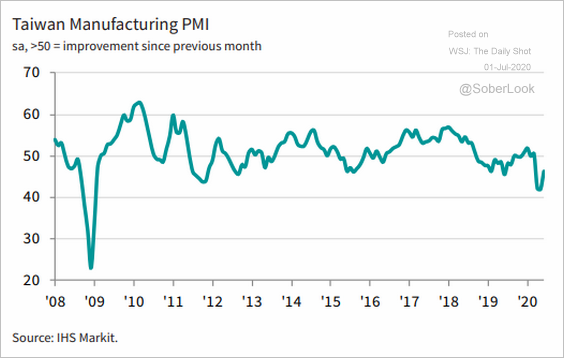 Source: @IHSMarkitPMI Read full article
The Taiwan dollar continues to rally.

——————–
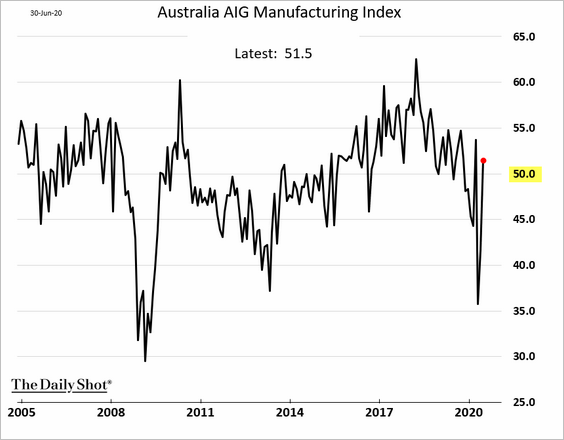
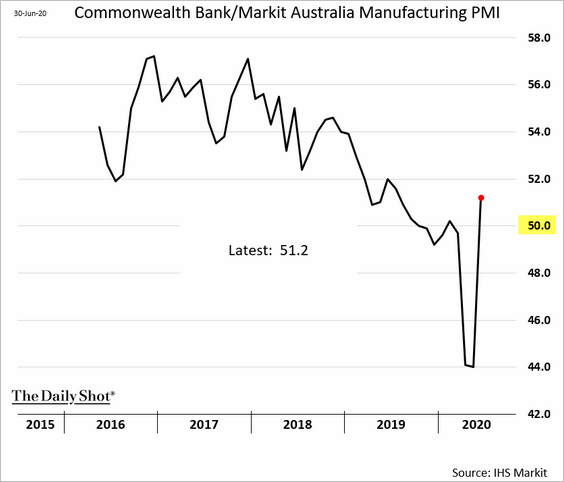
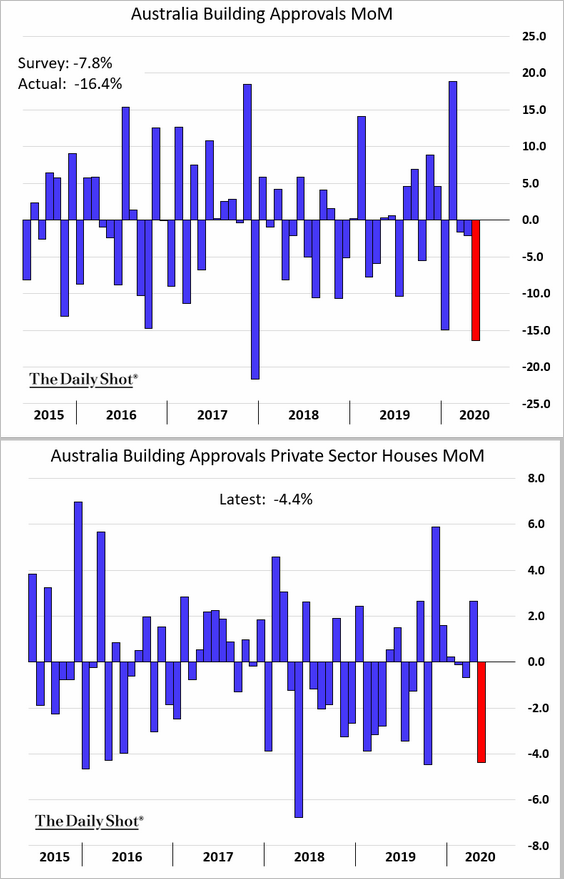
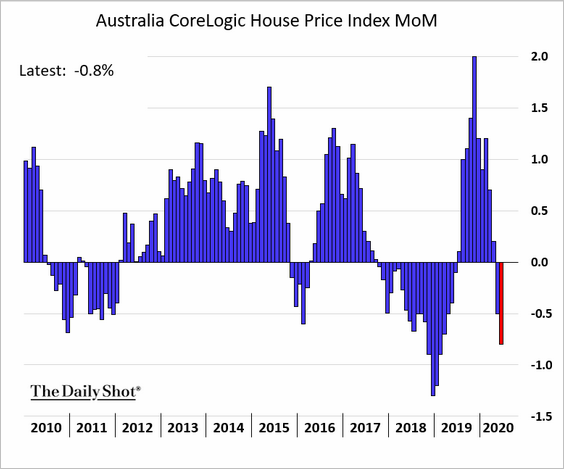
4. Next, we have some updates on Australia.
• Manufacturing is now in growth mode (PMI > 50).
• Building approvals declined sharply in May.
• Home prices are now falling.
China
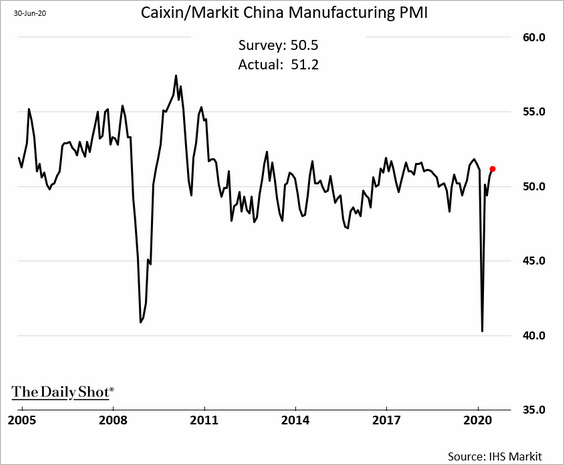
1. The June Markit Manufacturing PMI report topped economists’ expectations. Factories are now firmly in growth mode.
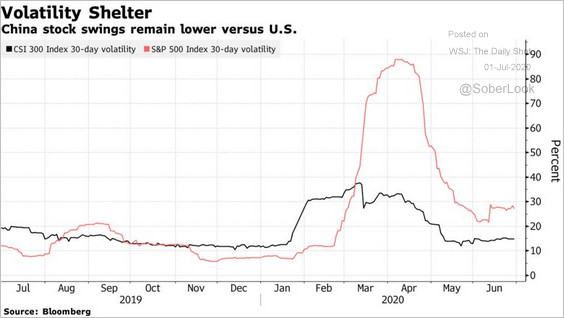
2. China’s stocks have been much less volatile than US counterparts.
 Source: @markets Read full article
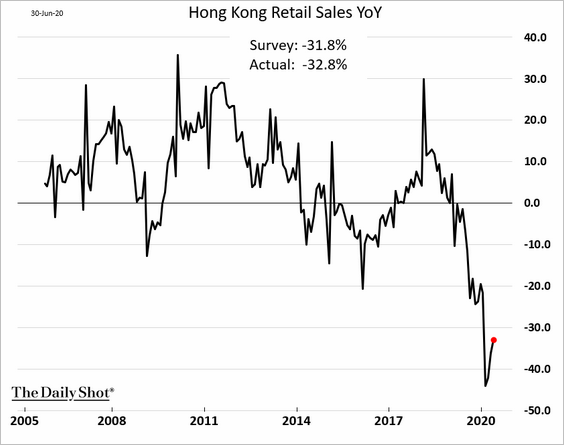
3. Hong Kong’s retail sales showed some improvement in May, but recovery will take a long time.
Economic uncertainty will persist even after the pandemic-related disruptions subside.
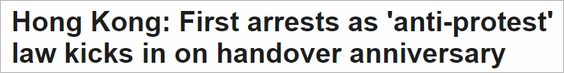 Source: BBC Read full article
Emerging Markets
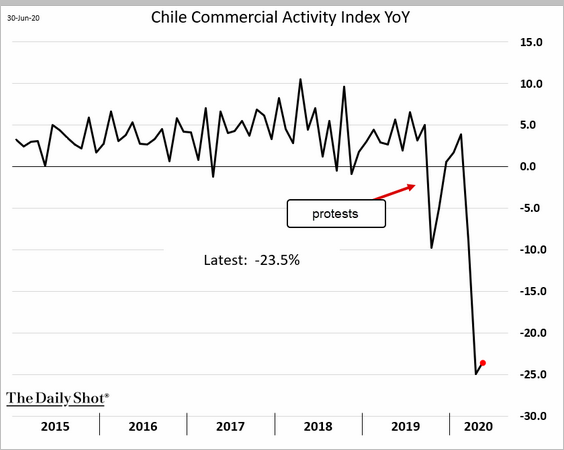
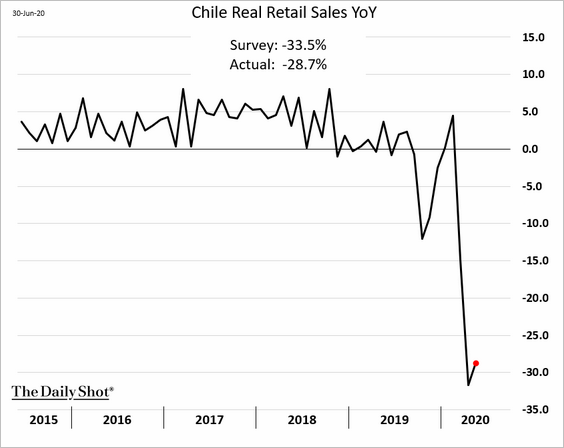
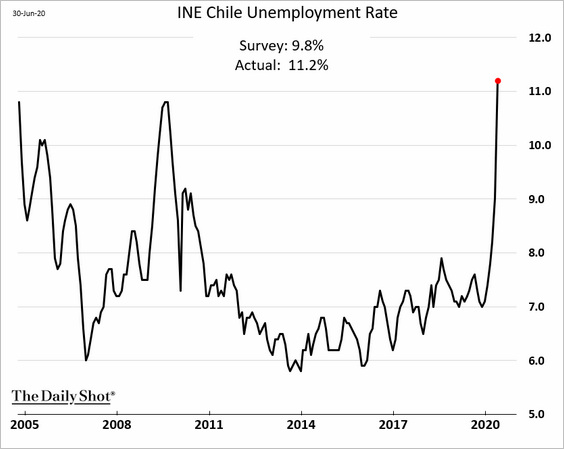
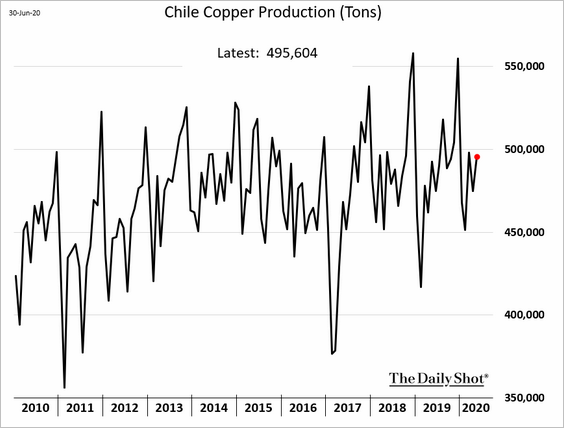
1. Let’s begin with Chile, where modest economic improvements in May did little to alleviate the grim economic situation.
• Commercial activity:
• Retail sales:
• Unemployment:
• Manufacturing output:
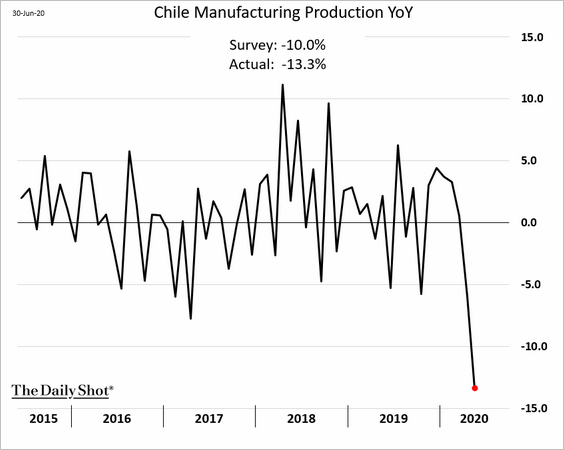
Copper production, however, remained robust. Rising copper prices (see the commodities section) will be a tailwind for the economy.
——————–
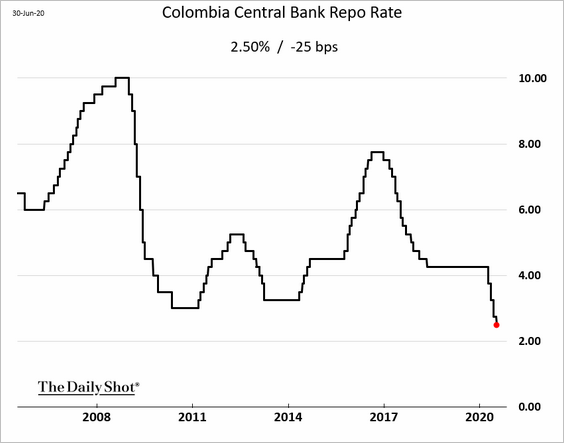
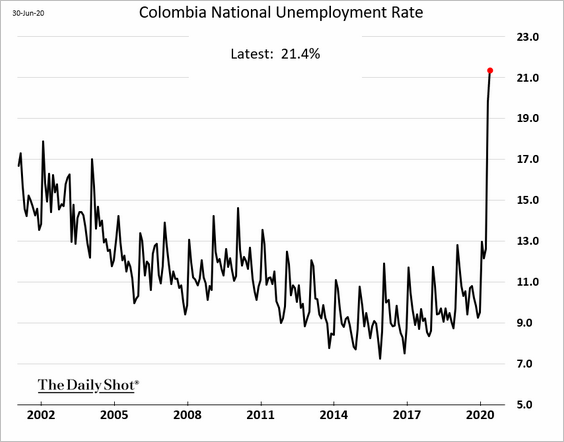
2. Colombia’s central bank cut rates again as unemployment keeps rising (second chart). Economists expected a 50 bps reduction.
——————–
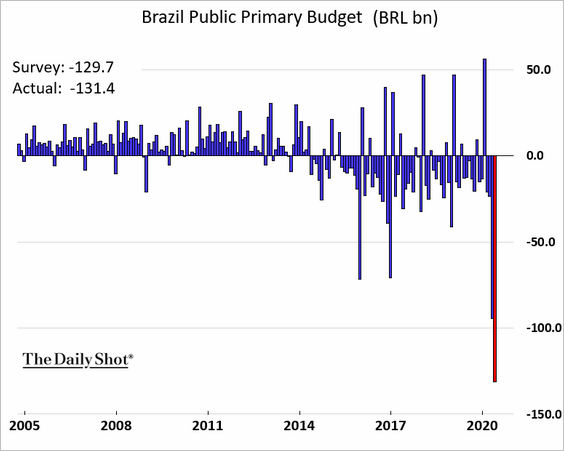
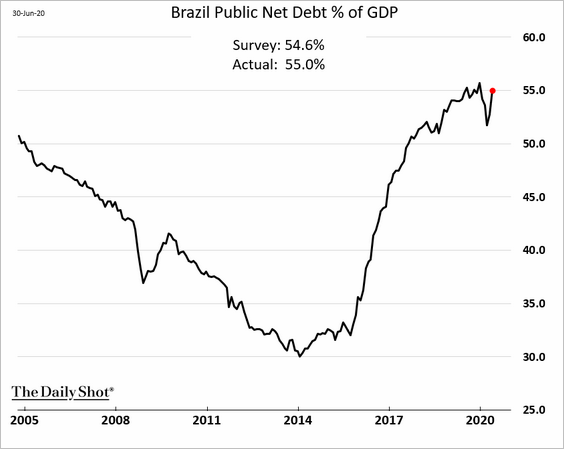
3. Brazil’s fiscal picture continues to deteriorate.
• Budget deficit:
• Debt-to-GDP ratio:
——————–
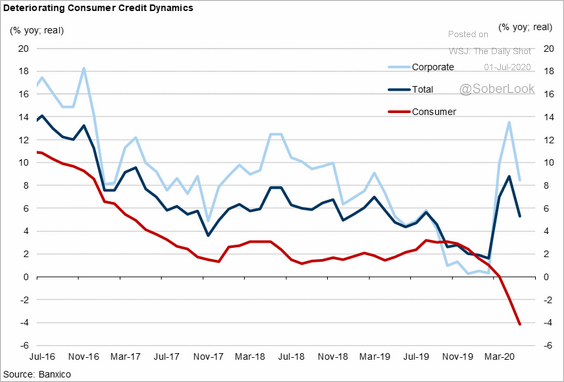
4. Mexico’s consumer credit is shrinking rapidly.
 Source: Goldman Sachs
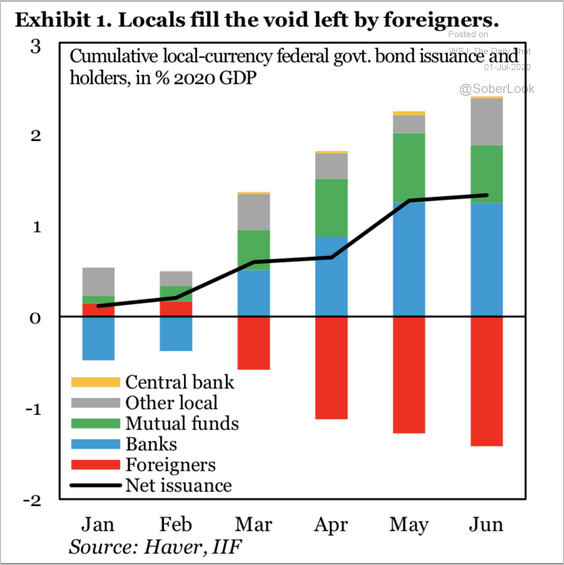
Separately, Mexico’s domestic investors are filling the void left by foreigners in absorbing new government debt issuance.
 Source: IIF
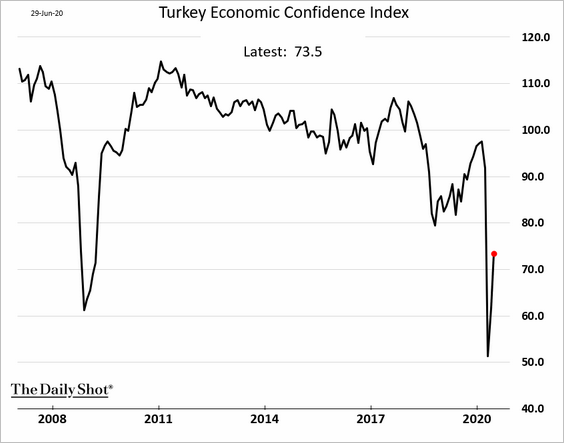
5. Turkey’s economic confidence is improving (from record lows).
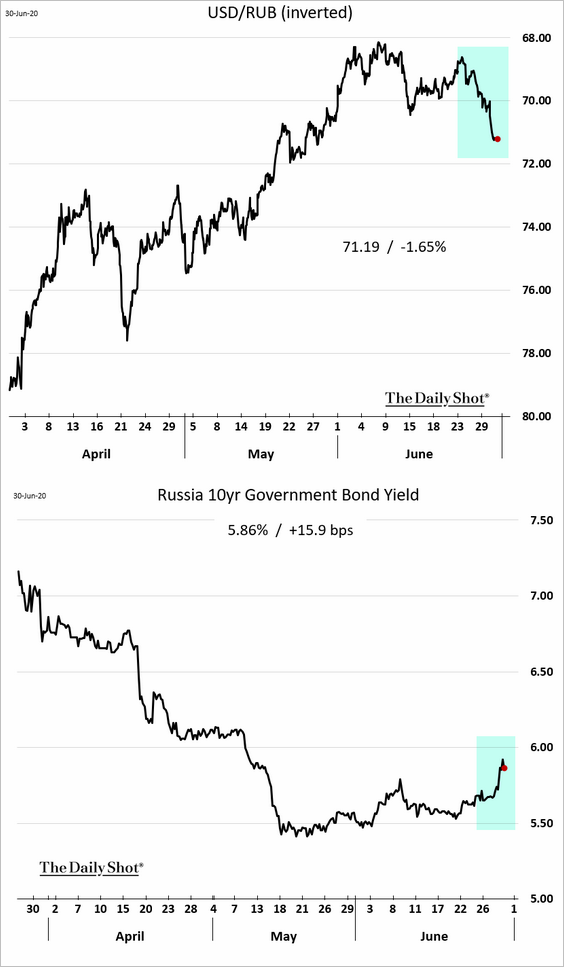
6. Russia’s currency and bonds sold off on concerns about US sanctions.
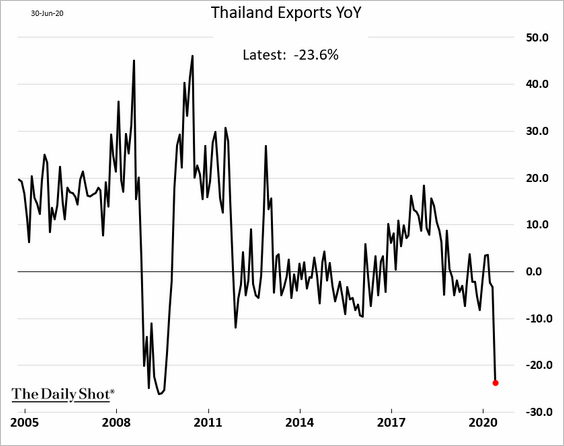
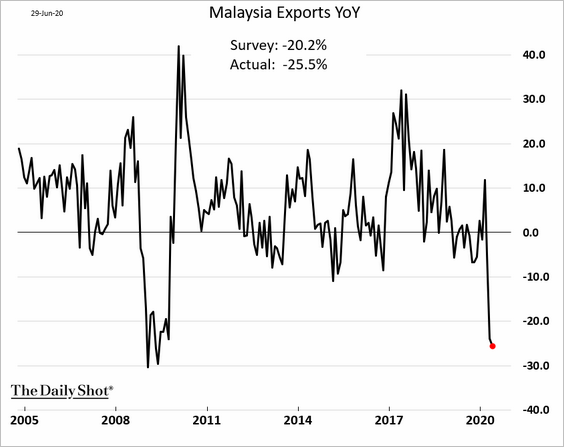
7. EM Asia exports were weak in May.
• Thailand:
• Malaysia:
——————–
8. June manufacturing activity improved across EM Asia.
• Countries where manufacturing has stabilized or growing:
– Malaysia:
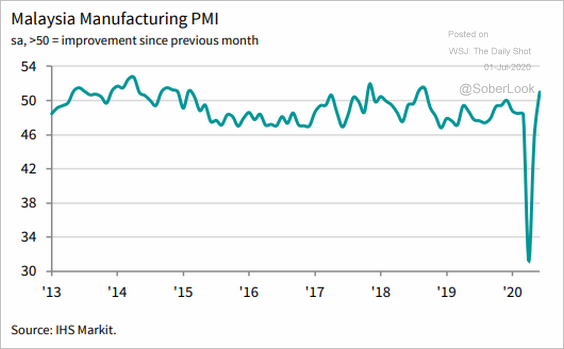 Source: @IHSMarkitPMI Read full article
– The Philippines:
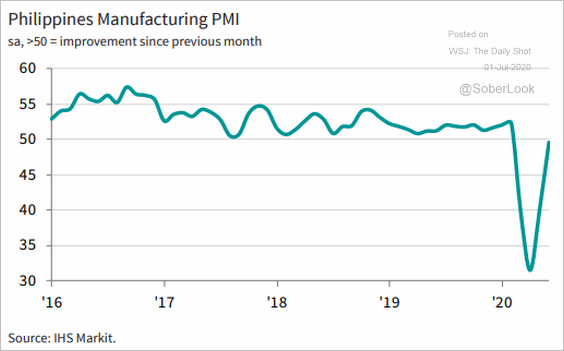 Source: @IHSMarkitPMI Read full article
– Vietnam:
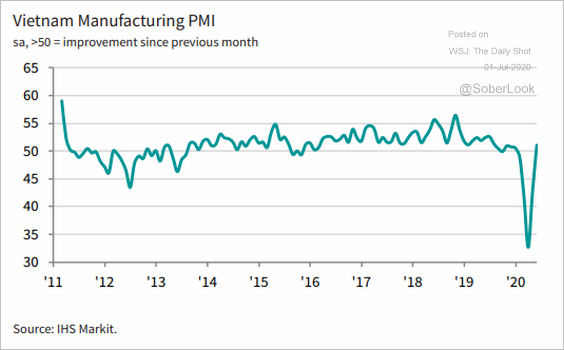 Source: @IHSMarkitPMI Read full article
• Countries where factories continue to struggle:
– Indonesia:
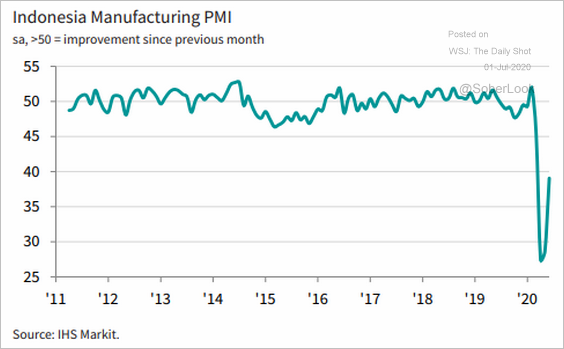 Source: @IHSMarkitPMI Read full article
– Thailand:
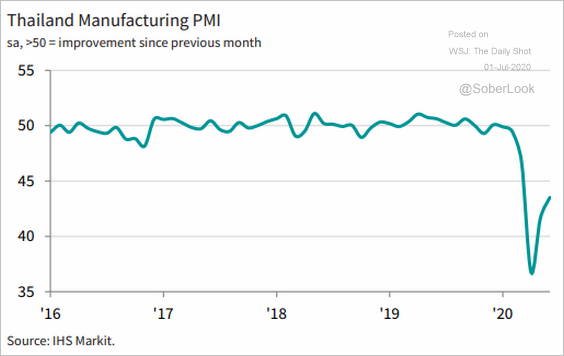 Source: @IHSMarkitPMI Read full article
——————–
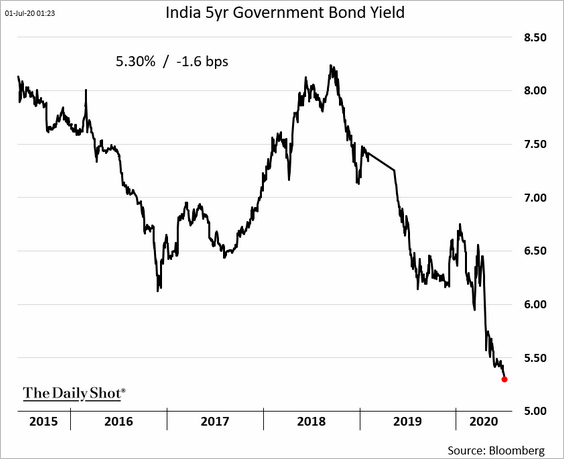
9. India’s bonds rallied in response to fresh central bank action.
 Source: @markets Read full article
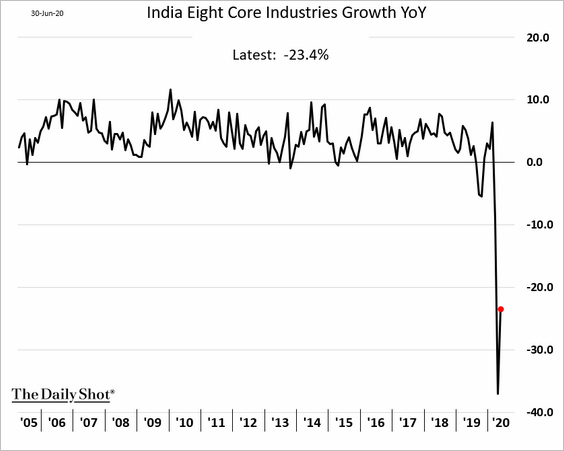
The output of India’s key industries bounced from the lows in May but remains depressed.
——————–
10. Zimbabwe’s hyperinflation is back.
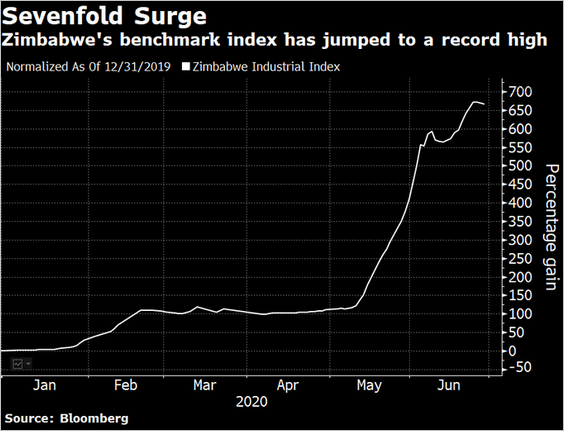 Source: @PaulWallace123, @ray_ndlovu, @markets Read full article
Commodities
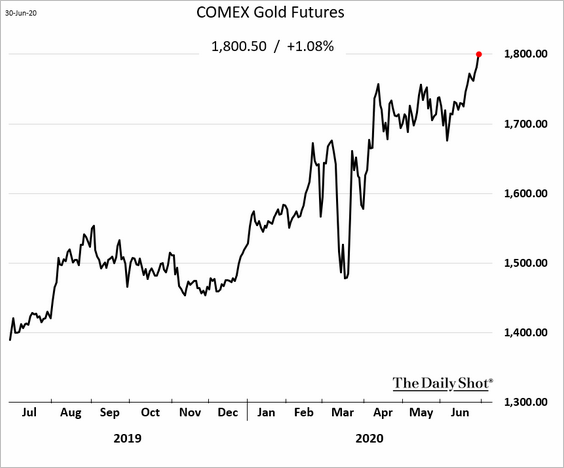
1. Gold futures broke $1,800.
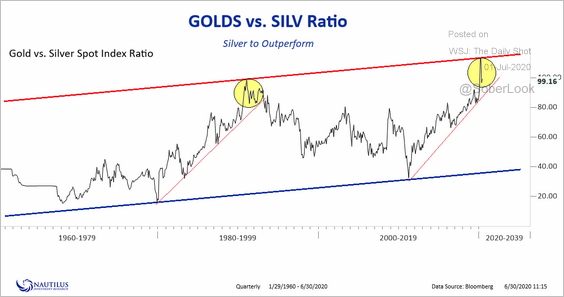
2. Will silver outperform gold?
 Source: @NautilusCap, {ht} @DiMartinoBooth
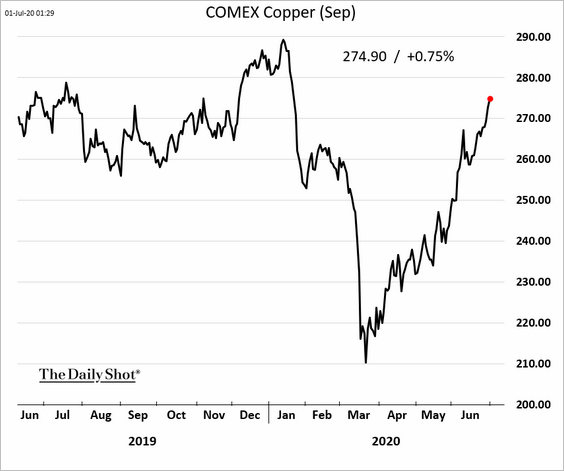
3. Copper continues to rally.
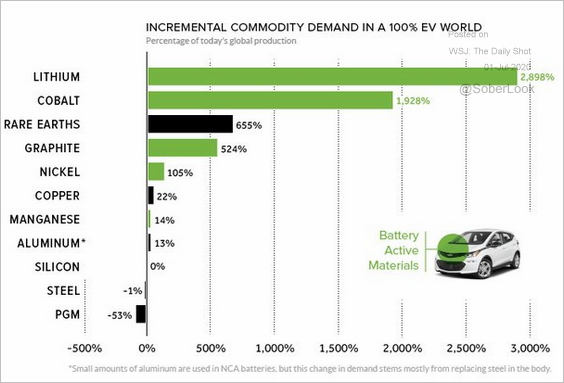
4. Many commodities are benefitting from the rise in electric vehicles.
 Source: @VisualCap Read full article
5. US corn acreage is down sharply.
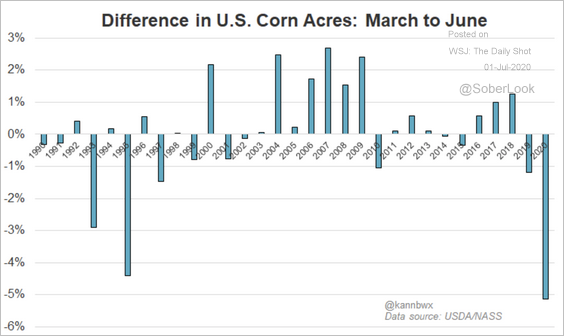 Source: @kannbwx
Energy
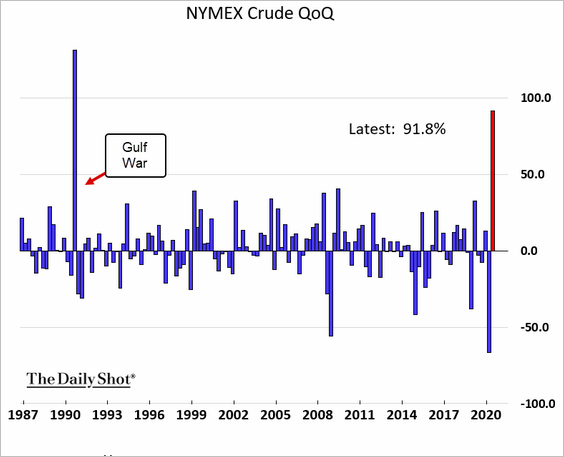
1. Q2 was a good quarter for crude oil.
2. US energy CapEx is rebounding, according to Morgan Stanley.
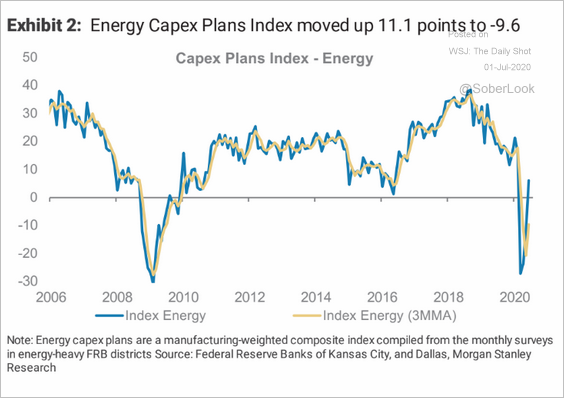 Source: Morgan Stanley Research
3. This map shows gasoline prices by state.
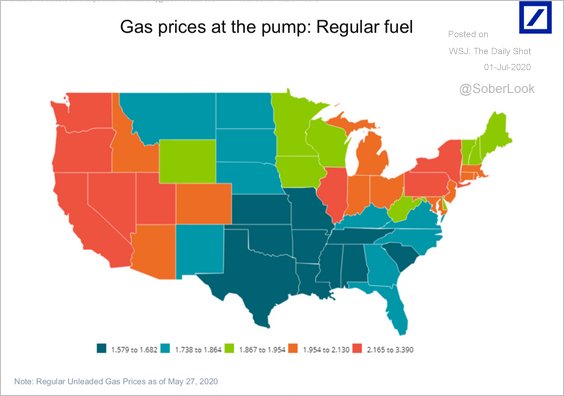 Source: Deutsche Bank Research
Equities
1. The market seems to be following the 2009 pattern.
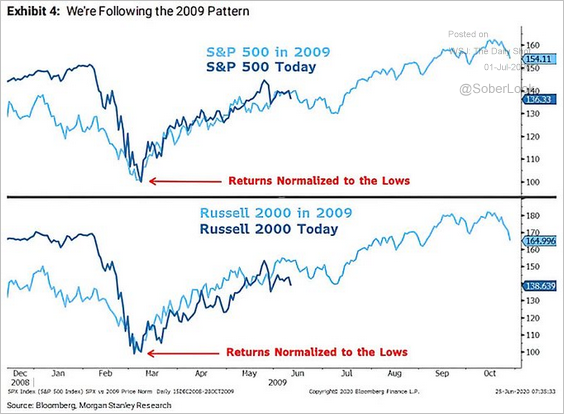 Source: @ISABELNET_SA, @MorganStanley
2. This is the largest gap between the top and bottom S&P 500 valuation quintiles since the dot-com bubble.
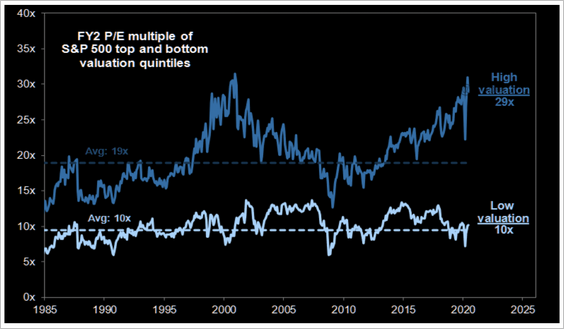 Source: Goldman Sachs, @themarketear
3. The Nasdaq 100 put/call ratio is deep in risk-on territory.
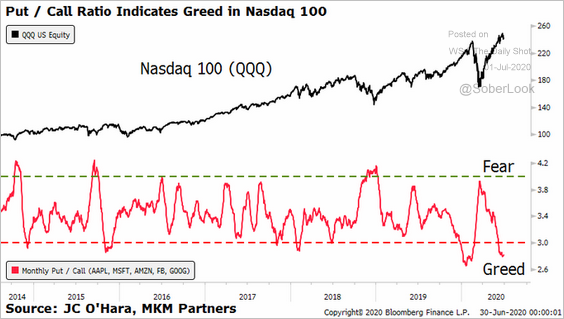 Source: @MacroCharts, @JC_OHara_
4. The gap between the S&P 500 and consumer confidence remains wide.
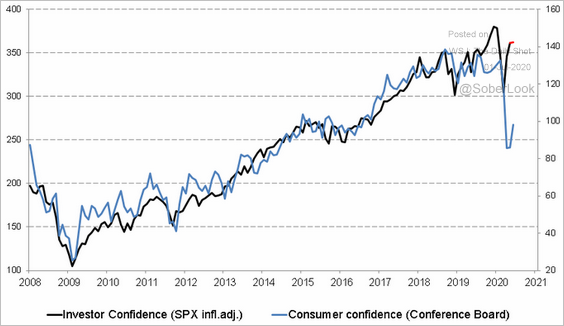 Source: @takis2910
5. This chart shows the return attribution over different time horizons.
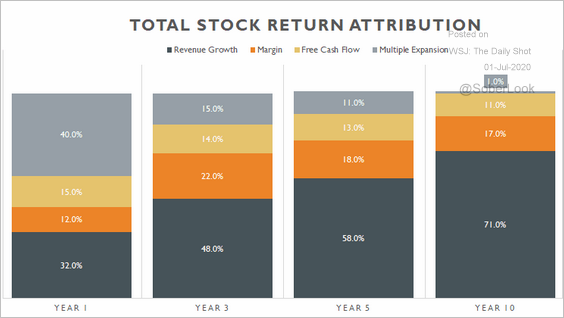 Source: @CrowdedTradeCap
6. Earnings estimates seem to have leveled off.
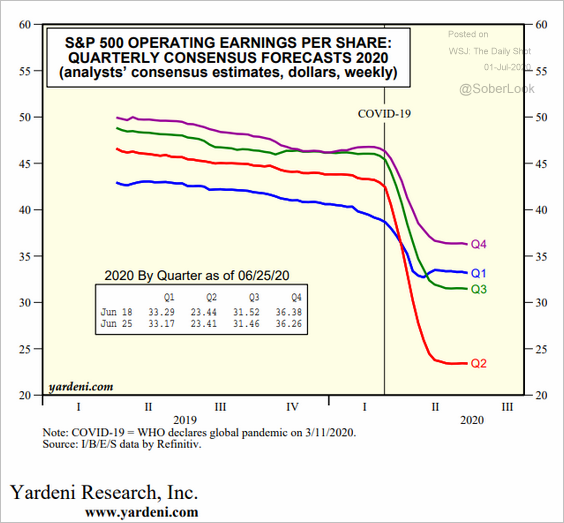 Source: Yardeni Research
7. Small-cap growth stocks have lagged their larger counterparts (dotted line), and have performed more in line with large/mid-cap value stocks (relative to the S&P 500).
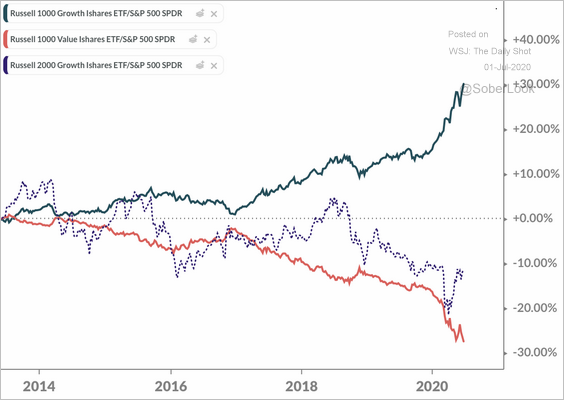 Source: @DantesOutlook
8. The largest healthcare ETF saw substantial outflows in June.
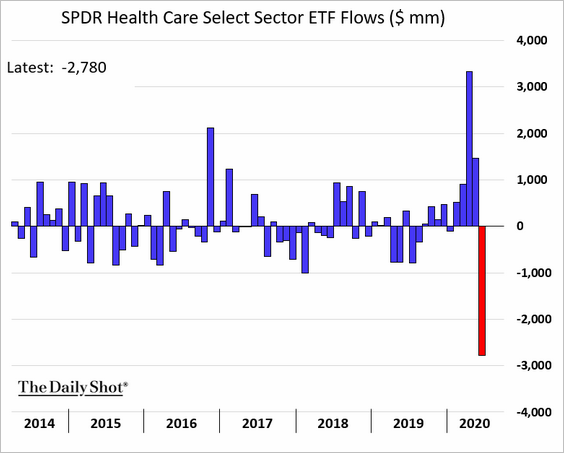 h/t Nick Chang. Bloomberg Editorial
9. Equity capital market activity spiked last month, and the market easily absorbed all the new issuance.
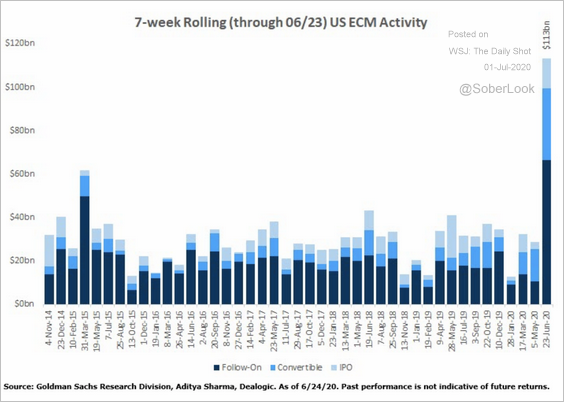 Source: Goldman Sachs
10. The chart below shows the 10-year rolling returns in the S&P 500 (since 1880).
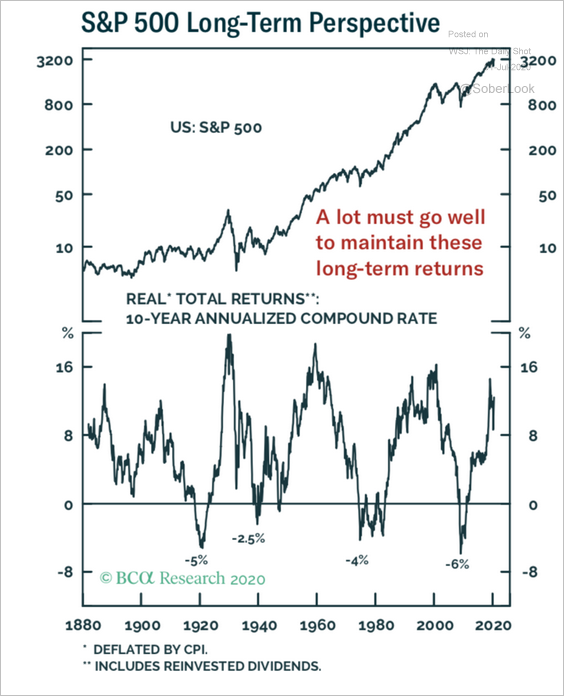 Source: BCA Research
Credit
1. The SPDR high-yield bond ETF (JNK) saw a massive outflow this week.
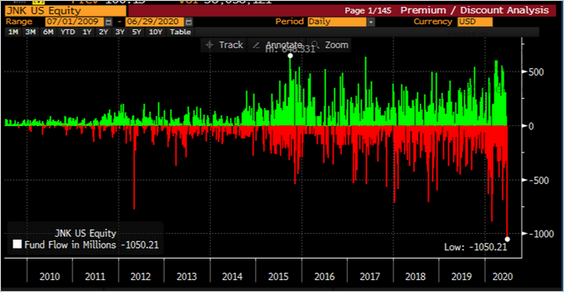 Source: @lisaabramowicz1
2. CLO volume is recovering.
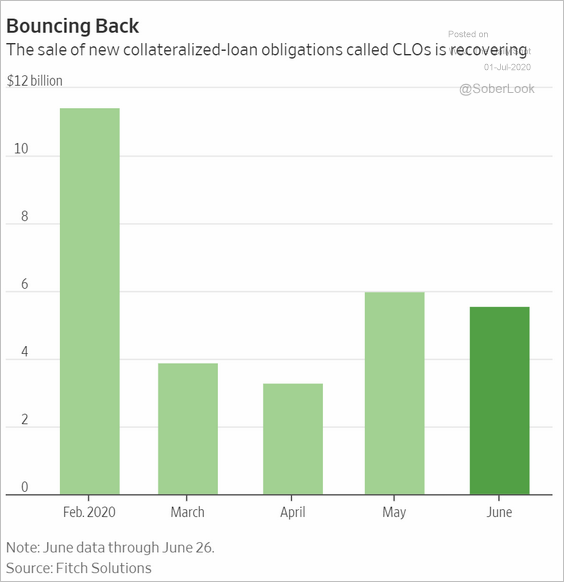 Source: @WSJ Read full article
3. Here is how leveraged loan ownership has changed since the 1990s (with CLOs now the dominant player).
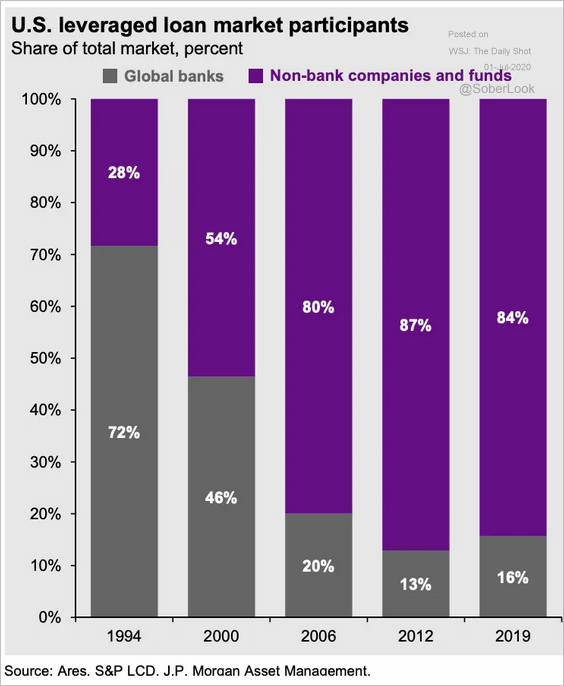 Source: Snippet.Finance
4. This chart shows US corporate bond returns by rating
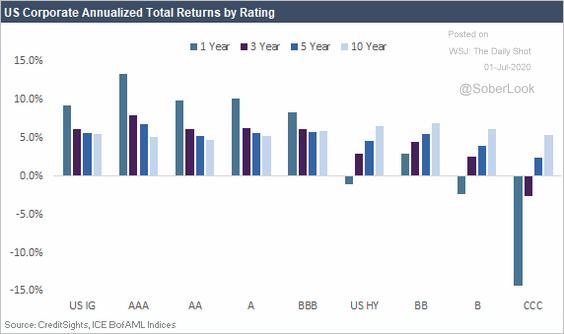 Source: CreditSights
Global Developments
1. Will the increased stringency in COVID response boost the US dollar?
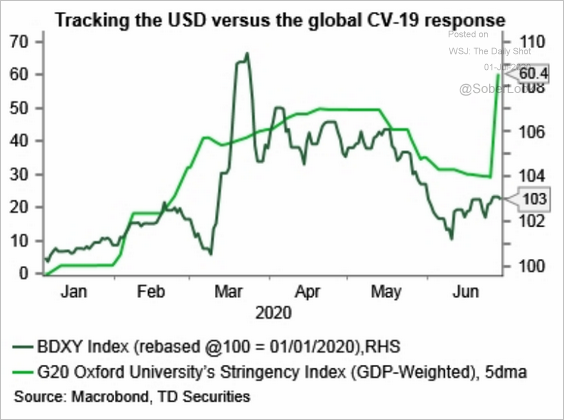 Source: TD Securities
2. How much will the debt-to-GDP ratios climb in advanced economies?
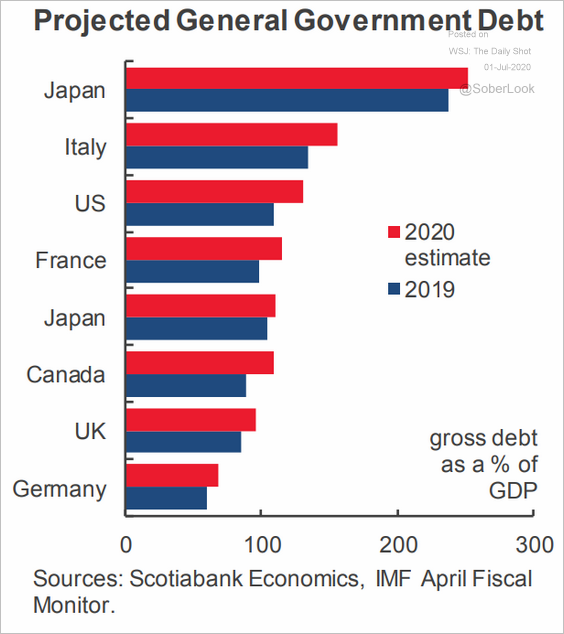 Source: Scotiabank Economics
3. This chart shows export growth for select countries.
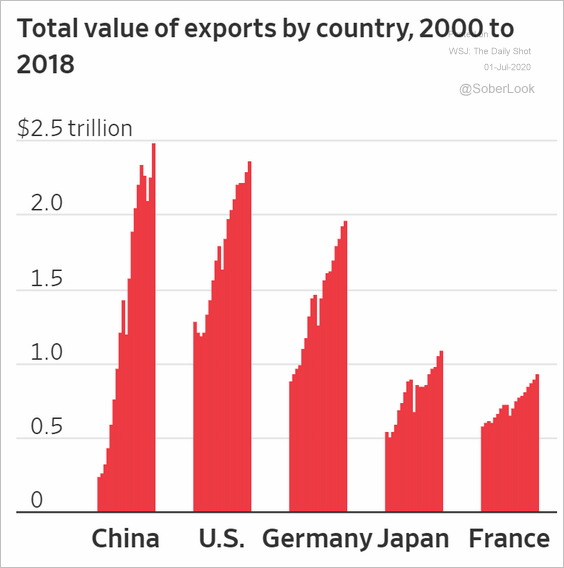 Source: @WSJ Read full article
But trade volumes tumbled this year.
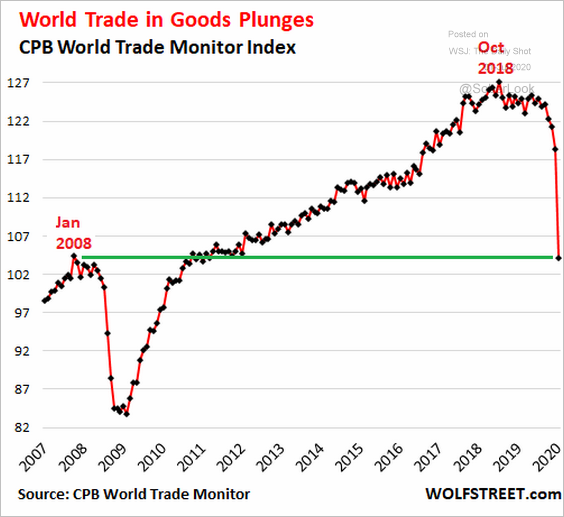 Source: Wolf Street Read full article
Globalization has peaked.
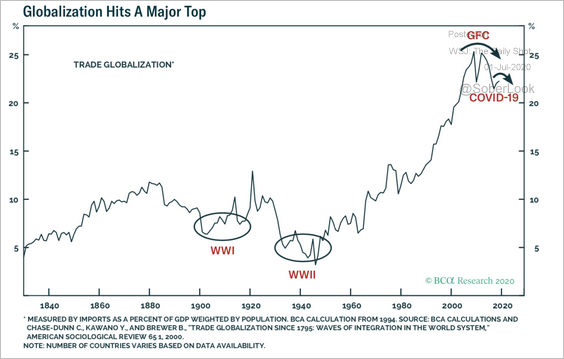 Source: BCA Research
——————–
Food for Thought
1. 5-G growth projections downgraded:
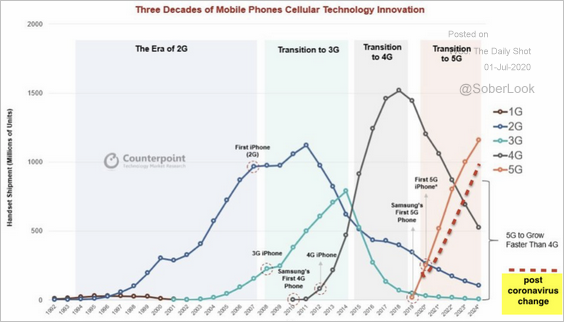 Source: @dhinchcliffe
2. Sectors targeted by ransomware attacks:
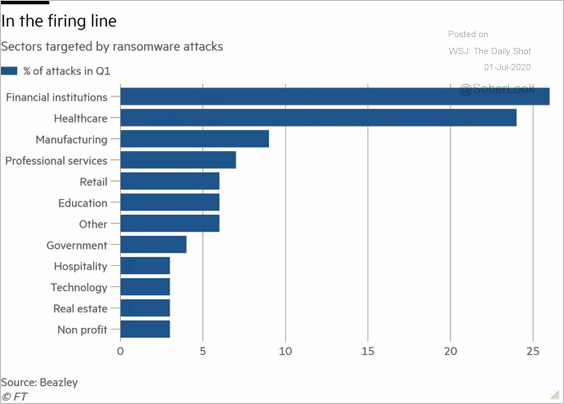 Source: @financialtimes Read full article
3. Cable-news ratings:
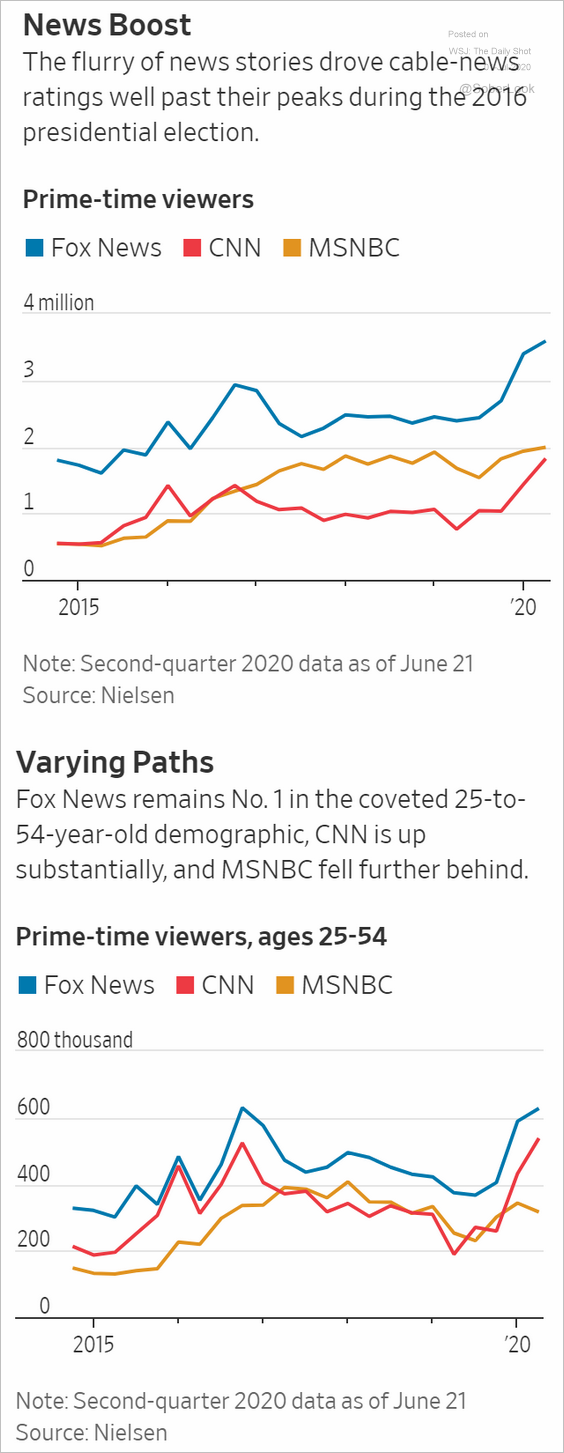 Source: @WSJ Read full article
4. Slower reopening in some states:
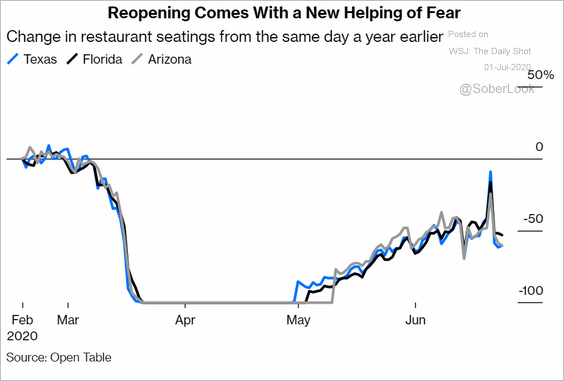 Source: @Noahpinion, @bopinion Read full article
5. Voter registrations:
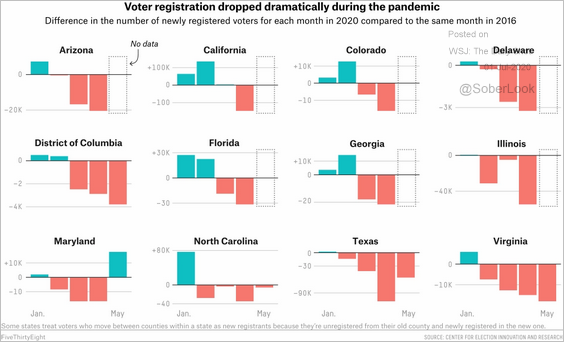 Source: FiveThirtyEight Read full article
6. Health practices (by political affiliation):
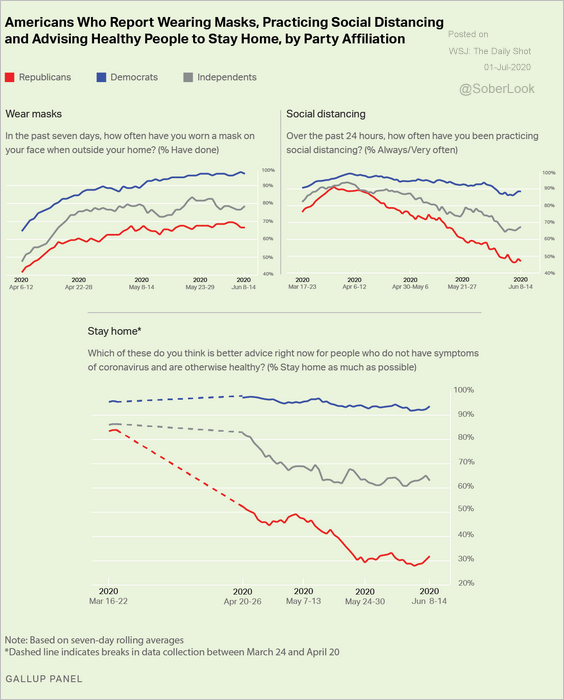 Source: Gallup Read full article
7. Incarceration rates (2 charts):
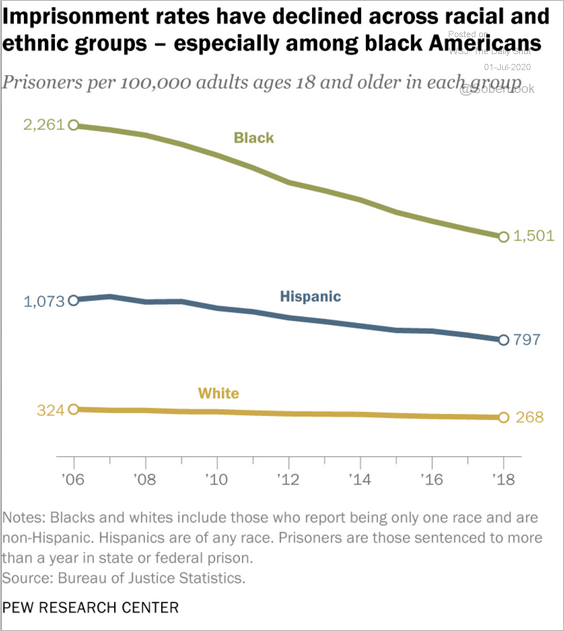 Source: Pew Research Center Read full article
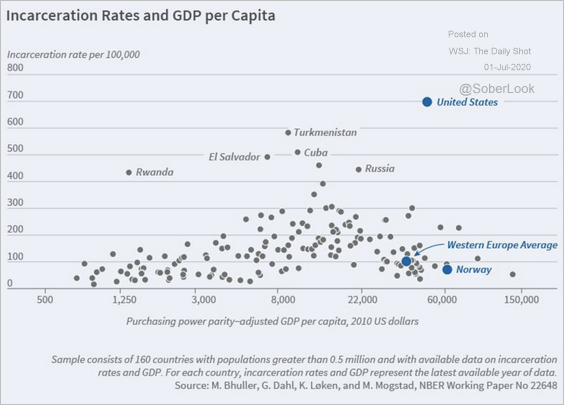 Source: @mattyglesias
——————–
8. US obesity trends:
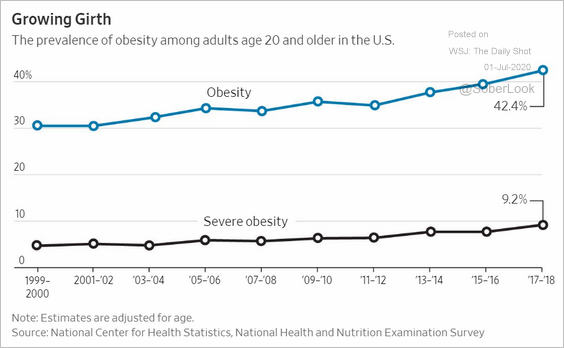 Source: @WSJ Read full article
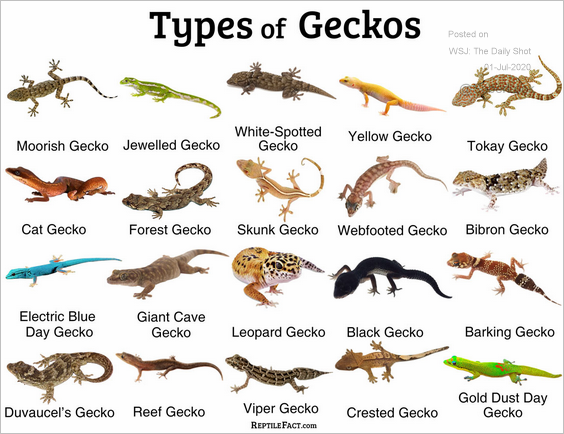
9. Types of geckos:
 Source: Reptile Fact Read full article
——————–