
The Daily Shot: 06-Jul-20
• China
• Asia – Pacific
• The Eurozone
• The United Kingdom
• The United States
• Emerging Markets
• Cryptocurrency
• Commodities
• Energy
• Equities
• Credit
• Rates
• Food for Thought
China
1. The government-backed China Securities Journal emphasized on Monday the need for a “healthy” bull market to support the recovery. Beijing’s proxies have been hitting social media in droves, echoing the phrase “bull market.” The stock market is up 10% over the past week.

While other Asian markets are also up today, China’s stocks outperformed.
 Source: @markets Read full article
Shares of brokerage firms have gone vertical.
 Source: @markets Read full article

——————–
2. China’s bond yields continue to climb.

3. According to Markit, the nation’s service-sector activity is expanding at the fastest pace in a decade.

4. Hong Kong’s business activity is stabilizing for the first time since early 2018.

Asia – Pacific
1. Singapore’s retail sales collapsed this year (through May).

As of June, the contraction in Singapore’s business activity has been moderating.

——————–
2. South Korea’s stock market has been performing well lately, boosted by retail accounts.
 Source: @WSJ Read full article
3. The COVID-19 Special Program balances now total 20 trillion yen, which remains well short of the 90 trillion yen set by the BoJ (excluding purchases of commercial paper and corporate bonds), according to Morgan Stanley.
 Source: Morgan Stanley Research
4. Next, we have some updates on Australia.
• Retail sales rebounded in May.

• After a massive decline in May, job advertisements were up 42% in June.

• Construction activity is a long way from stabilizing.

The Eurozone
1. Increases in Spain’s unemployment have slowed, but we are yet to see a post-crisis decline.

2. Supported by short-time work schemes, the euro-area labor market registered only modest increases in unemployment since the start of the crisis.
 Source: @WSJ Read full article
3. Italy’s service sector is approaching stabilization.

And Spain is in growth mode.

——————–
4. Producer price declines have accelerated.

The United Kingdom
1. Consumer confidence bounced from extreme lows.

2. Recovery indicators continue to improve gradually.
 Source: The Economist Read full article
3. Corporate cash holdings surged this year.
 Source: Pantheon Macroeconomics
But smaller firms fear running out of cash soon.
 Source: Pantheon Macroeconomics
——————–
4. Below are a couple of charts on trade with the EU vs. non-EU countries.
 Source: ANZ Research
The United States
1. Let’s begin with the June employment report, which topped economists’ forecasts by a substantial margin.

Here is the breakdown by industry.
– Since February:
 Source: @bopinion Read full article
– June employment gains:
 Source: Oxford Economics
– Best performing sectors:
 Source: @bopinion Read full article
——————–
• The labor market rebound continues.
 Source: @WSJ Read full article
This chart shows where we are relative to previous recessions.
 Source: @RyanDetrick
• According to Oxford Economics, we’ve now entered a slower phase of the labor market recovery.
 Source: Oxford Economics
• The unemployment rate declined again.
 Source: @WSJ Read full article
Underemployment is still above the 2009 high.

This chart shows part-time employment for “economic reasons.”

• The participation rate is improving.

Here is the prime-age labor force participation rate.

• Below are a few additional charts from the jobs report.
– Reasons for unemployment:
 Source: @WSJ Read full article
– Temp help services:

– High-contact employment (more workers at risk):
 Source: @WSJ Read full article
– Unemployment by race/ethnicity:
 Source: @WSJ Read full article
Separately, initial jobless claims remain stubbornly high.

——————–
2. Business applications continue to climb.


——————–
3. Factory orders increased in May.

Separately, this chart shows the long-term divergence between the nation’s manufacturing output and factory jobs.
 Source: @adam_tooze, @MESandbu Read full article
——————–
4. Housing inventories continue to shrink, …

… while mortgage rates hit a new low.

——————–
5. The recovery in economic activity seems to have stalled over the past couple of weeks.
 Source: @WSJ Read full article
 Source: @WSJ Read full article
Emerging Markets
1. After a bounce from extreme lows, vehicle sales in Latin America remain weak.
• Brazil:

• Mexico:

• Chile:

——————–
2. There was little progress in Brazil’s industrial production recovery in May.

Service-sector remained deep in contraction territory in June.

——————–
3. Colombia’s core CPI rate hit the lowest level since 2009.

4. South Africa’s economic activity showed some improvement.
• Electricity production:

• Whole-economy PMI:
 Source: ANZ Research
——————–
5. Thailand’s core CPI dipped into negative territory for the first time since the financial crisis.

6. Turkey’s core inflation is accelerating.

Cryptocurrency
1. Bitcoin has been holding support at $9k recently.

Over the long term, there is a downtrend resistance.

——————–
2. It’s been a relatively quiet year for Bitcoin (other than the first two weeks of March).
 Source: @ceterispar1bus
Here’s Bitcoin’s daily trading range going back to 2015.
 Source: @ceterispar1bus
——————–
3. Almost all mining fees are paid to Bitcoin and Ethereum miners, according to Messari.
 Source: Messari Read full article
Commodities
1. Gold demand from ETFs topped consumer (jewelry) demand from China and India.
 Source: @business Read full article
Gold continues to track real rates.
 Source: @Schuldensuehner
——————–
2. Stifel expects commodity super-cycle peak by the year 2045 when currency debasement and inflation may be at its highest.
 Source: Stifel
Following past cycles, commodities could begin turning higher as early as next year.
 Source: Stifel
——————–
3. Shipping prices for large-sized bulk carriers continue to climb. Demand tends to be seasonal, but the latest gains have been impressive nonetheless.

4. US soy exports to China have been weak, …

… but Beijing is starting to boost its purchases, sending prices sharply higher.

Energy
1. Longview Economics expects oil supply deficits to continue throughout 2020 and into 2021.
 Source: Longview Economics
Fitch expects oil markets to be undersupplied, which will support higher prices and increased investments across the board.
 Source: Fitch Solutions Macro Research
——————–
2. European refinery margins remain exceptionally weak.
 Source: @markets Read full article
3. US retail gasoline margins soared this year.
 Source: @WSJ Read full article
4. This scatterplot shows the evolution of electricity consumption as the per-capita GDP increases.
 Source: EIA Read full article
Equities
1. It’s risk-on as Bejing pushes out its “bull market” message (see the China section). US futures are up.

2. Fewer firms have been giving quarterly guidance this year.
 Source: @andrewrsorkin, @dealbook
3. E*Trade customers rotated into real estate, utilities, and industrials in June.
 Source: E*TRADE Financial Corporation
4. Here is a comparison of sector weights between the S&P 500 and the Dow Jones.
 Source: @WSJ Read full article
5. This chart shows ETF fee trends.
 Source: @financialtimes Read full article
6. Which firms (globally) prospered during the current crisis?
 Source: @financialtimes Read full article
Credit
1. Let’s begin with some data on corporate defaults.
 Source: Fitch Ratings
 Source: @markets Read full article
——————–
2. US bank allowances for loan losses remain well below the 2010 peak.
 Source: Yardeni Research
3. Commercial real estate delinquency rates have spiked this year.
 Source: @adam_tooze, The Economist Read full article
Industrial real estate appears to be the only sector in the early stages of a recovery, according to a survey of industry professionals.
 Source: RCLCO
——————–
4. Corporate pensions remain massively underfunded.
 Source: @trevornoren, @FT Read full article
5. Next, we have some updates on the muni market.
• State and local governments’ budget shortfalls:
 Source: Oxford Economics
• Demand for insured municipal bonds:
 Source: @markets Read full article
• The BBB muni spread to higher-rated debt:
 Source: Liberty Street Economics Read full article
Rates
1. The Treasury curve has been steepening.

2. This chart shows the decomposition of the two-decade-long decline in Treasury yields.
 Source: Oxford Economics
3. Global rate declines allowed massive increases in debt.
 Source: @ISABELNET_SA, @jpmorgan
——————–
Food for Thought
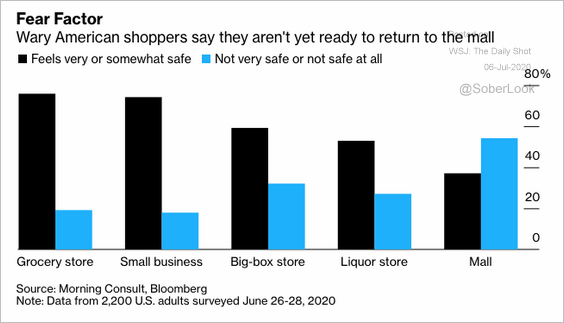
1. Returning to the mall:
 Source: @business Read full article
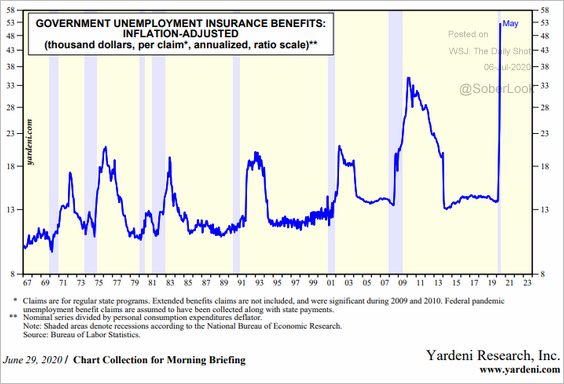
2. US unemployment payments:
 Source: Yardeni Research
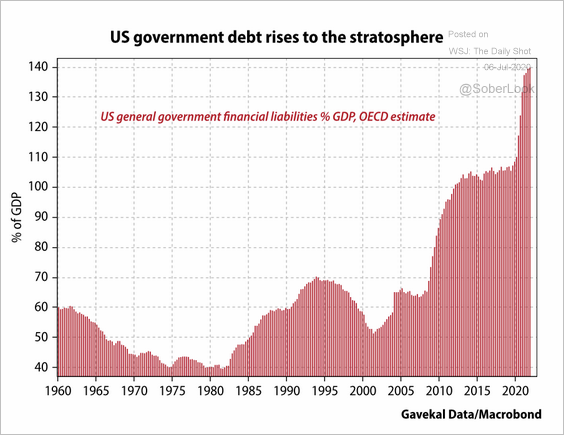
3. The US government debt relative to the size of the economy:
 Source: Gavekal
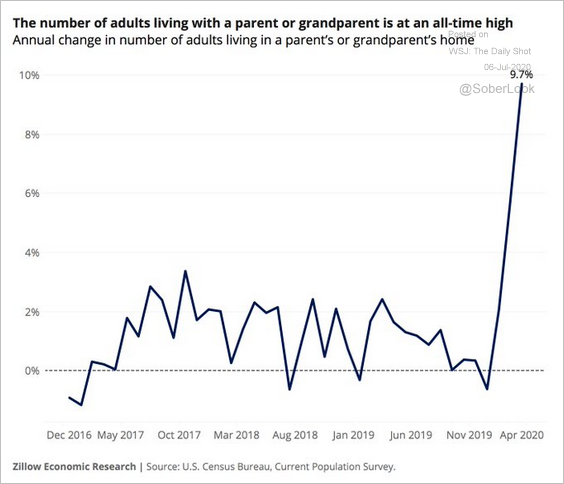
4. Living with parents or grandparents:
 Source: @crampell Read full article
5. World conflicts after major crises:
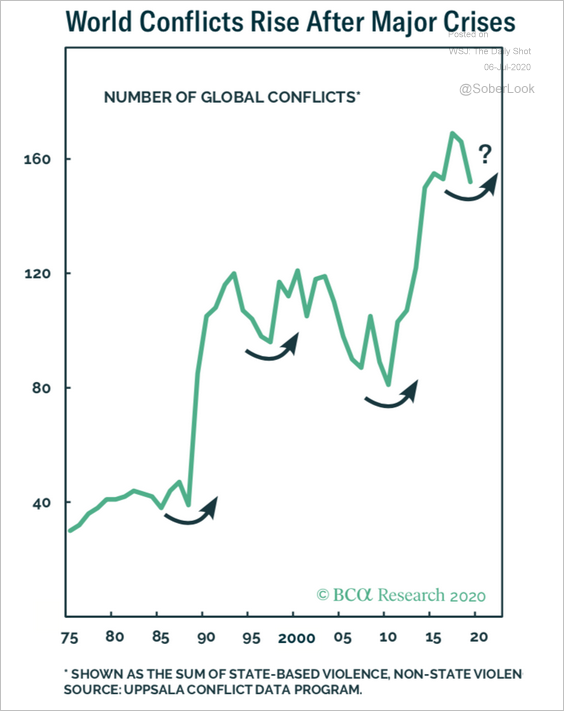 Source: BCA Research
6. Coronavirus hot spots over time:
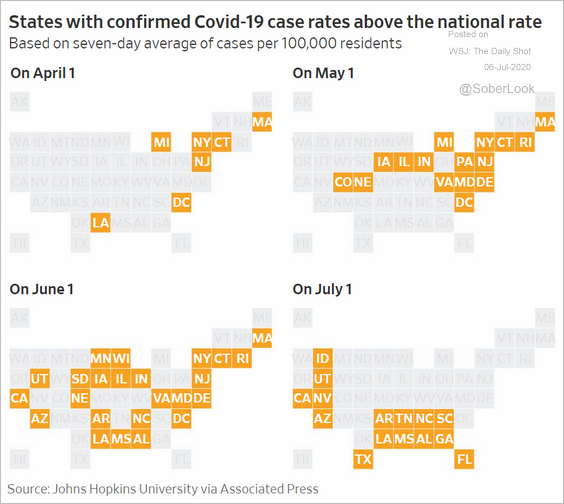 Source: @WSJ Read full article
7. Firearm background checks:
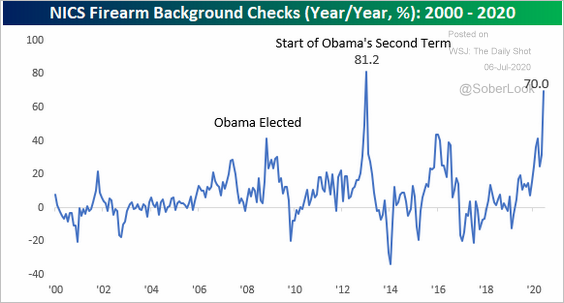 Source: @bespokeinvest Read full article
8. Views on face masks:
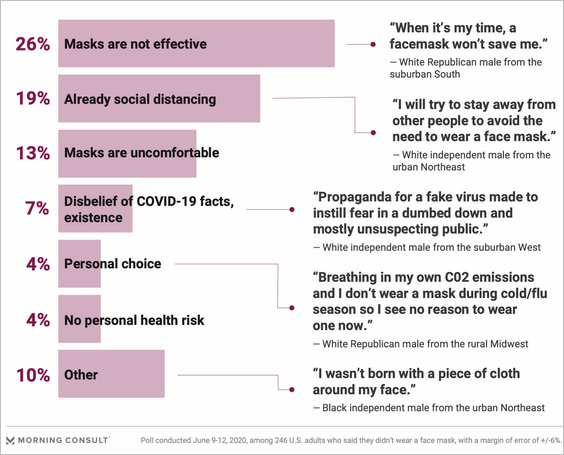 Source: Morning Consult Read full article
9. Slave societies in the Americas:
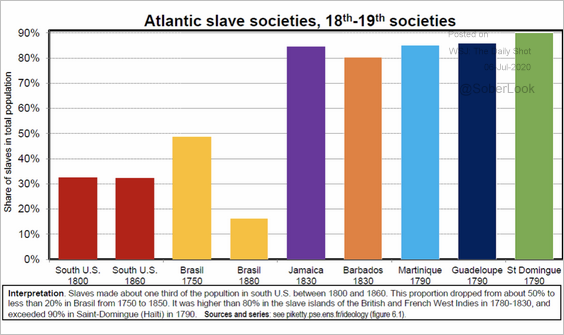 Source: @PikettyLeMonde Read full article
——————–