
The Daily Shot: 07-Jul-20
• The United States
• The Eurozone
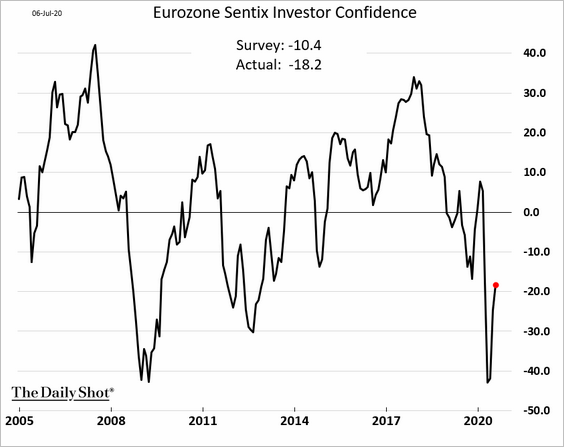
• Japan
• Asia – Pacific
• China
• Emerging Markets
• Commodities
• Equities
• Credit
• Rates
• Global Developments
• Food for Thought
The United States
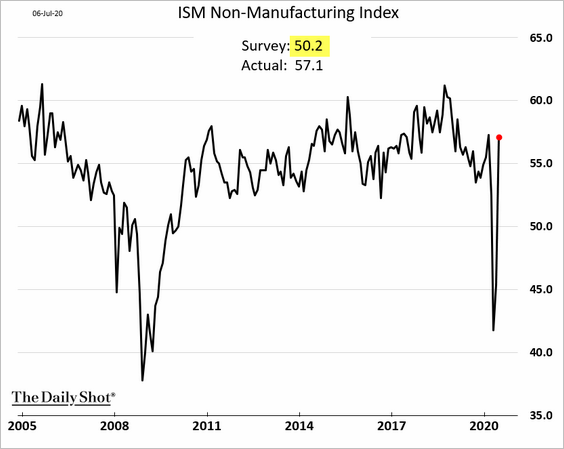
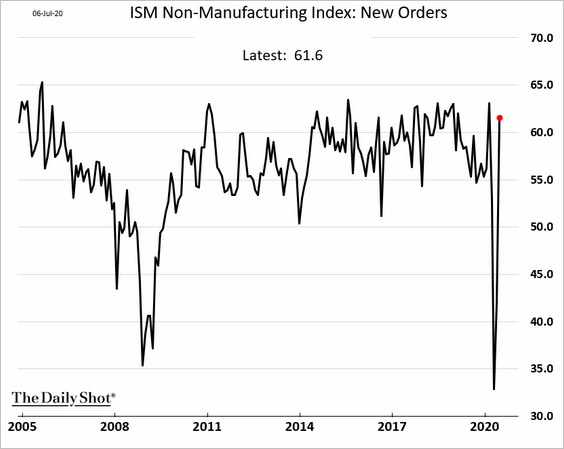
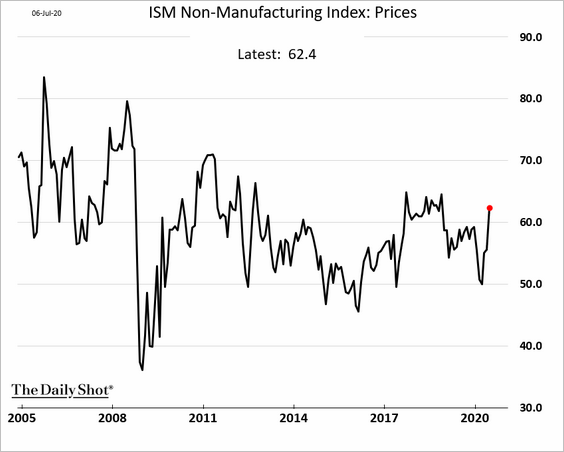
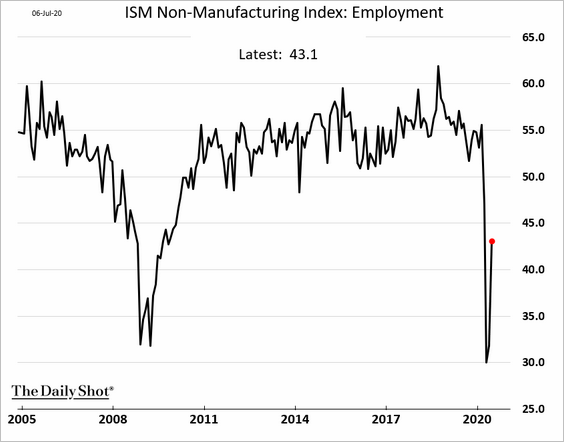
1. The ISM non-manufacturing report showed business activity returning to growth last month (PMI > 50). The headline index topped economists’ forecasts.
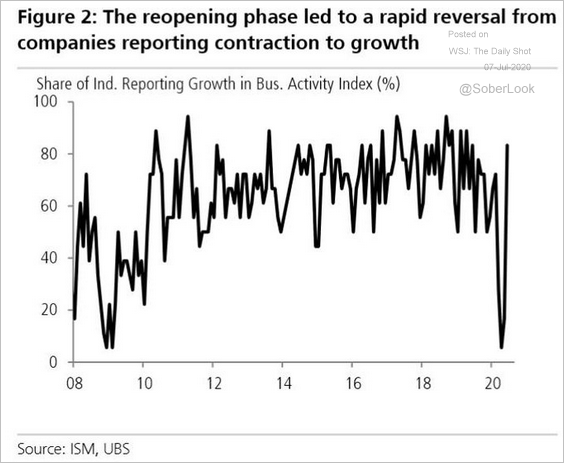
• 80% of industries reported growth.
 Source: UBS, @jsblokland
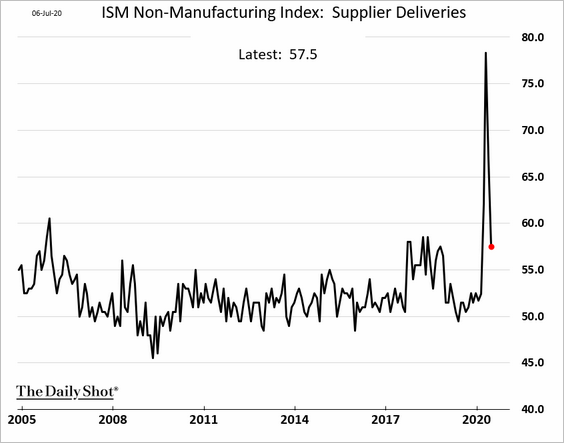
• Lockdown-related supplier bottlenecks have eased.
• Prices are rising again.
• Employment remains in contraction mode.
——————–
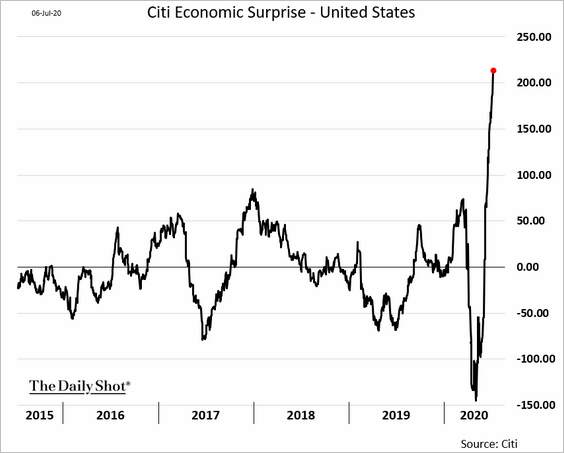
2. Forecasters have been surprised by the speed of the US economic rebound. Here is the Citi Economic Surprise Index (includes the ISM non-manufacturing report). However, the recovery has been losing momentum over the past couple of weeks.
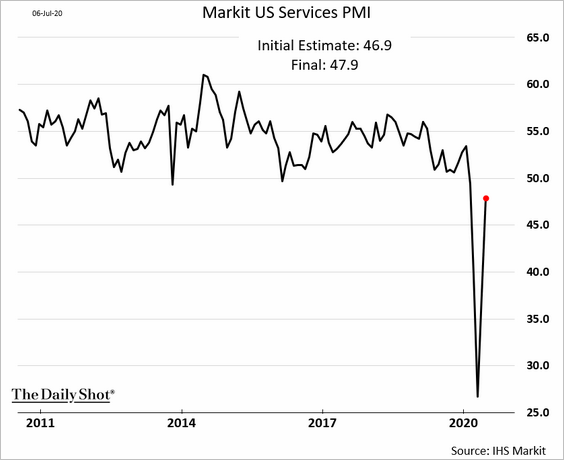
3. The updated Markit US Services PMI didn’t show the same level of strength as the ISM index, but it points to business activity stabilizing.
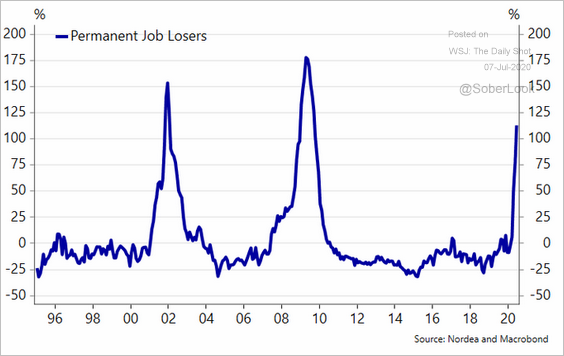
4. Next, we have some updates on the labor market.
• Permanent job losses are still climbing.
 Source: @meremortenlund
• The sharp decline in capacity utilization could trigger further reductions in wage growth.
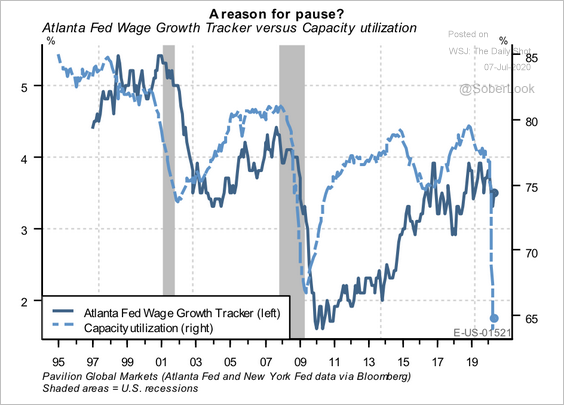 Source: Pavilion Global Markets
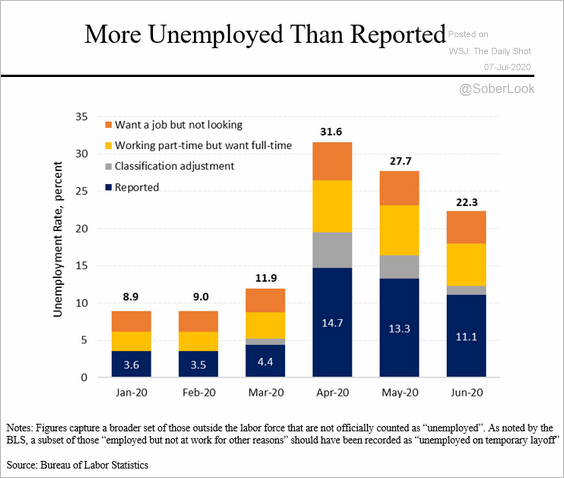
• Official unemployment figures do not capture the full extent of the labor market weakness.
 Source: @SteveRattner
• The recovery in small business employment has stalled.
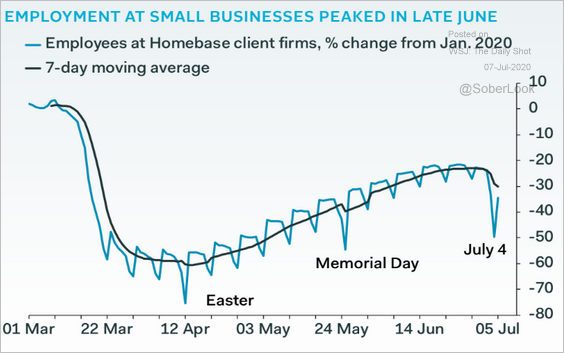 Source: Pantheon Macroeconomics
• The labor market will take years to recover from the pandemic shock.
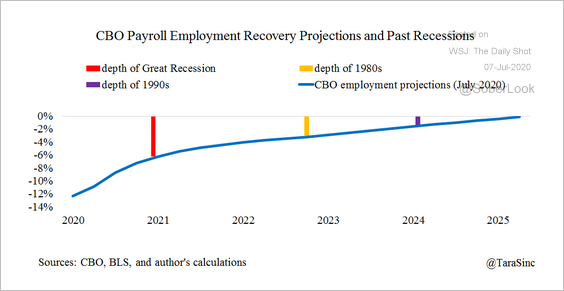 Source: @TaraSinc
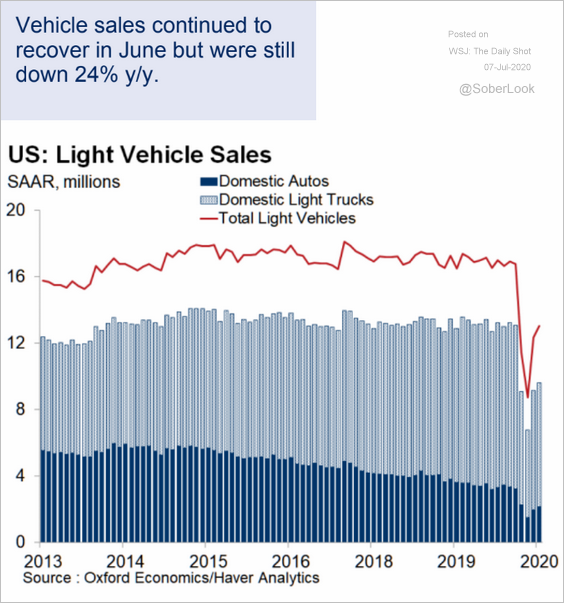
5. Vehicle sales continue to improve.
 Source: Oxford Economics
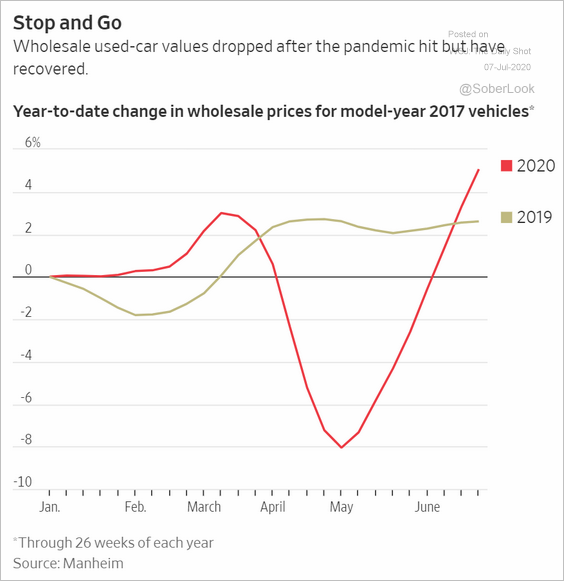
• Wholesale prices for used cars rebounded sharply.
 Source: @WSJ Read full article
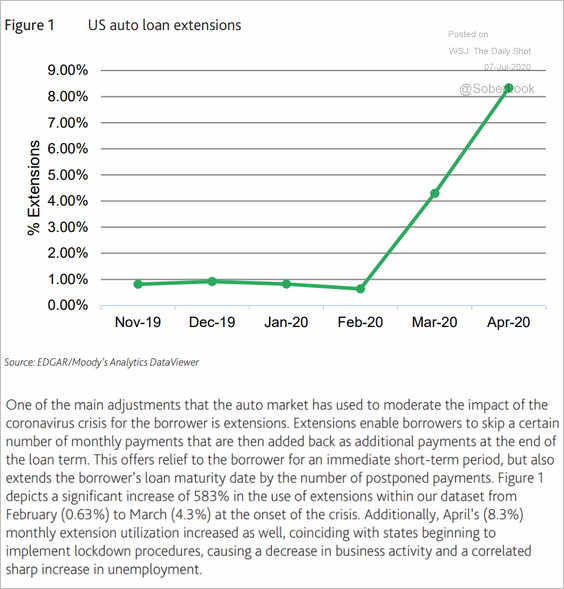
• Many buyers who financed their automobiles had their loans extended, allowing them to defer some payments.
 Source: Moody’s Analytics
——————–
6. The airline industry continues to struggle.
• Ticket purchases relative to last year:
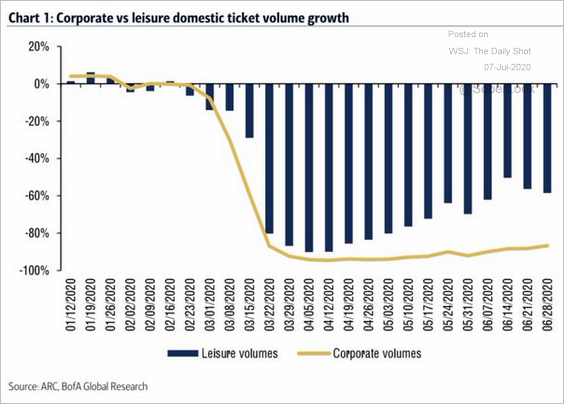 Source: BofA Merrill Lynch Global Research, @WallStJesus
• Airline website visits:
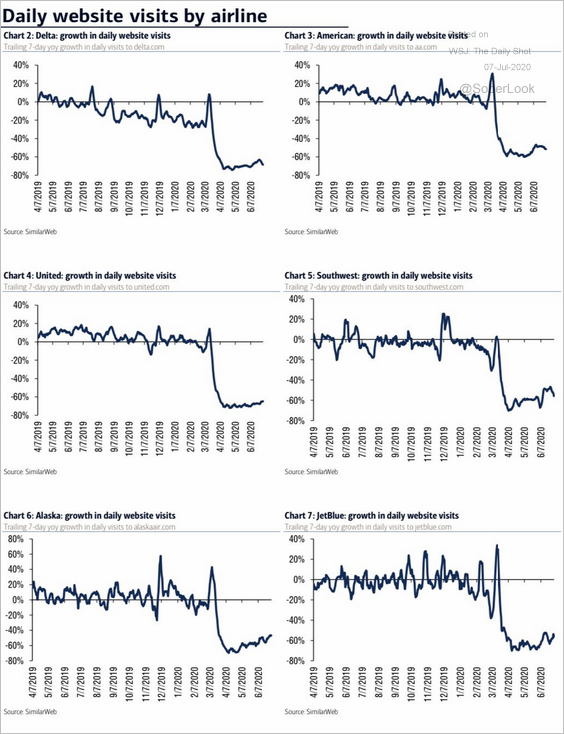 Source: BofA Merrill Lynch Global Research, @WallStJesus
——————–
7. Many small businesses remain concerned about customers being afraid to return.
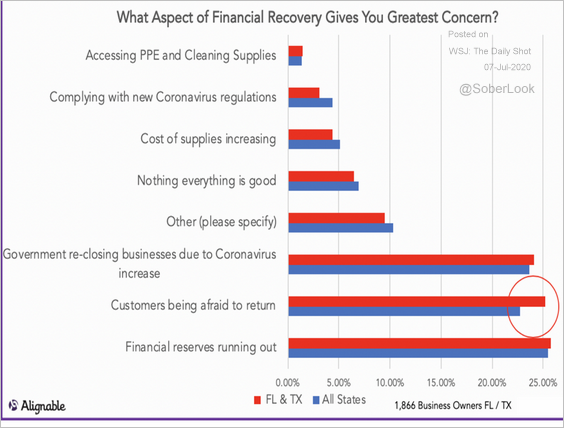 Source: Alignable Read full article
Consumers’ comfort level with some activities has weakened over the past couple of weeks.
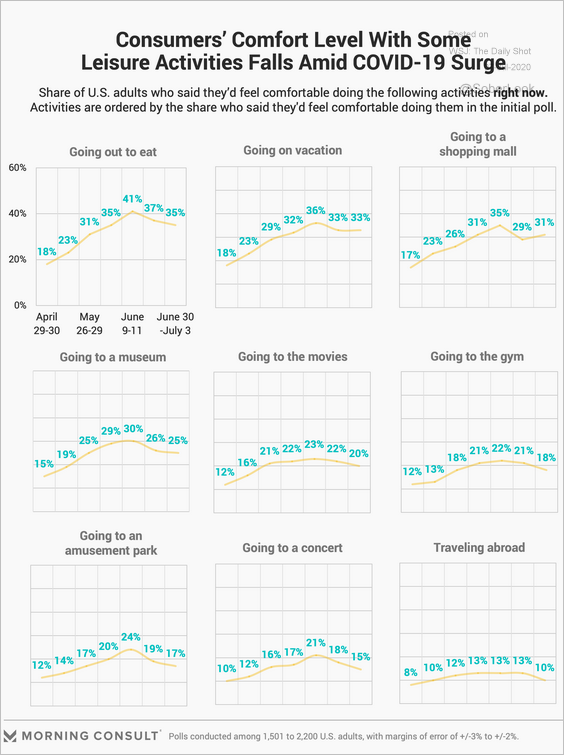 Source: Morning Consult Read full article
——————–
8. How long do key economic indicators typically take to recover since the start of the recession?
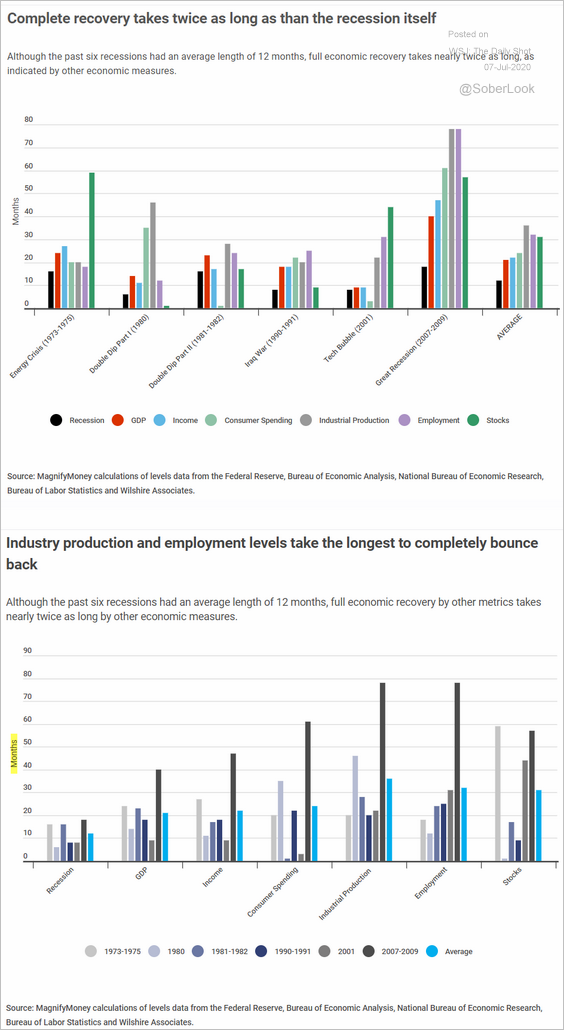 Source: MagnifyMoney
The Eurozone
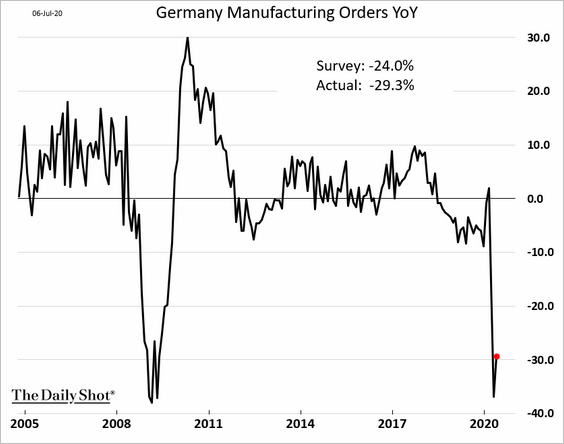
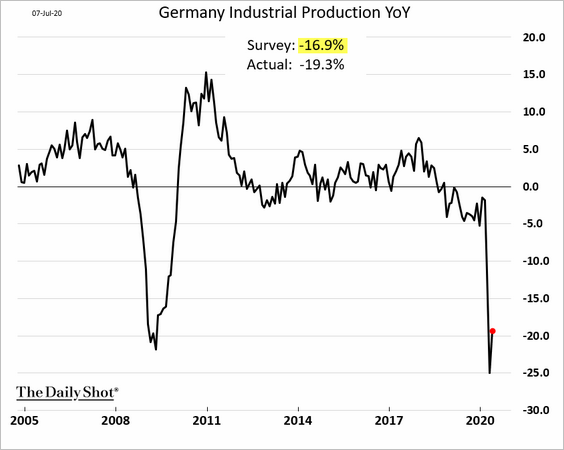
1. Germany’s industry performed poorly in May, with the data surprising to the downside.
• Factory orders (year-over-year):
• Industrial production:
——————–
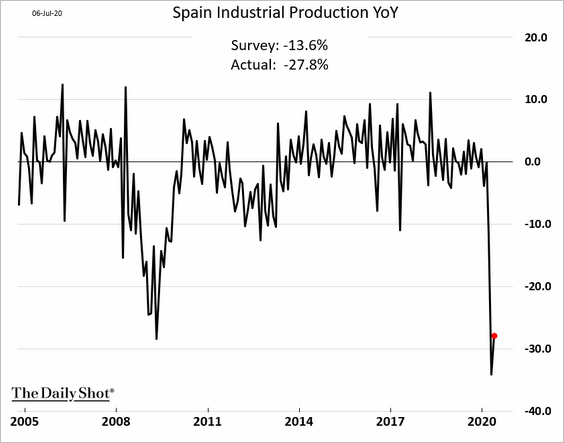
2. Spain’s industrial production was also extremely weak in May.
3. Investor confidence remains soft.
4. Euro-area construction activity stabilized in June.
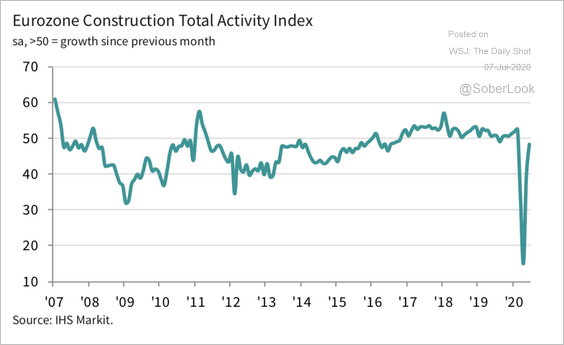 Source: IHS Markit Read full article
5. Markit’s index of productivity is still quite weak.
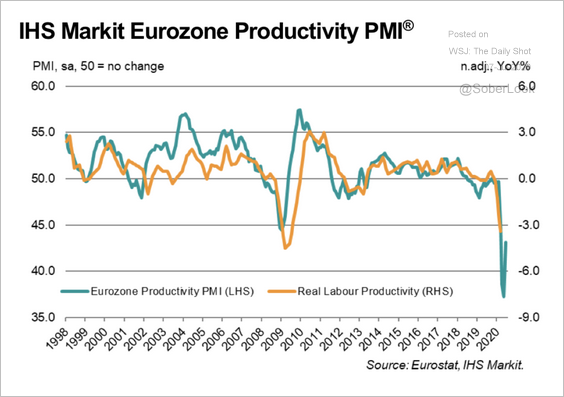 Source: IHS Markit Read full article
6. Retail sales rebounded in May.
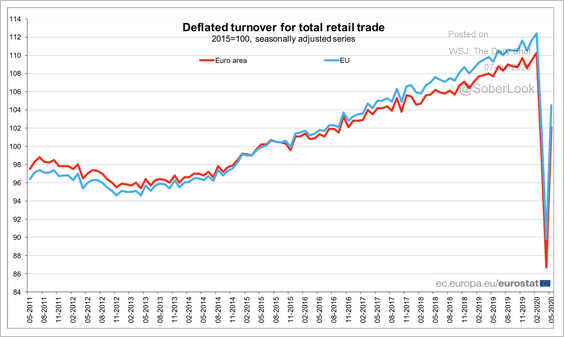 Source: Eurostat Read full article
Internet sales strengthened during the crisis.
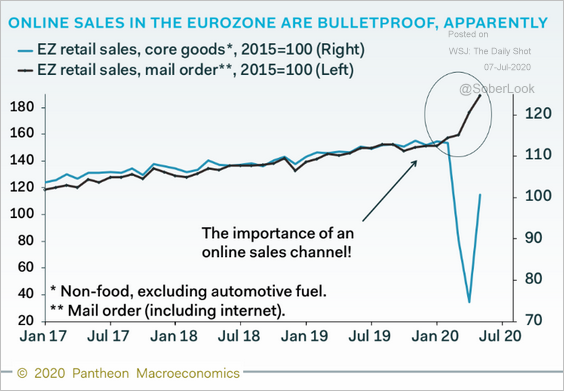 Source: Pantheon Macroeconomics
Japan
1. Wage growth surprised to the downside.
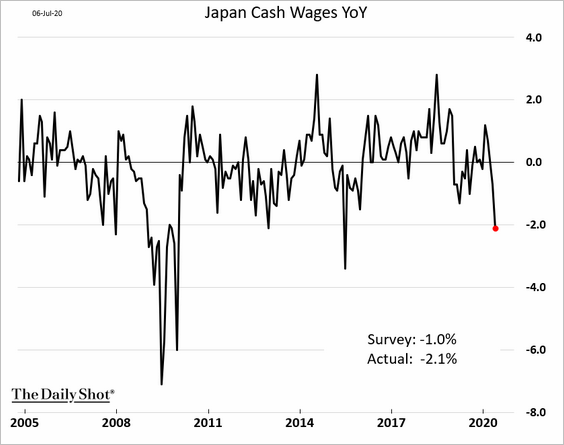
According to Goldman Sachs, the result was even weaker when using the same sample to measure changes in wages.
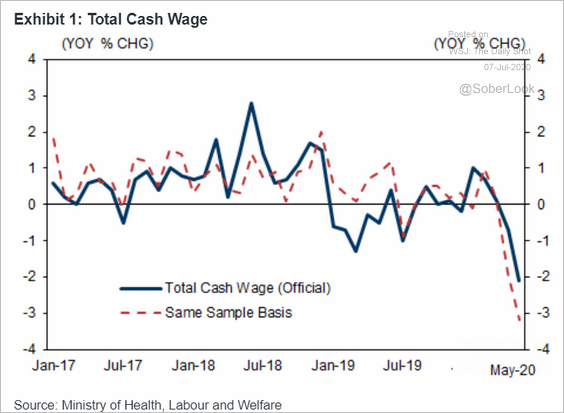 Source: Goldman Sachs
——————–
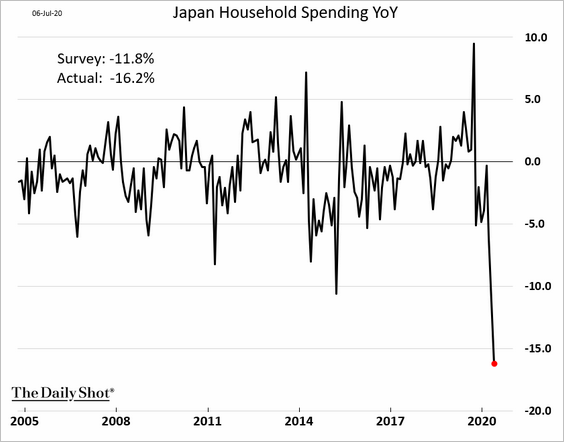
2. Household spending registered the largest yearly decline on record.
3. The loan-to-deposit gap for Japanese financial institutions is rising.
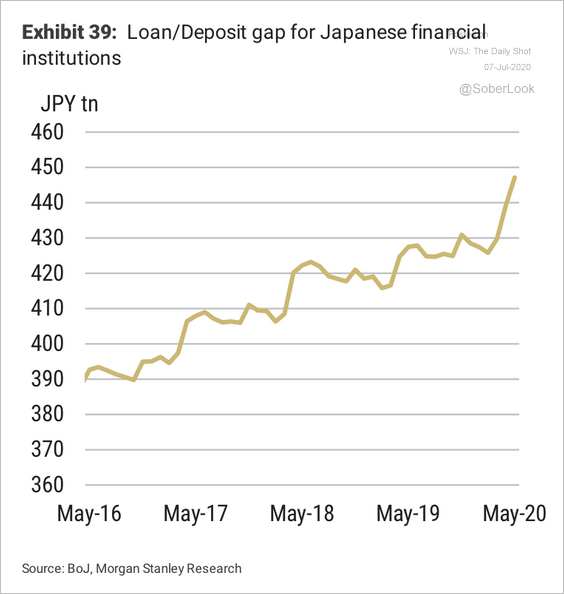 Source: Morgan Stanley Research
Asia – Pacific
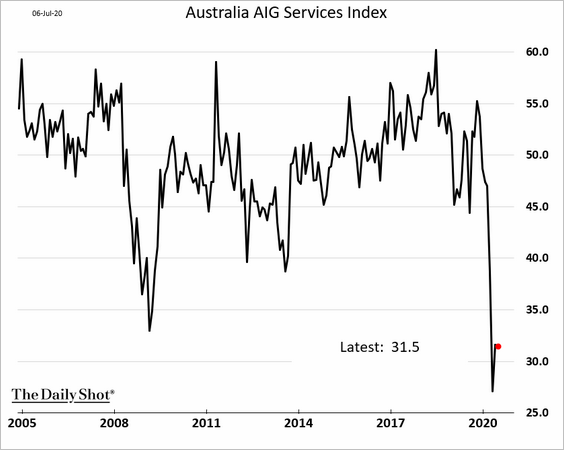
1. Australia’s service-sector activity remains exceptionally weak.
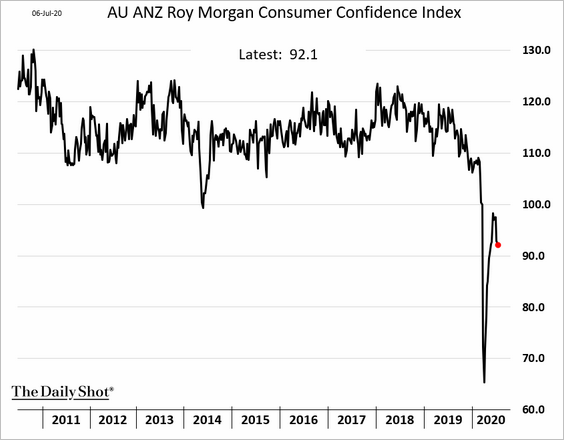
The rebound in consumer confidence is fading.
——————–
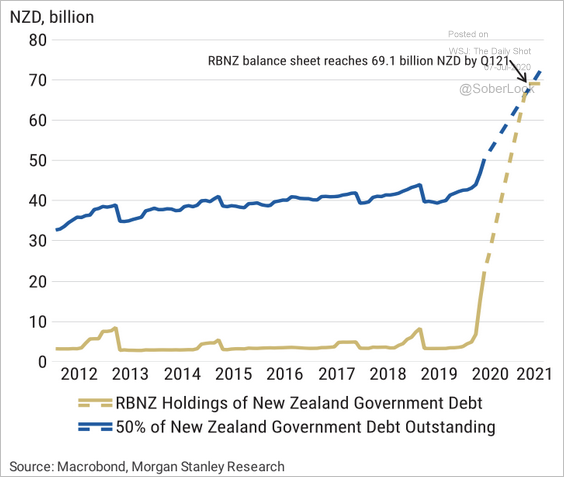
2. The RBNZ’s purchasing program will reach NZ$60 bn by the end of 1Q21.
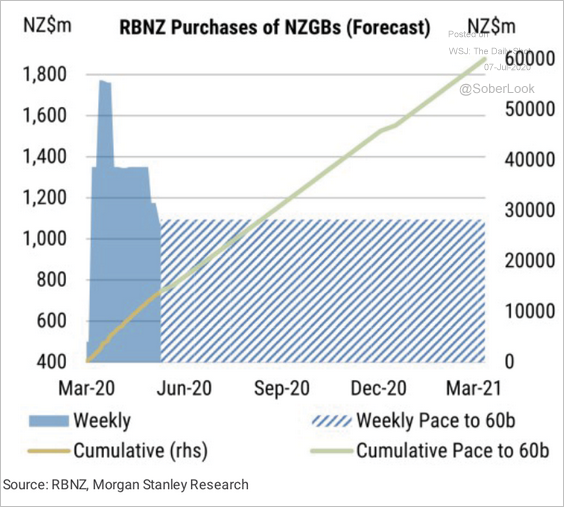 Source: Morgan Stanley Research
The central bank is set to own nearly half of outstanding New Zealand government bonds at the end of its QE program.
 Source: Morgan Stanley Research
China
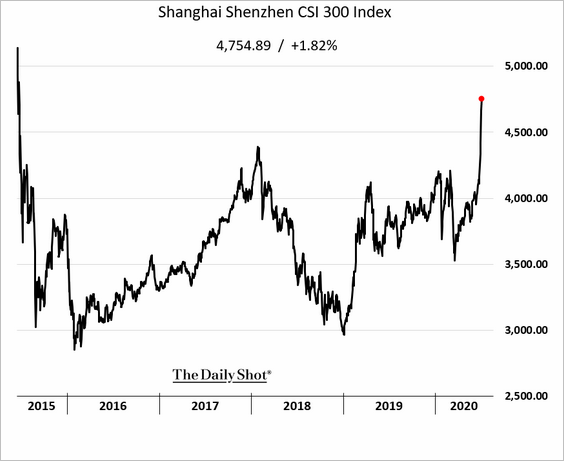
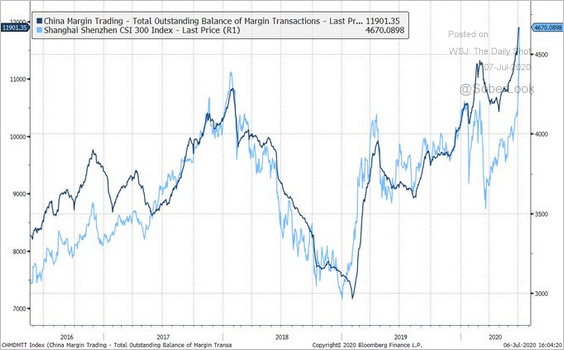
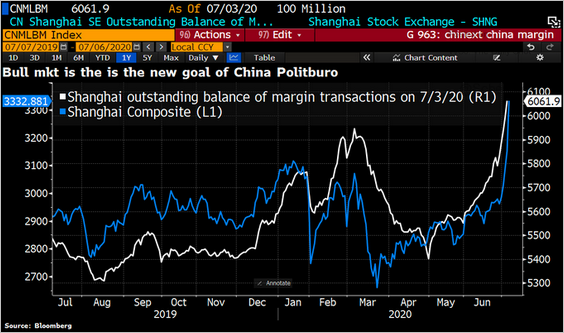
1. The stock market keeps climbing, boosted by Beijing’s jawboning.
Margin trading is popular again (2 charts).
 Source: @EffMktHype
 Source: @Schuldensuehner
Is the market overheating?
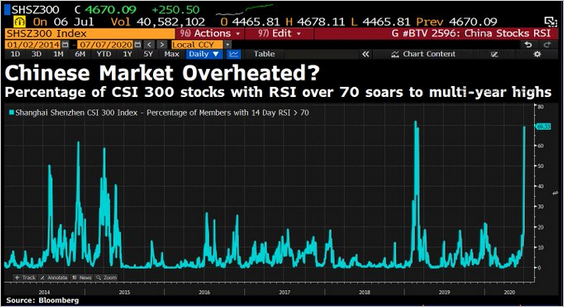 Source: @DavidInglesTV
——————–
2. China’s equity funds saw significant outflows ahead of the rally.
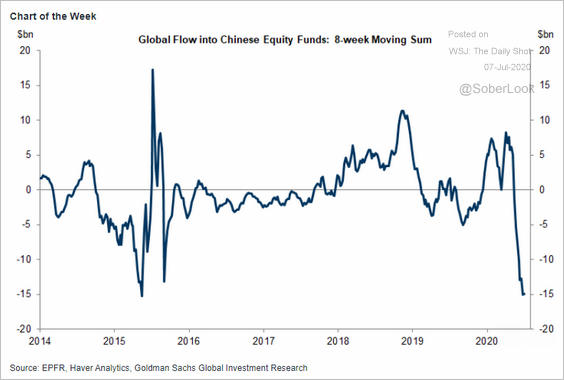 Source: Goldman Sachs
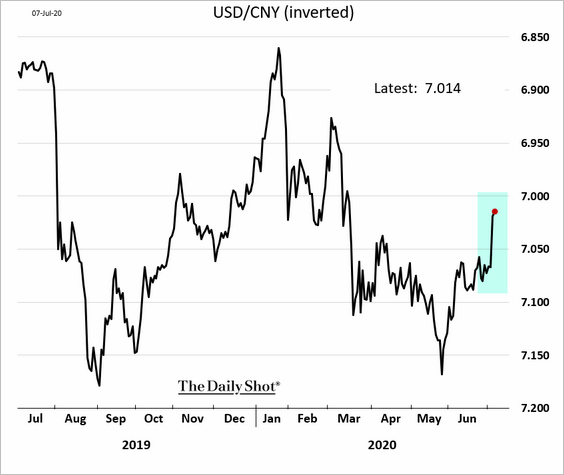
3. The renminbi rose sharply over the past 24 hours.
4. The 10yr bond spread to Treasuries hit a record high.
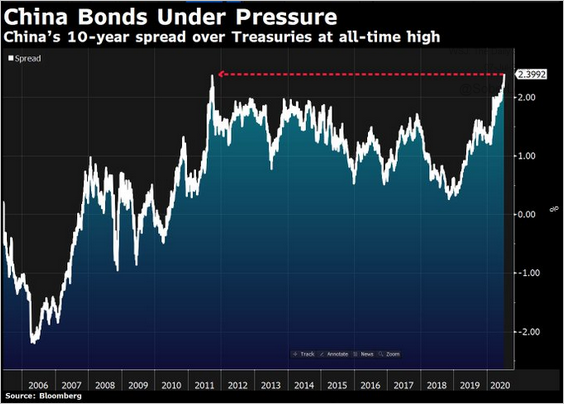 Source: @DavidInglesTV
Emerging Markets
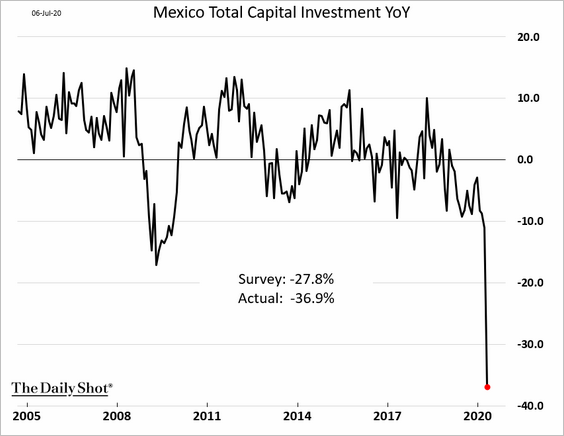
1. Mexico’s business investment collapsed in April, and analysts don’t expect to see a significant recovery in May.
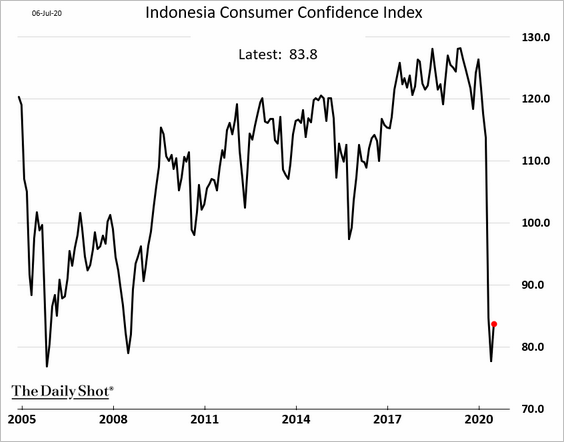
2. Indonesia’s consumer confidence remained extremely weak last month.
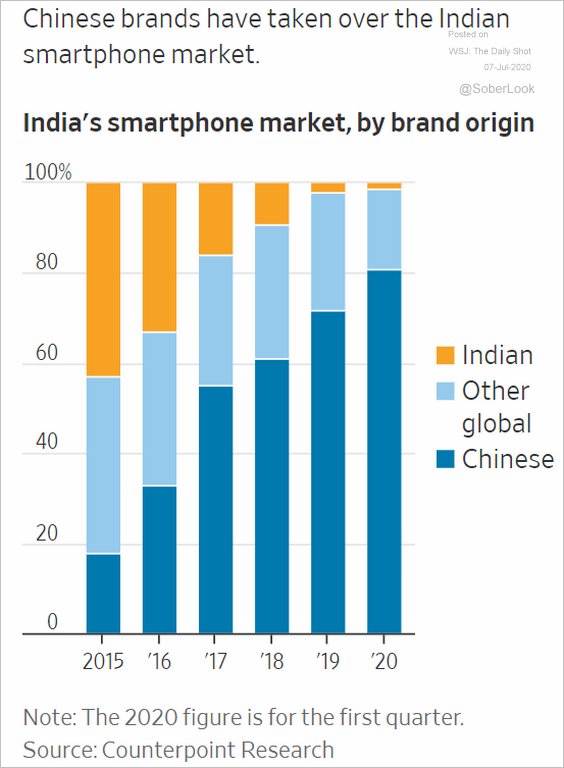
3. Can India roll back its economic integration with China?
 Source: @WSJ Read full article
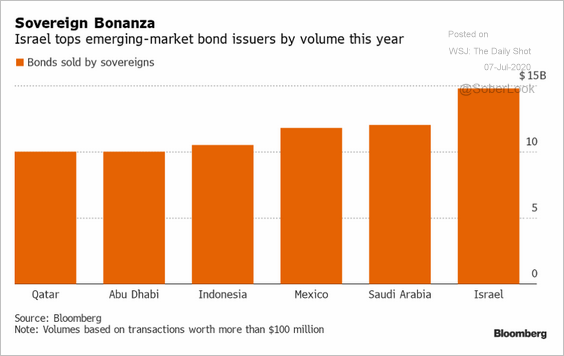
4. Here are the top EM sovereign debt issuers this year.
 Source: Bloomberg Read full article
5. How large is each nation’s financial system?
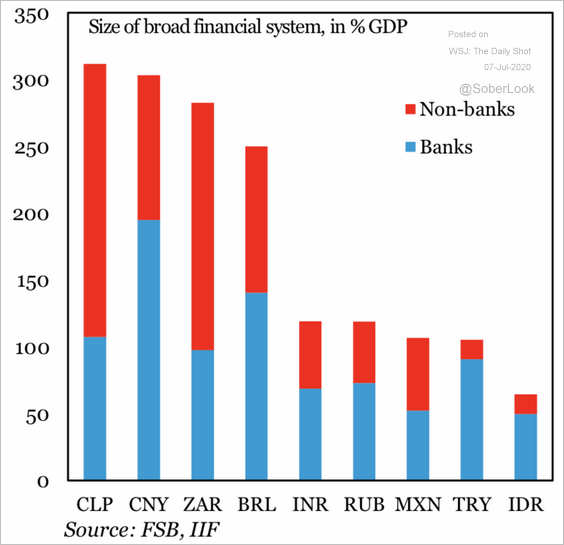 Source: IIF
Commodities
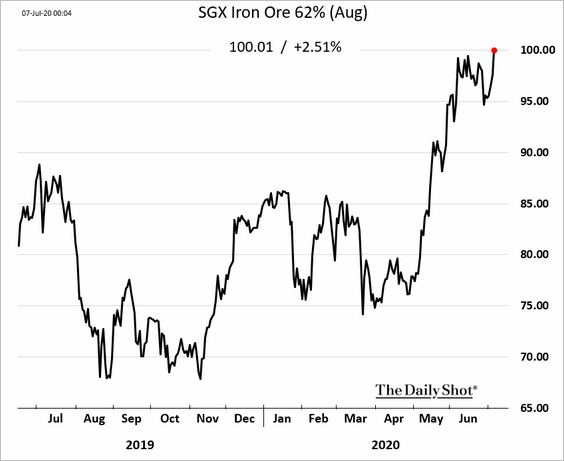
1. The rally in iron ore has resumed, with Singapore futures topping $100/MT.
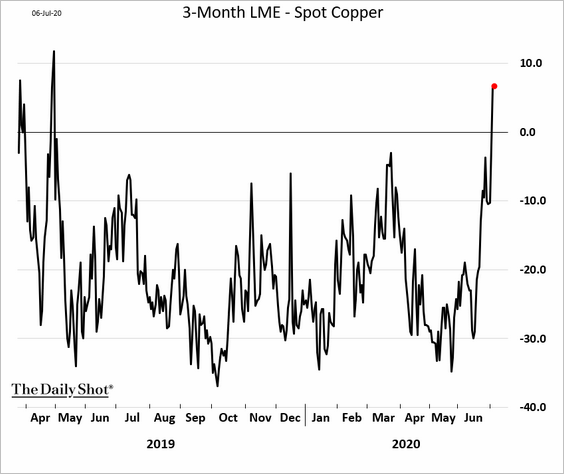
2. Copper has recovered most of the year-to-date losses.
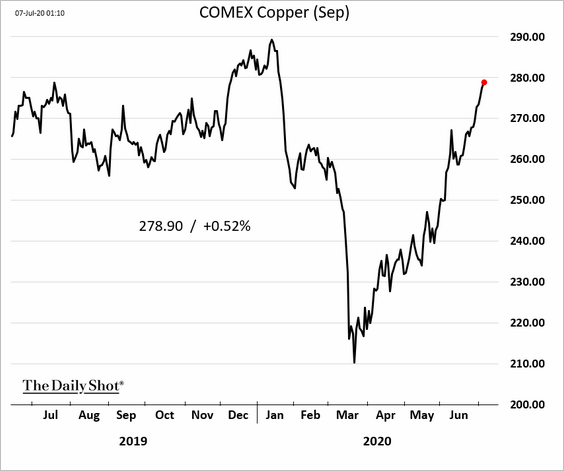
The copper curve is now in backwardation, signaling improving supply/demand fundamentals.
 h/t Winnie Zhu
——————–
3. The US Mint boosted its production of coins this year to meet rising demand.
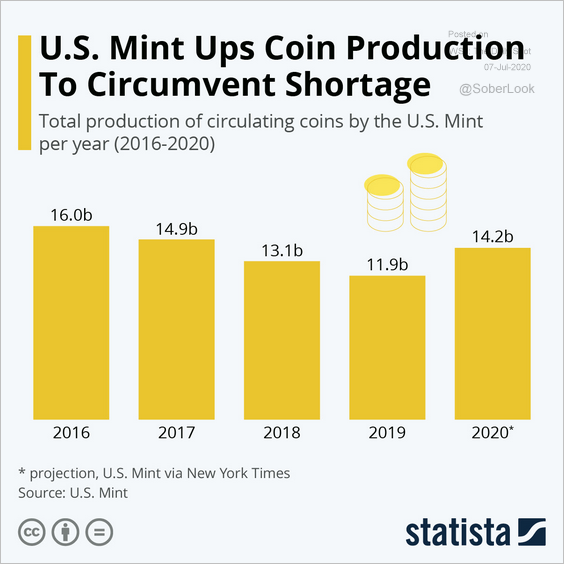 Source: Statista
Equities
1. The NASDAQ 100/S&P 500 ratio hit a record high.
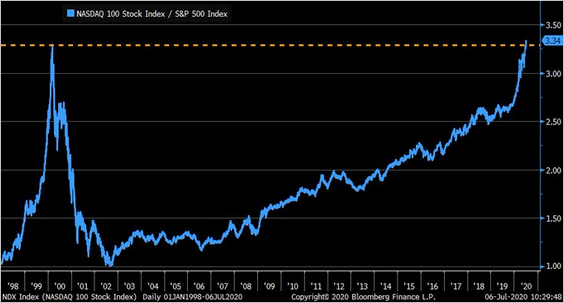 Source: @LizAnnSonders, @bloomberg
2. The S&P 500 is extremely concentrated.
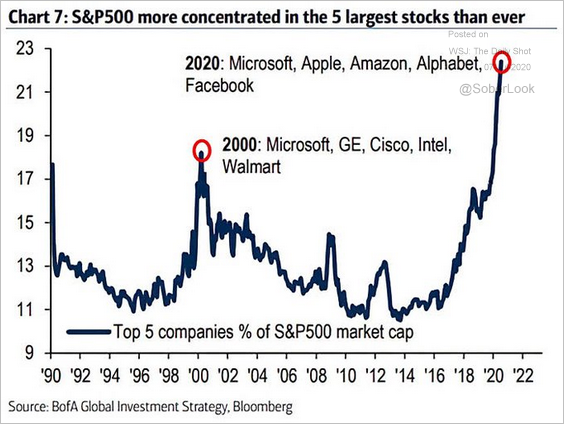 Source: @ISABELNET_SA, @BofAML
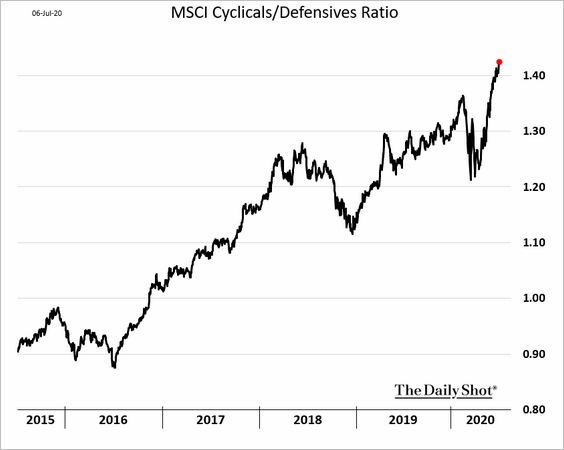
3. Cyclical sectors continue to outperform.
4. The S&P 500 dividend yield has been anchored at 2% over the past decade.
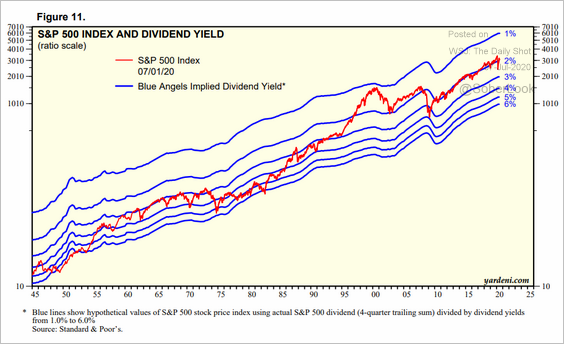 Source: Yardeni Research
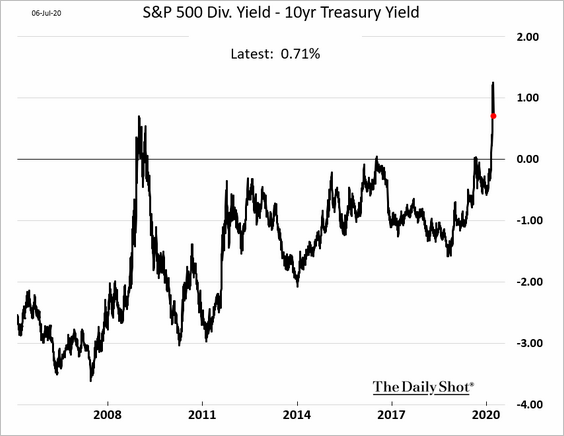
The spread between the S&P 500 dividend yield and the 10yr Treasury is off the highs but remains in positive territory.
——————–
5. The stock market has outperformed economic activity.
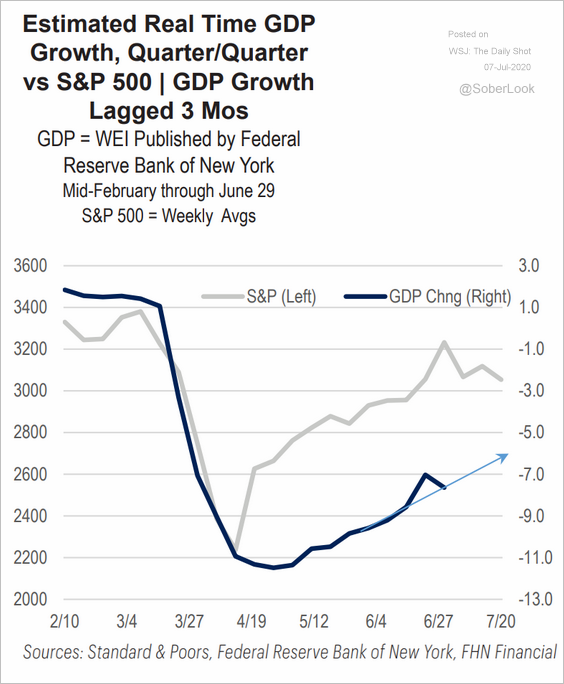 Source: FHN Financial
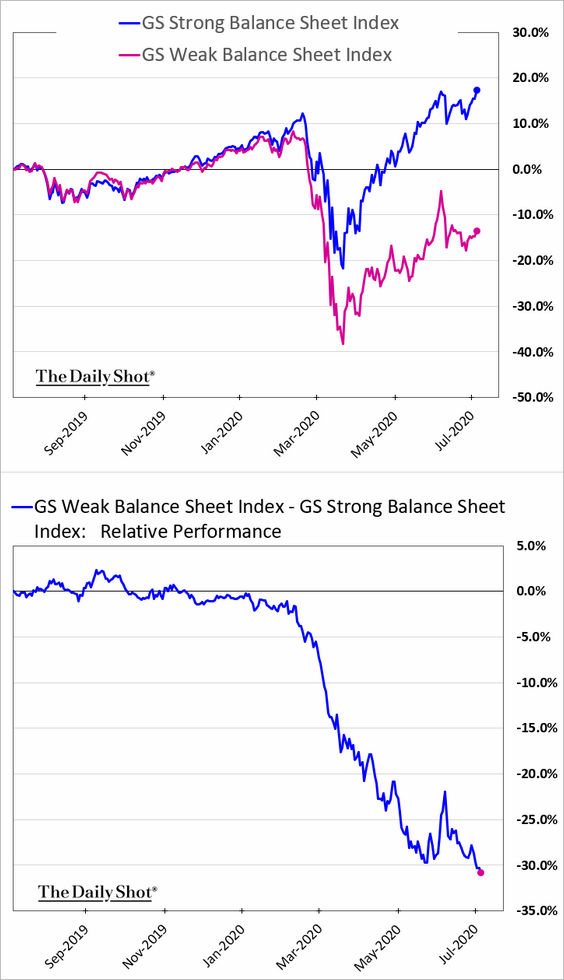
6. The gap between companies with strong and weak balance sheets continues to widen.
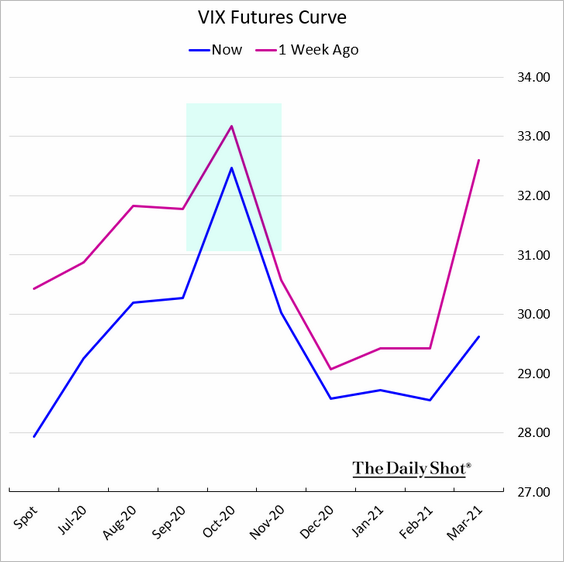
7. The volatility market is increasingly focused on the 2020 elections. Here is the VIX futures curve.
Credit
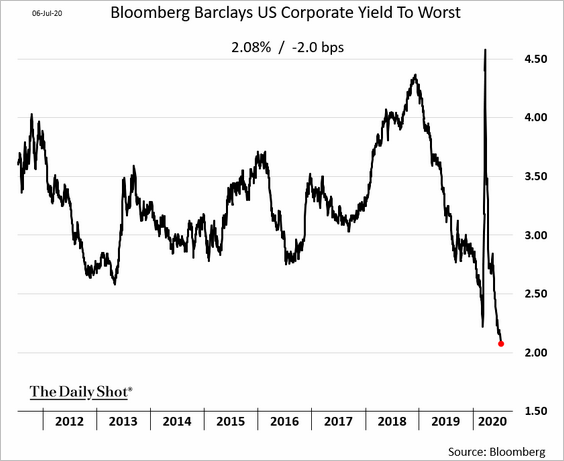
1. US investment-grade yields are at record lows, with the Bloomberg/Barclays index approaching 2%. Thanks to the Federal Reserve, financing costs have collapsed for companies with strong balance sheets.
2. According to Crescat, current high-yield spreads do not adequately compensate income investors for the unprecedented supply, especially as the Fed decided to focus on purchasing investment-grade corporate bonds.
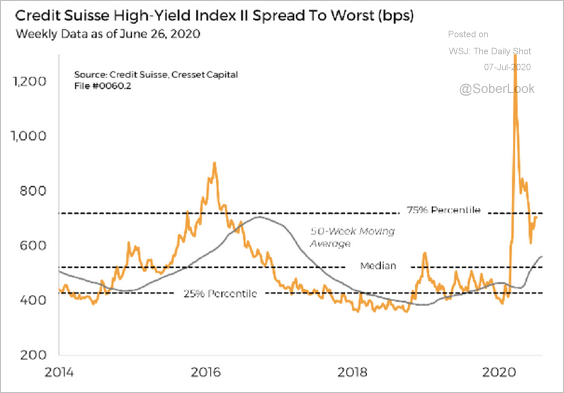 Source: Crescat Capital
A model based on economic indicators shows that high-yield spreads are remarkably tight.
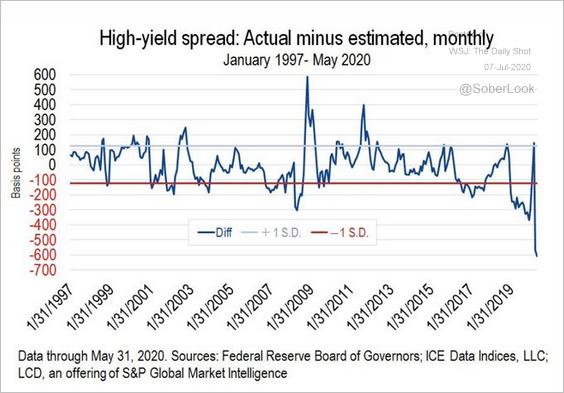 Source: @jessefelder Read full article
——————–
3. European leveraged finance issuance slowed in the second quarter.
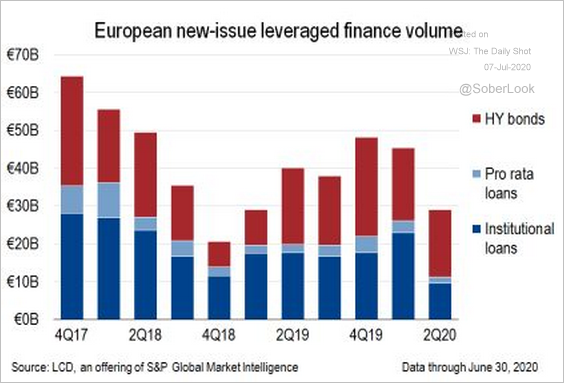 Source: @lcdnews, @millarlr
Rates
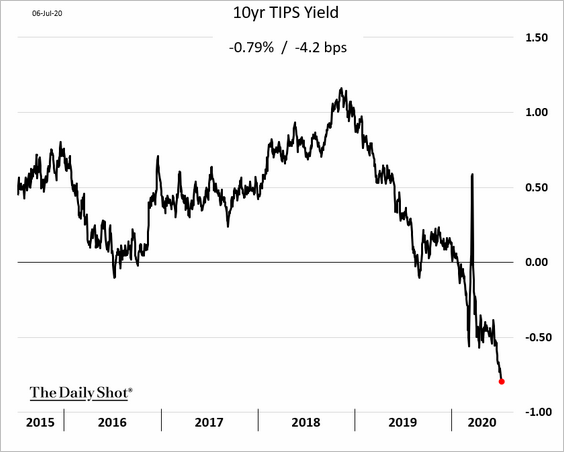
1. Market-based inflation expectations keep climbing.
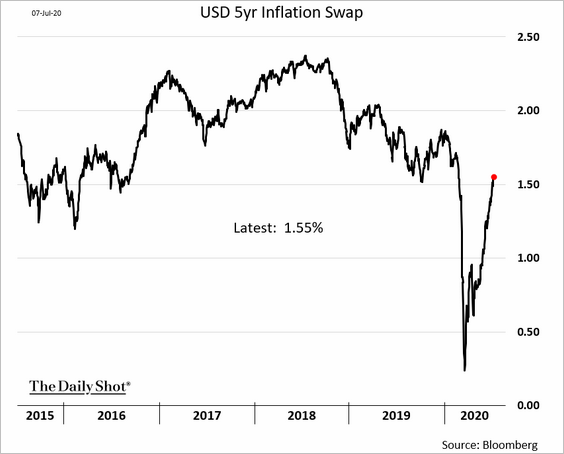
As a result, effective real rates (TIPS yields) are moving deeper into negative territory.
——————–
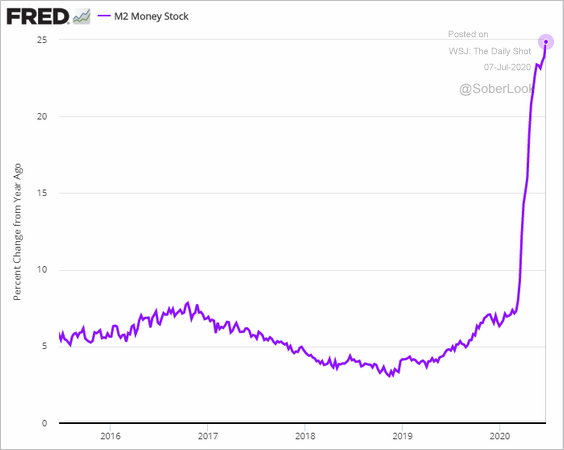
2. The US broad money supply is 25% higher than it was a year ago.
3. Money market funds saw substantial inflows compared to previous recessions.
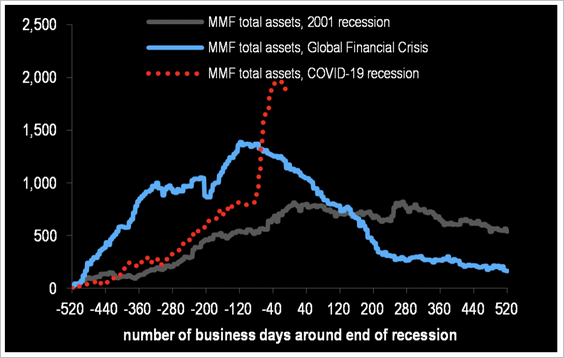 Source: JP Morgan, @themarketear
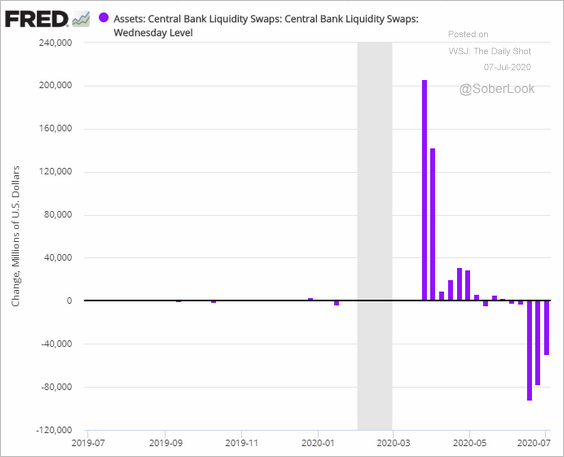
4. Next, we have some updates on the Fed’s balance sheet.
• Total assets continue to shrink, …
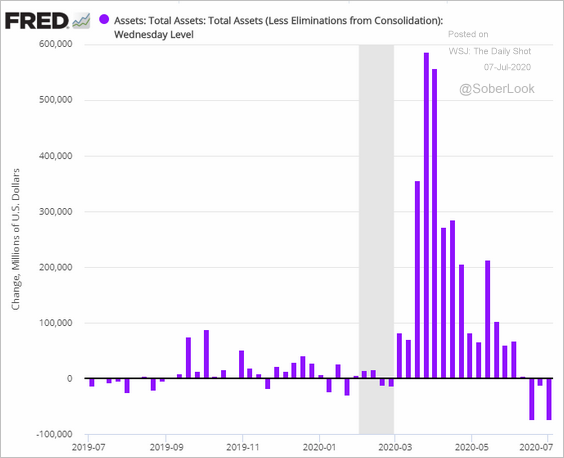
… pulled lower by credit/liquidity facilities.
• The Fed has maxed its holdings in the 2036-2042 Treasury maturities.
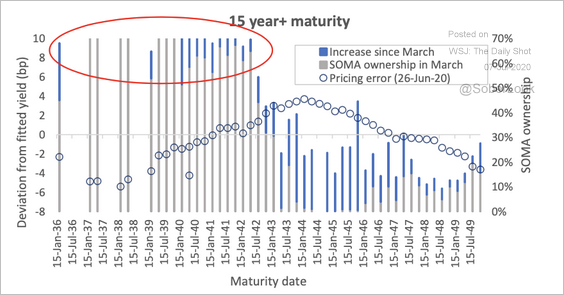 Source: Deutsche Bank Research
• The two charts below compare the Fed’s and the ECB’s balance sheets.
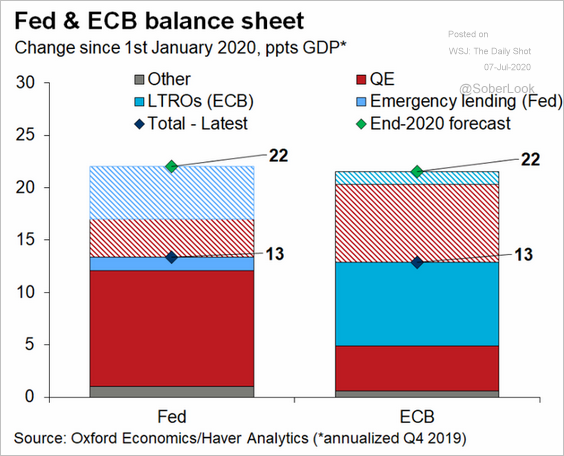 Source: @GregDaco
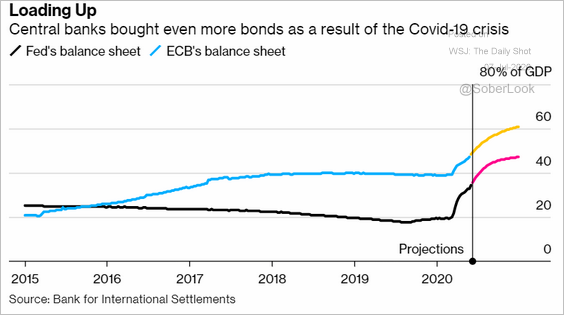 Source: @markets Read full article
Global Developments
1. Asset managers continue to bet against the US dollar (2 charts).
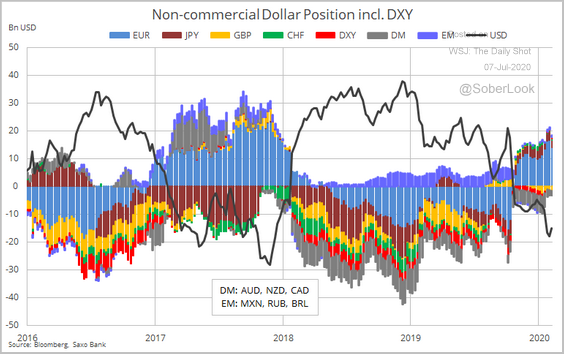 Source: @Ole_S_Hansen
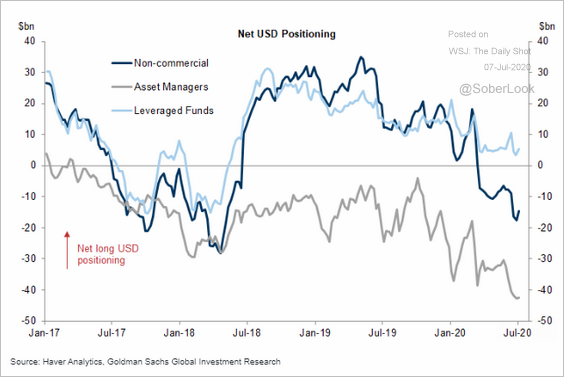 Source: Goldman Sachs
——————–
2. Global manufacturing is nearing stabilization (PMI = 50).
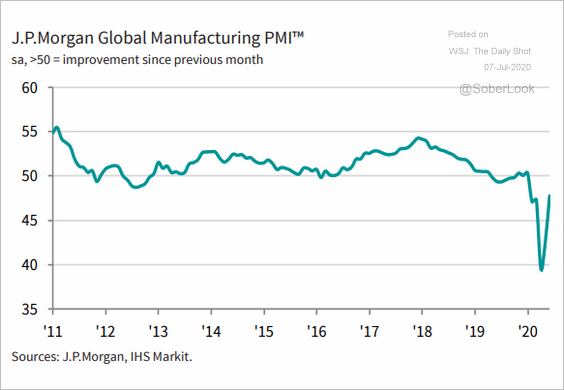 Source: @IHSMarkitPMI Read full article
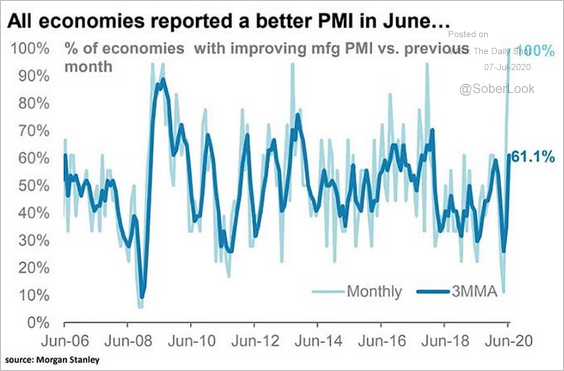 Source: @ISABELNET_SA, @MorganStanley
——————–
3. This chart shows the year-to-date fund flows by asset class.
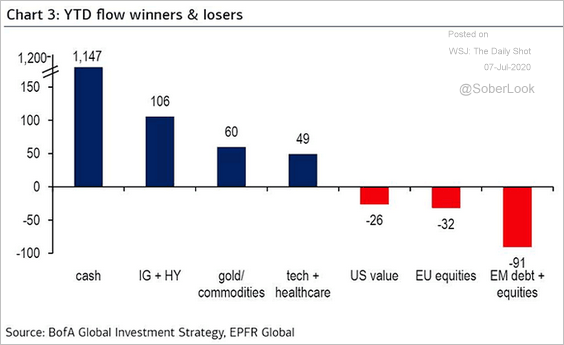 Source: @ISABELNET_SA, @BofAML
——————–
Food for Thought
1. E-commerce share of total retail sales:
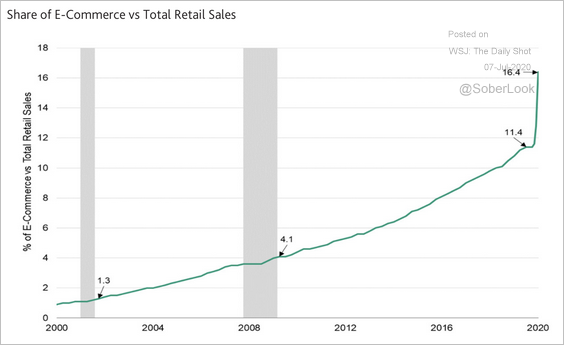 Source: Moody’s Analytics
2. A multi-decade decline in US startups:
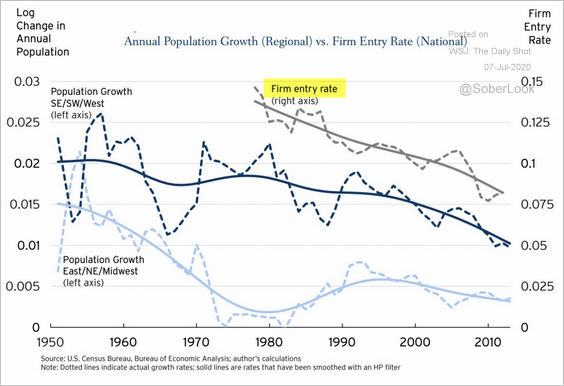 Source: Brookings Institution Read full article
3. Preferences for working from home:
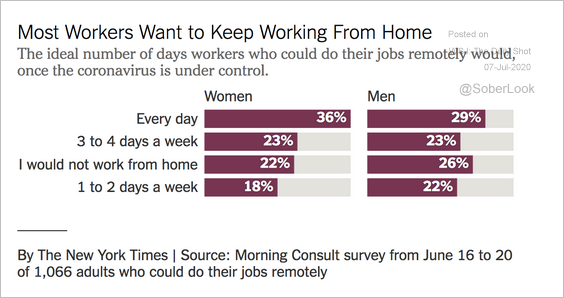 Source: The New York Times Read full article
If your work becomes remote, would you move to a different city?
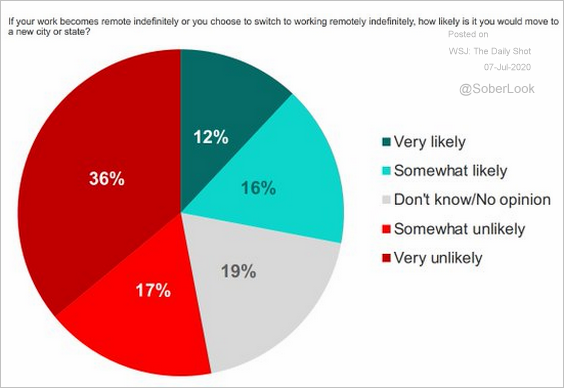 Source: @MorningConsult Read full article
——————–
4. Leaving big cities:
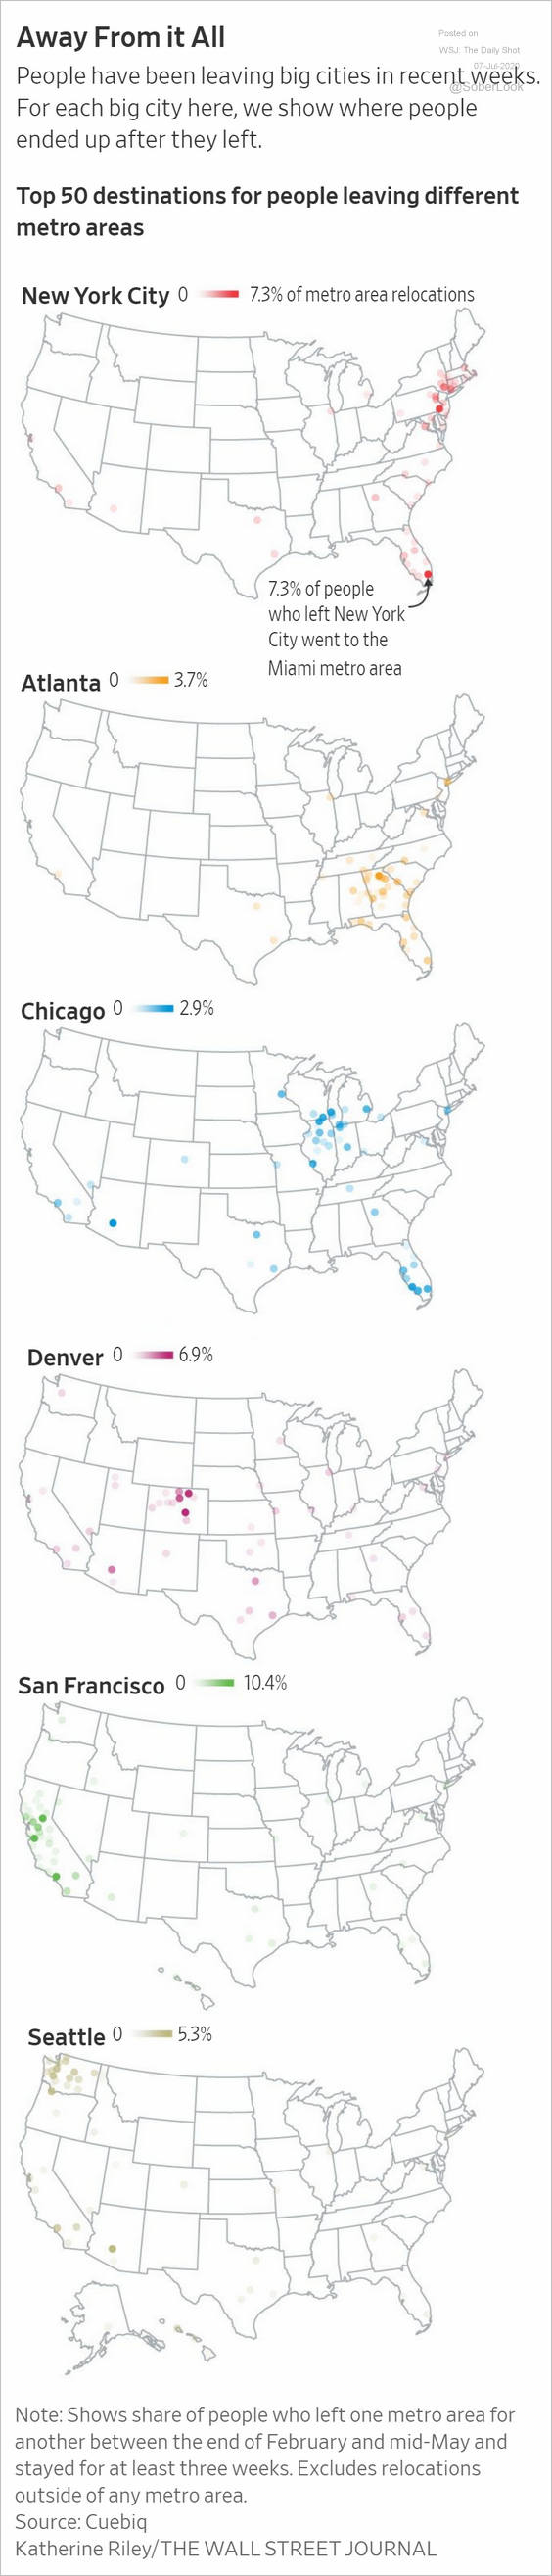 Source: @WSJ Read full article
5. COVID-19 cases/hospitalizations by race/ethnicity (2 charts):
 Source: The New York Times Read full article
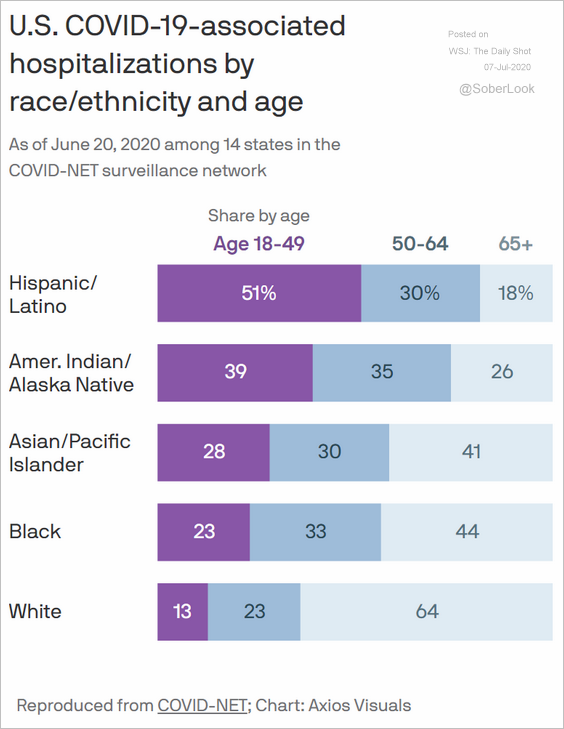 Source: @axios
——————–
6. Testing vs. new cases, by state:
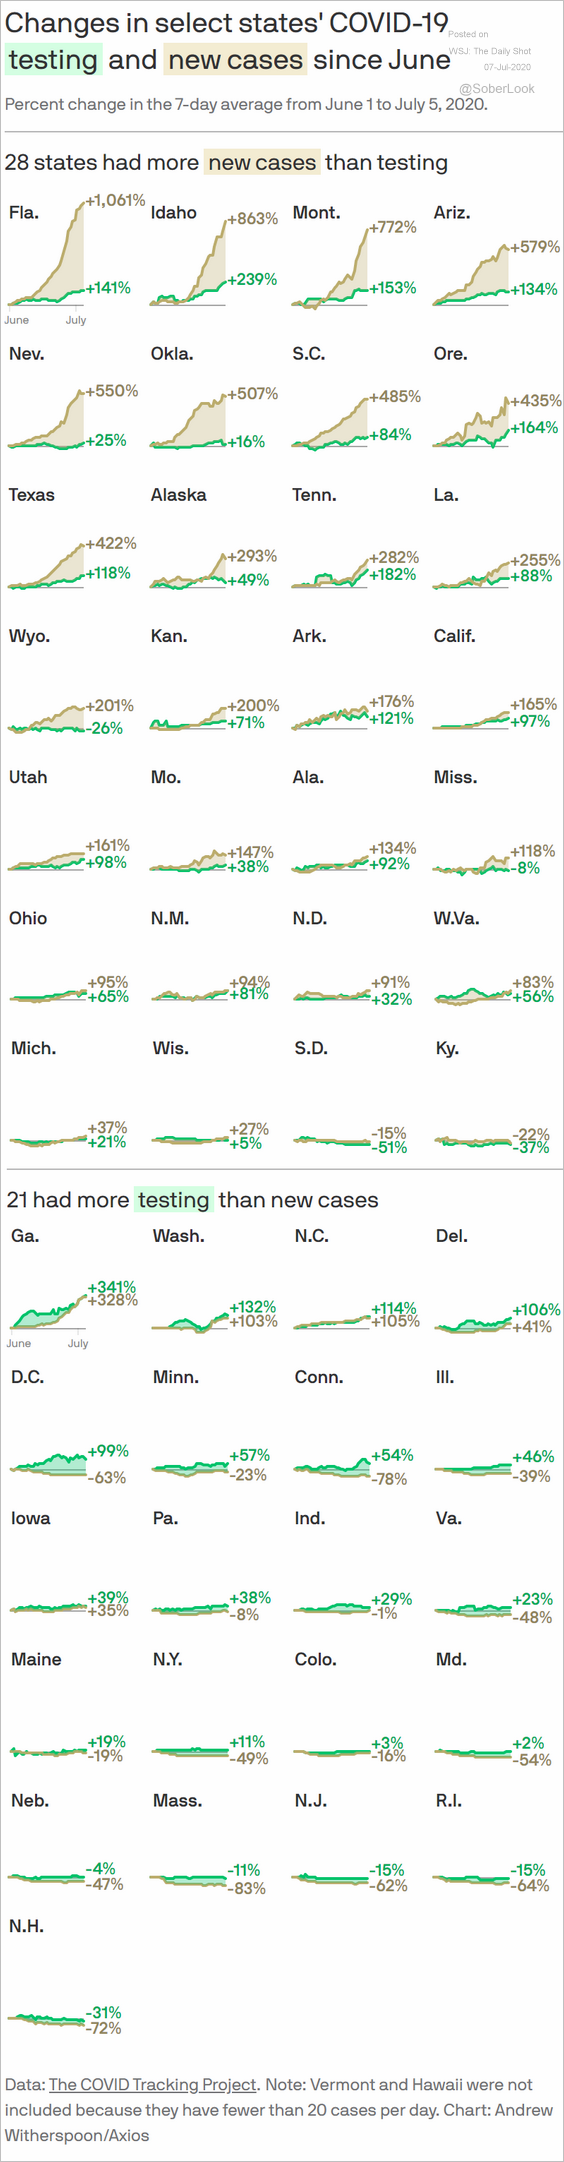 Source: @axios Read full article
7. US views on same-sex marriage:
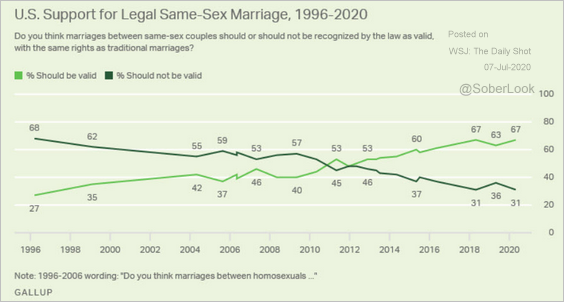 Source: Gallup Read full article
The history of same-sex marriage legalization globally:
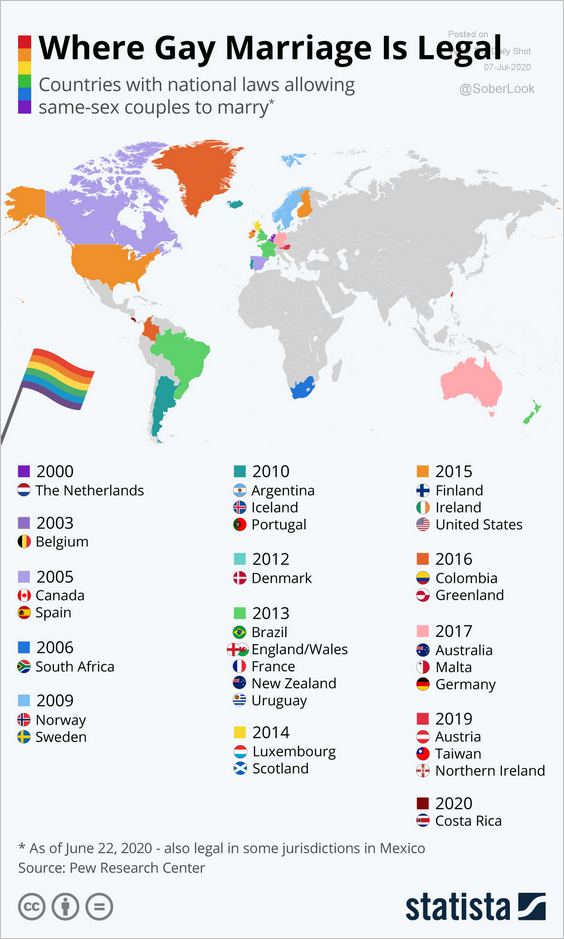 Source: Statista
——————–
8. Preferences for brands of coolers:
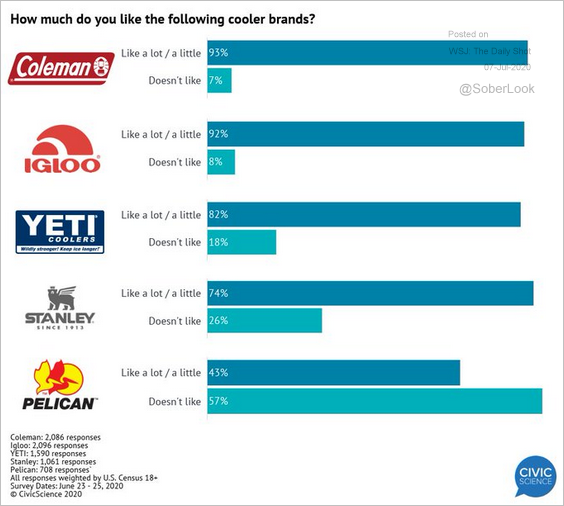 Source: @CivicScience Read full article
——————–