
The Daily Shot: 10-Jul-20
• The United States
• The Eurozone
• Asia – Pacific
• China
• Energy
• Equities
• Credit
• Rates
• Global Developments
• Food for Thought
The United States
1. Another 1.4 million Americans filed for unemployment benefits last week.
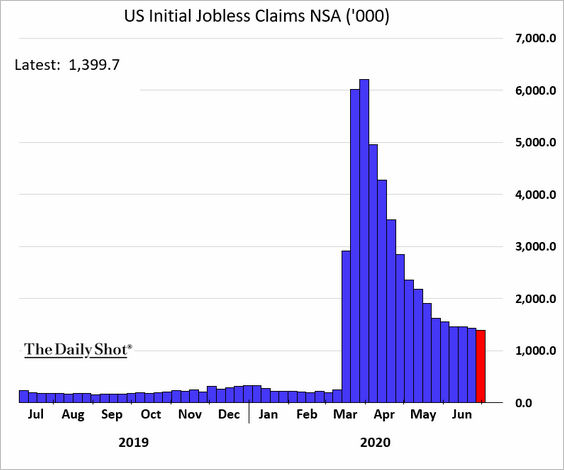
• While the headline initial claims figure has been gradually moderating, the situation is more troubling when the Pandemic Unemployment Assistance (PUA) program is taken into account.
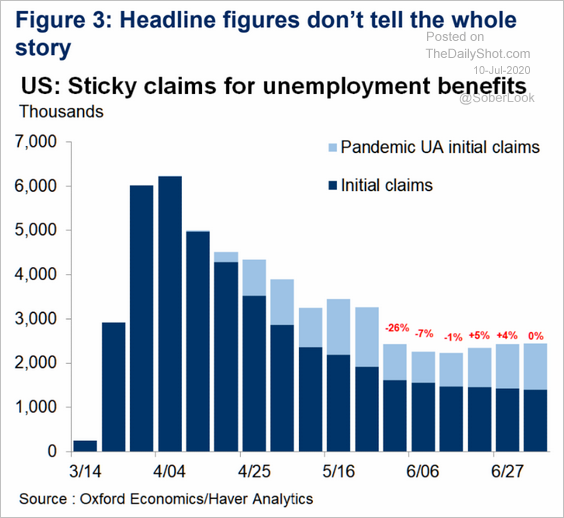 Source: Oxford Economics
• PUA filings started climbing again as the pandemic worsened in a number of states.
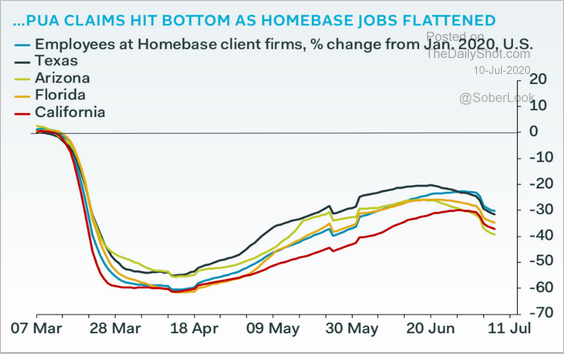 Source: Pantheon Macroeconomics
• Maintaining the labor market recovery is challenging when over fifty thousand new COVID-19 infections are reported daily.

• The total number of Americans receiving unemployment benefits hit a new record.
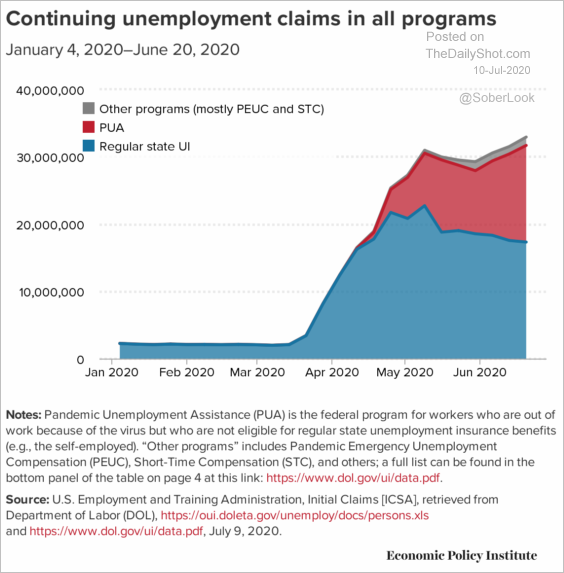 Source: Economic Policy Institute
• Given this trend, shouldn’t the official unemployment figures be much higher? It’s a classification issue. The comment from ING (below) tells us why the monthly nonfarm payrolls report substantially understates the level of unemployment in the US.
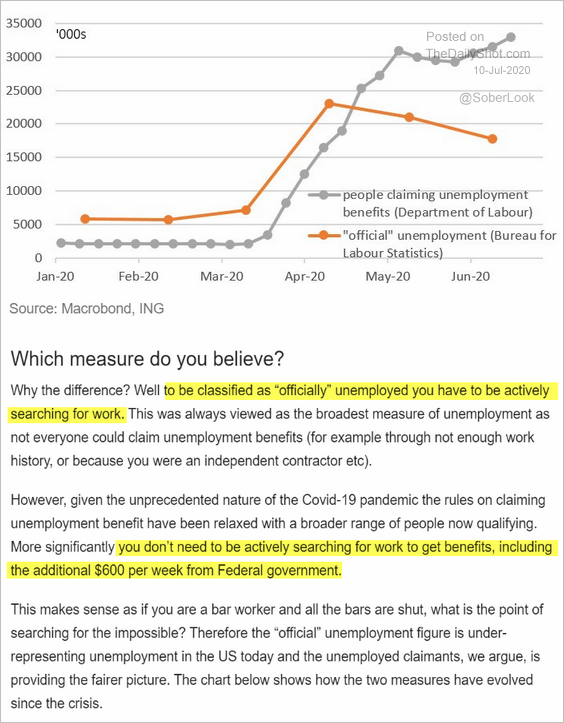 Source: ING
We now have nearly 36 million workers who are either on or have recently applied for unemployment benefits. That’s about 23% of the US civilian workforce.
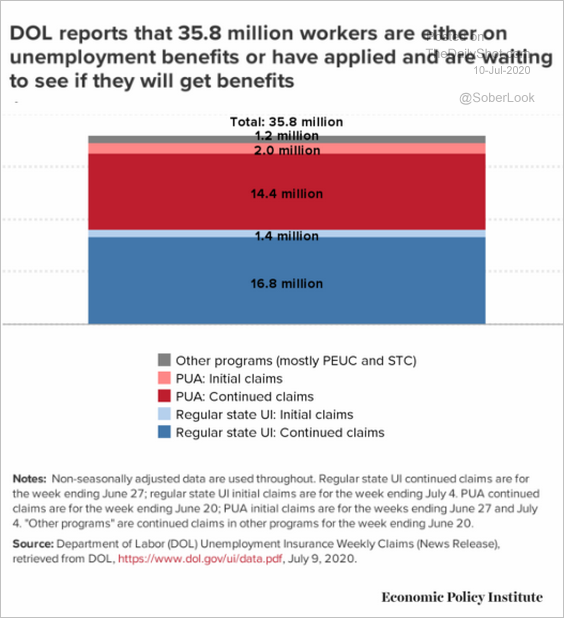 Source: Economic Policy Institute
——————–
2. Next, we have some additional labor market data.
• Job losses by age cohort:
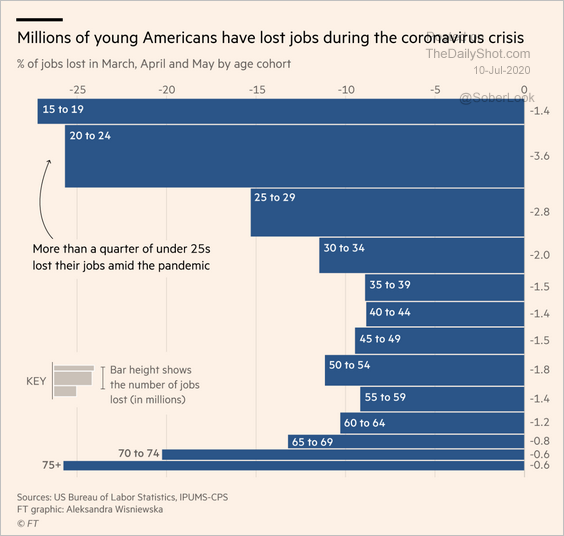 Source: @financialtimes Read full article
• Concerns about job loss by region and …
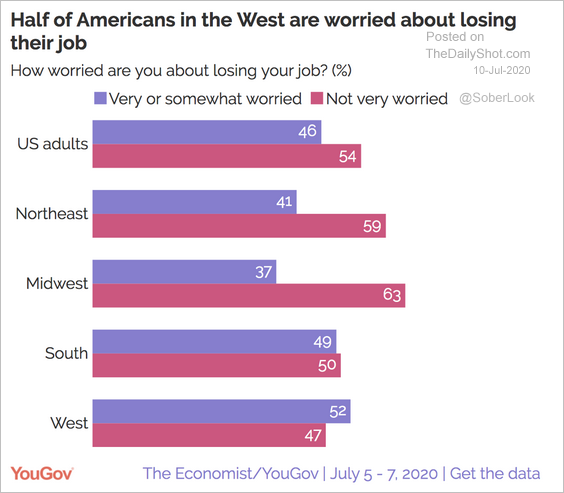 Source: YouGov Read full article
• … by age:
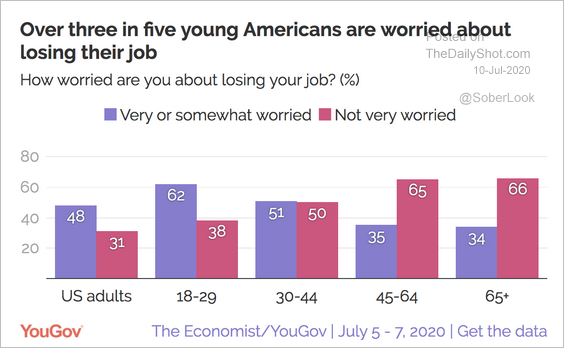 Source: YouGov Read full article
——————–
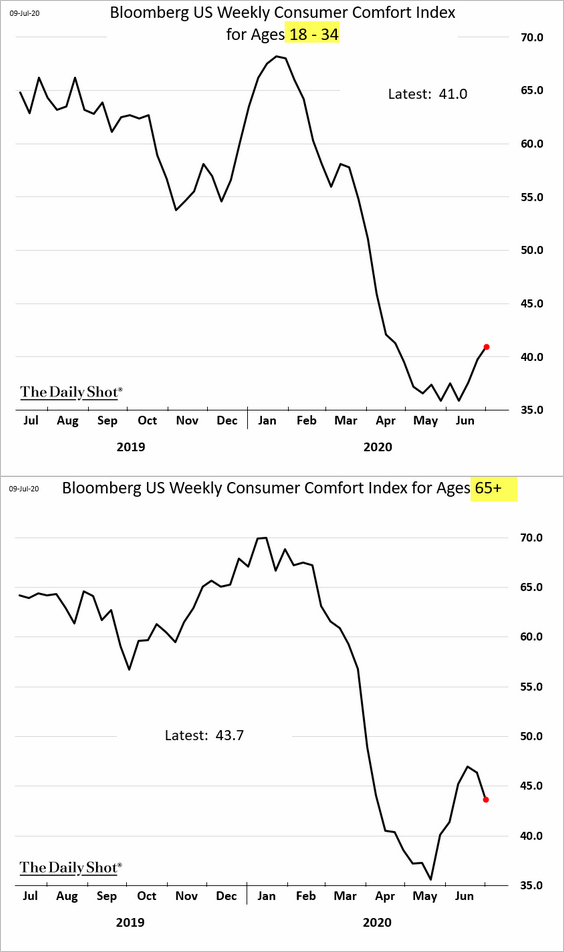
3. Bloomberg’s consumer sentiment index declined for the first time since early May.
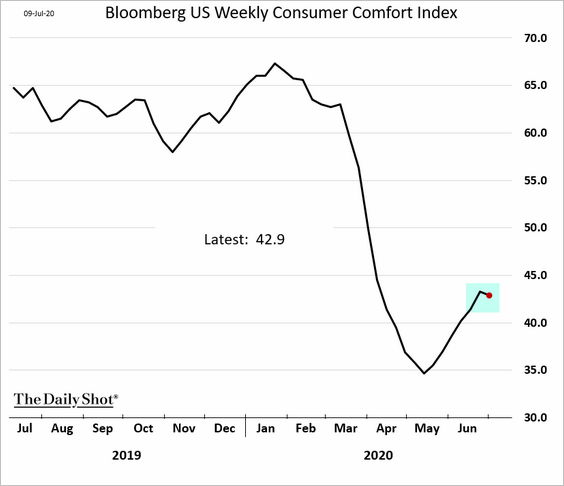 Source: Bloomberg
• Here is the buying climate index.
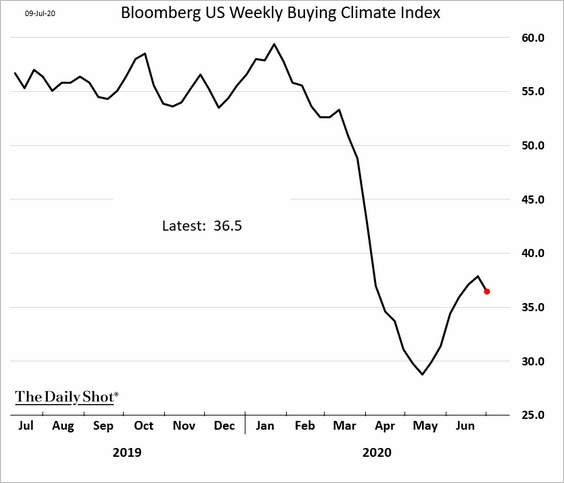 Source: Bloomberg
The fading rebound in consumer confidence is visible in JP Morgan’s credit/debit card spending data.
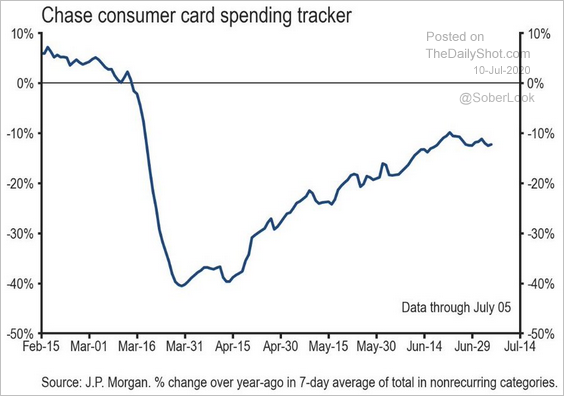 Source: JP Morgan, @carlquintanilla
• Sentiment worsened the most among older Americans.
——————–
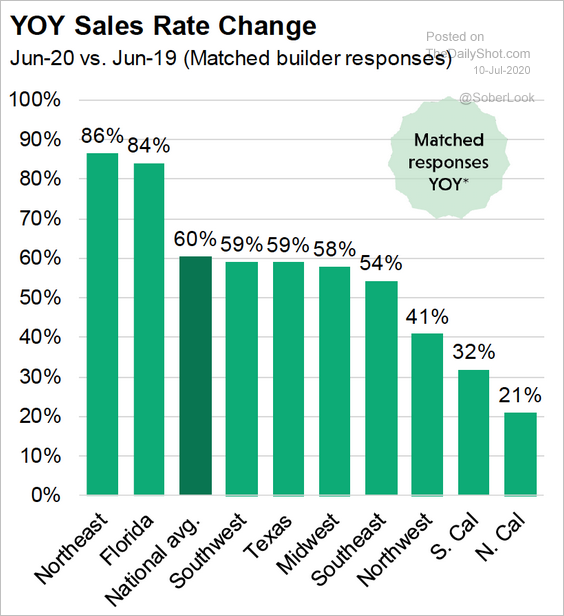
4. Next, we have some updates on the housing market, which has been remarkably resilient during this crisis.
• June has been an excellent month for new home sales, led by the Northeast and Florida, according to a survey of builders.
 Source: John Burns Real Estate Consulting
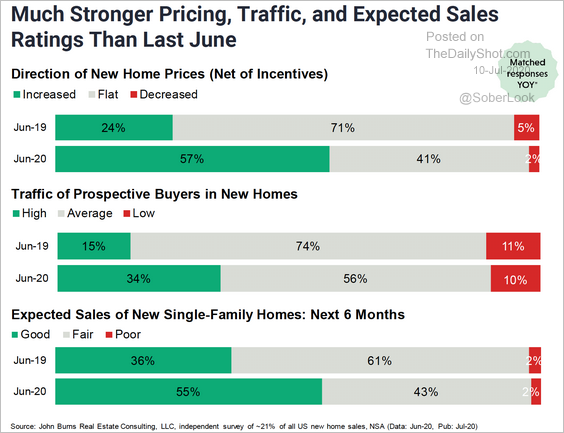
• New home prices, buyer traffic, and sales expectations have been robust.
 Source: John Burns Real Estate Consulting
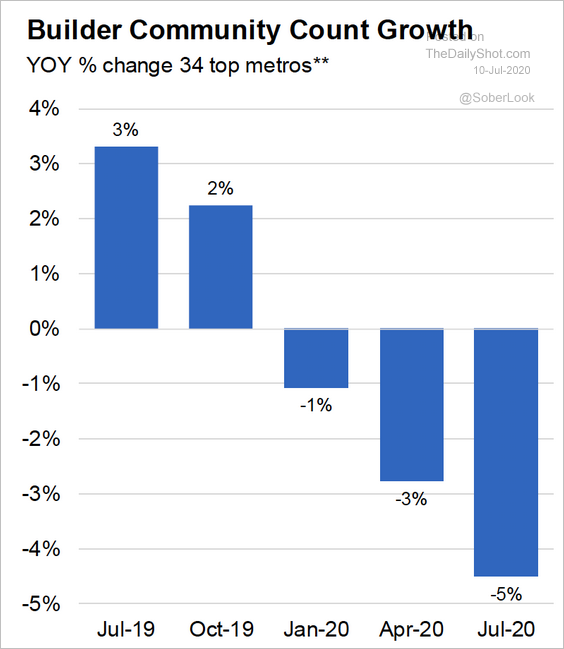
• Community count growth is down 5% year-over-year, reflecting the substantial drop in inventories.
 Source: John Burns Real Estate Consulting
• Existing housing inventories continue to shrink.
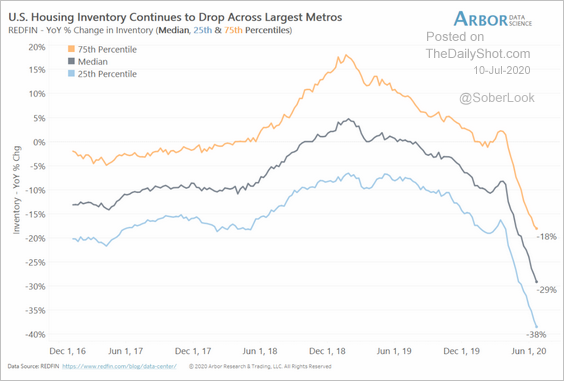 Source: Arbor Research & Trading
• New listings that sold in two weeks or less are up over 20%.
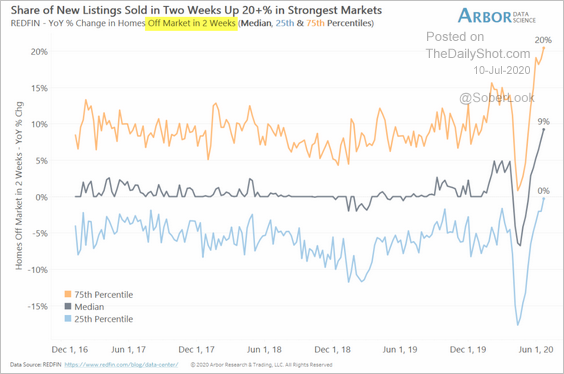 Source: Arbor Research & Trading
The Eurozone
1. Governments are starting to spend.
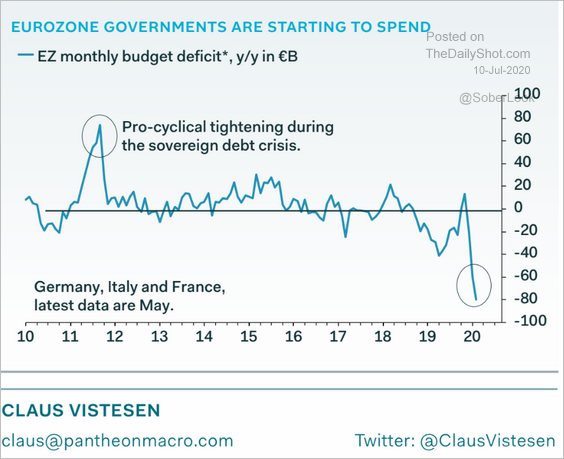 Source: Pantheon Macroeconomics
But low bond yields (with the help from the ECB) make it relatively inexpensive to finance rising deficits.
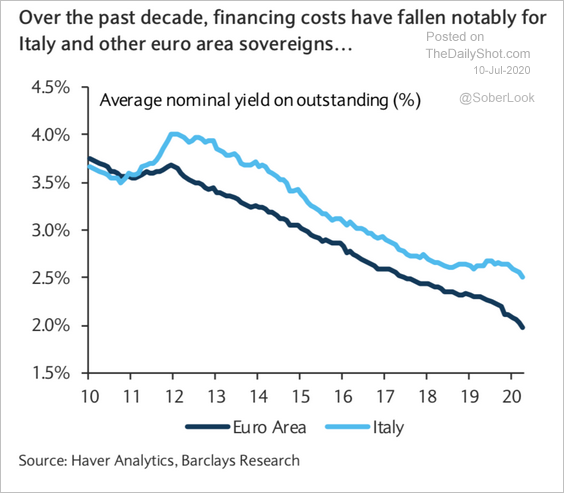 Source: Barclays Research
——————–
2. The number of European “zombie” companies is on the rise.
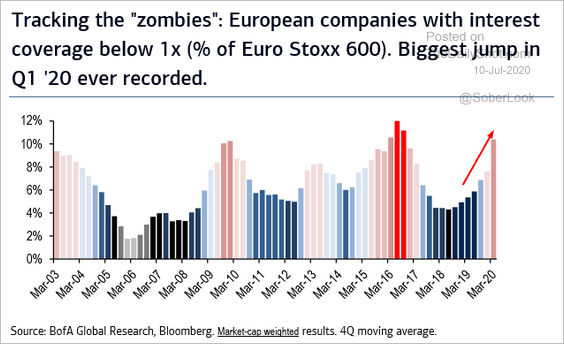 Source: BofA Merrill Lynch Global Research, @jsblokland
Asia – Pacific
1. This chart shows key economic indicators for countries with early exposure to COVID-19.
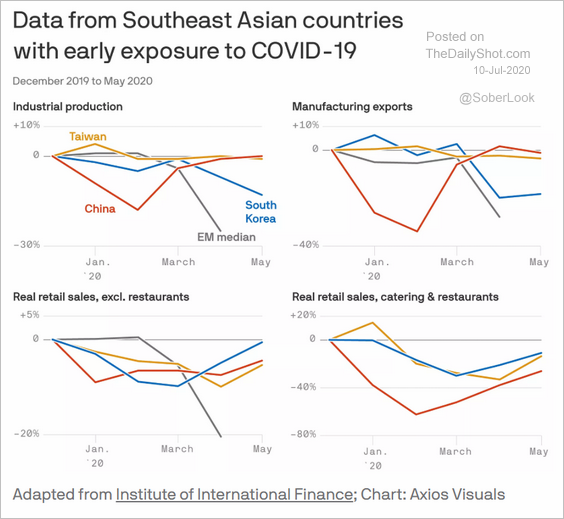 Source: @axios Read full article
2. Retail investors have been buying the Australian stock market rally, while institutions remain net sellers.
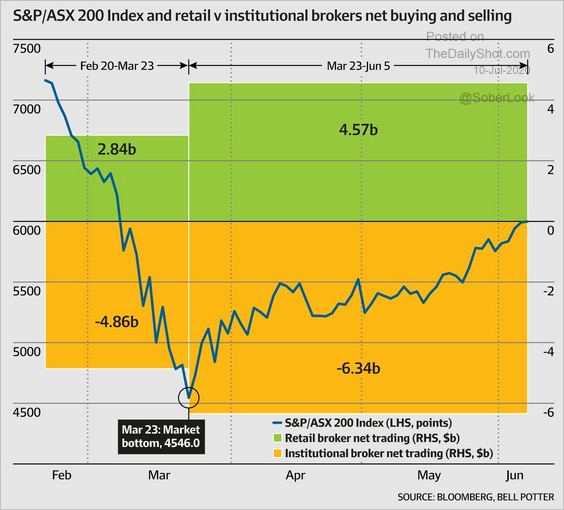 Source: @johnnyshap Read full article
3. Australian corporate credit quality has worsened substantially this year.
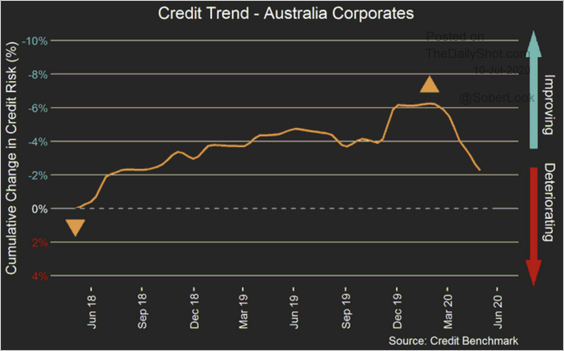 Source: Credit Benchmark
China
1. The tech-heavy ChiNext index is nearing initial resistance and appears overbought.
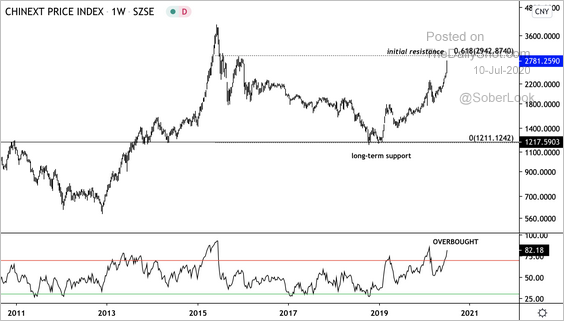 Source: @DantesOutlook
The Shanghai Composite index is also at resistance but is not near extreme overbought levels such as in 2007 and 2014, …
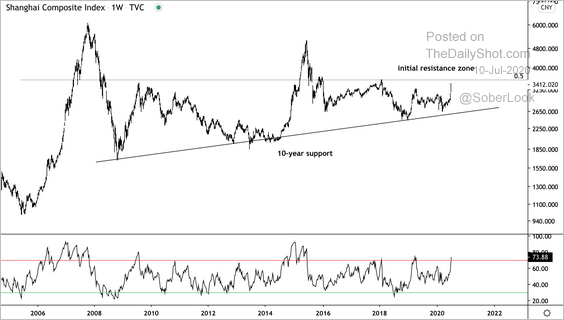 Source: @DantesOutlook
…similar to the China large-cap ETF (FXI).
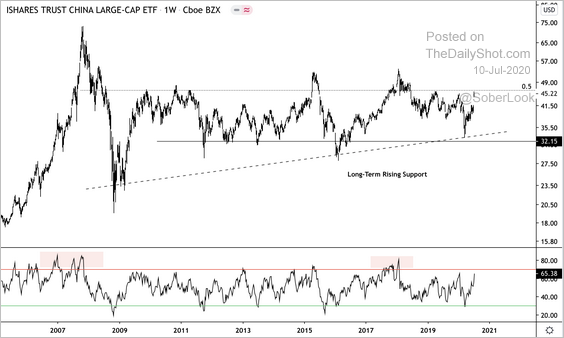 Source: @DantesOutlook
——————–
2. The largest China ETF (based in China) had a considerable inflow this week.
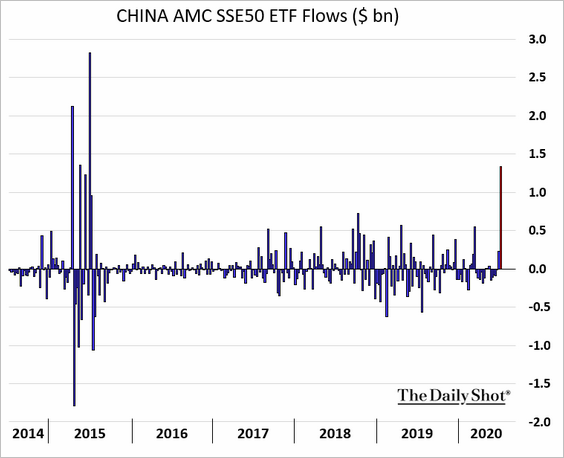 h/t Charlie Zhu
Here are the overall fund flows.
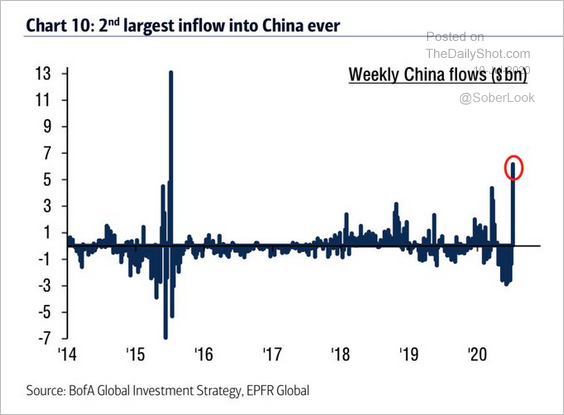 Source: BofA Merrill Lynch Global Research, @WallStJesus
——————–
3. The market fear/greed indicator is deep in greed territory.
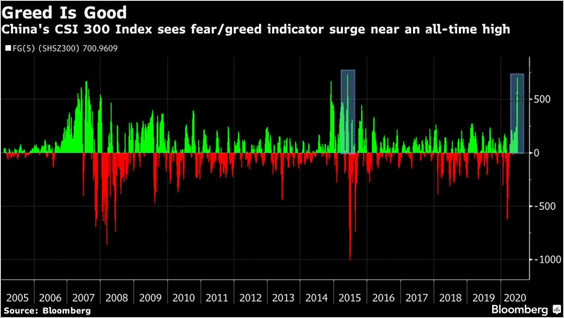 Source: @markets Read full article
4. China’s stock market capitalization hit $9 trillion.
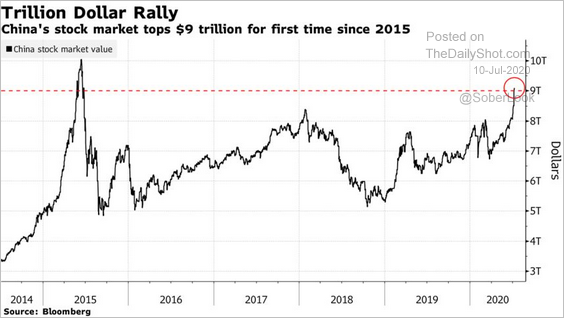 Source: @markets Read full article
5. Will China’s credit expansion boost global recovery?
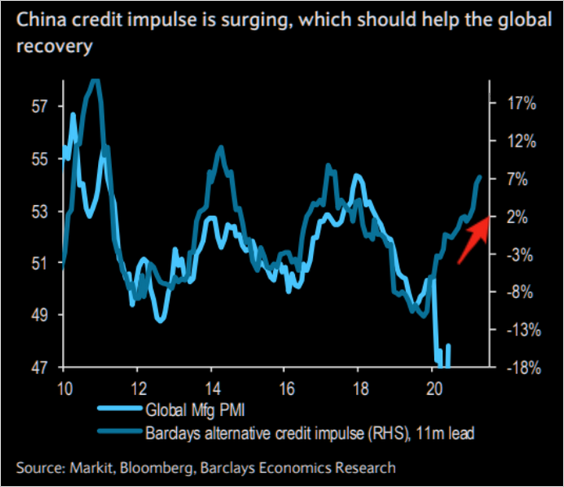 Source: Barclays Research, @themarketear
6. Next, we have some updates on Hong Kong.
• Companies operating in Hong Kong:
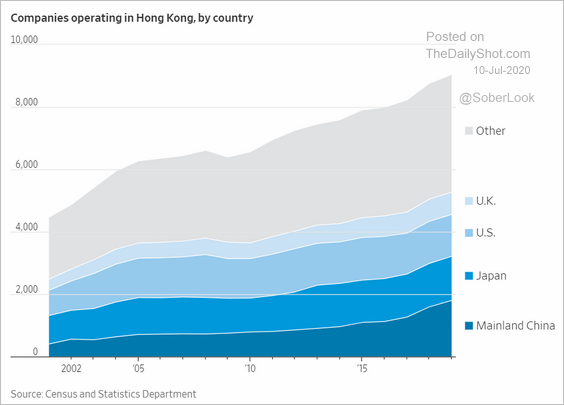 Source: @WSJ Read full article
• Hong Kong’s central bank stepped in to weaken the currency amid hot IPO capital inflows.
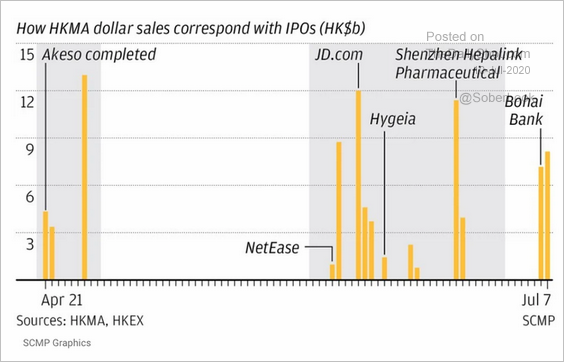 Source: South China Morning Post, @adam_tooze Read full article
• A second wave?
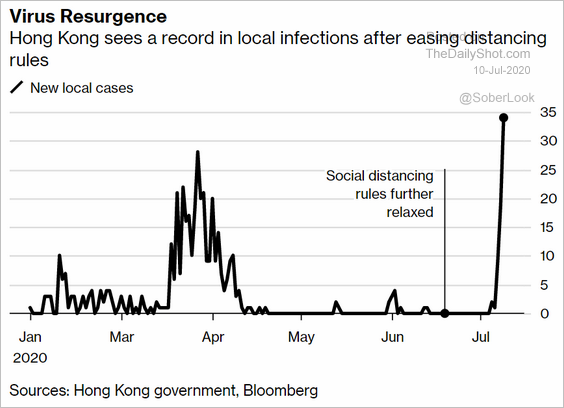 Source: @bpolitics Read full article
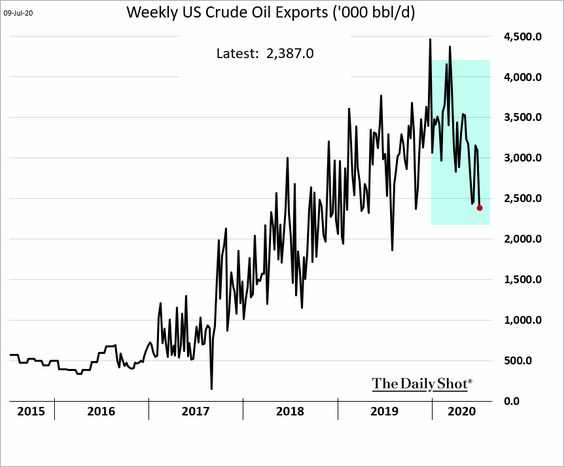
Energy
1. US crude oil exports are rolling over.
2. US gasoline demand has almost recovered.
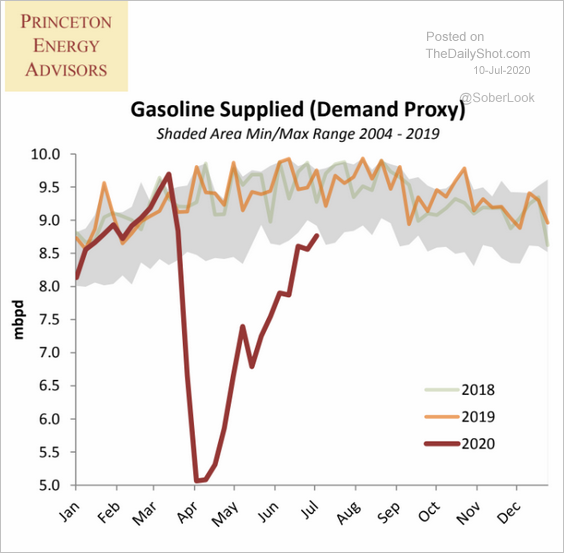 Source: Princeton Energy Advisors
And refinery inputs are improving.
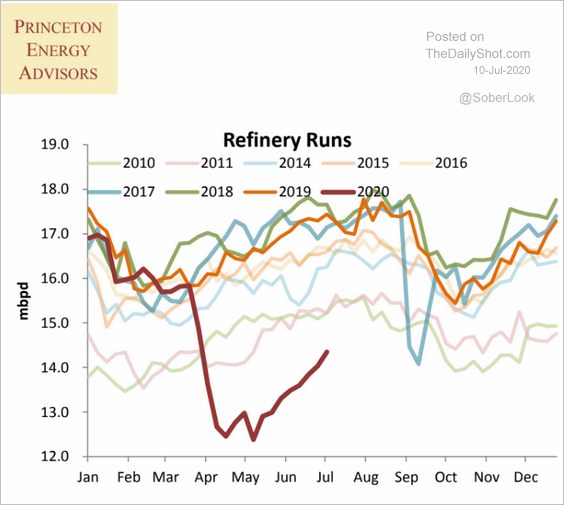 Source: Princeton Energy Advisors
——————–
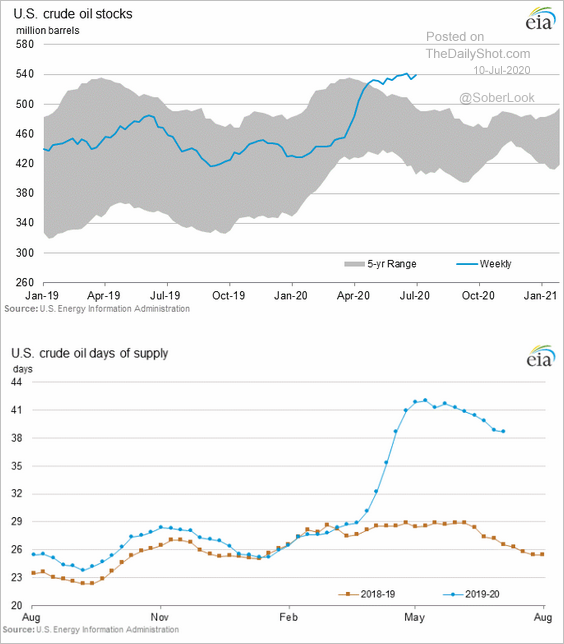
3. US crude oil inventories remain elevated.
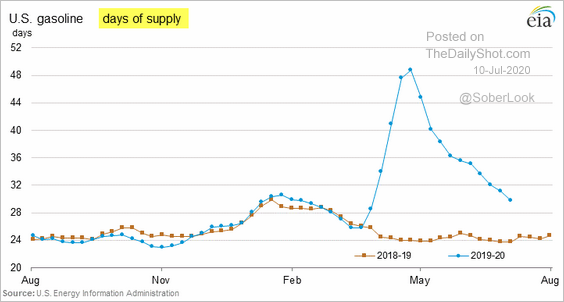
But gasoline stockpiles (measured in days of supply) keep falling.
Equities
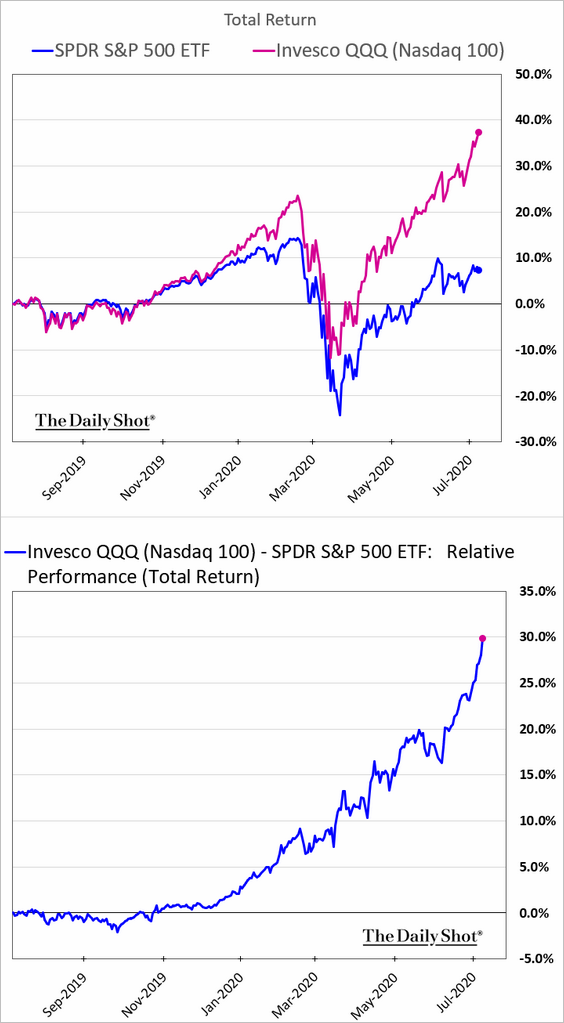
1. The Nasdaq Composite and Nasdaq 100 hit new records.
• The Nasdaq 100 has outperformed the S&P 500 by 30% over the past 12 months, with most divergence taking place this year.
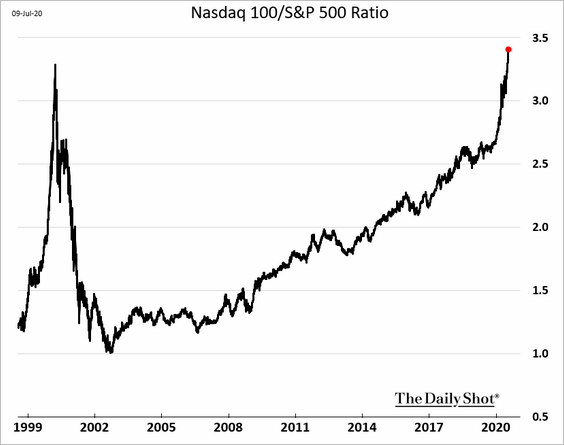
Here is the Nasdaq 100/S&P 500 ratio over the past couple of decades.
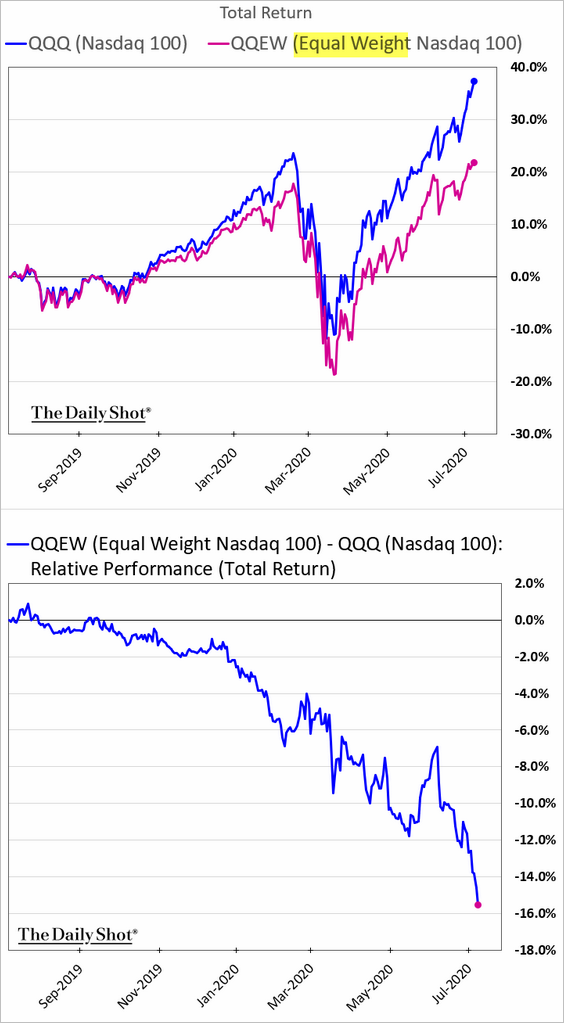
• And it’s the tech mega-caps that have been driving the outperformance. The equal-weight index is increasingly lagging.
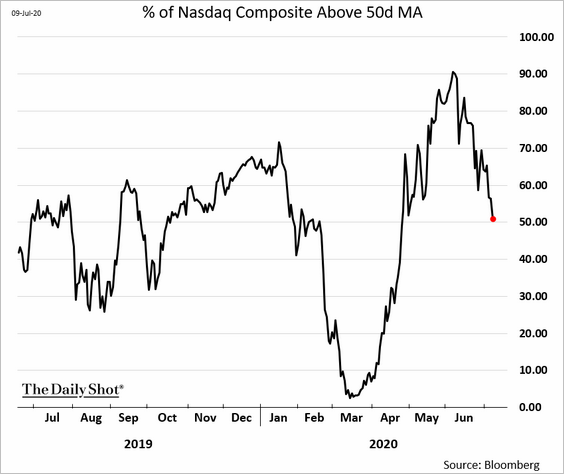
• In fact, the Nasdaq Composite’s breadth is rolling over.
 h/t Nancy Moran
• The giant tech companies’ remarkable rally is reflected in the “lockdown” portfolio outperformance.
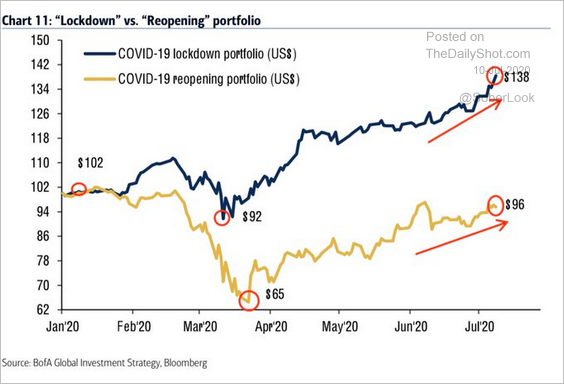 Source: BofA Merrill Lynch Global Research, @WallStJesus
——————–
2. How correlated is the S&P 500 with Treasury yields and credit spreads?
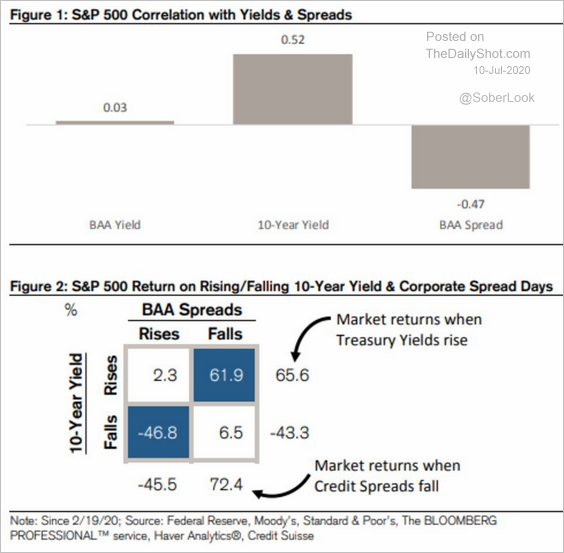 Source: @johnauthers, @bopinion Read full article
The inverse correlation between the S&P 500 and the US dollar has strengthened lately.
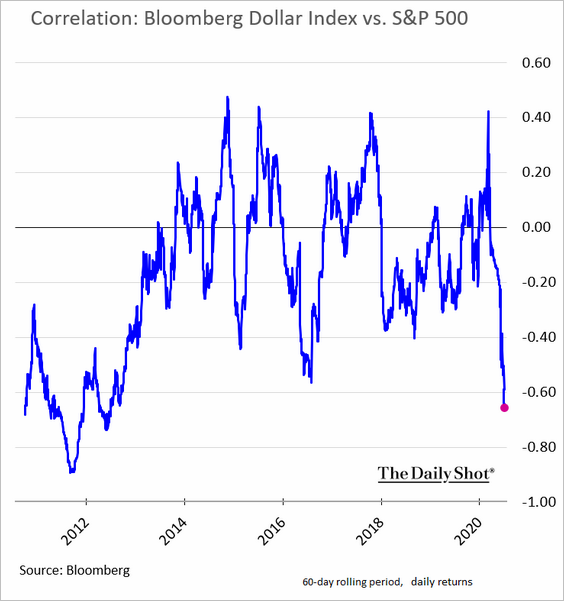 Source: Further reading
——————–
3. Many companies slashed dividends this year.
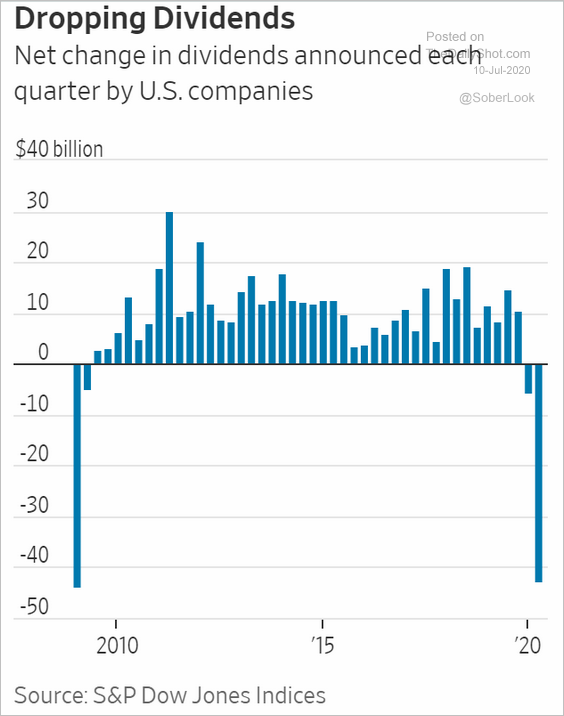 Source: @WSJ Read full article
But investor expectations for dividend payments for 2020 through 2022 have become more optimistic as equities rallied from their March lows.
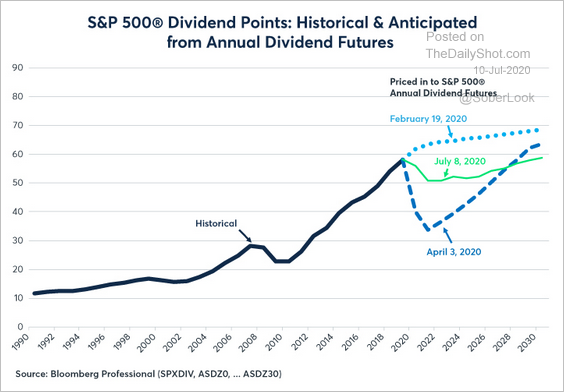 Source: CME Group Read full article
——————–
4. Hedge funds have been short cyclical shares this year.
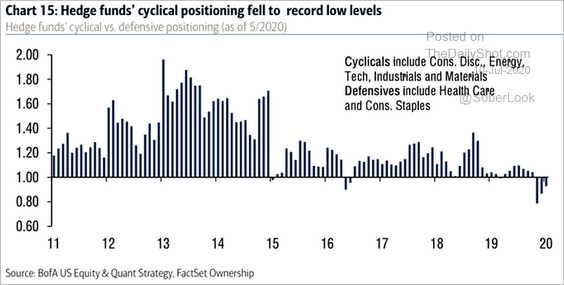 Source: @ISABELNET_SA, @BofAML
Credit
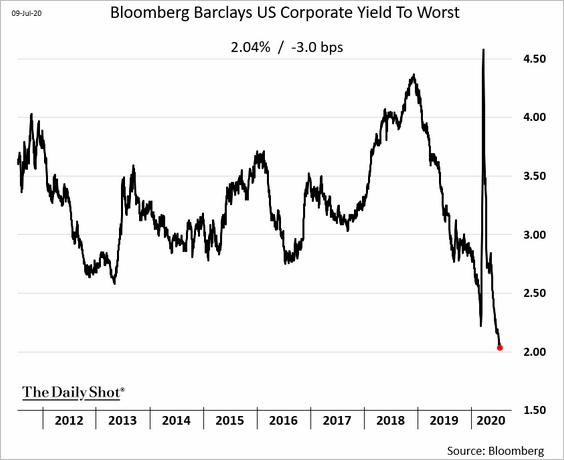
1. US investment-grade corporate spreads continue to tighten.
2. Middle-market borrowers’ credit quality has deteriorated in recent months.
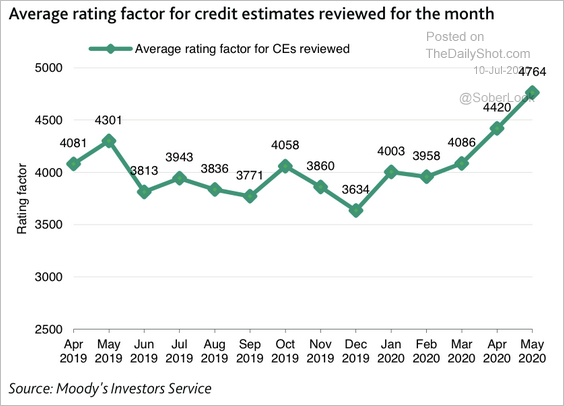 Source: Moody’s Investors Service
3. A significant portion of middle-market CLO collateral is in moderately vulnerable sectors.
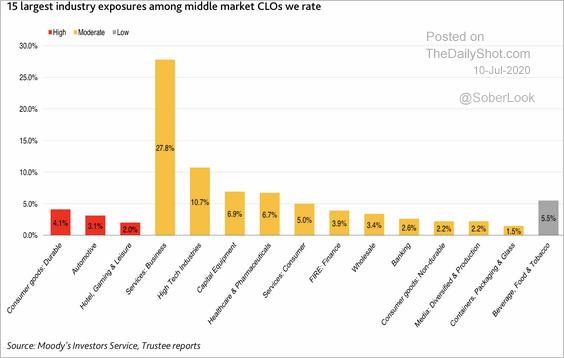 Source: Moody’s Investors Service
Rates
1. The 10yr Treasury yield has been consolidating.
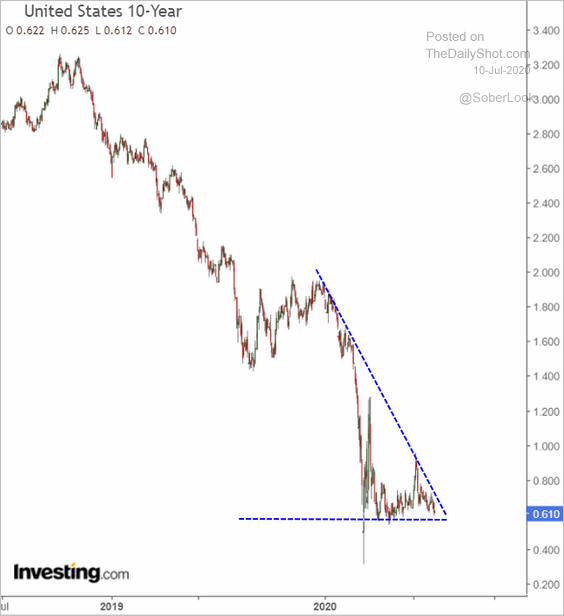 h/t @themarketear
2. The new 30yr Treasury demand was stronger than expected on Thursday, with the auction yield near record lows.
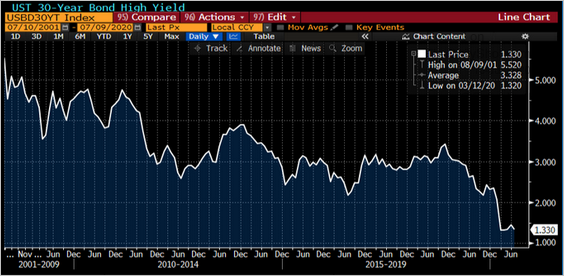 Source: @lisaabramowicz1
Global Developments
1. This chart shows fund flow winners by year.
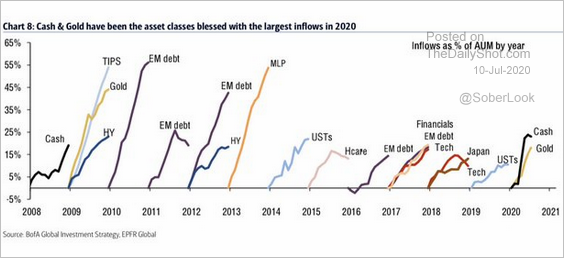 Source: BofA Merrill Lynch Global Research, @WallStJesus
2. Despite the risk-asset rally, defensive assets are in demand.
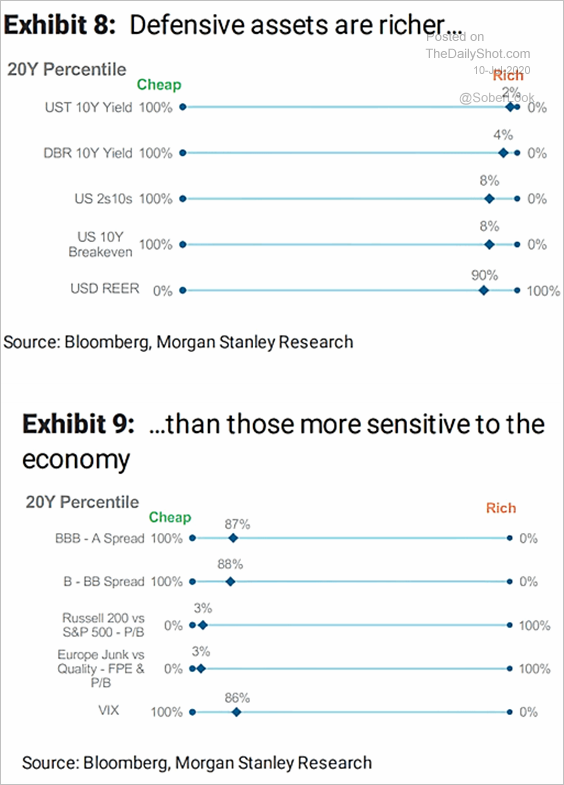 Source: @ISABELNET_SA, @MorganStanley
3. Previous pandemics point to a rise in income inequality as the burden of economic adjustment falls disproportionately on low-skilled workers, according to Oxford Economics.
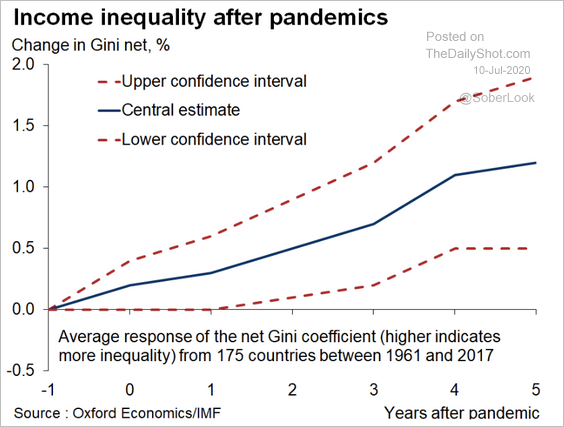 Source: Oxford Economics
——————–
Food for Thought
1. Displaced people worldwide (2 charts):
 Source: The Economist Read full article
 Source: Statista
——————–
2. Trade openness index:
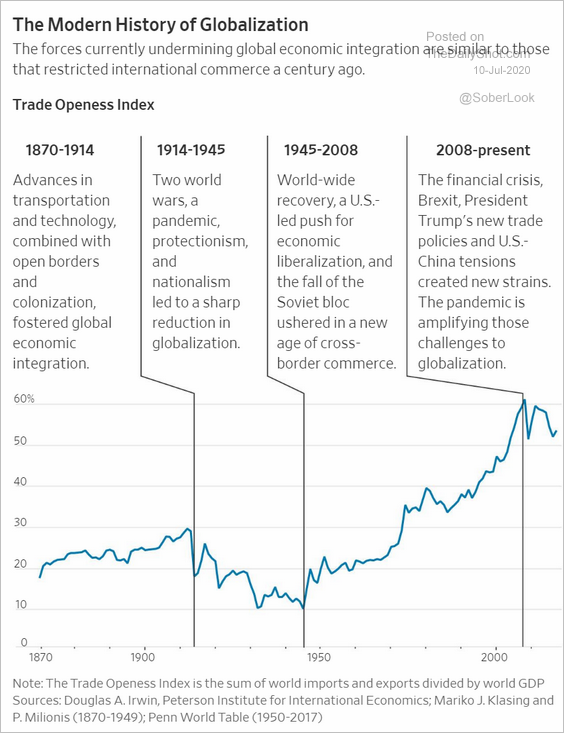 Source: @WSJ Read full article
3. US Postal Service workers:
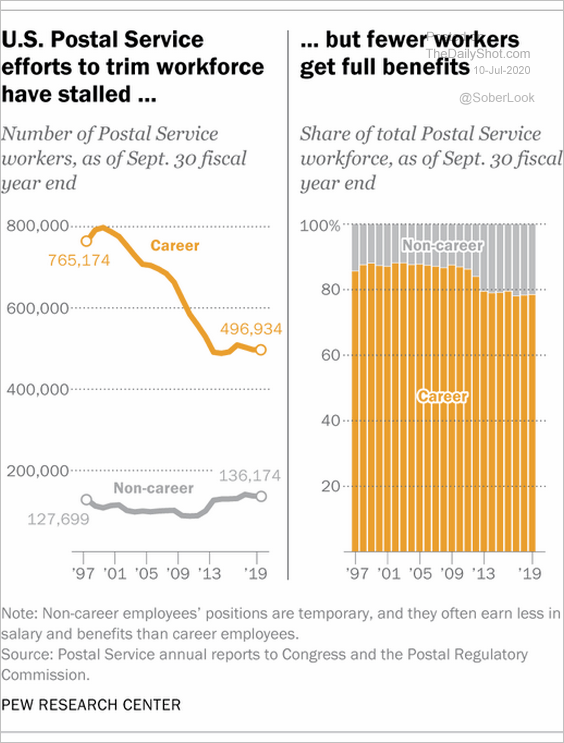 Source: @pewresearch Read full article
4. Waiving the SAT:
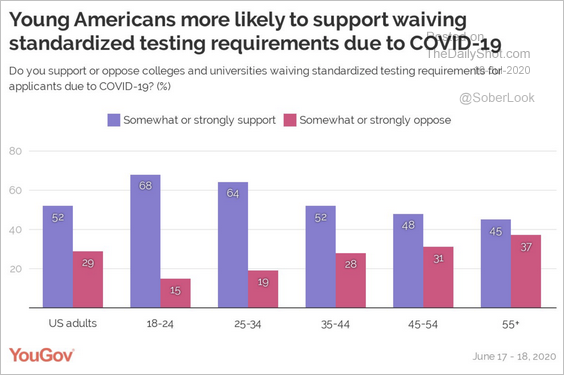 Source: YouGov Read full article
5. Coronavirus death rates for the US and Mexico:
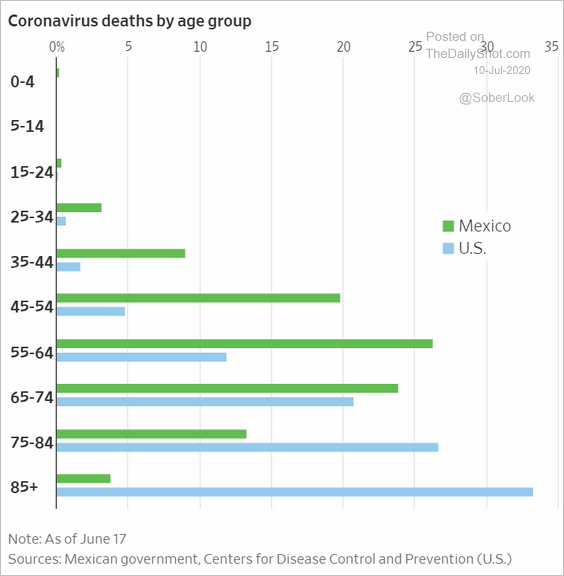 Source: @WSJ Read full article
6. SNAP participation:
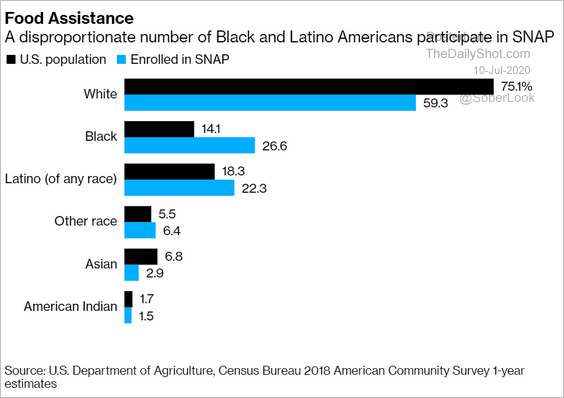 Source: @markets Read full article
7. Key issues facing the US:
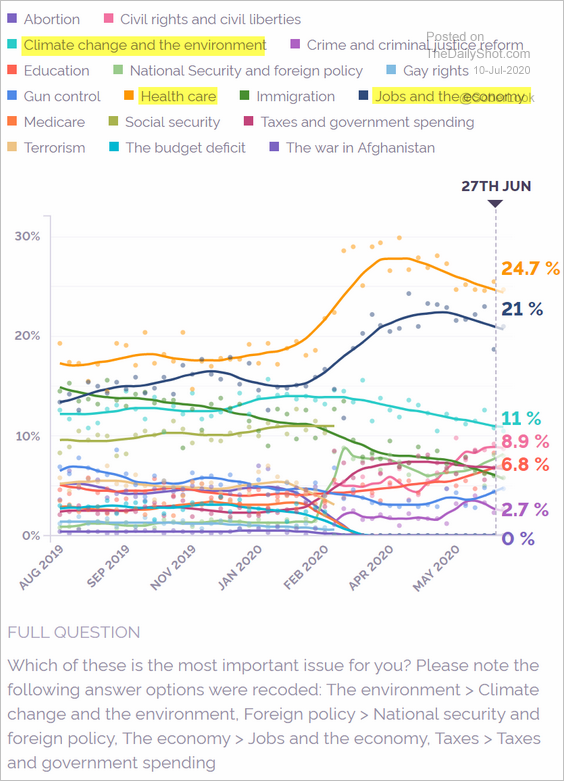 Source: @YouGovAmerica Read full article
8. Time spent on social media:
 Source: Statista
9. Spending evenings reading:
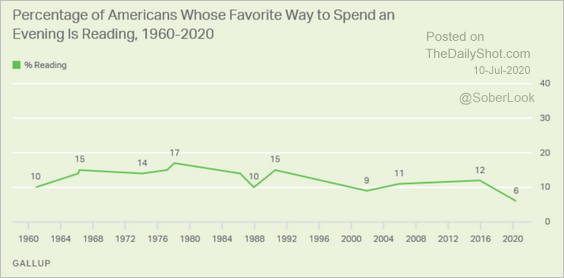 Source: Gallup Read full article
——————–
Have a great weekend!