
The Daily Shot: 15-Jul-20
• The United States
• The United Kingdom
• The Eurozone
• Asia – Pacific
• China
• Emerging Markets
• Commodities
• Equities
• Credit
• Rates
• Global Developments
• Food for Thought
The United States
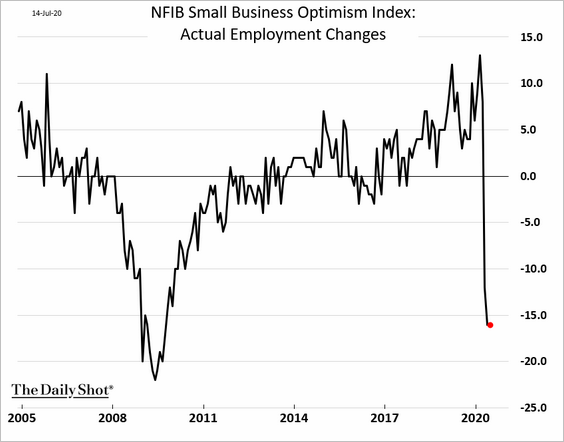
1. Let’s begin with the NFIB small business optimism index, which topped economists’ estimates.
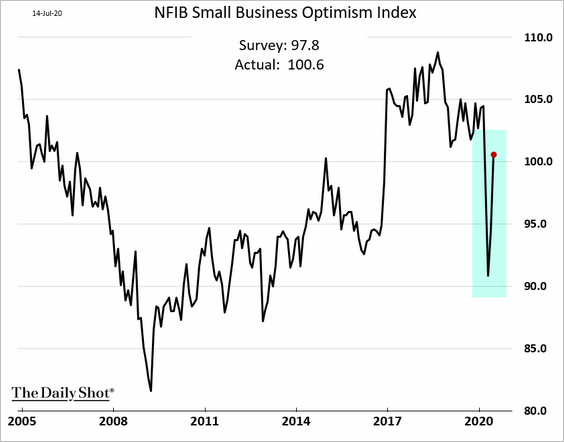
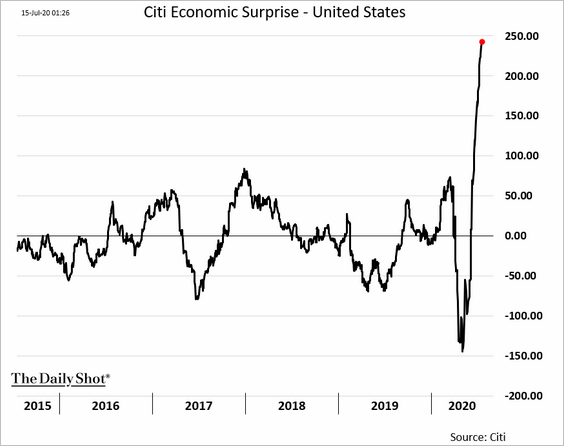
The report further strengthened the Citi Economic Surprise Index, which keeps hitting record highs.
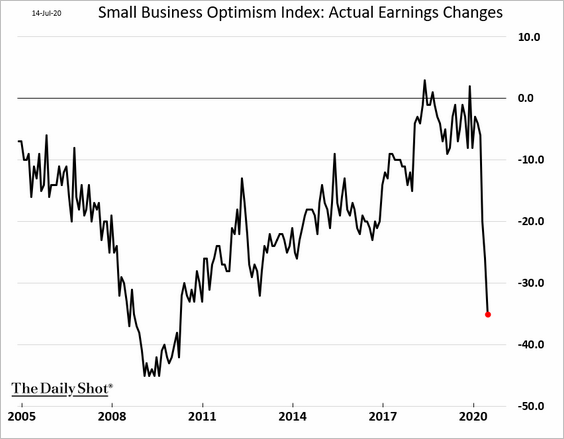
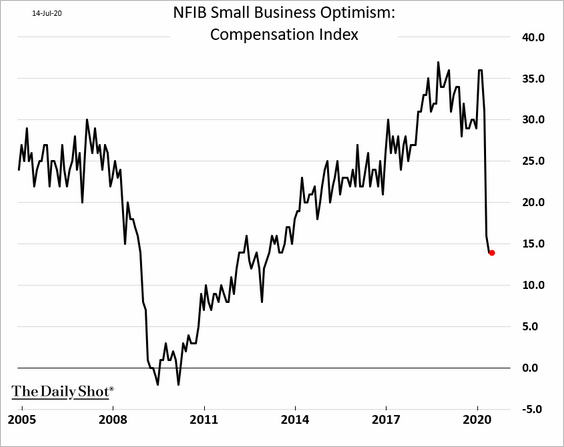
• Small firms continue to struggle, with indicators of current conditions remaining weak in June.
– Earnings:
– Compensation:
– Employment:
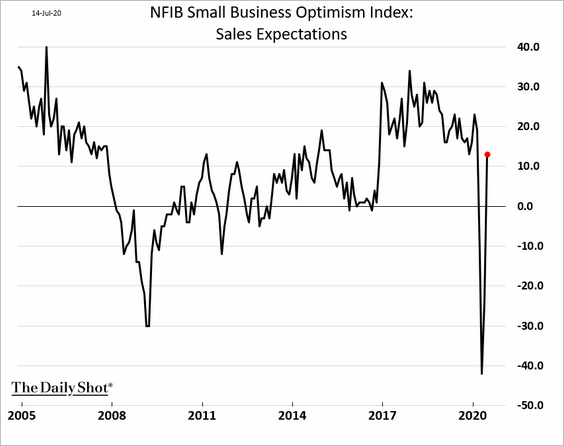
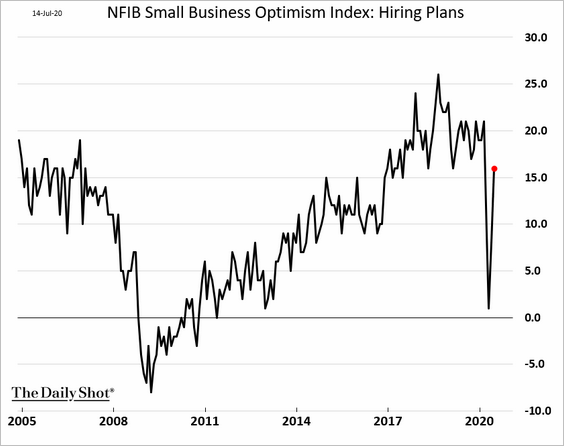
However, business owners have become more upbeat about future growth.
– Sales expectations:
– Hiring plans:
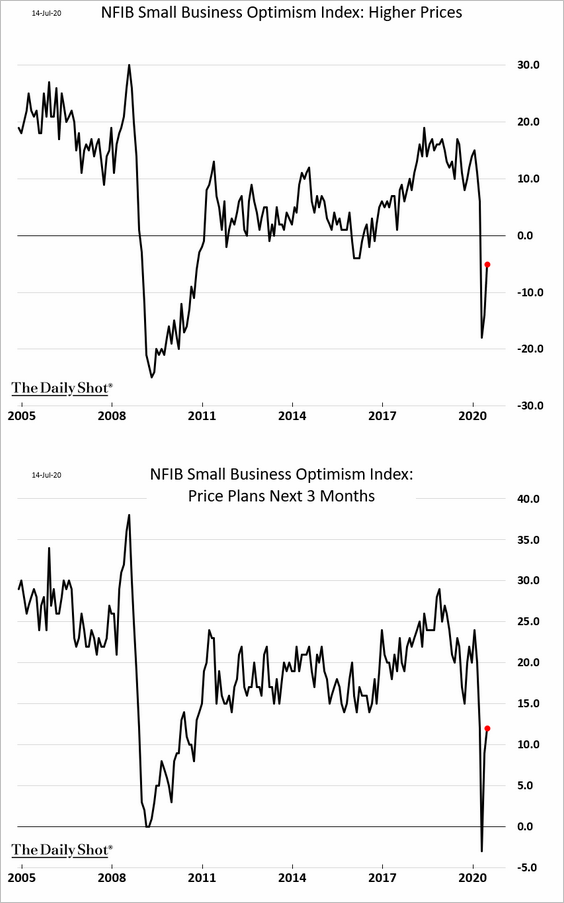
– Pricing plans:
– Outlook:
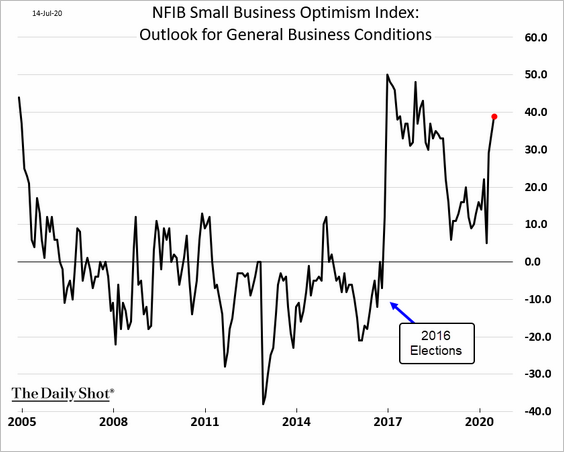
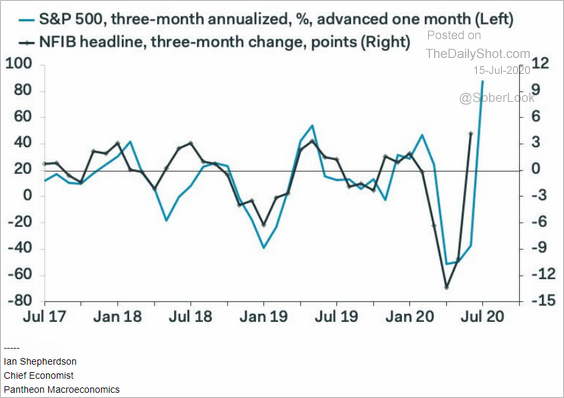
• One of the main drivers of this optimism has been the stock market rally.
 Source: Pantheon Macroeconomics
——————–
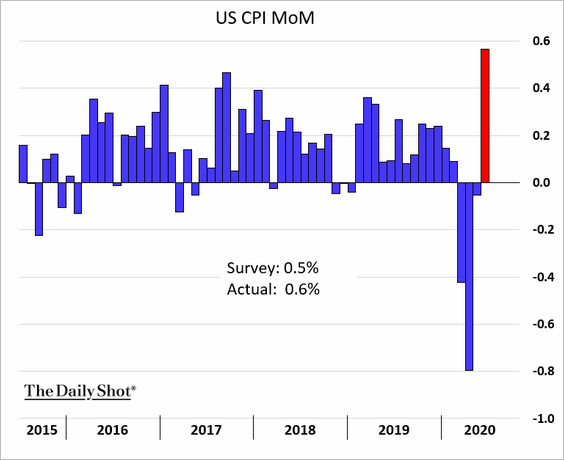
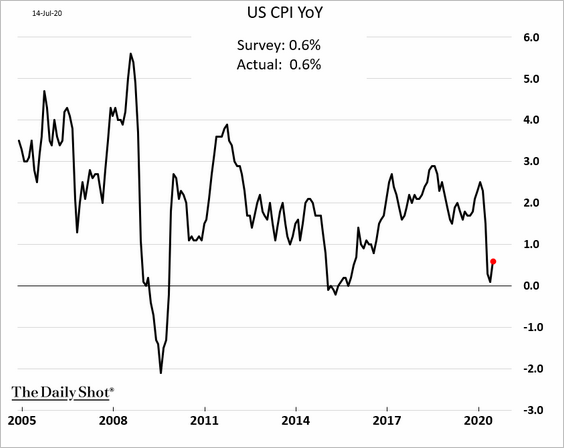
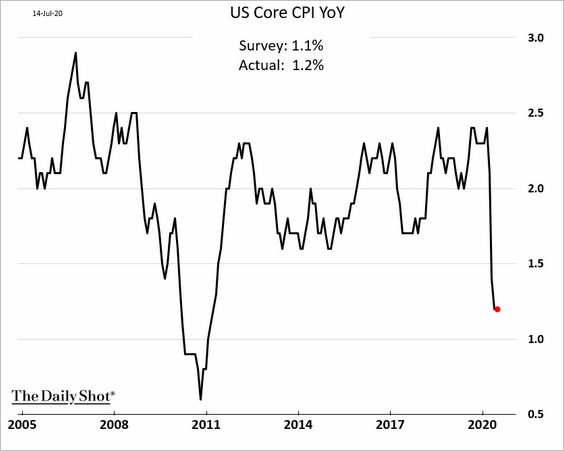
2. Next, let’s take a look at the June CPI report.
• The headline CPI increased, driven by the recovery in fuel costs and soaring food prices.
– Month-over-month:
– Year-over-year:
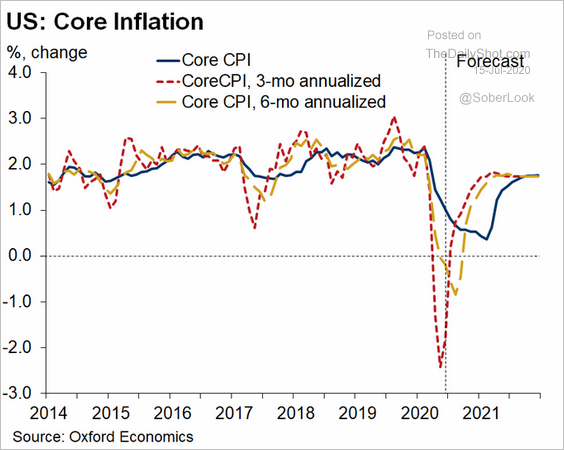
• The core CPI has been moderating.
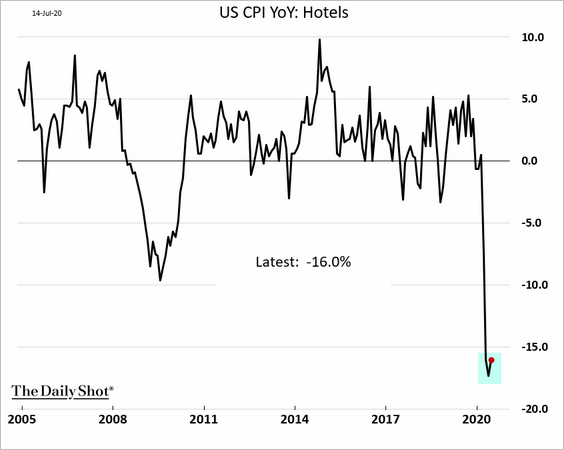
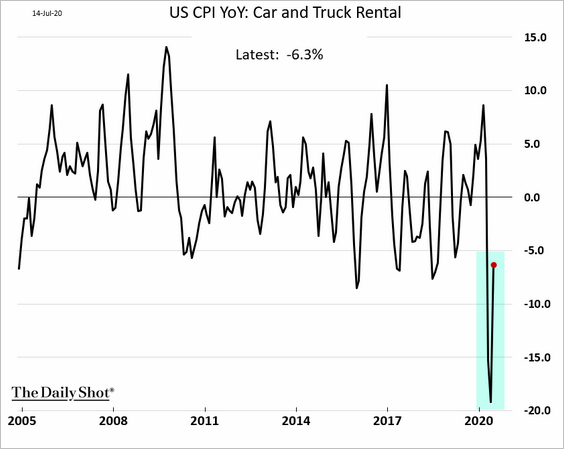
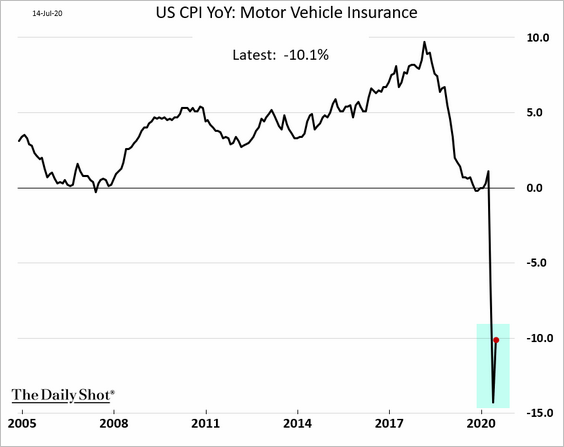
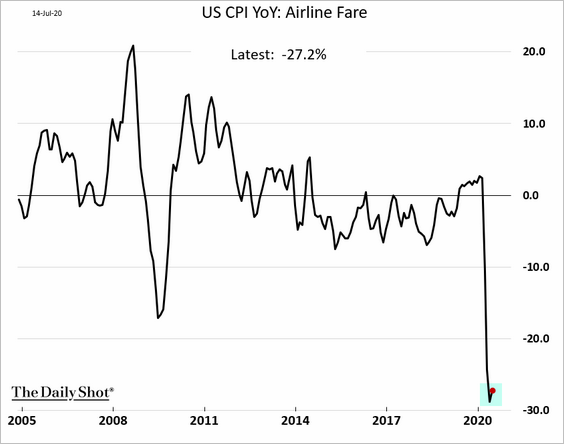
• Sectors hit hard by the lockdowns mostly saw at least some recovery in prices.
– Hotels:
– Car rental:
– Auto insurance:
– Airline fare (barely):
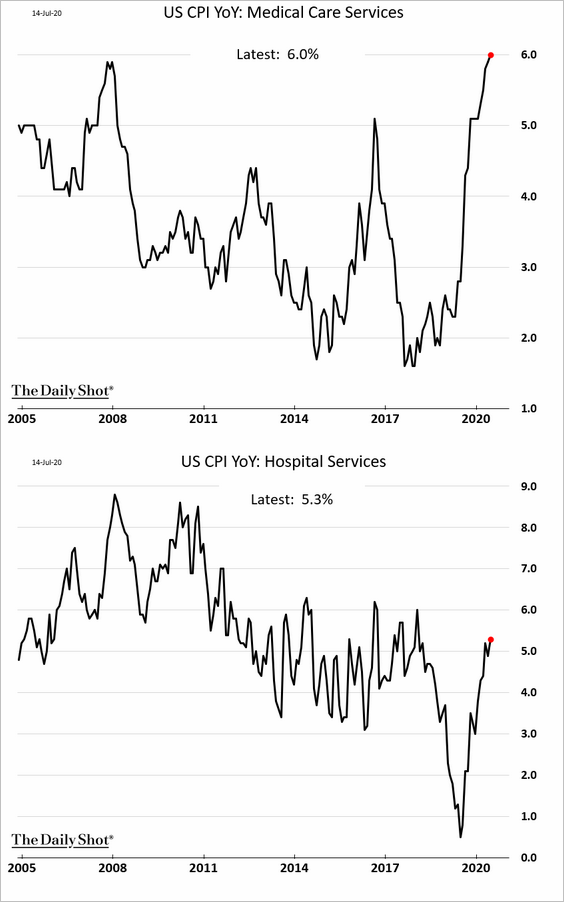
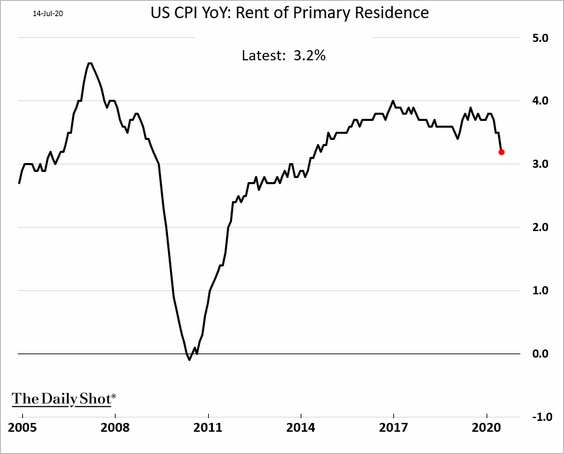
• The core CPI has been getting a boost from medical care but was dragged lower by rent.
– Medical care:
– Rent (see charts from Nomura):
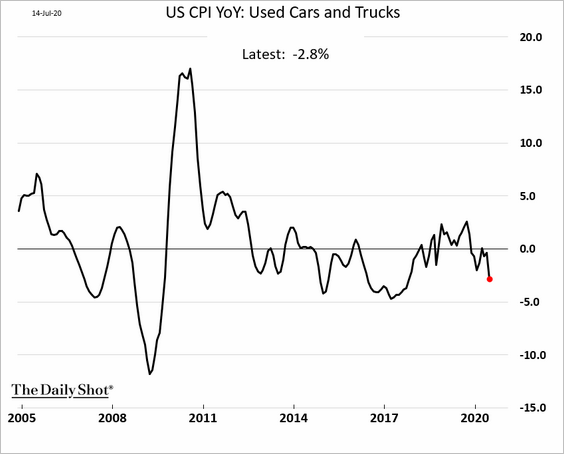
– Used car prices declined as well, but leading indicators point to a rebound in the months ahead.
• Food prices have been soaring, driven by meat and eggs.
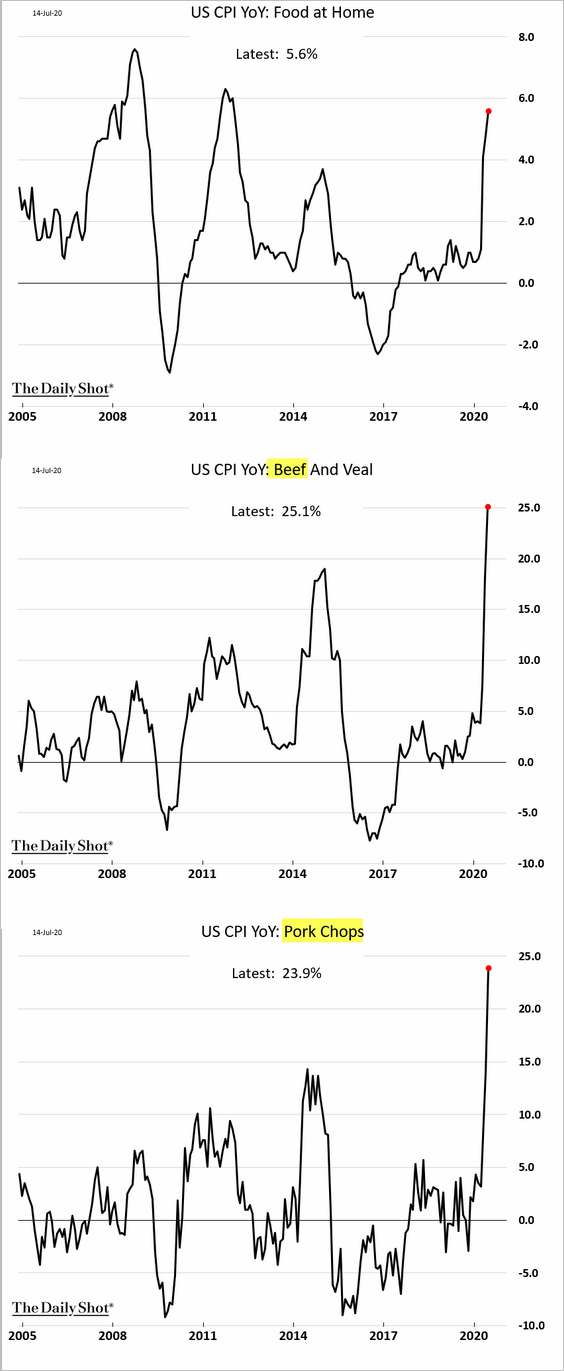
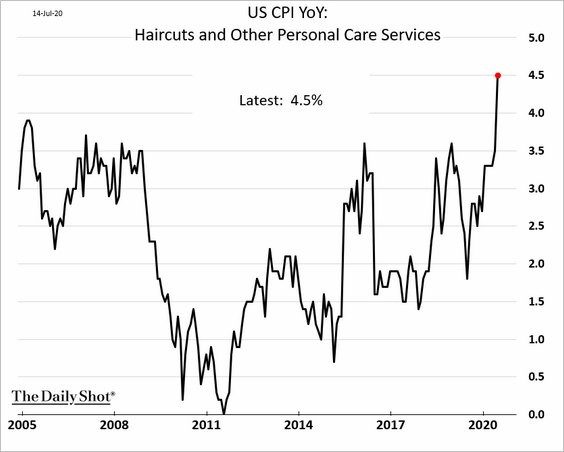
• Here is another consequence of the pandemic.
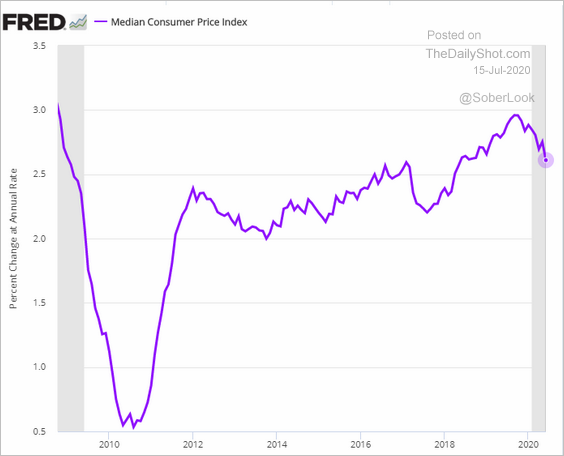
• The median CPI has been moderating but is still above 2.5%.
• Here is the core CPI forecast from Oxford Economics.
 Source: @GregDaco
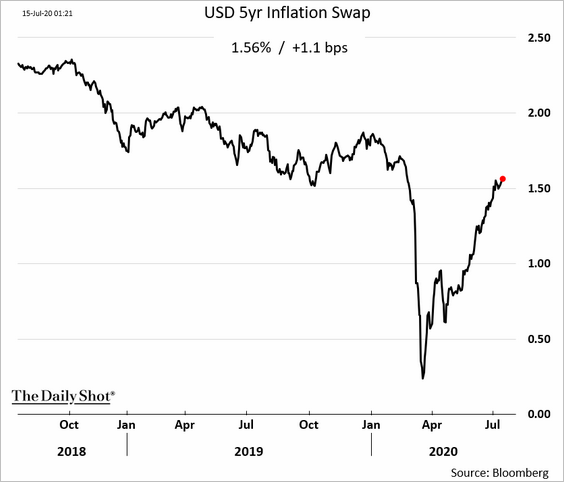
• Market-based inflation expectations have nearly recovered from the pandemic-led decline.
Demand for ETFs that invest in inflation-protected Treasuries has been robust.
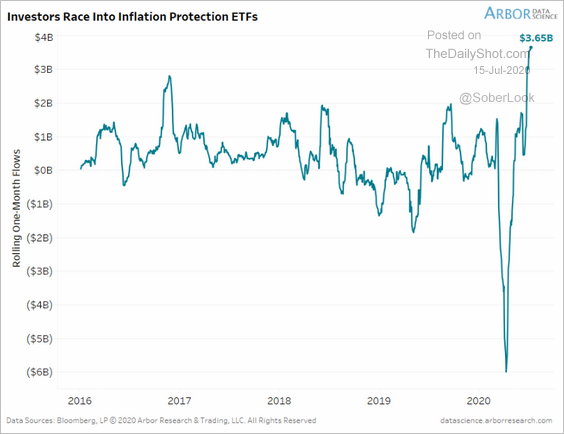 Source: Arbor Research & Trading
——————–
3. US mortgage delinquencies are soaring. The chart below doesn’t include mortgages that are in forbearance.
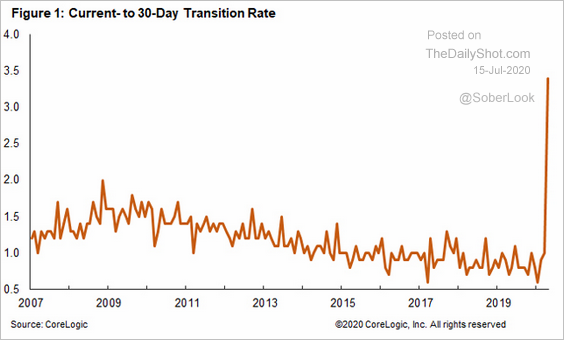 Source: CoreLogic
Here are the states with the highest and lowest percentage of past-due mortgages.
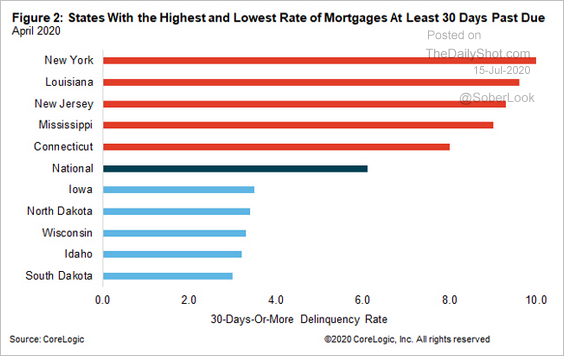 Source: CoreLogic
The United Kingdom
1. The May GDP uptick was disappointing (2 charts).
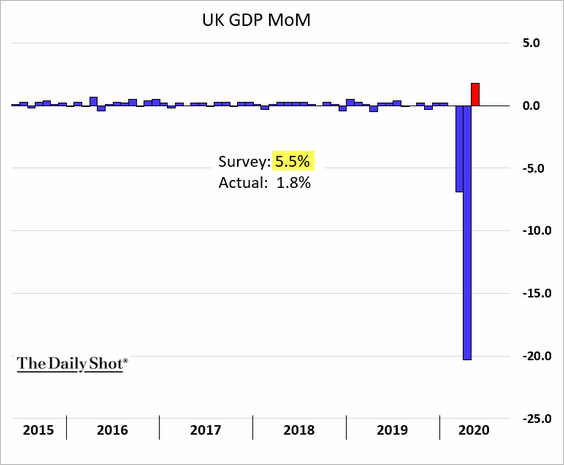
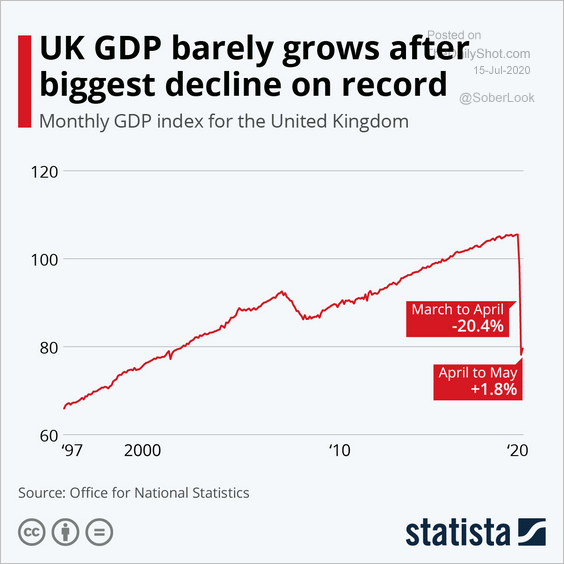 Source: Statista
• Here are the GDP components.
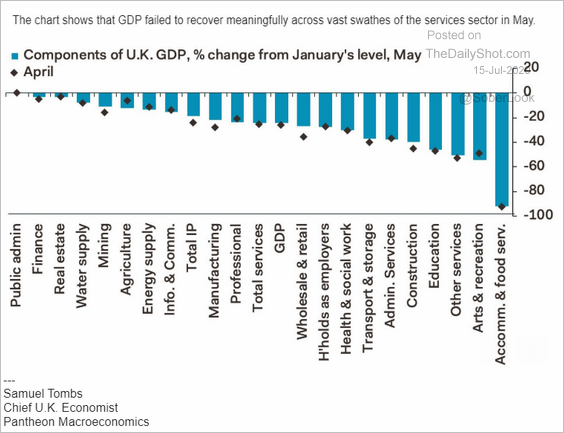 Source: Pantheon Macroeconomics
• The PMI measure has been overstating the strength of the recovery.
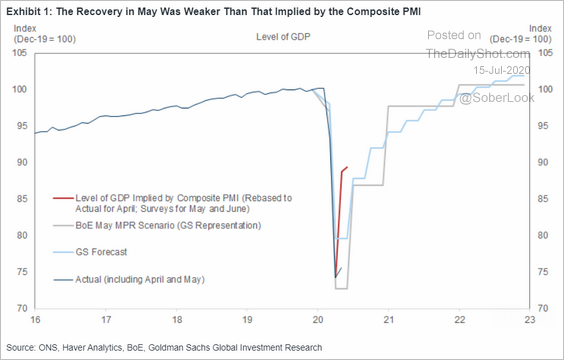 Source: Goldman Sachs
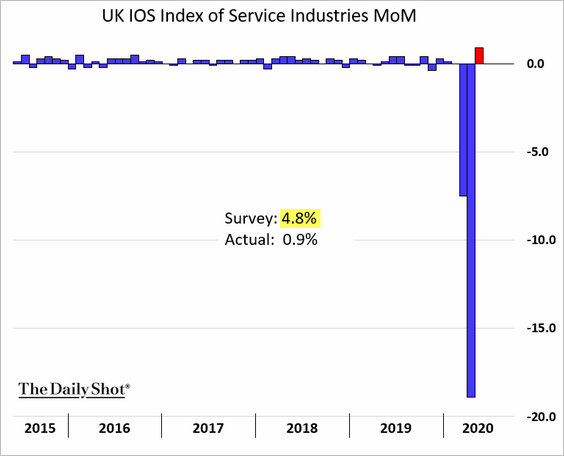
• The downside surprise in the GDP report was driven by services.
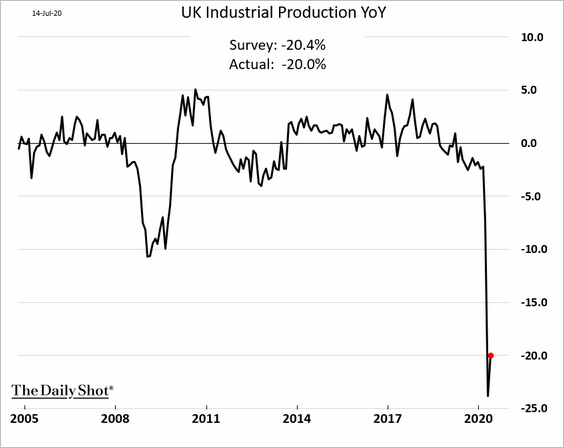
• Industrial production was still 20% below last year’s levels.
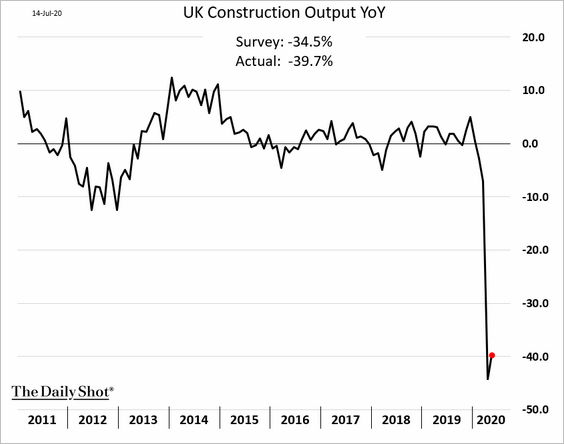
• Construction output remained exceptionally weak.
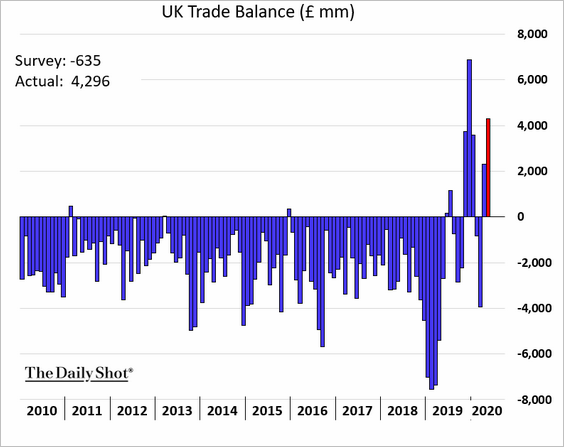
• Trade balance was in surplus in May.
——————–
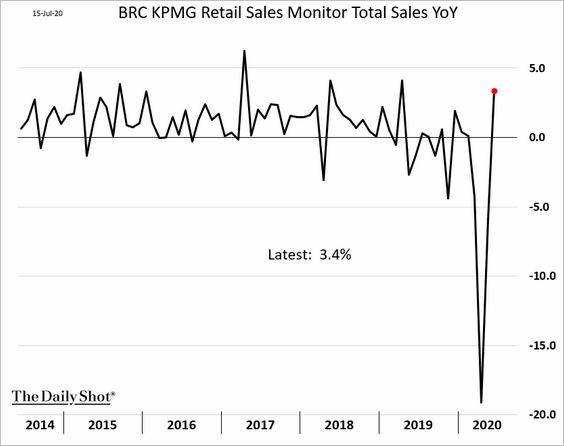
2. The BRC retail sales indicator recovered last month. Will retail sales maintain momentum?
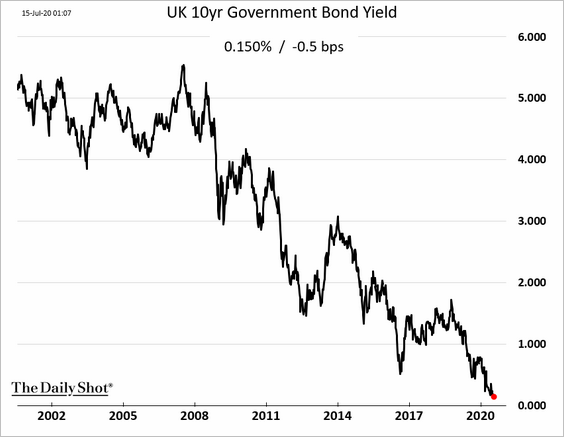
3. Gilt yields continue to tumble.
• 2yr gilts vs. JGBs:
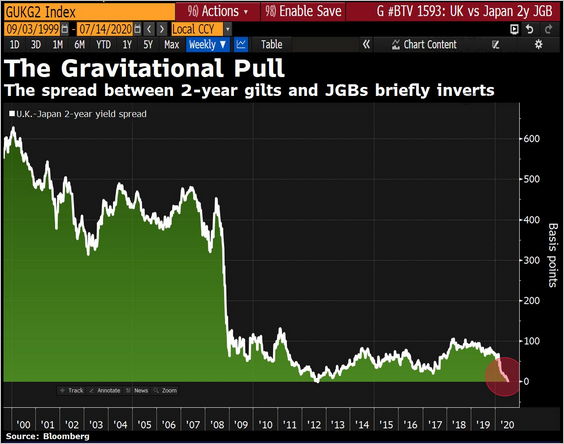 Source: @DavidInglesTV
• The 10yr yield over the past two decades:
——————–
4. Britons are now less comfortable with public transportation than they were a month ago.
 Source: YouGov Read full article
The Eurozone
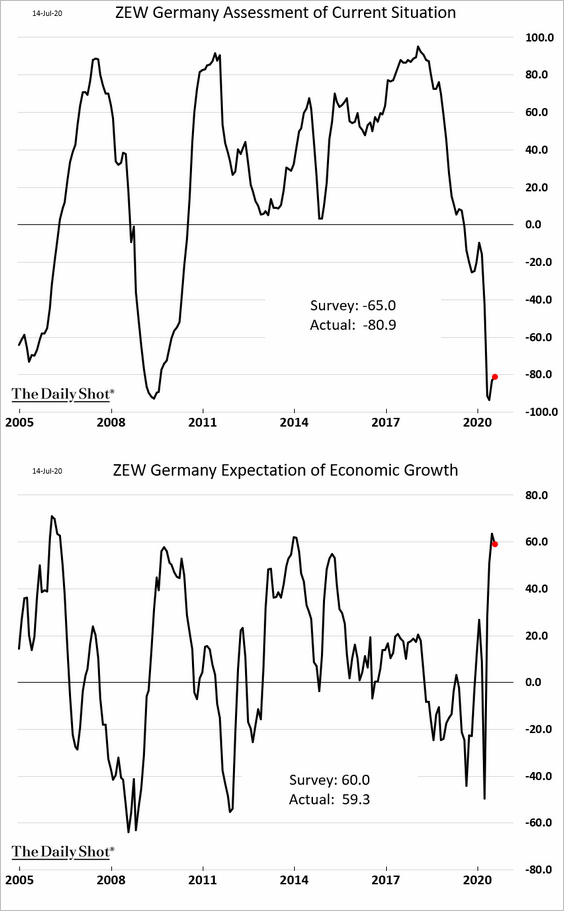
1. Let’s begin with Germany.
• The ZEW indicator shows weak current conditions but optimism about future growth.
• Here is the composition of Germany’s core CPI.
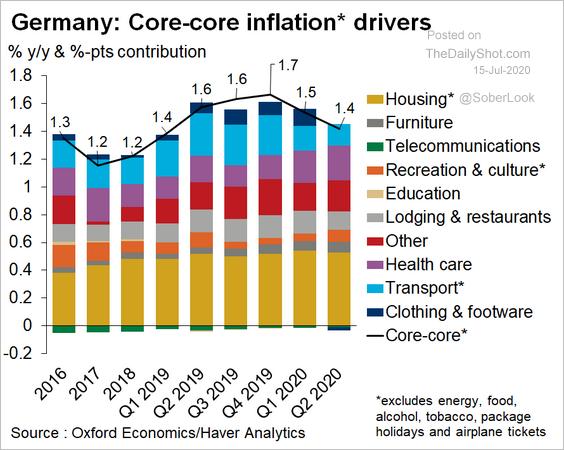 Source: @OliverRakau
• Technicals show the German stock-to-bond ratio is now extended, suggesting that a short-term reversal is near.
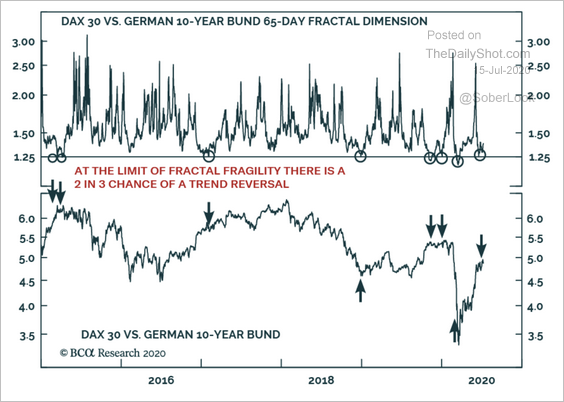 Source: BCA Research
——————–
2. The euro-area industrial production bounced in May but remained fragile.
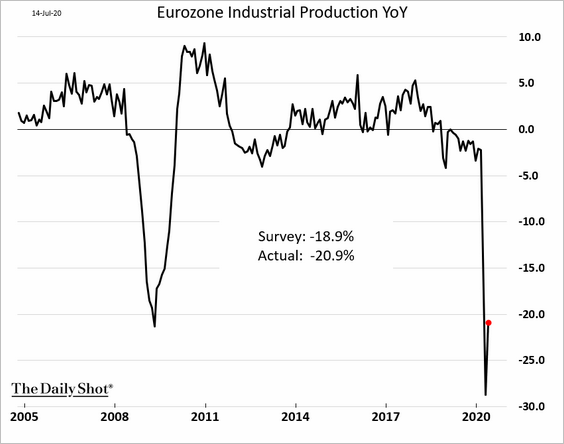
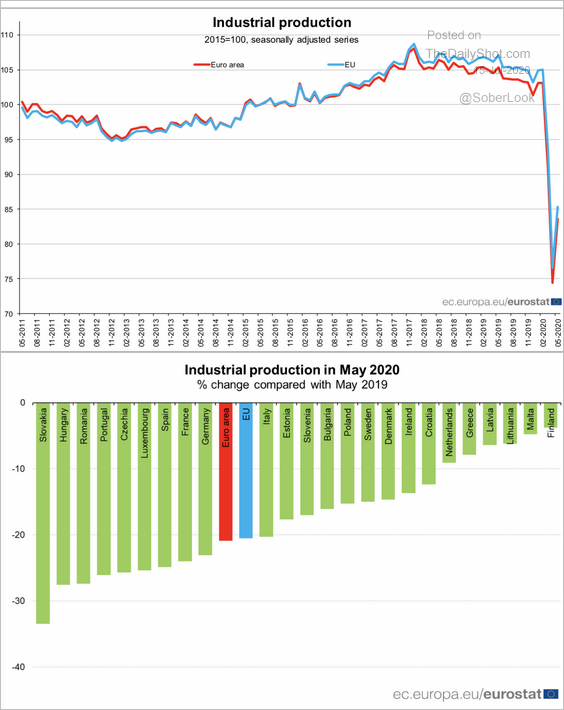 Source: Eurostat
——————–
3. Aside from Italy, yield spreads of 10-year government bonds in the Eurozone periphery are now near their post-financial crisis lows.
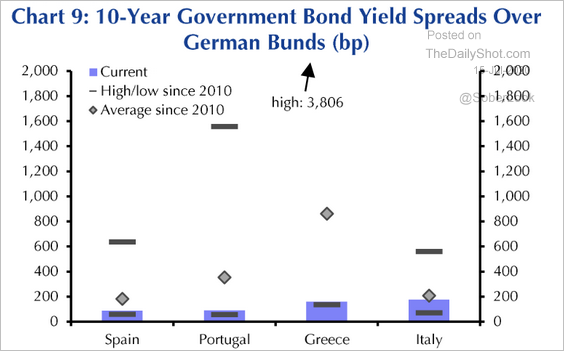 Source: Capital Economics
Asia – Pacific
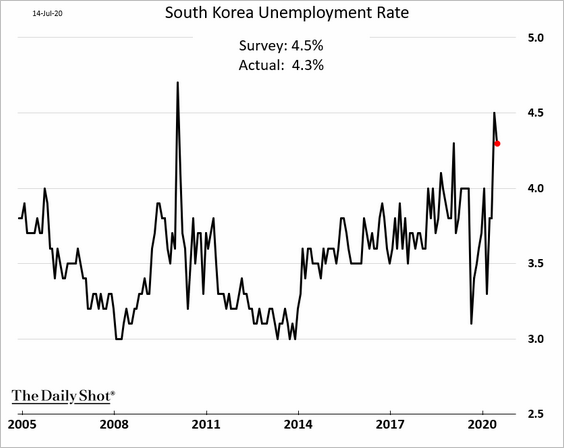
1. South Korea’s unemployment rate declined from multi-year highs.
Separately, a bottom in trade flows could support the South Korean won.
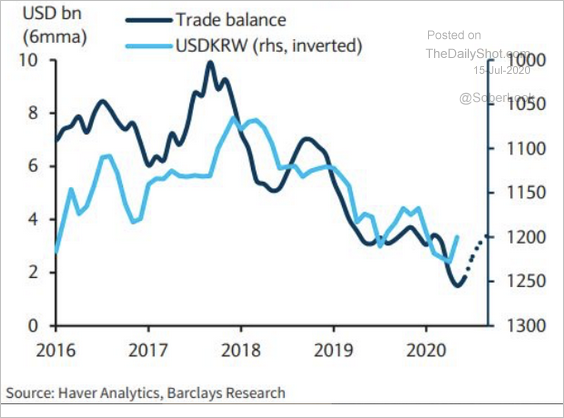 Source: Barclays Research
——————–
2. As discussed yesterday, Australia’s consumer confidence took a turn for the worse.
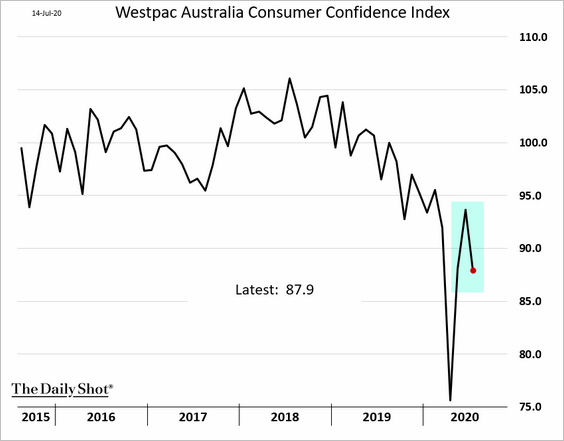
High-frequency indicators show a loss of momentum in Australia’s labor market.
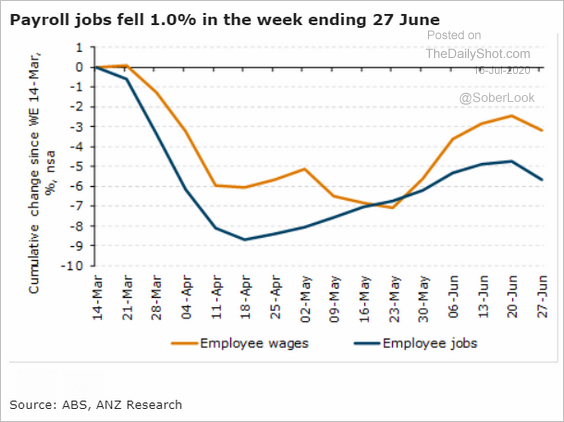 Source: ANZ Research
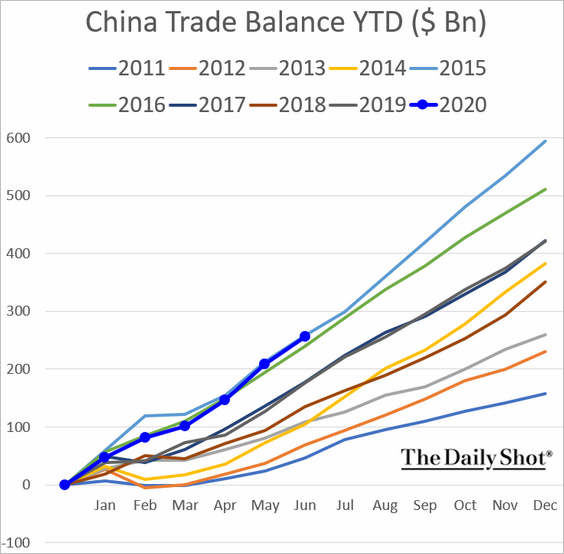
China
1. The nation’s trade surplus is near multi-year highs on a year-to-date basis.
2. The GDP is expected to rebound in the second quarter.
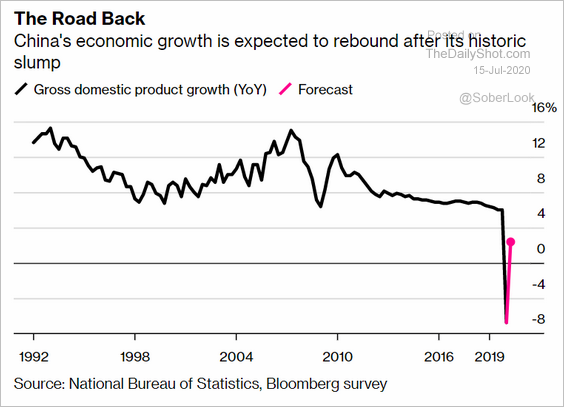 Source: @markets Read full article
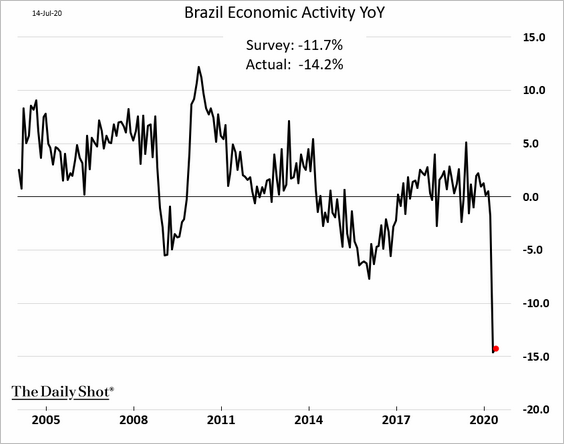
Emerging Markets
1. Brazil’s economic activity barely budged in May.
2. Russia’s corporations have been borrowing abroad.
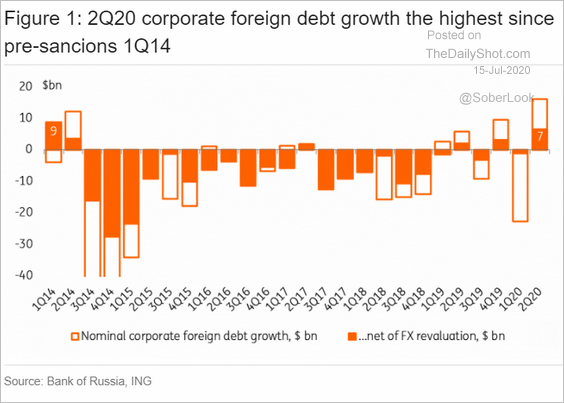 Source: ING
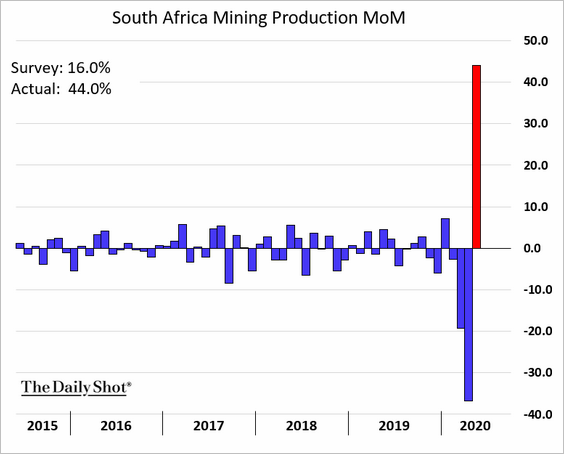
3. South Africa’s mining production surprised to the upside.
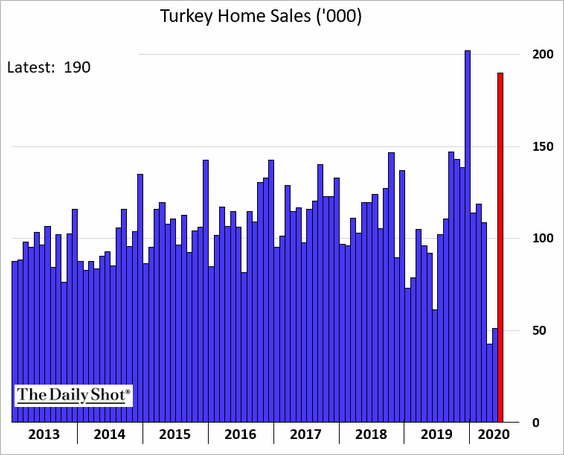
4. Turkey’s home sales rebounded, driven by low mortgage rates.
5. This chart shows the GDP forecast for the Middle East and North Africa (MENA) countries.
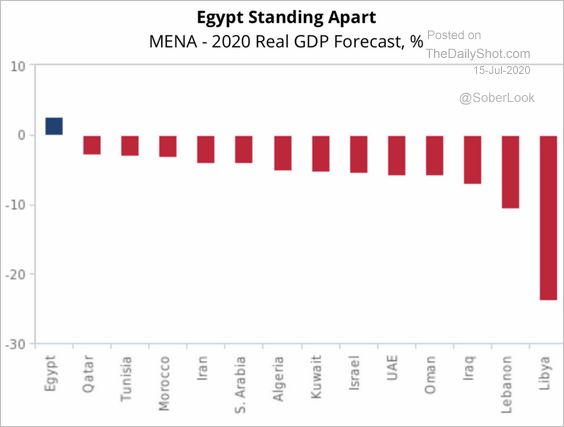 Source: Fitch Solutions Macro Research
Commodities
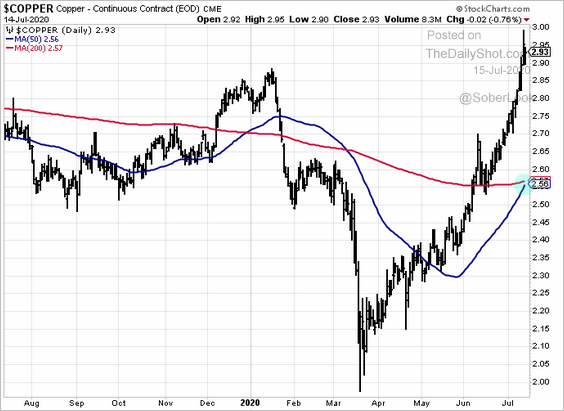
1. Technical indicators point to additional upside for copper (golden cross).
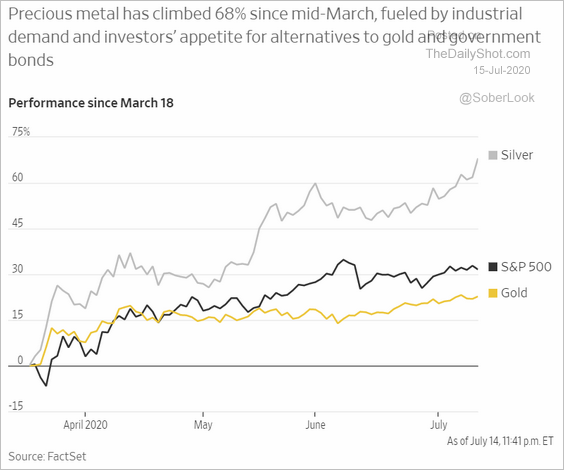
2. Silver has been outperforming.
 Source: @WSJ Read full article
Equities
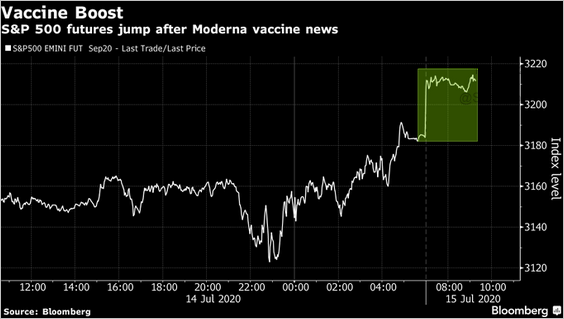
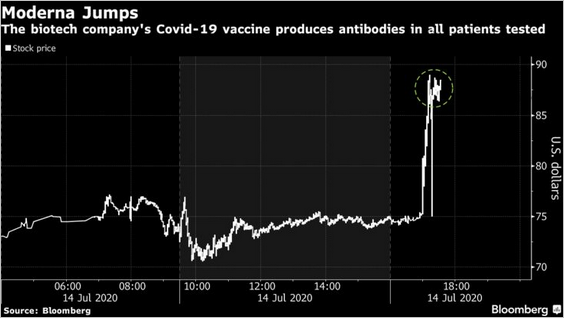
1. US futures are up in response to the latest vaccine news.
 Source: @markets Read full article
 Source: CNBC Read full article
 Source: @business Read full article
——————–
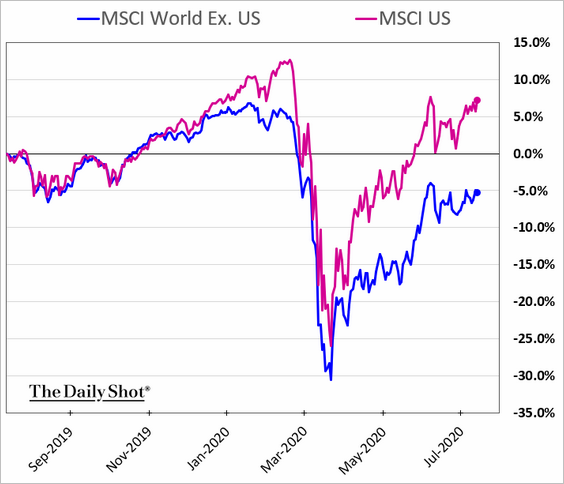
2. US shares continue to outperform the rest of the world.
3. Here is a summary of S&P 500 dividend cuts, suspensions, and increases, by sector.
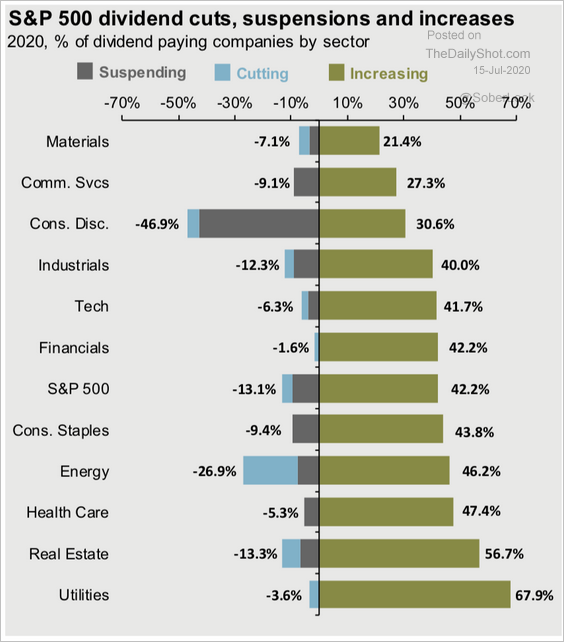 Source: J.P. Morgan Asset Management
And this chart shows dividend suspensions and decreases by market cap.
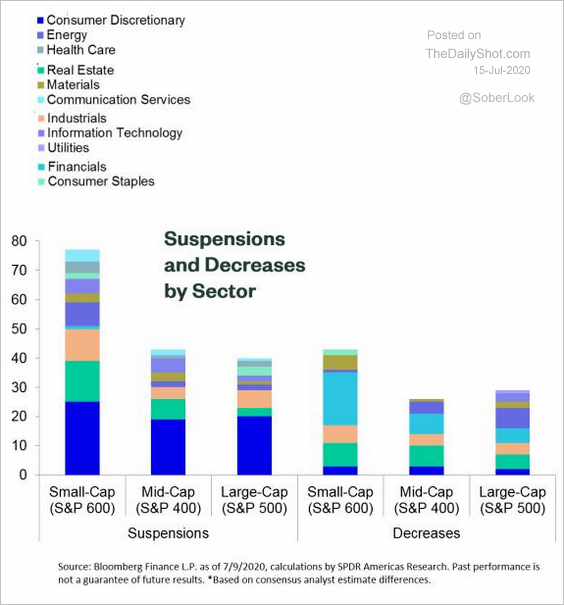 Source: SPDR Americas Research, @mattbartolini Read full article
——————–
4. Excluding the tech mega-caps, the S&P 500 recovery has been tepid.
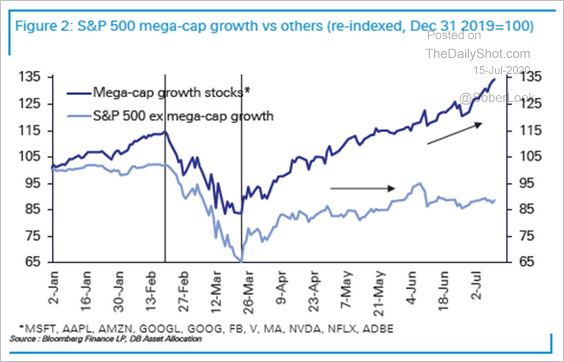 Source: Deutsche Bank Research
5. Here is the relative performance of companies that withdrew earnings guidance.
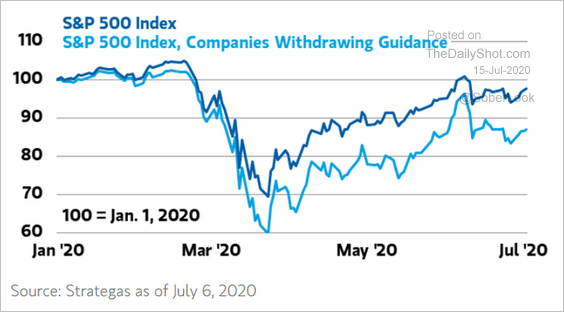 Source: @ISABELNET_SA, @MorganStanley
6. Based on cash levels, fund managers remain cautious.
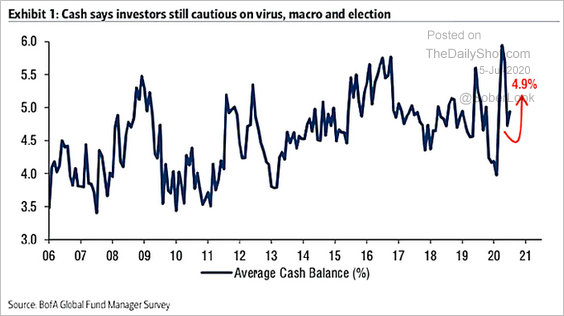 Source: @ISABELNET_SA, @BofAML
7. The put/call ratio continues to show bullish sentiment.
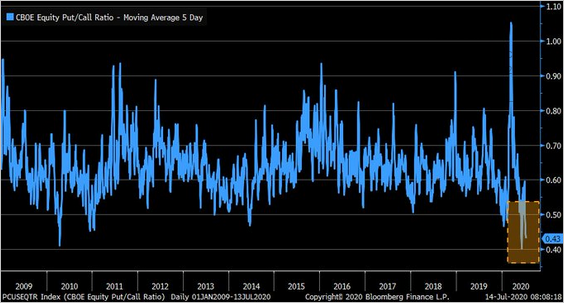 Source: @LizAnnSonders, @TheTerminal
8. On average, the S&P 500 tends to do well after its 50-day moving average crosses above its 200-day moving average (see chart).
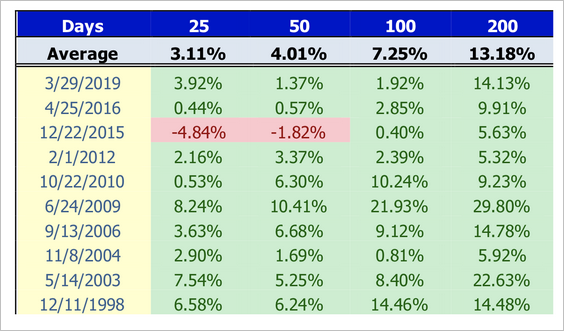 Source: Cantor Fitzgerald Market Strategy Team
9. Q2 earnings-per-share growth is expected to plunge to the worst levels since 2009 in aggregate. Given such low expectations, will earnings surprise to the upside?
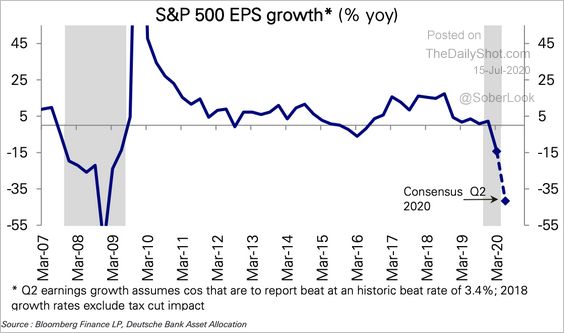 Source: Deutsche Bank Research
Here are Goldman’s forecasts vs. consensus.
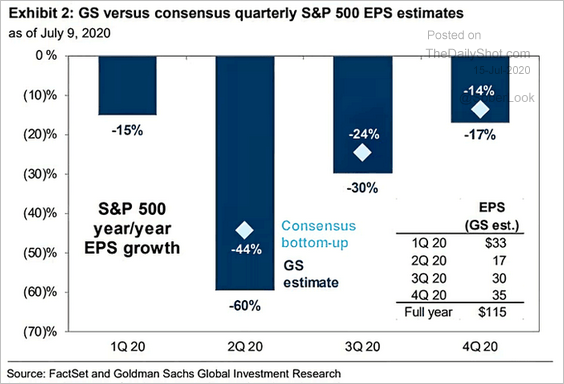 Source: @ISABELNET_SA, @GoldmanSachs
——————–
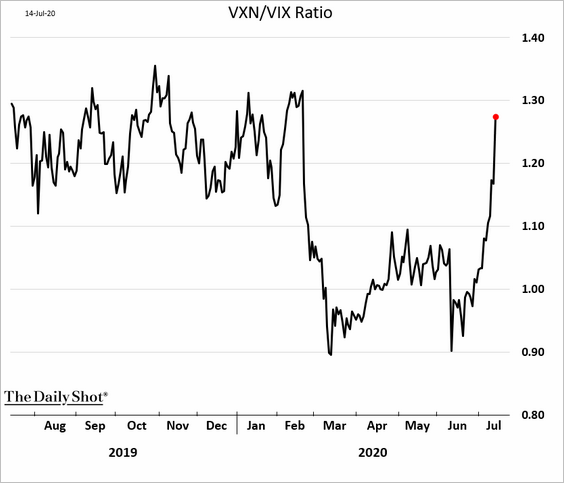
10. Nasdaq 100 companies have lost their appeal as “safe-haven” stocks. Below is the ratio of VXN (Nasdaq 100 VIX-equivalent) to VIX.
Credit
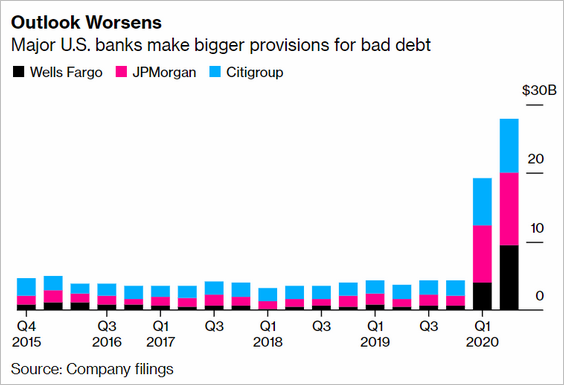
1. Loan loss provisions at the largest US banks spiked in the second quarter.
2. Investment-grade corporate bond ETFs made up a majority of fixed income inflows in June.
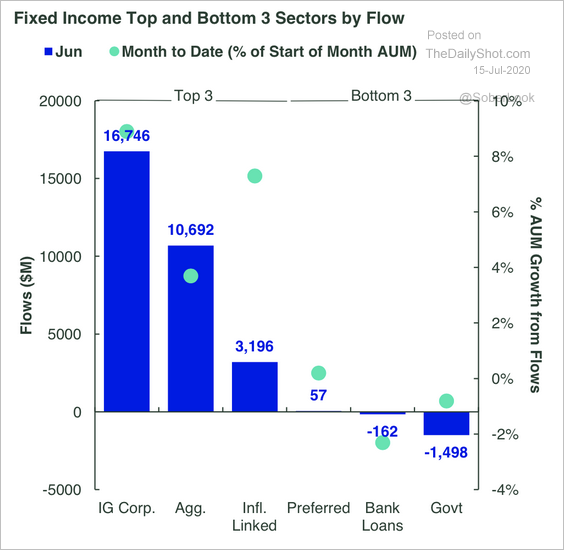 Source: SPDR Americas Research, @mattbartolini
3. It’s been slow going for European CLOs, with AAA spreads still elevated.
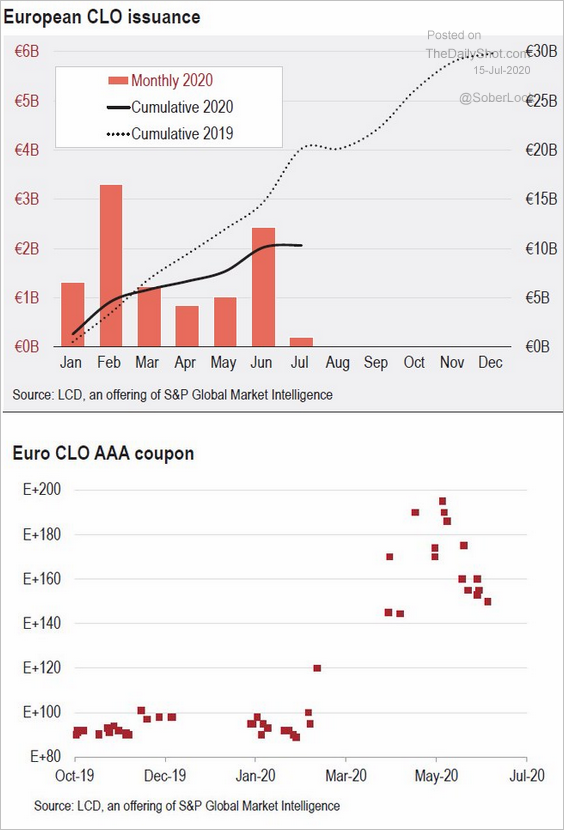 Source: @lcdnews, @millarlr
Rates
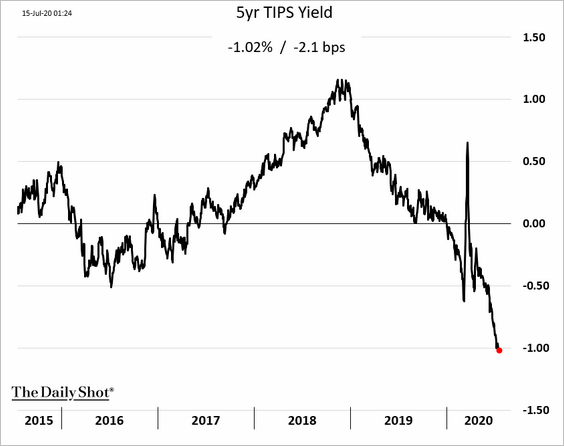
1. US effective real rates moved deeper into negative territory, an indication of exceptionally easy monetary conditions.
2. Overnight repo rates have risen since mid-May.
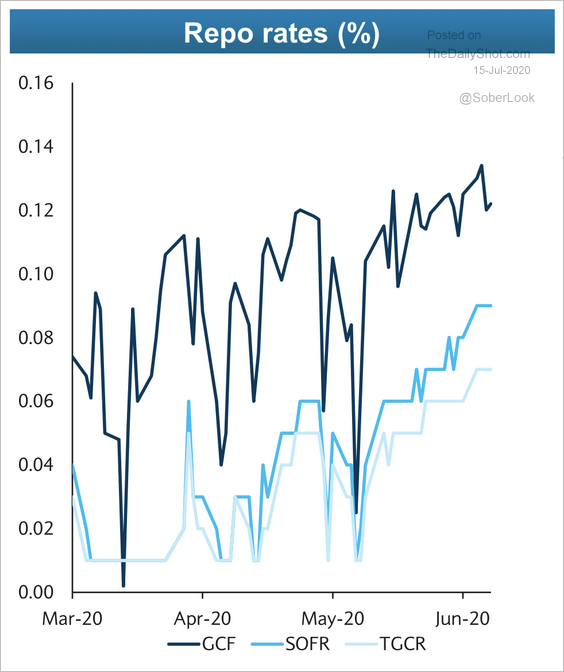 Source: Barclays Research
3. Here is Deutsche Bank’s projection for the Fed’s balance sheet.
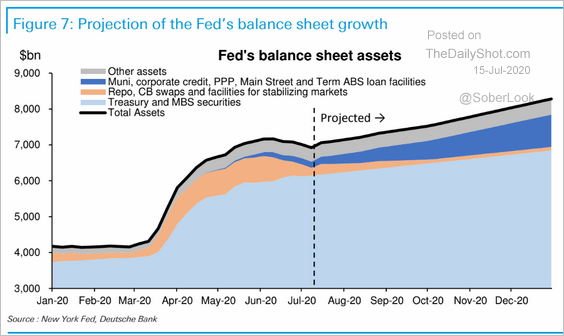 Source: Deutsche Bank Research
4. This chart shows the slope of yield curves in advanced economies.
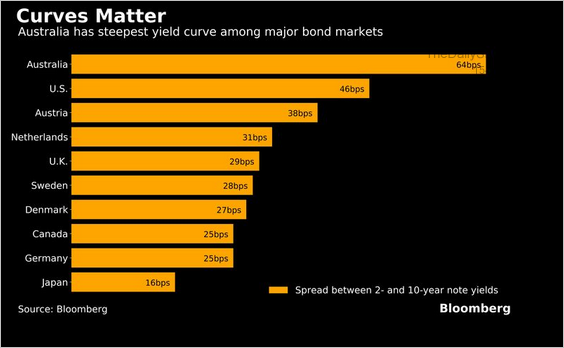 Source: @markets Read full article
Global Developments
1. Let’s start with the annualized 20-year returns across asset classes (60/40 = portfolio with 60% stocks/40% bonds).
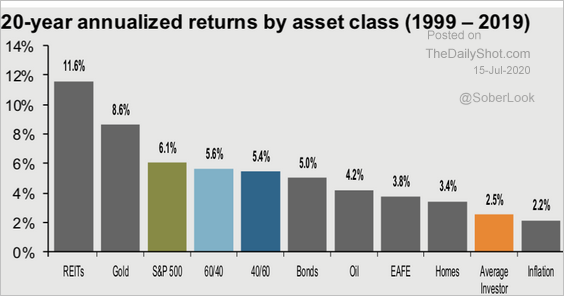 Source: J.P. Morgan Asset Management
2. How are speculative accounts currently positioned?
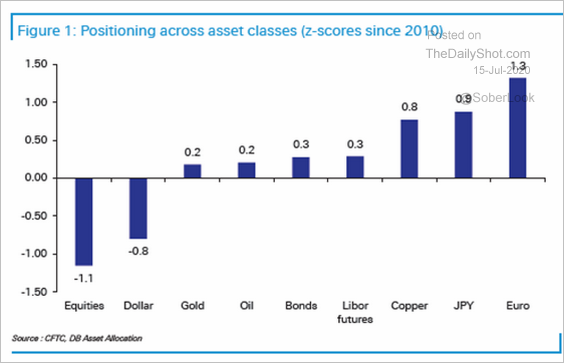 Source: Deutsche Bank Research
3. Here is the outlook for business activity 12 months out.
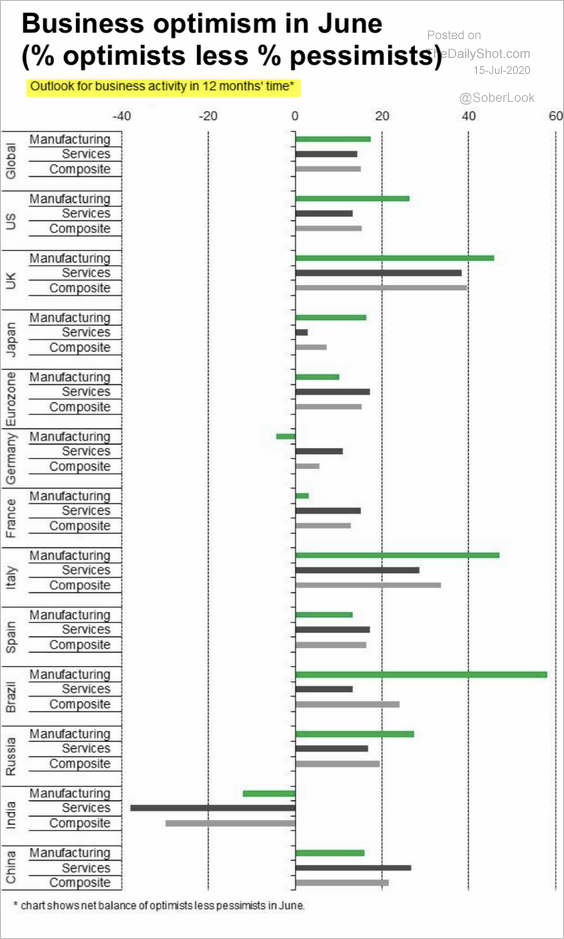 Source: IHS Markit Read full article
4. This chart shows the latest forecasts for the US and Eurozone unemployment rates.
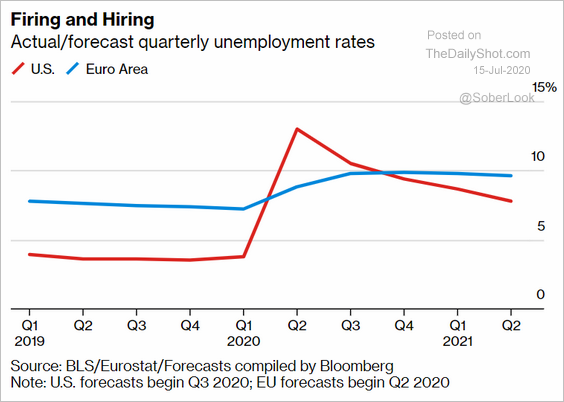 Source: @markets Read full article
5. Finally, we have the percentage of economies that are in a recession.
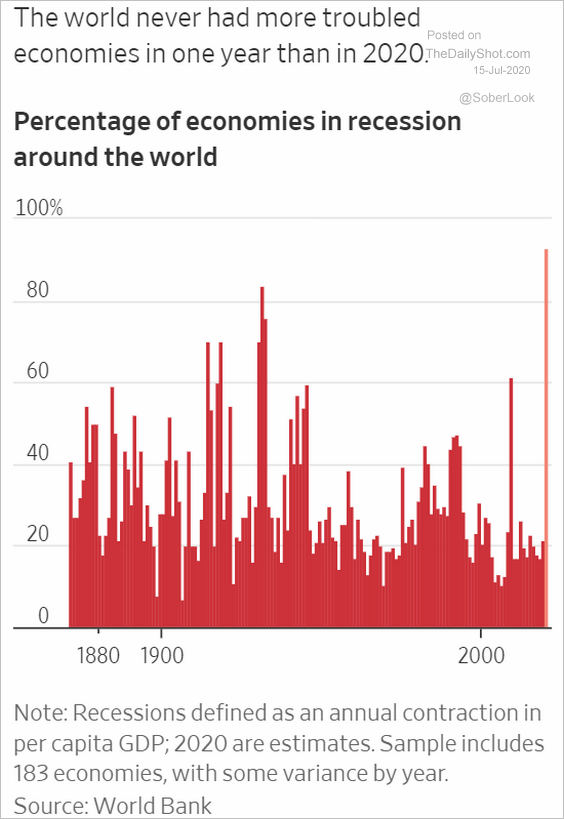 Source: @WSJ Read full article
——————–
Food for Thought
1. The status of digital services tax:
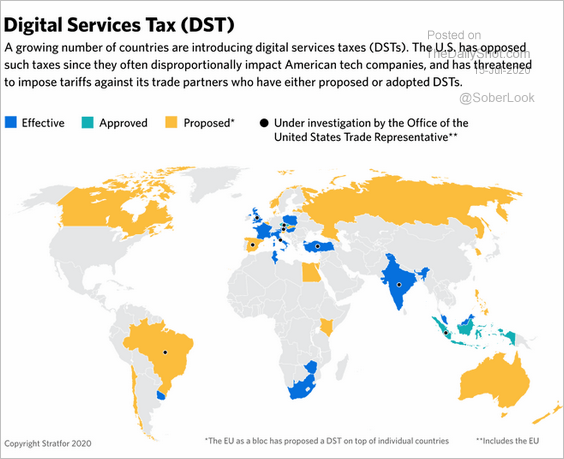 Source: @Stratfor Read full article
2. Wages vs. the share of jobs that can be done at home (by sector):
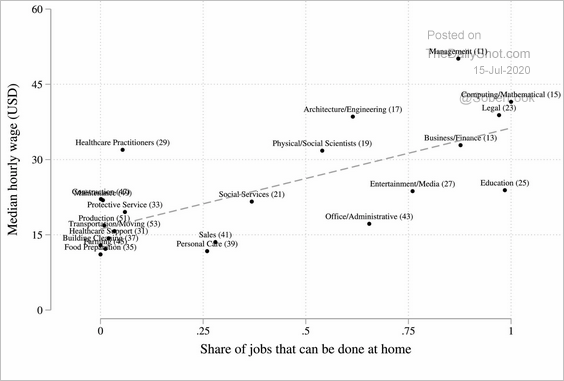 Source: Dingel, Neiman (Journal of Public Economics) Read full article
3. How the pandemic changed views on disruptive technologies:
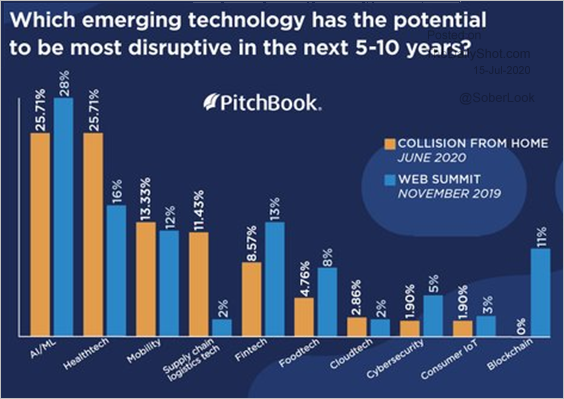 Source: @PitchBook Read full article
4. Gender equality in North American politics:
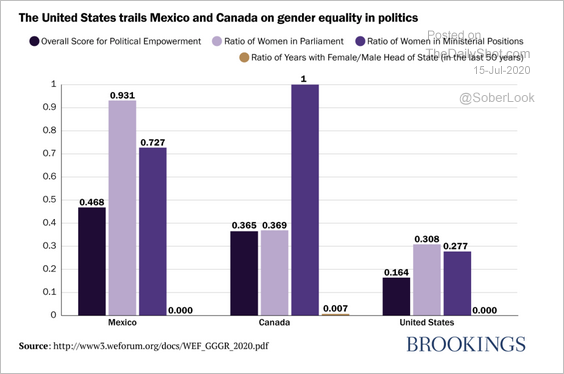 Source: Brookings Institution Read full article
5. TV spending by Republicans and Democrats:
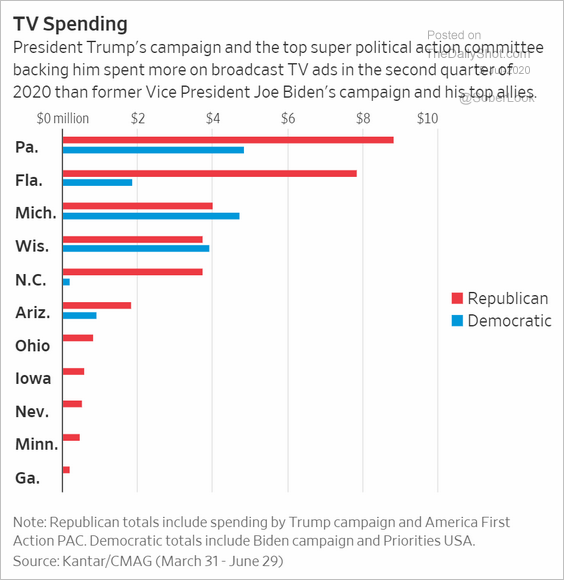 Source: @WSJ Read full article
6. Where high-skilled immigrants are needed:
 Source: Statista
7. Speeding-related traffic fatalities:
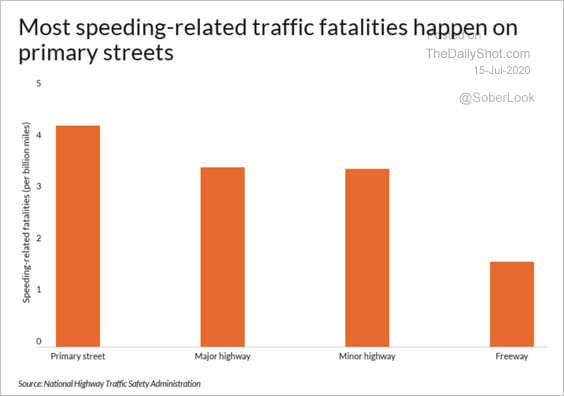 Source: CoPilot Read full article
8. Pentagon ad spending:
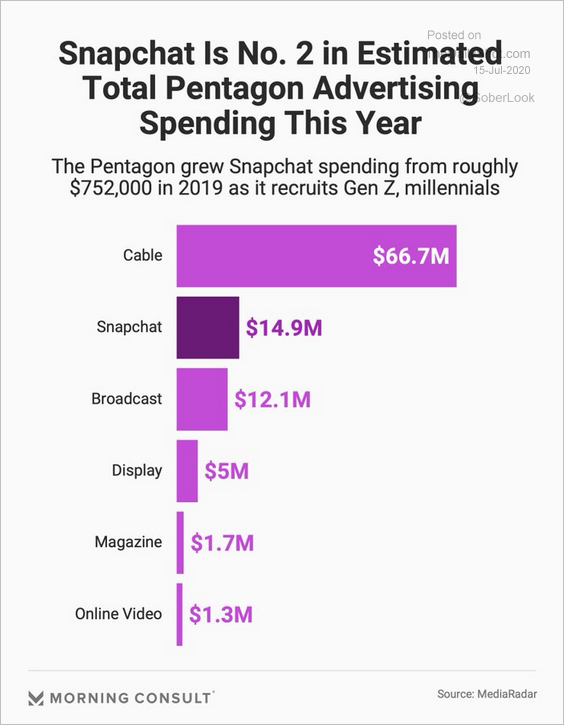 Source: @MorningConsult, @samsabin923 Read full article
9. Longest reigning monarchs:
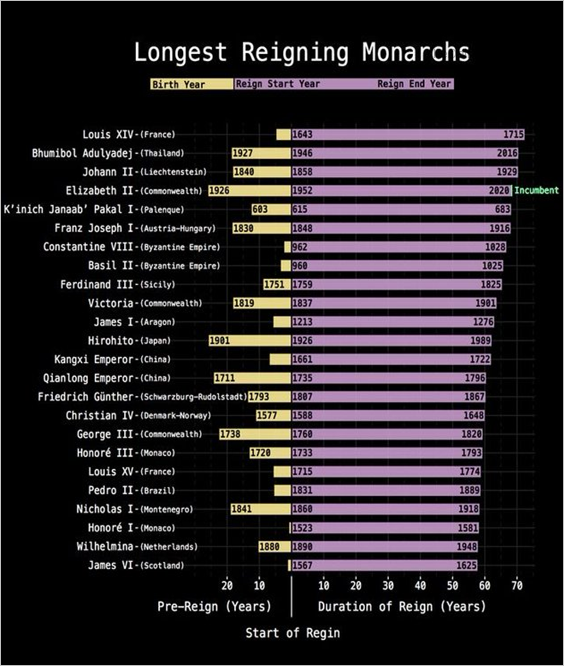 Source: @simongerman600 Read full article
——————–