
The Daily Shot: 16-Jul-20
• The United States
• Canada
• The United Kingdom
• The Eurozone
• Asia – Pacific
• China
• Emerging Markets
• Commodities
• Energy
• Equities
• Credit
• Rates
• Food for Thought
The United States
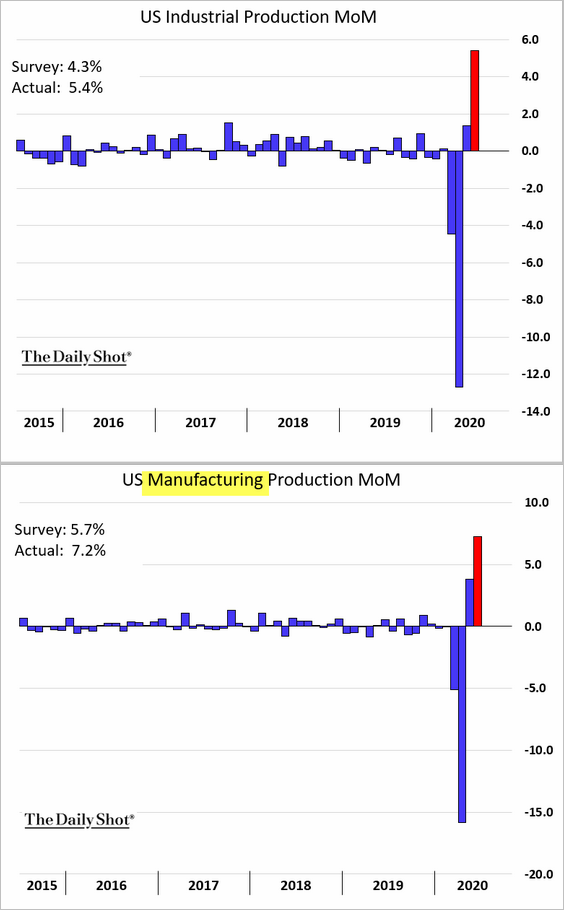
1. The streak of upside economic surprises continues. The June industrial production figures topped economists’ forecasts, as factory output climbed further.
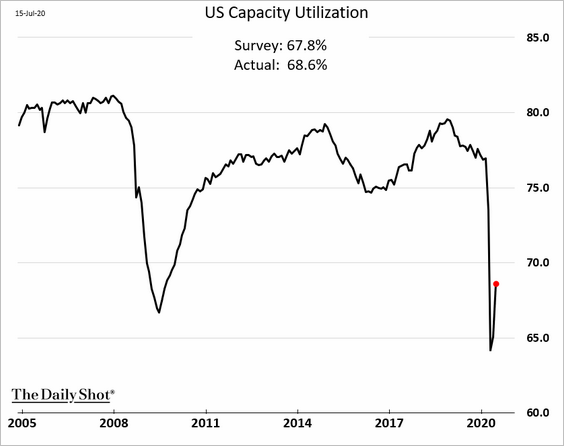
• Capacity utilization bounced from extreme lows.
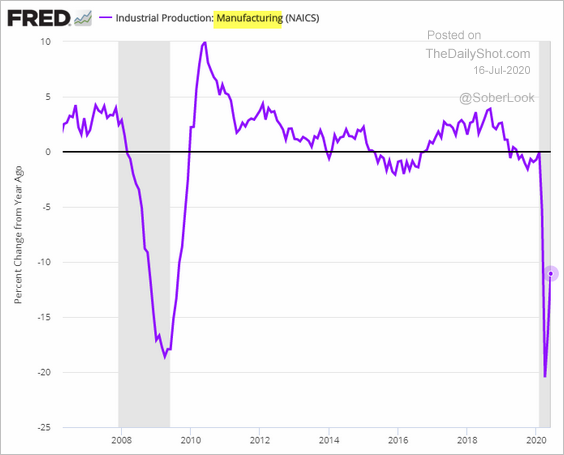
• This chart shows the year-over-year changes in manufacturing production.
• Despite improvements, many manufacturing sub-sectors are still in contraction territory.
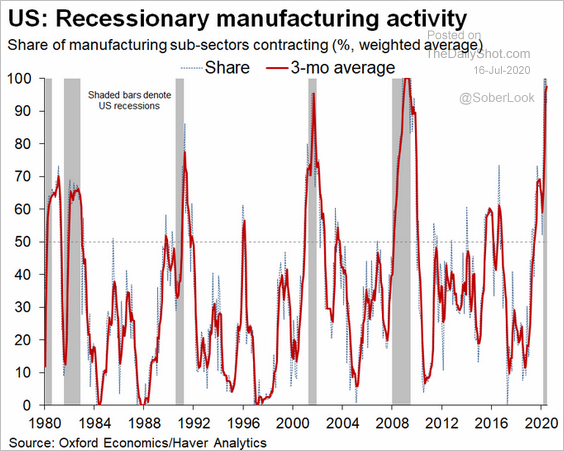 Source: @GregDaco, @OxfordEconomics
• Here are the components of industrial production (levels).
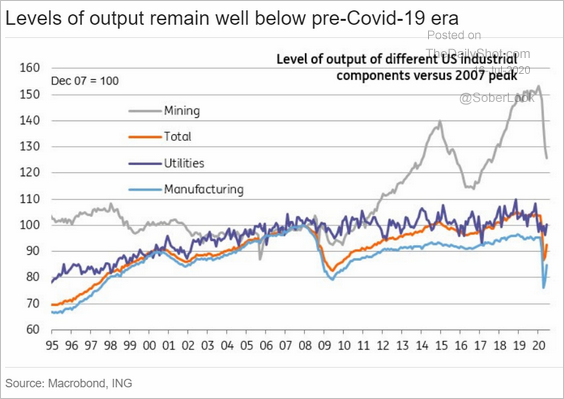 Source: ING
• The June ISM manufacturing PMI index suggests that factory output will rebound further. But given the pandemic uncertainty, the manufacturing recovery could lose momentum.
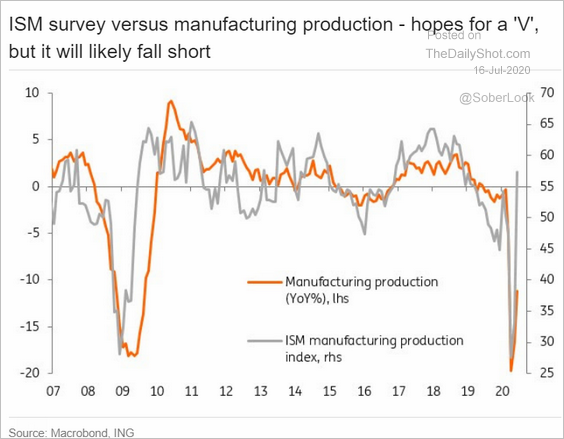 Source: ING
——————–
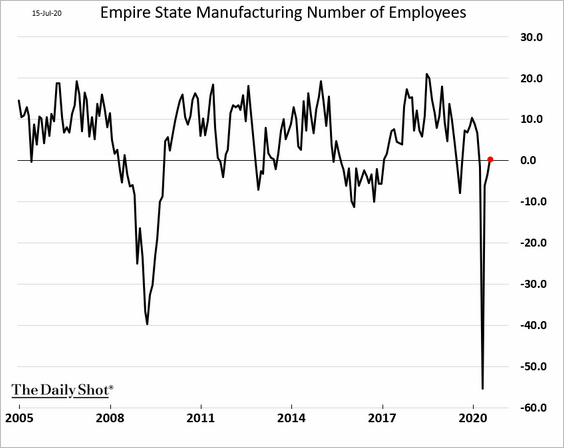
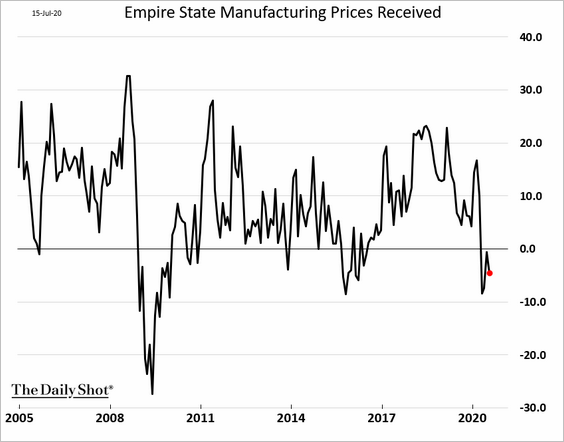
2. The NY Fed’s regional manufacturing index showed an impressive improvement in factory activity. It’s worth noting that New York and New Jersey were late to reopen, and some of the rebound is due to pent-up demand.
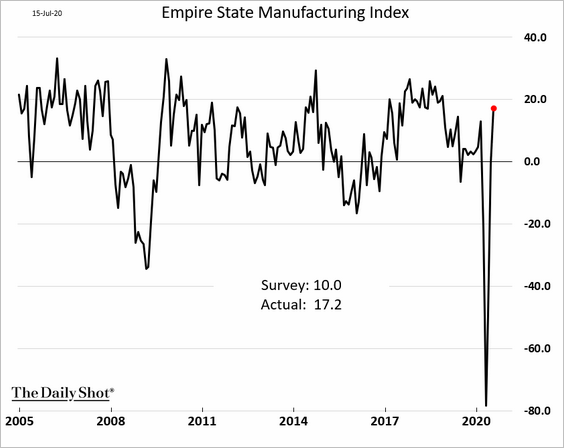
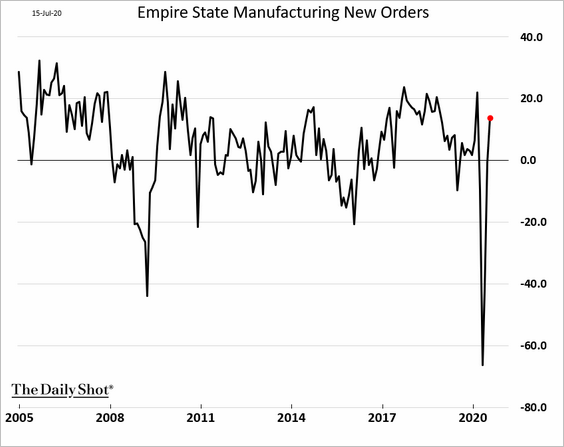
Here are some of the index components.
• New orders:
• Employment:
• Prices:
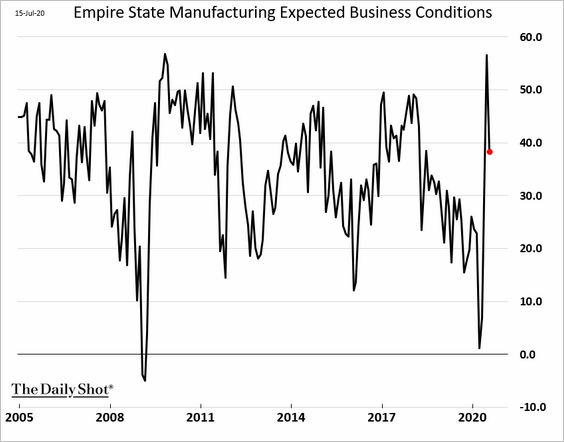
The expectations index is off the highs but remains elevated.
——————–
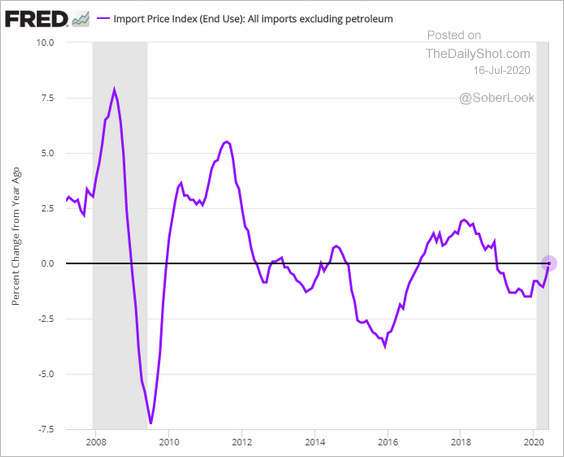
3. Next, we have some updates on inflation.
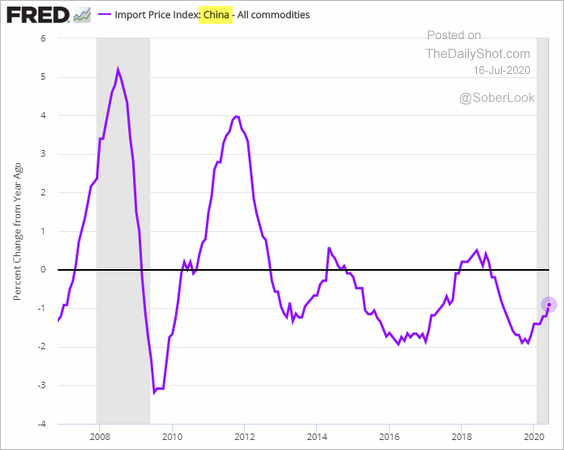
• Import prices are now flat on a year-over-year basis.
This chart shows price changes on goods imported from China.
• Nomura expects the core CPI inflation to dip below zero in the months ahead.
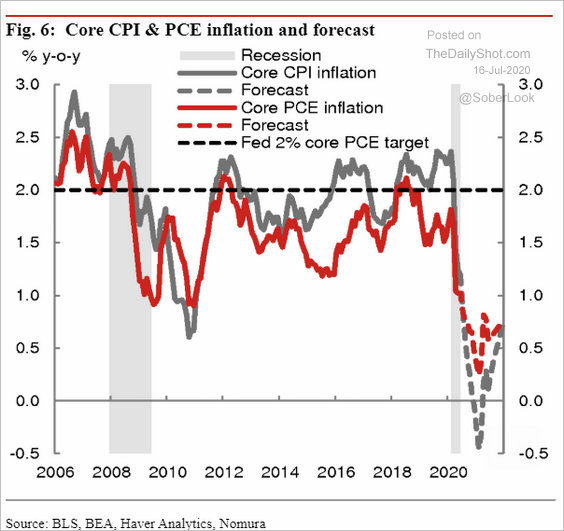 Source: Nomura Securities
——————–
4. The Fed’s Beige Book sentiment rebounded from extreme weakness.
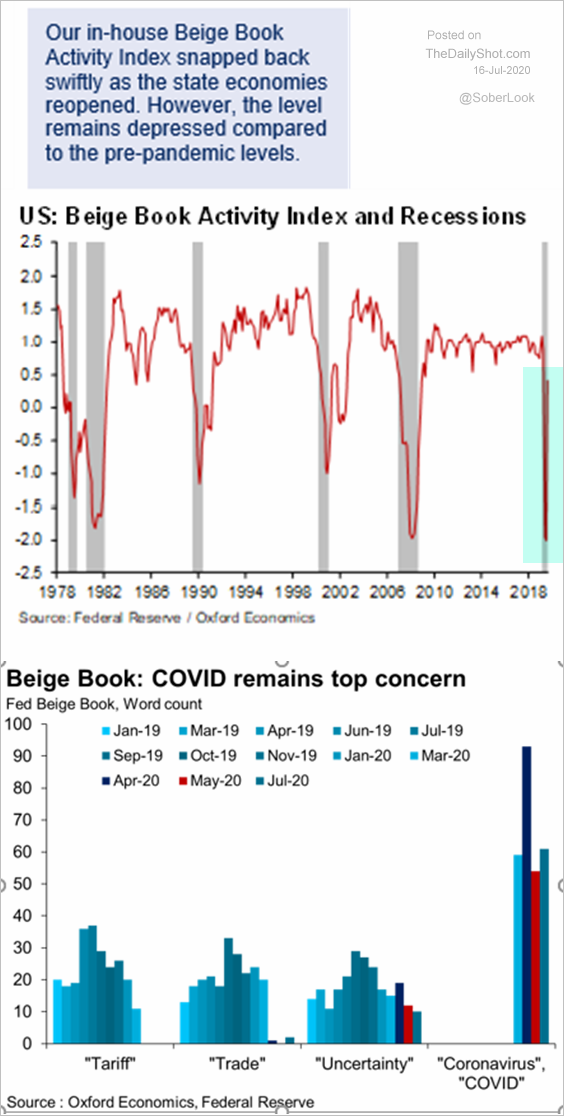 Source: @BostjancicKathy
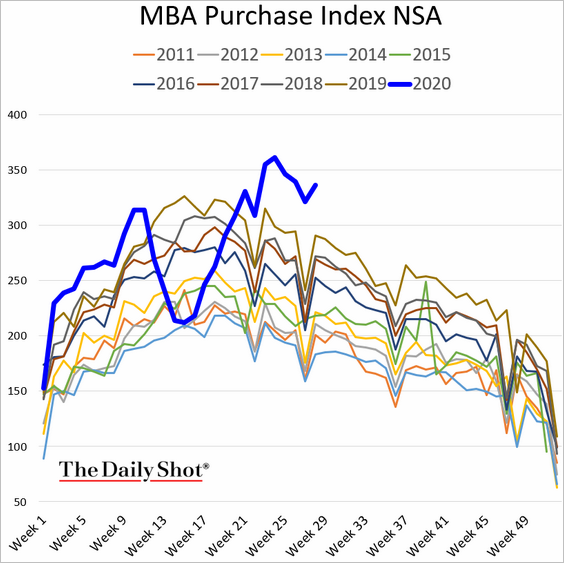
5. Mortgage applications to purchase a home are holding at multi-year highs.
6. Month-over-month changes in Morning Consult’s consumer confidence index shows deterioration in sentiment.
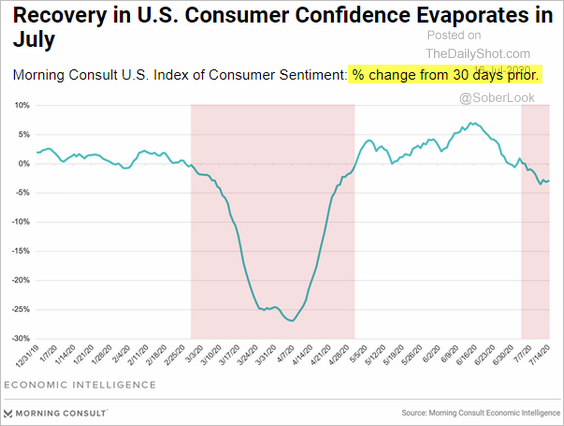 Source: Morning Consult Read full article
7. Americans are preparing for homeschooling and virtual classes amid parents’ apprehension about sending children back to school. This trend could create a significant drag on economic growth.
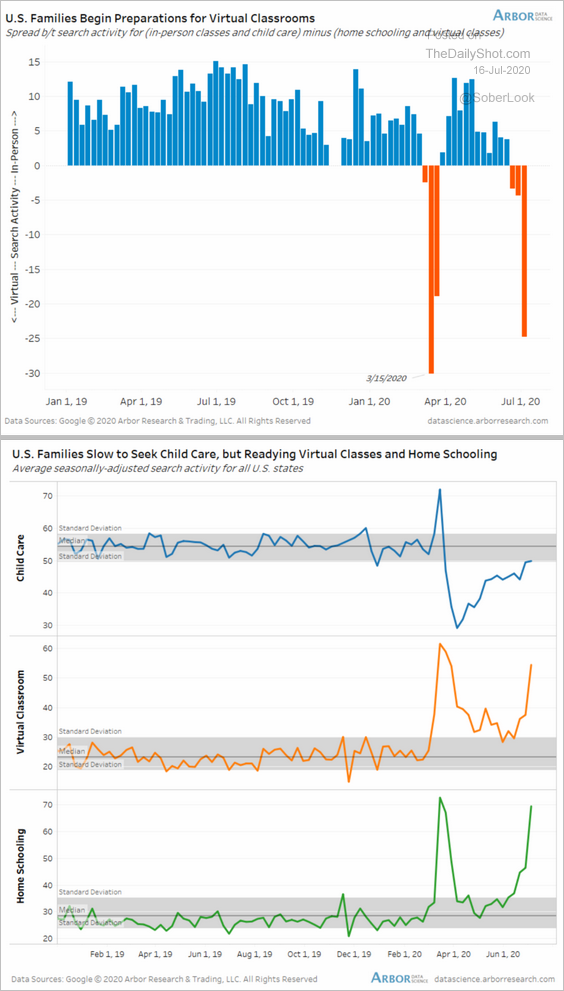 Source: Arbor Research & Trading
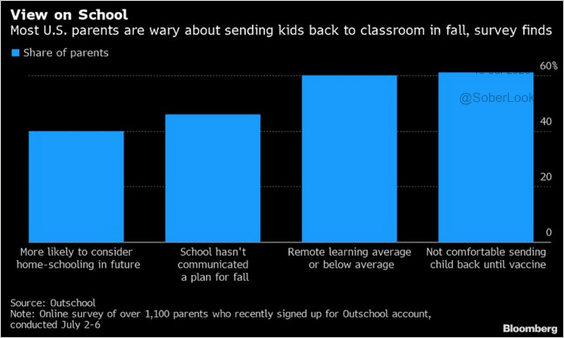 Source: @LizAnnSonders, @outschool, @Bloomberg
——————–
8. Will weakness in small business employment result in further increases in PUA jobless claims?
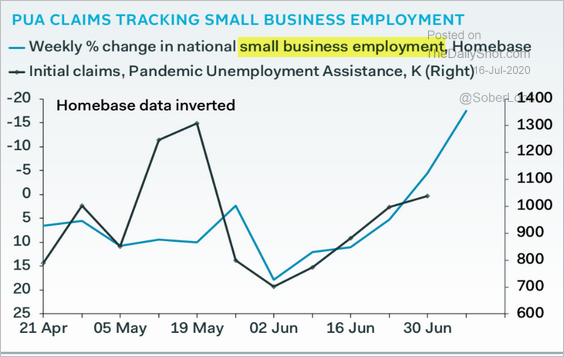 Source: Pantheon Macroeconomics
9. Here is the Capital Economics’ projection for US consumer spending (total dollars).
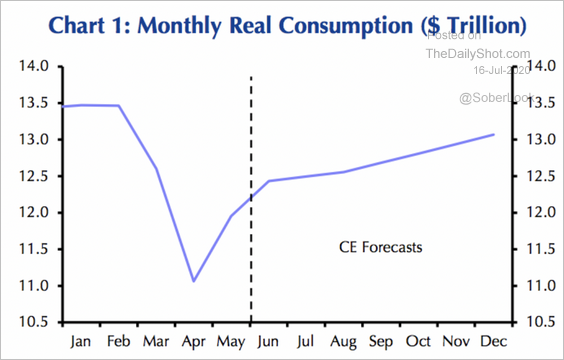 Source: Capital Economics
10. The airline industry continues to struggle.
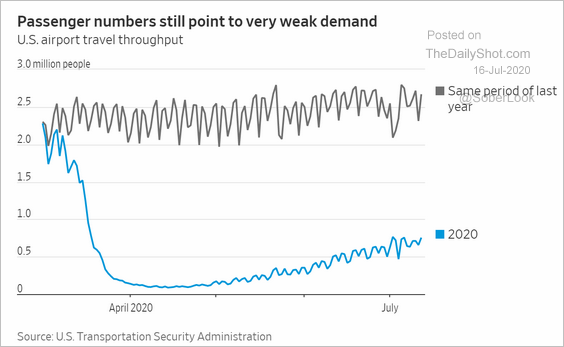 Source: @WSJ Read full article
 Source: Reuters Read full article
——————–
11. Finally, this chart shows corporate income tax receipts at the federal level.
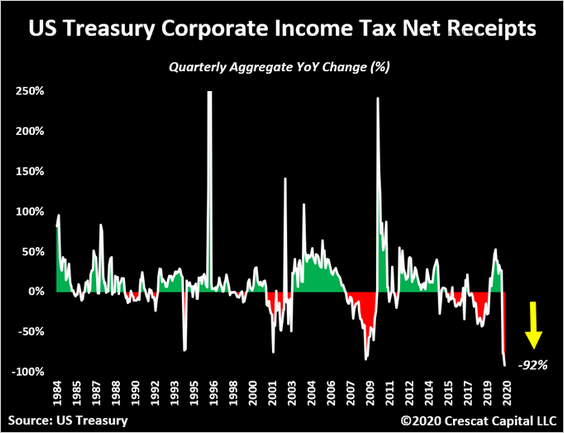 Source: @TaviCosta
Canada
1. The BoC comments were somewhat more upbeat than expected. The loonie climbed.
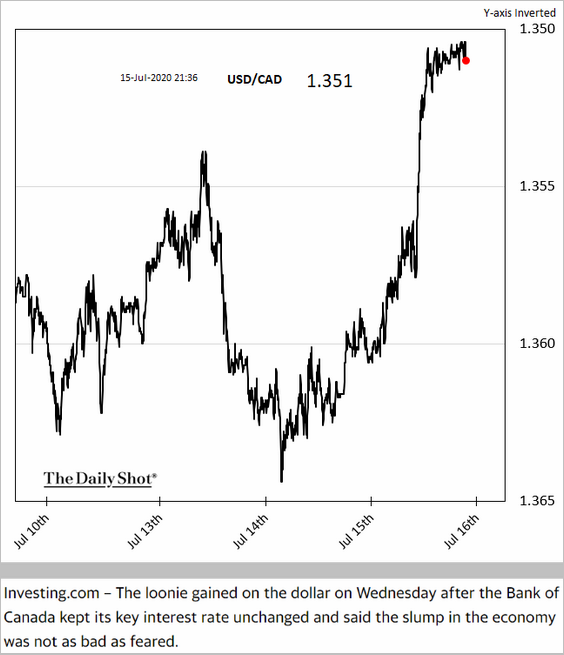 Source: Yahoo Finance Read full article
2. This year, the Canadian dollar has the highest beta to risky assets across G10 USD pairs.
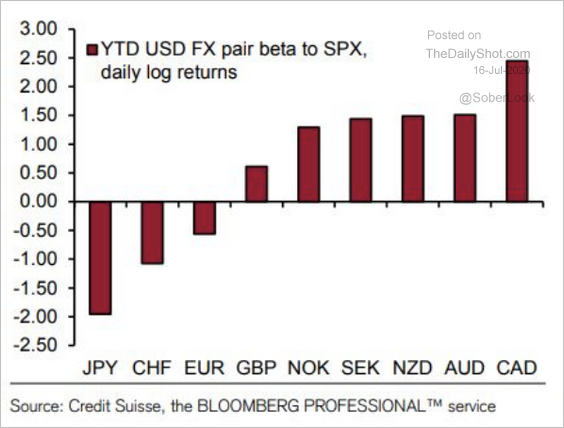 Source: Credit Suisse
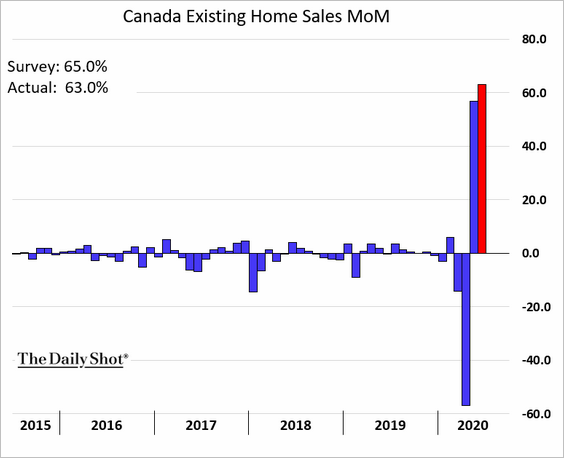
3. Home sales increased sharply in June.
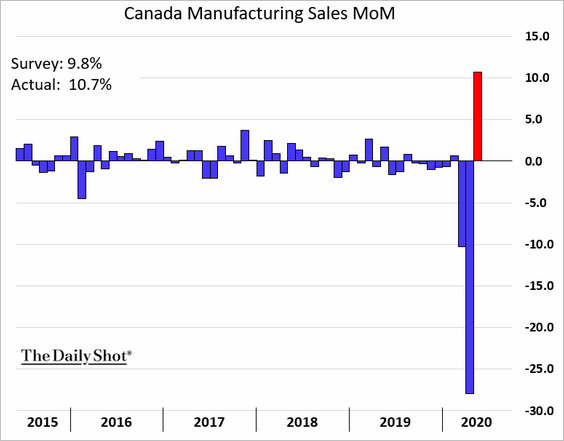
4. May factory sales showed improvement.
5. This chart provides two GDP forecasts: BoC and Oxford Economics.
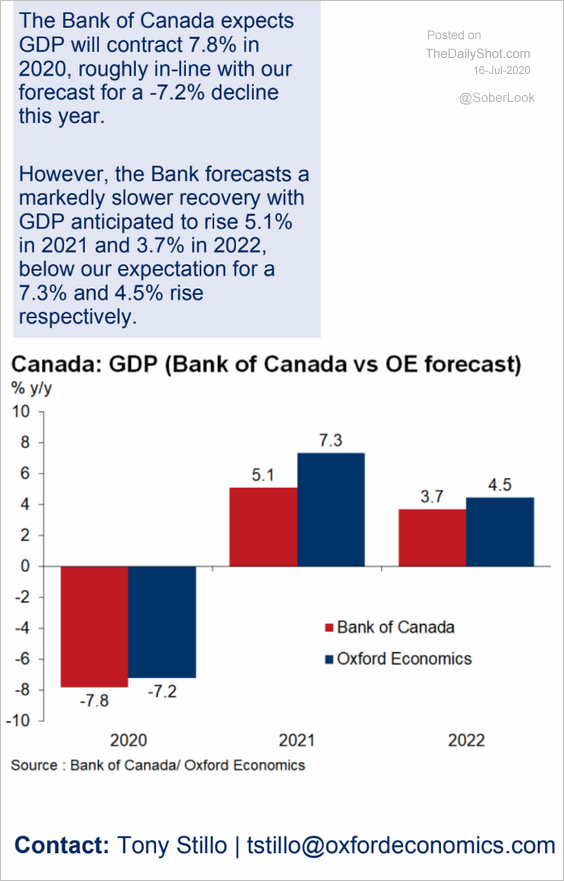 Source: Oxford Economics
6. The 2020 budget deficit is expected to be unprecedented.
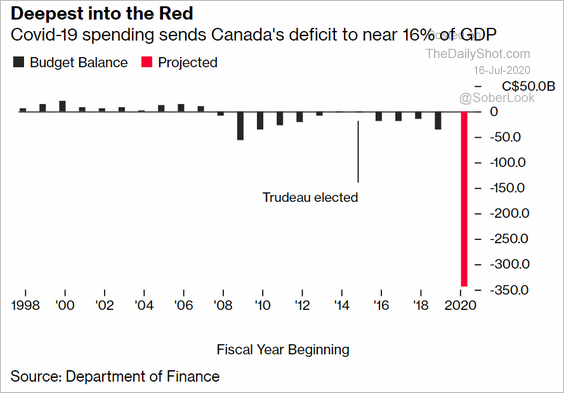 Source: @markets Read full article
The United Kingdom
1. Consumer inflation ticked higher.
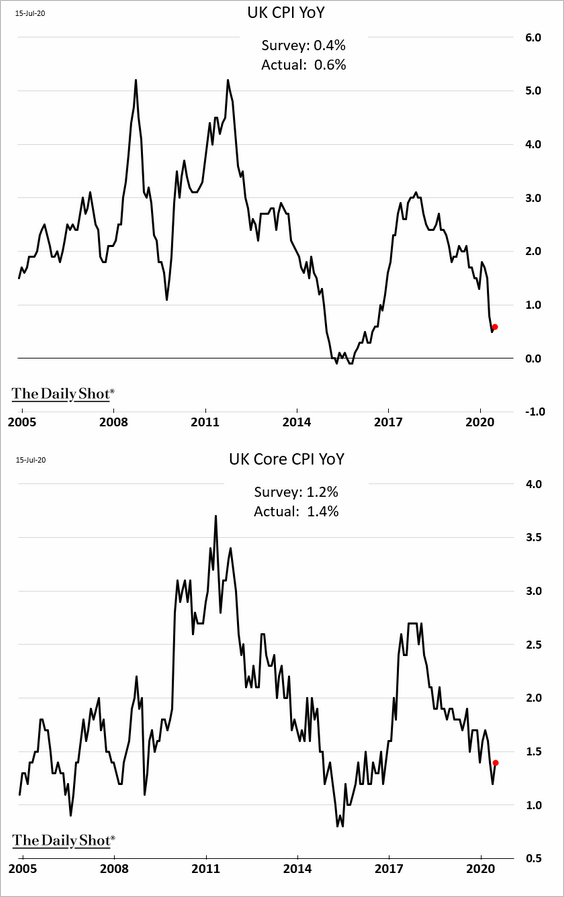
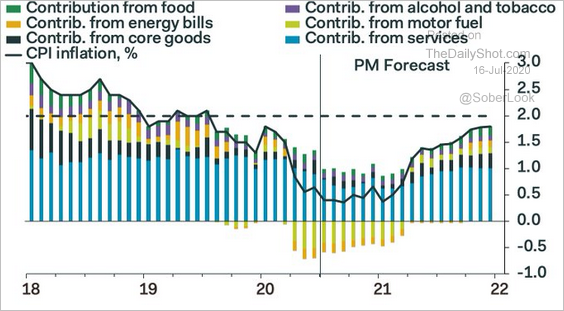
But Pantheon Macroeconomics expects it to weaken going forward.
 Source: @samueltombs
 Source: Pantheon Macroeconomics
——————–
2. This year’s gilt sales will dwarf what we saw during the Financial Crisis. Of course, the market doesn’t care (see chart).
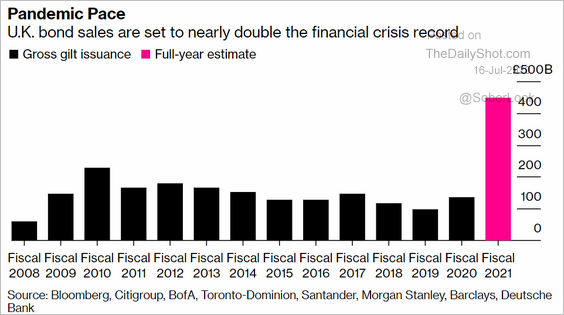 Source: @markets Read full article
The Eurozone
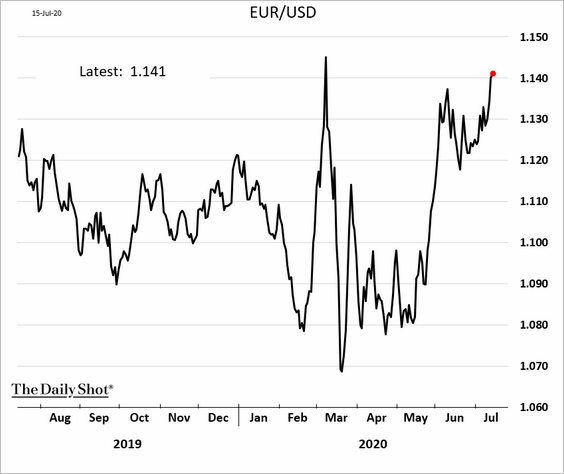
1. The euro has been buoyant lately.
2. Here are some high-frequency indicators from Germany.
• Truck traffic:
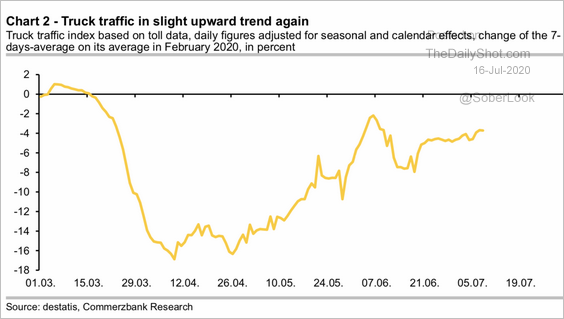 Source: Commerzbank Research
• Retail traffic:
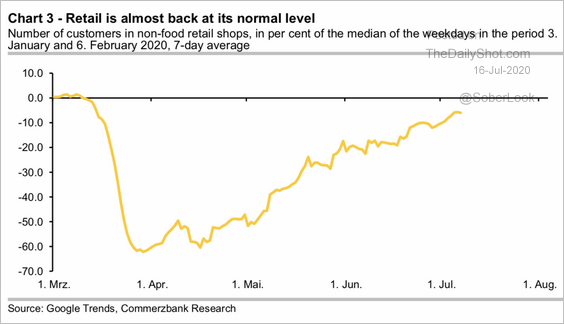 Source: Commerzbank Research
• Public transport:
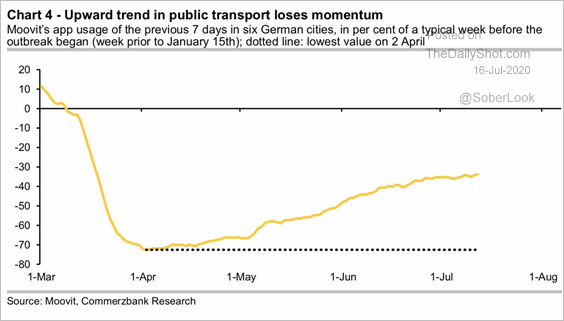 Source: Commerzbank Research
——————–
3. Euro-area bank loan rejection rates declined sharply in the second quarter.
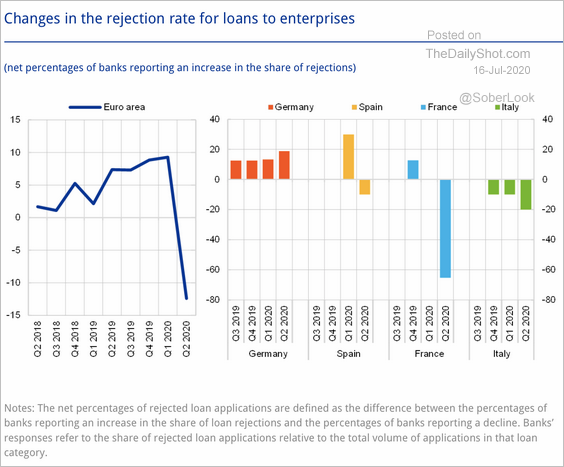 Source: ECB Read full article
Here is a comment from the ECB:
The pronounced decline in the share of rejected loan applications for loans to enterprises could also be explained by the sizeable state loan guarantees provided by the euro area governments.
Companies borrowed to fund working capital as revenues dried up.
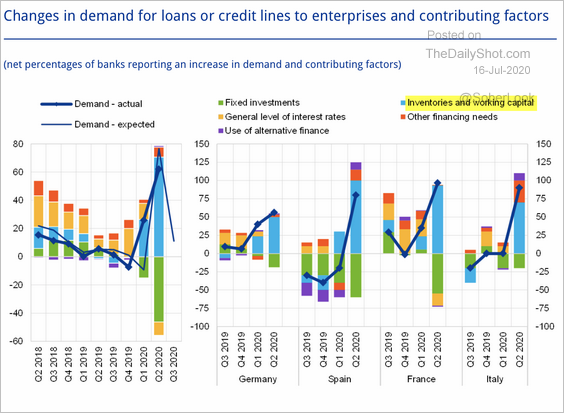 Source: ECB Read full article
Asia – Pacific
1. The decline in government approval ratings could be an impetus for more fiscal stimulus in Japan.
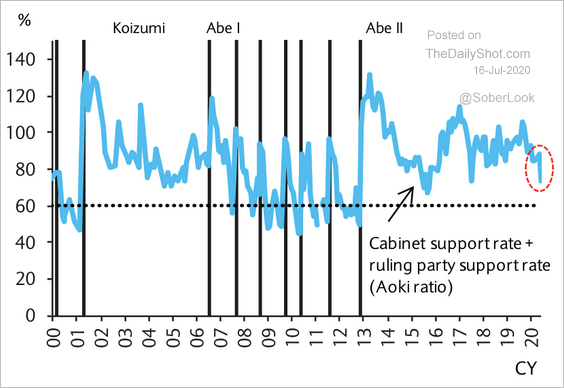 Source: Barclays Research
Rising new infections further undermine support for the government.
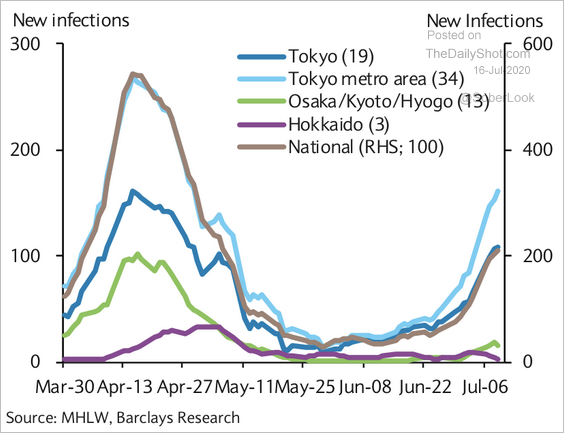 Source: Barclays Research
——————–
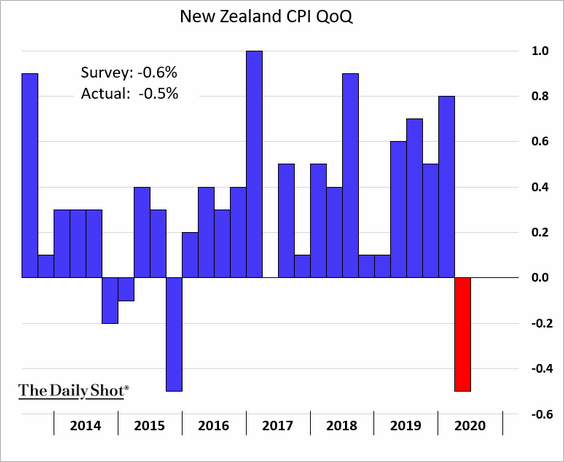
2. Here is New Zealand’s quarterly CPI.
3. Next, we have some updates on Australia.
• The June rebound in payrolls was double the number economists had expected.
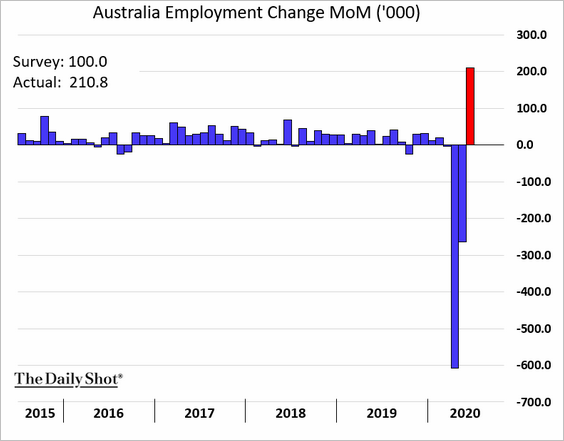
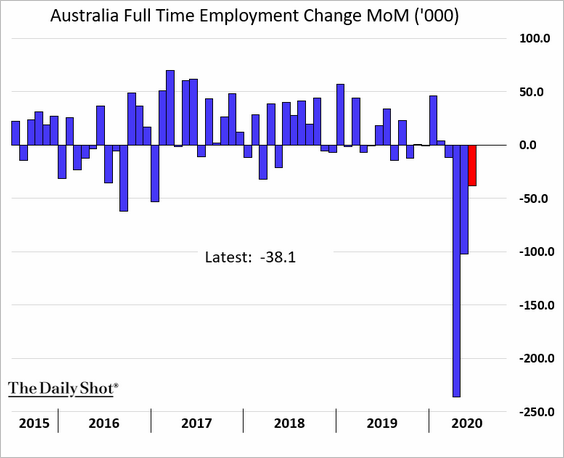
However, all the job gains were in part-time positions. Full-time employment is down for the fourth month in a row.
• The unemployment rate climbed further.
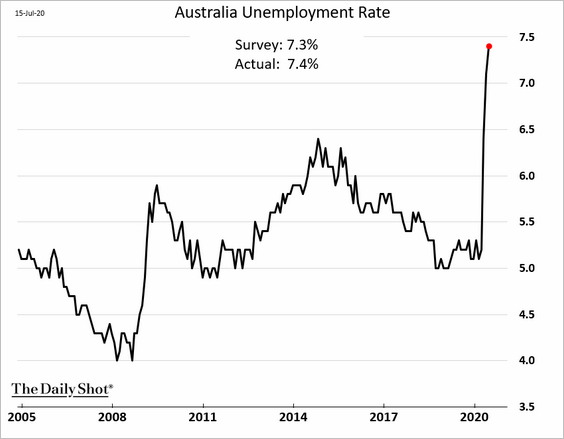
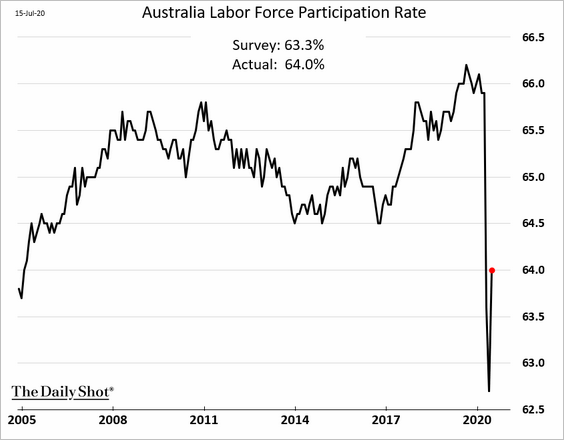
But labor force participation is rebounding.
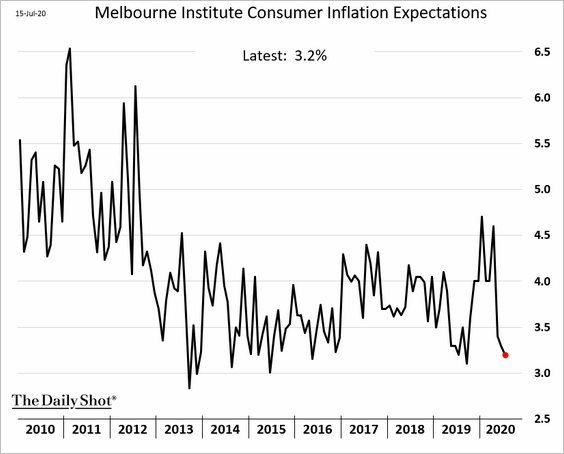
• Consumer inflation expectations have been moderating.
• The rise in Chinese equities could benefit the Aussie dollar.
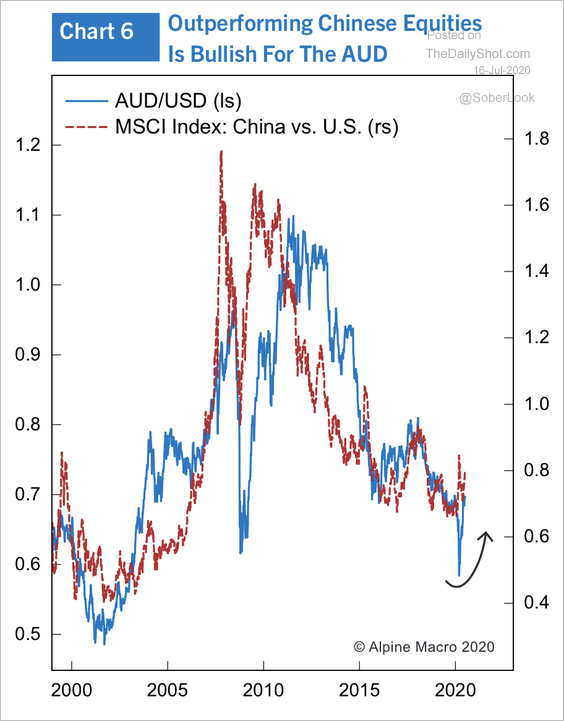 Source: Alpine Macro
And AUD looks cheap, according to Alpine Macro’s long-run valuation model.
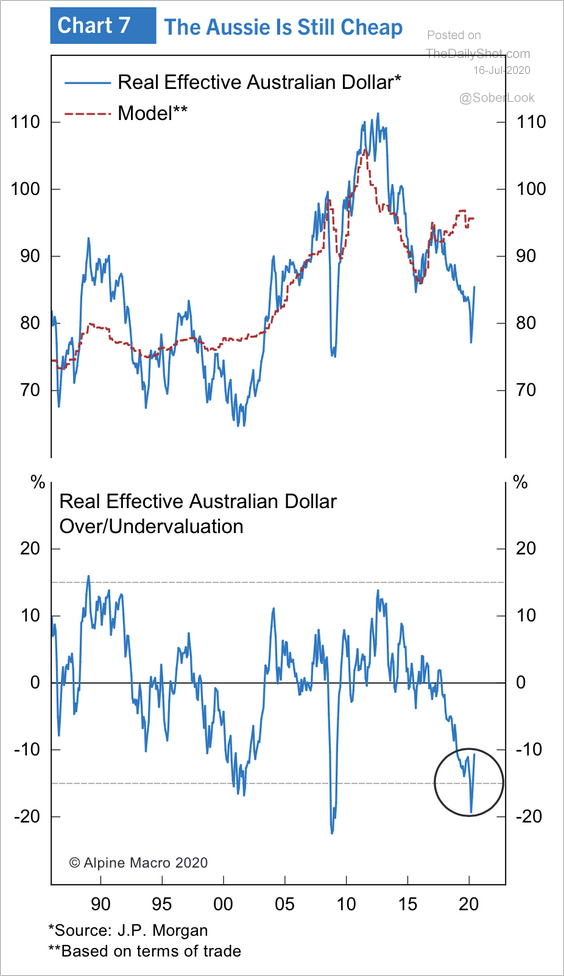 Source: Alpine Macro
China
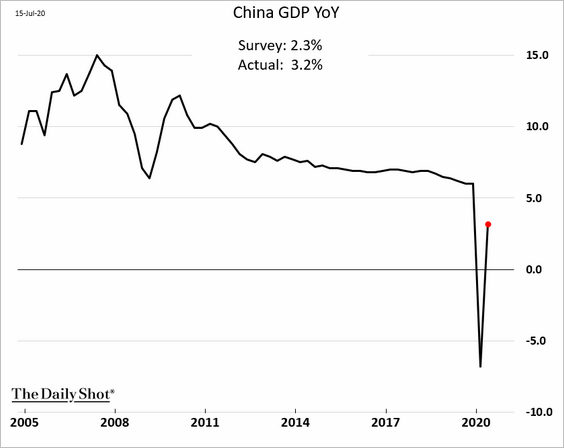
1. The economy rebounded sharply in the second quarter, with the GDP report surprising to the upside.
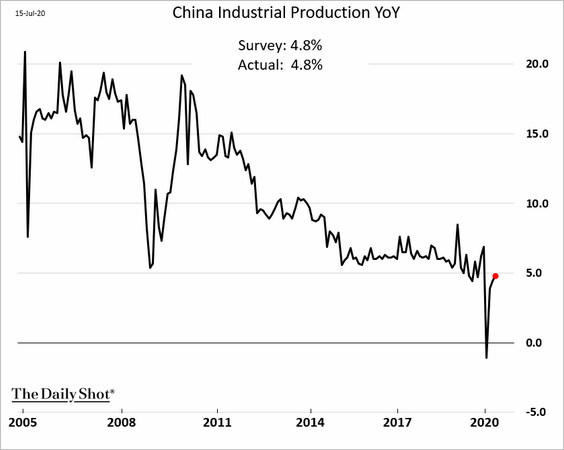
2. Industrial production is almost back to its usual growth rate.
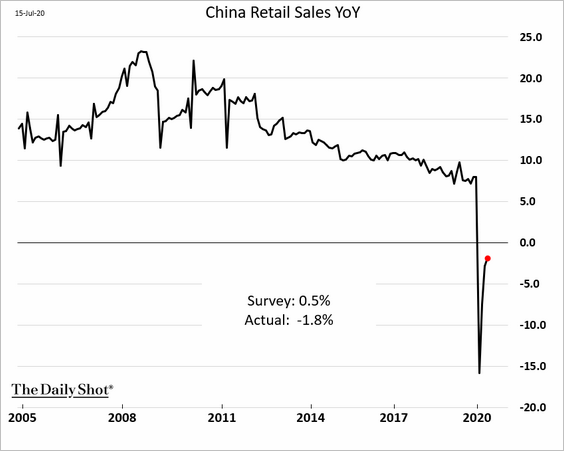
3. Retail sales are still below last year’s levels.
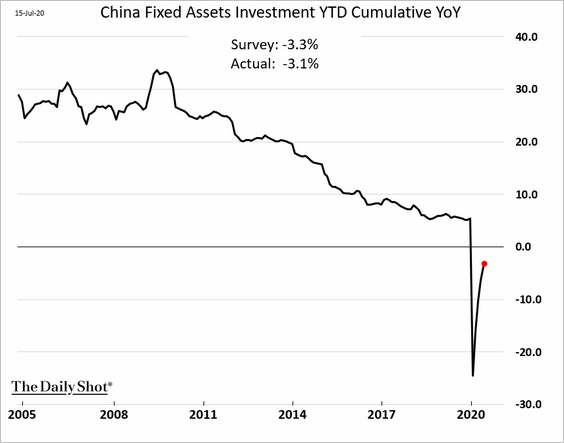
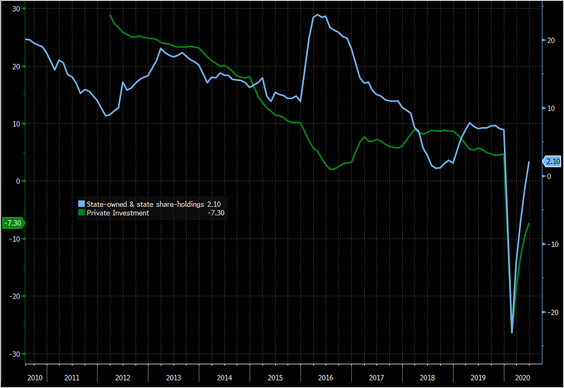
4. Fixed-asset investment is recovering, driven by state institutions (second chart).
 Source: @TheTerminal
——————–
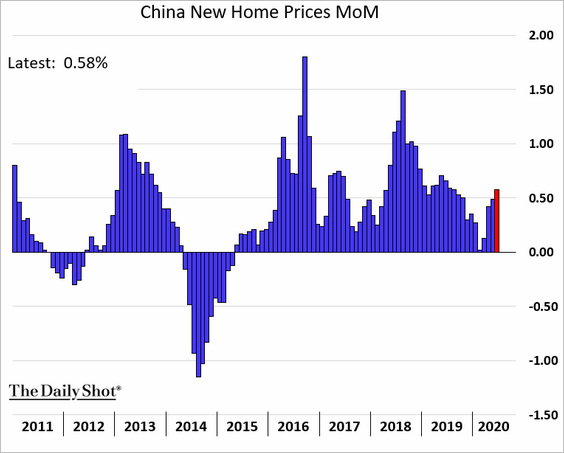
5. Home price appreciation continues to improve.
Emerging Markets
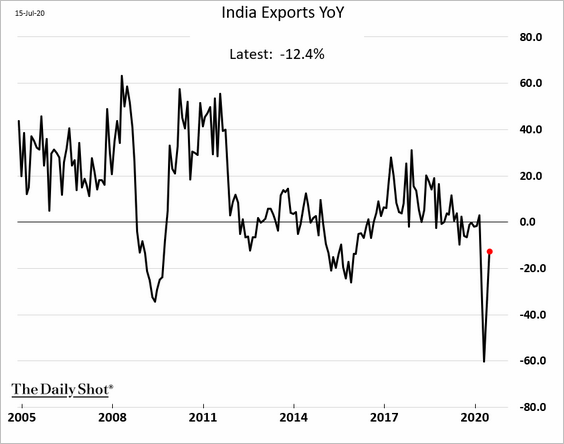
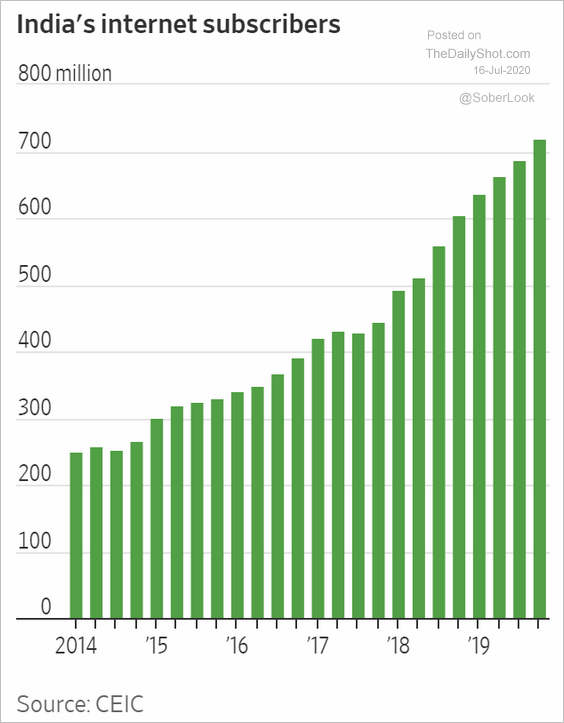
1. India’s exports rebounded in June.
Separately, this chart shows India’s internet subscribers.
 Source: @WSJ Read full article
——————–
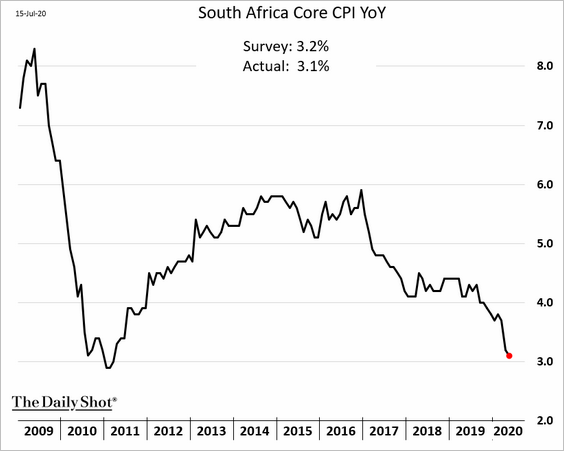
2. South Africa’s core inflation continues to moderate.
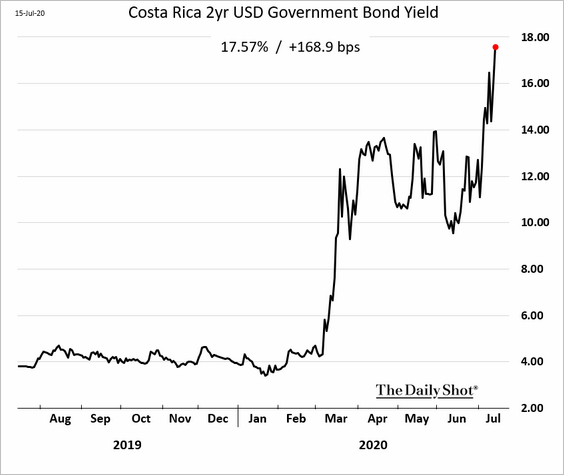
3. Costa Rica is in trouble.
 Source: @financialtimes Read full article
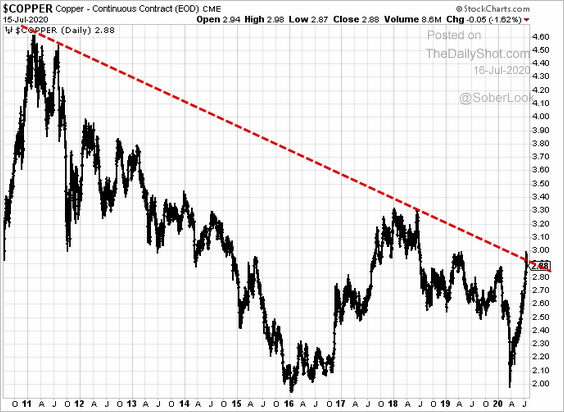
Commodities
Copper’s downtrend resistance is holding.
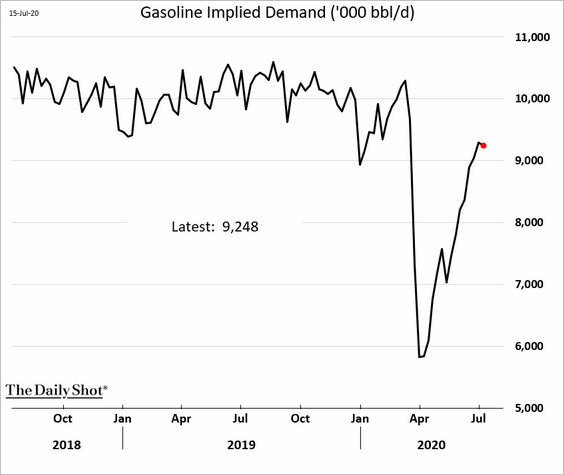
Energy
1. US gasoline demand hasn’t yet fully recovered.
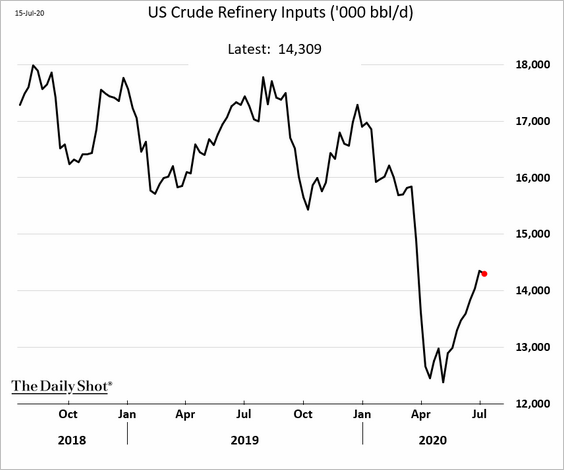
2. Refinery inputs are still relatively weak.
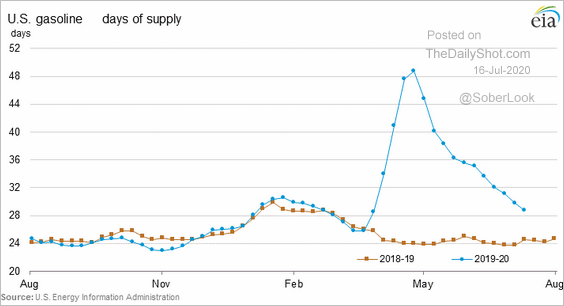
3. Gasoline inventories are trending lower.
4. This chart shows non-OPEC oil-exporting nations gaining market share.
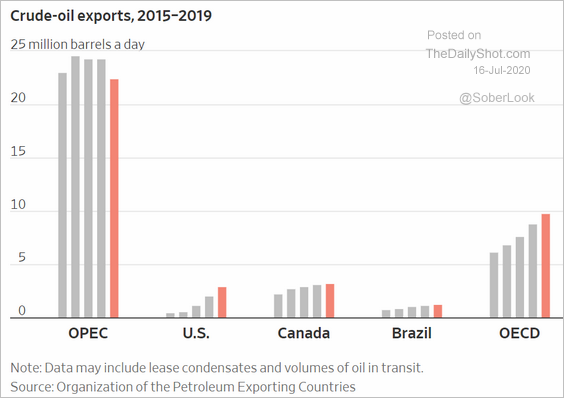 Source: @WSJ Read full article
Equities
1. Let’s start with the S&P 500 return attribution by sector over the past five years.
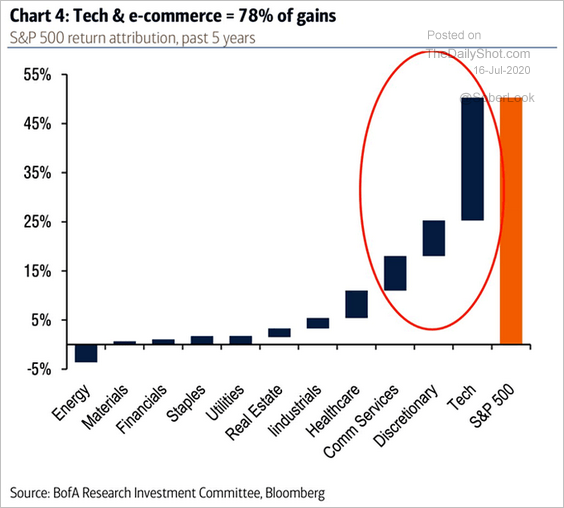 Source: @ISABELNET_SA, @BofAML
2. Here is a long-term chart of the S&P 500 dividend yield.
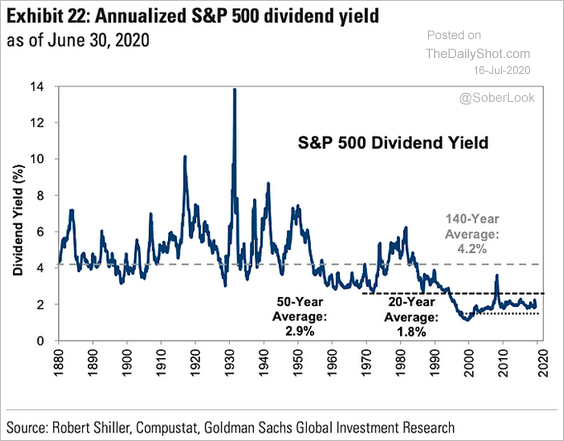 Source: @ISABELNET_SA, @GoldmanSachs
3. What percentage of S&P 500 stocks have dividend yields above the 10yr Treasury?
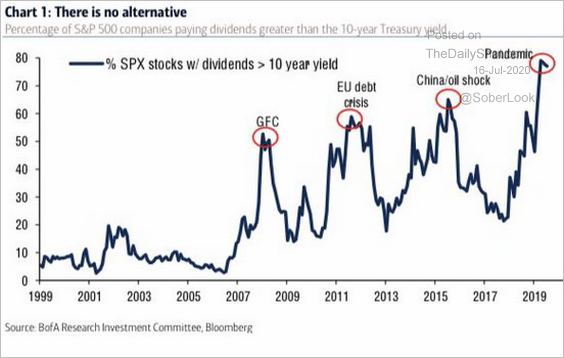 Source: BofA Merrill Lynch Global Research, @lisaabramowicz1
4. The tech mega-caps’ earnings are expected to leave the rest of the S&P 500 in the dust.
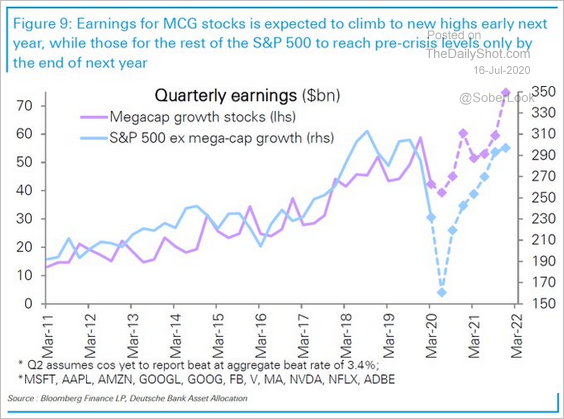 Source: @jessefelder, Deutsche Bank Research, @bopinion Read full article
5. Next, we have some updates on equity positioning.
• The first chart shows the recent changes in fund managers’ positions, and the second provides their current holdings relative to history.
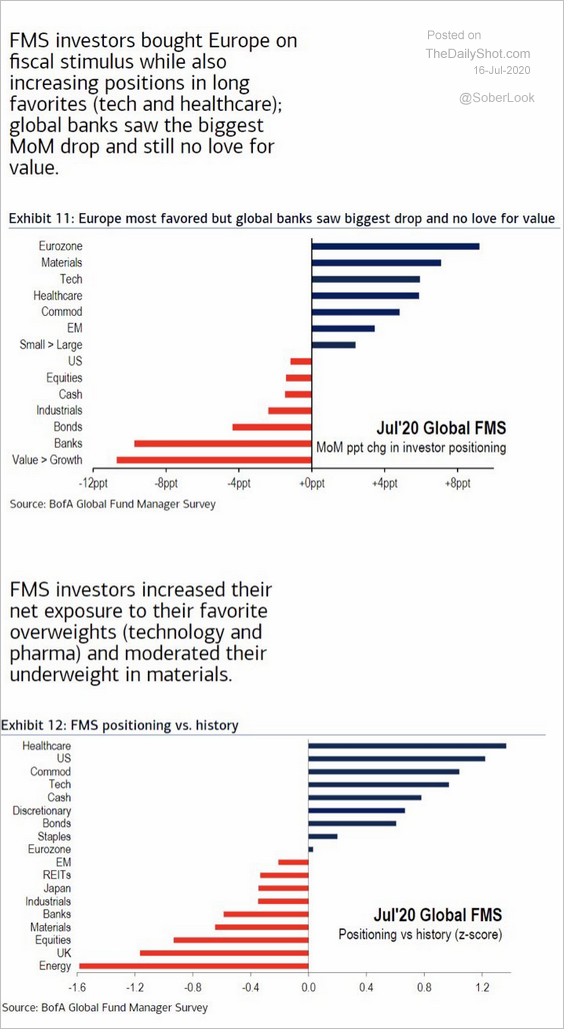 Source: @LizAnnSonders, @BankofAmerica
• The overall equity positioning remains cautious.
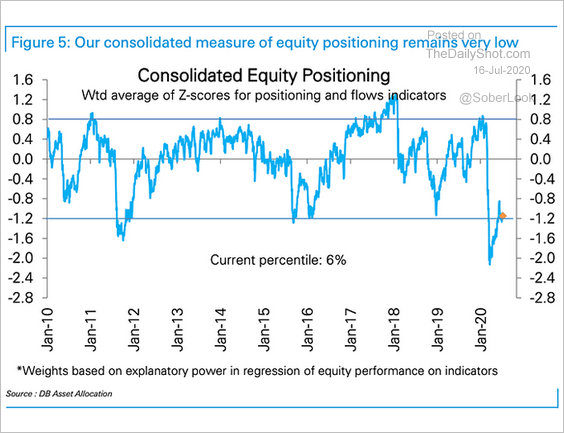 Source: Deutsche Bank Research, @jsblokland, @ISABELNET_SA
But large speculative accounts boosted their bets on Nasdaq 100.
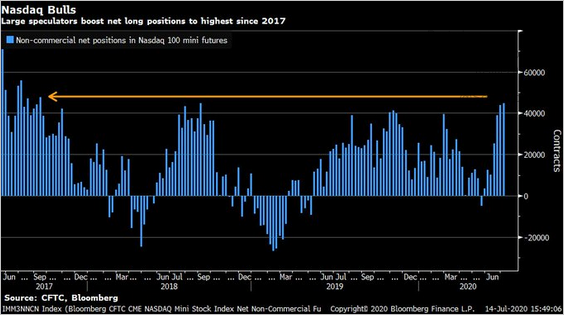 Source: @LizAnnSonders, @CFTC, @Bloomberg
——————–
6. Nervousness about the November elections persists. This chart compares the trends in VIX vs. the October VIX futures contract.
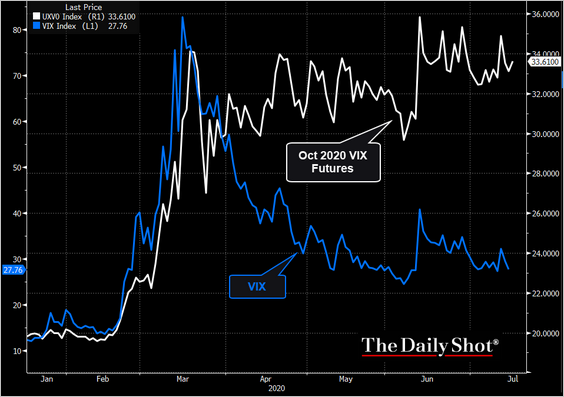 Source: @TheTerminal
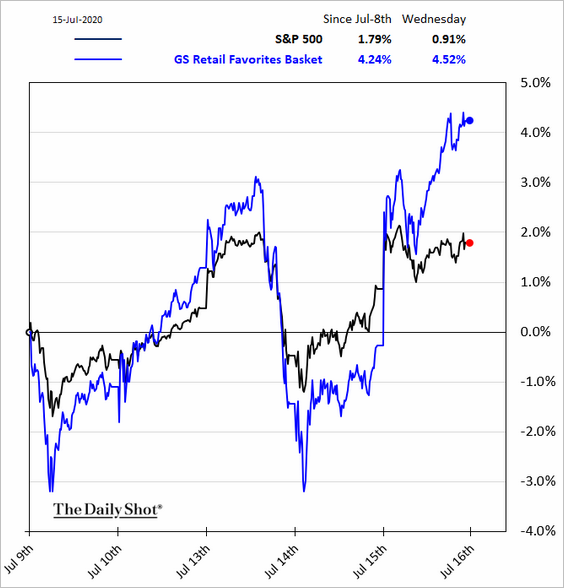
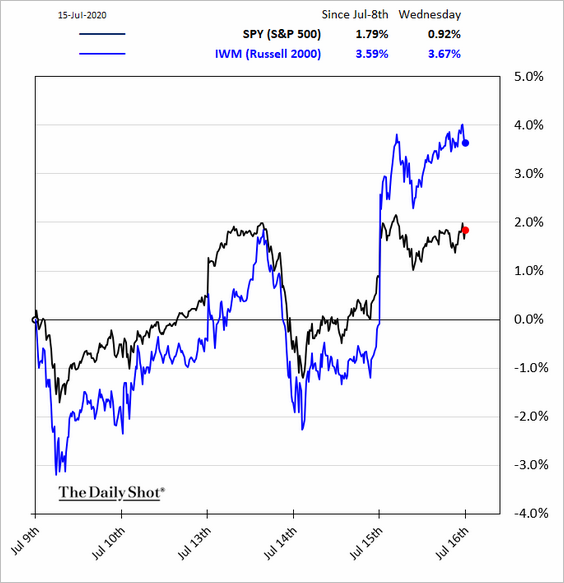
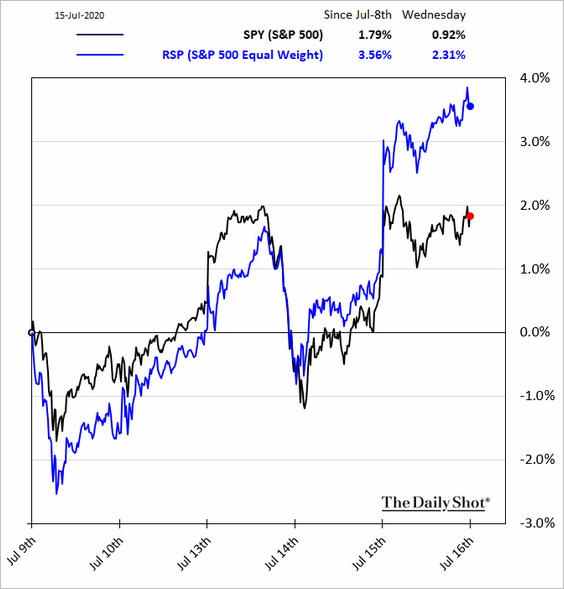
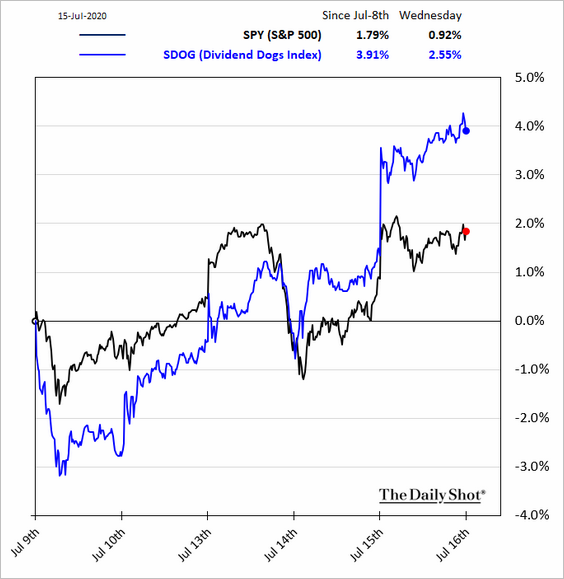
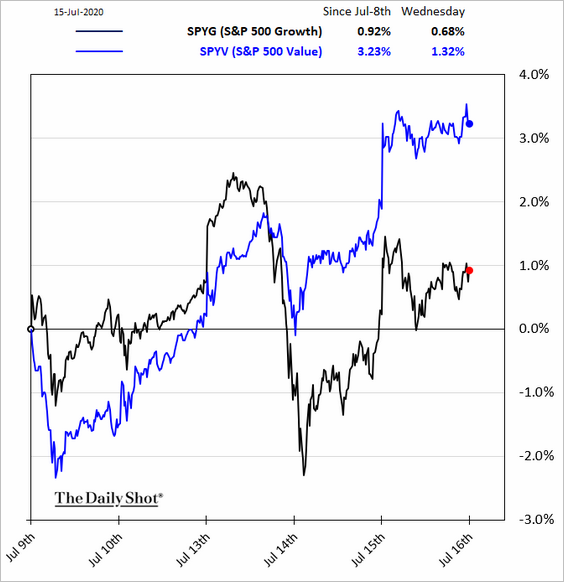
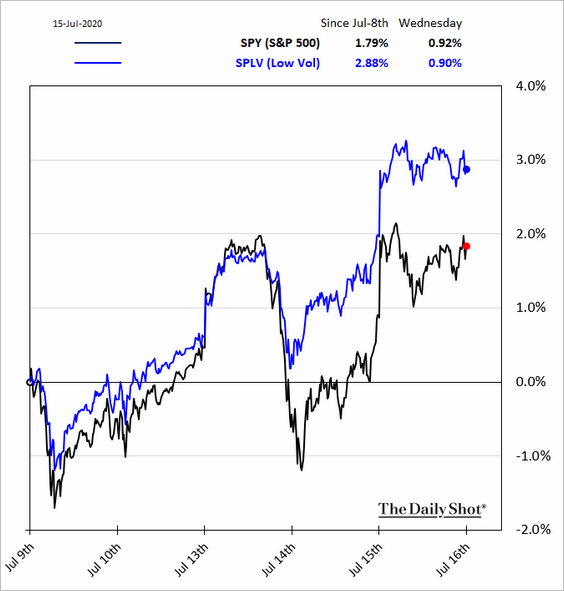
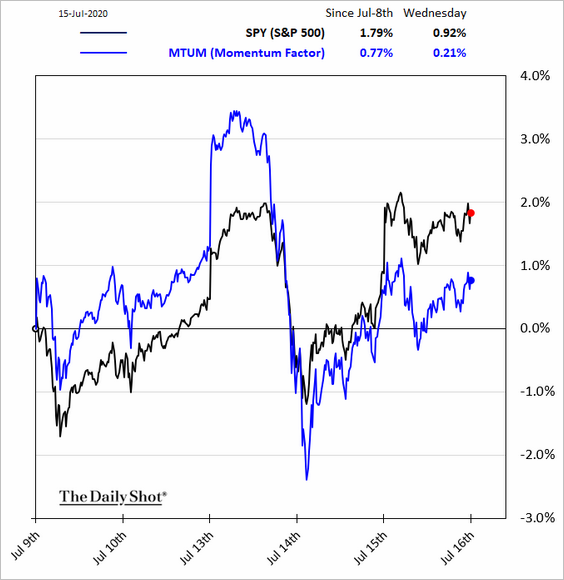
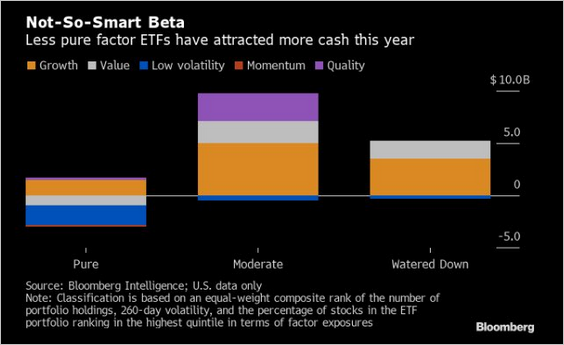
7. Finally, we have some updates on equity factor/style movements over the past five trading days.
• Stocks preferred by retail investors:
• Small caps:
• Equal-weigh S&P 500:
• Dividend dogs:
• Growth vs. value:
• Low-vol:
• Momentum:
By the way, investors have been moving money into “watered-down” factor funds that behave more like the benchmark index.
 Source: @LizAnnSonders, @TheTerminal
Credit
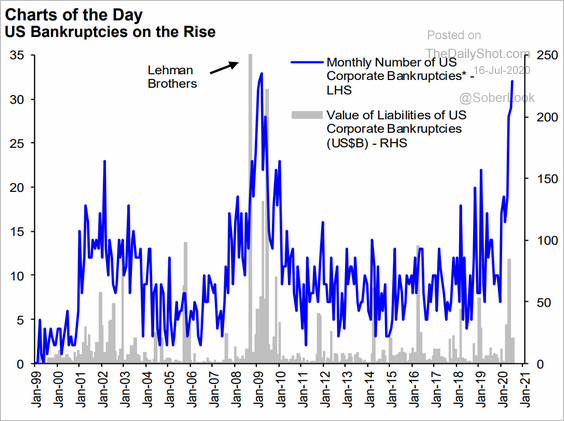
1. US bankruptcies continue to climb.
 Source: Hugo Ste-Marie, Portfolio & Quantitative Strategy Global Equity Research, Scotia Capital
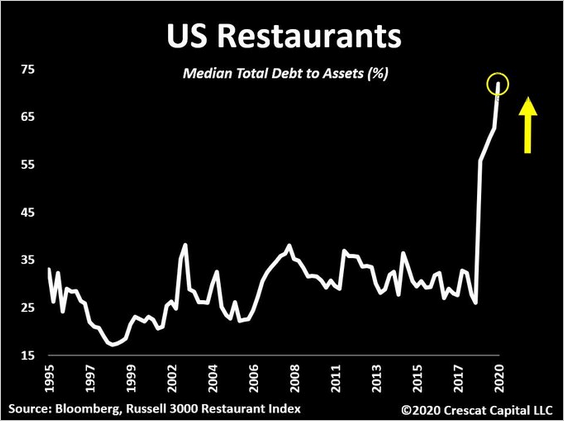
2. Restaurants’ leverage soared this year.
 Source: @TaviCosta
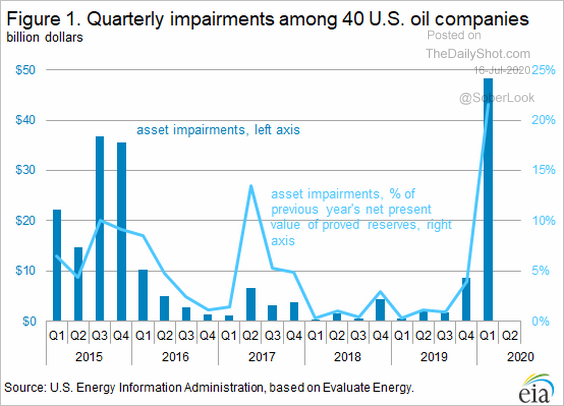
3. US oil companies show massive asset impairments.
 Source: EIA
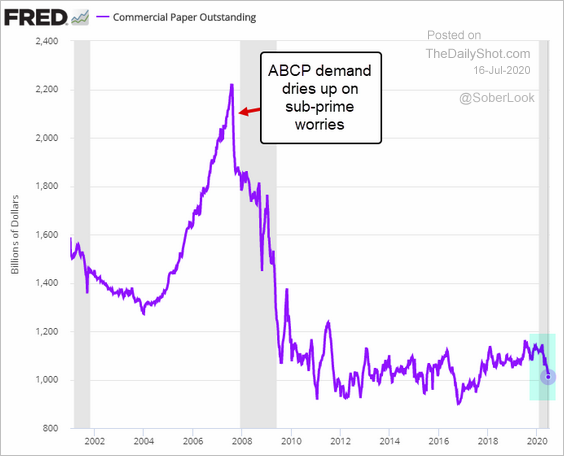
4. US commercial paper outstanding has been declining as companies term out their debt (issuing bonds).
Rates
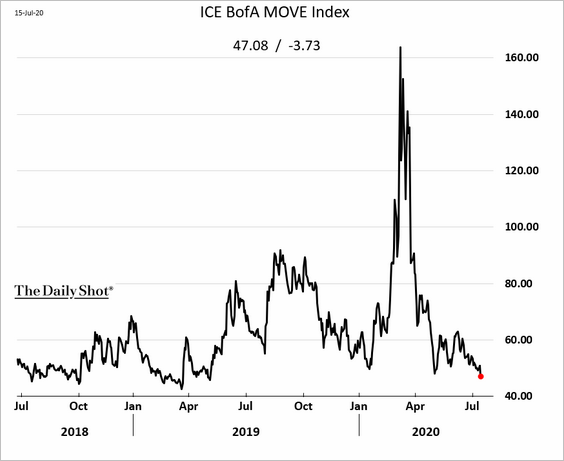
Treasury market implied volatility is at the lowest level in over a year, …
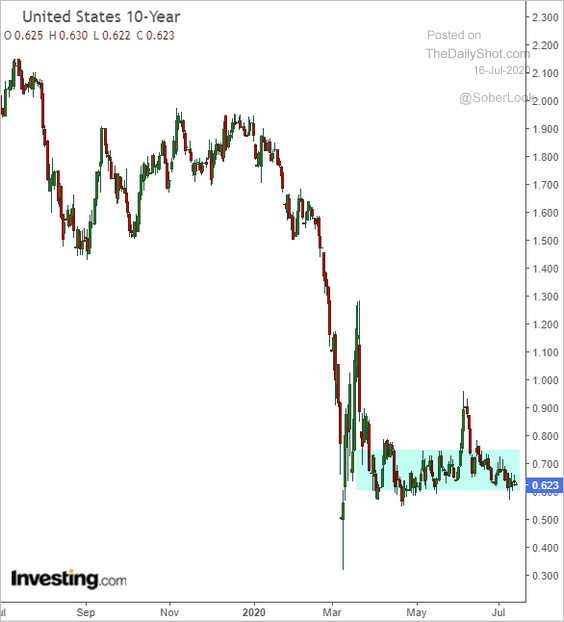
… as yields remain range-bound.
——————–
Food for Thought
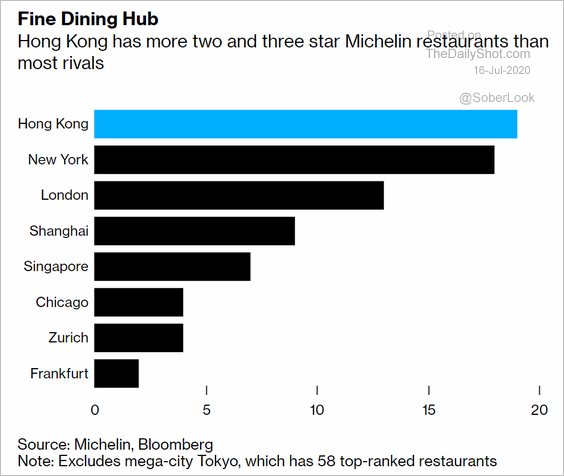
1. Cities with the most top-rated restaurants:
 Source: @business Read full article
2. Bicycle activity changes in Europe:
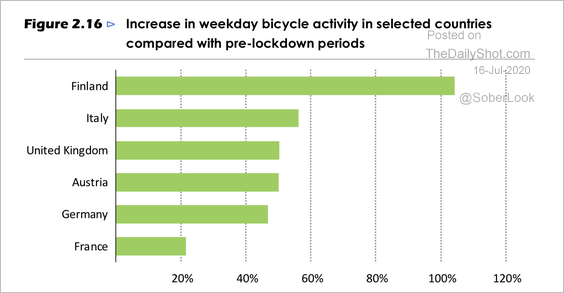 Source: IEA Read full article
And bike-friendly cities:
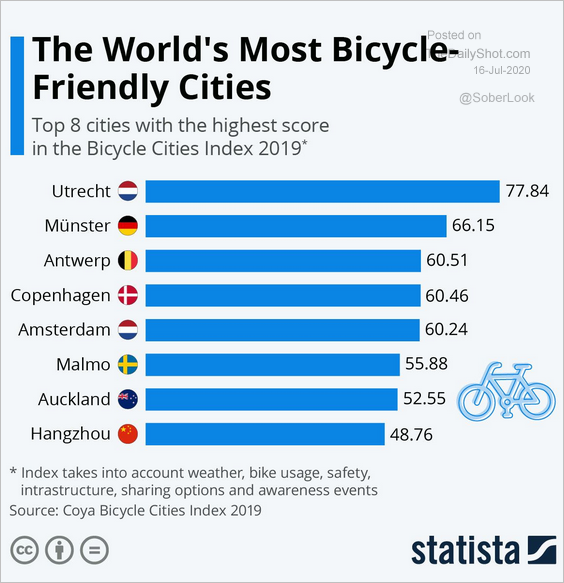 Source: Statista
——————–
3. Americans’ comfort level with traveling abroad:
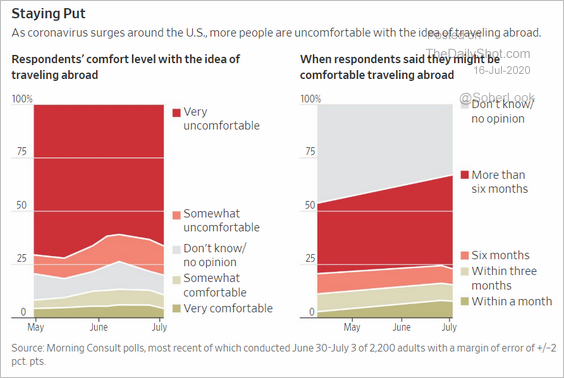 Source: @WSJ Read full article
4. The distribution of US COVID-19 diagnosis costs:
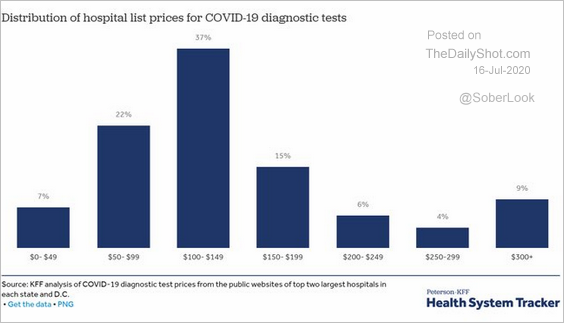 Source: @cynthiaccox, @nisha_kurani Read full article
5. The number of women in the US Congress:
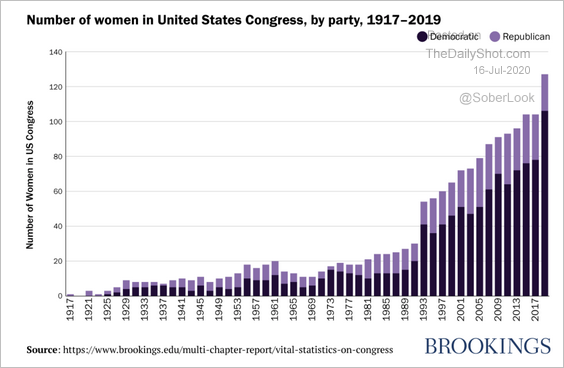 Source: Brookings Institution Read full article
6. Support for the Facebook advertiser boycott:
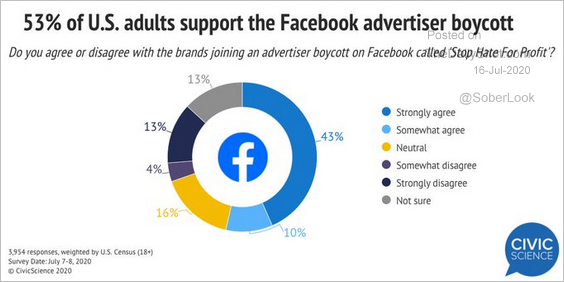 Source: @CivicScience
7. Support for a policy that makes masks mandatory in public places:
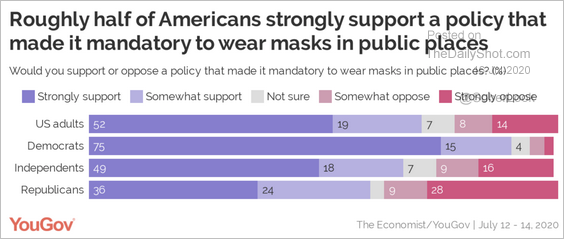 Source: @TheEconomist, @YouGovAmerica Read full article
8. Background checks for firearms:
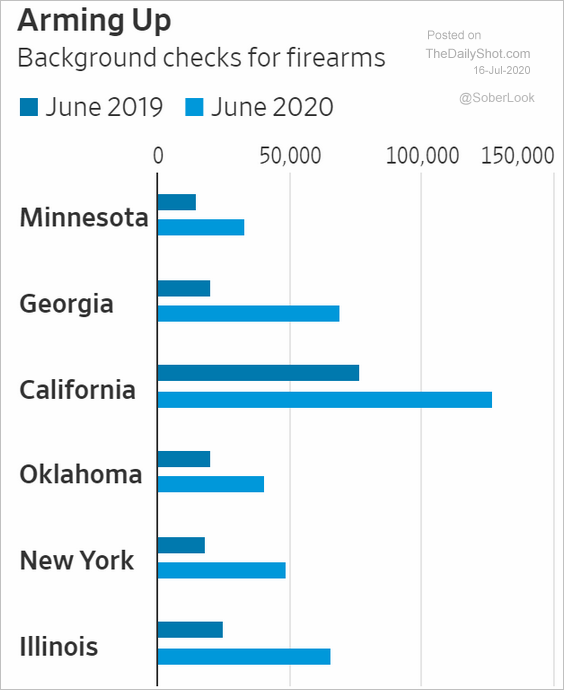 Source: @WSJ Read full article
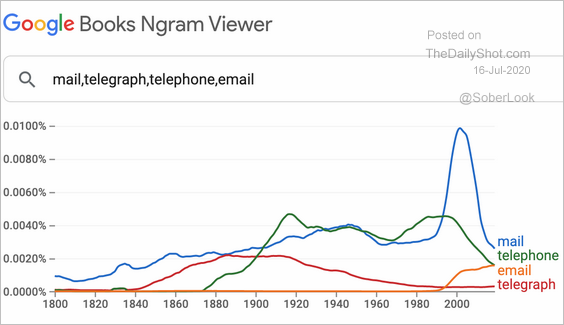
9. Words ‘mail,’ ‘telegraph,’ ‘telephone,’ and ’email’ appearing in books published since 1800:
 Source: @searchliaison
——————–