
The Daily Shot: 20-Jul-20
• The United States
• Europe
• Asia – Pacific
• China
• Emerging Markets
• Cryptocurrency
• Commodities
• Energy
• Equities
• Credit
• Rates
• Global Developments
• Food for Thought
The United States
1. The June building permits figure was a bit softer than the market was expecting (second chart).
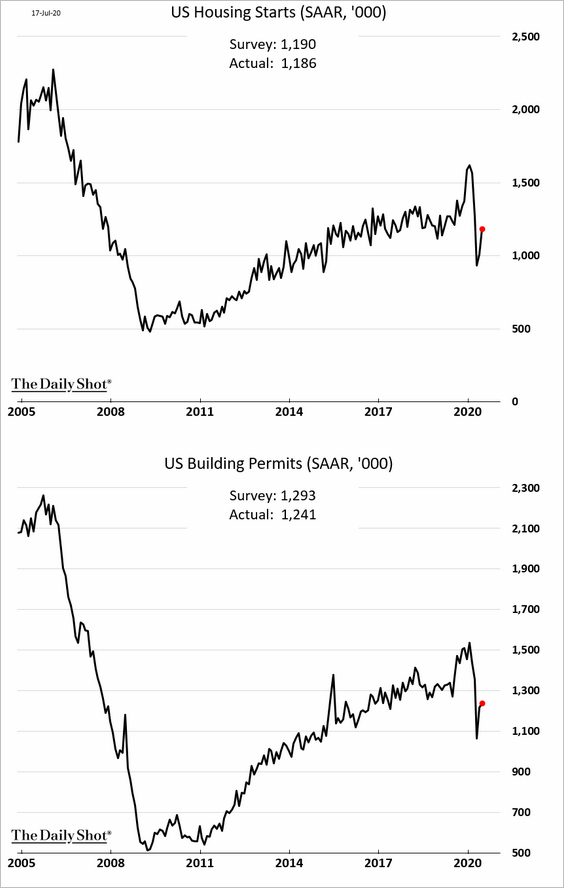
However, the weakness was all in multi-family housing.
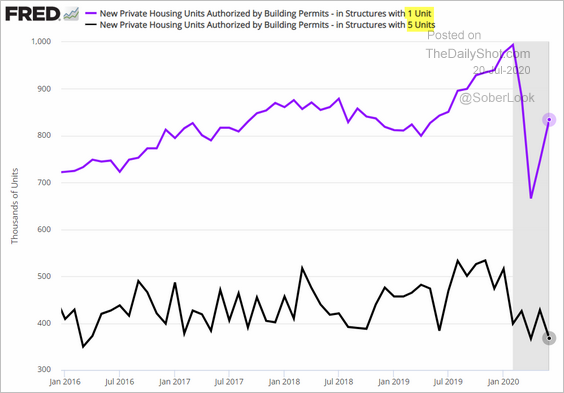
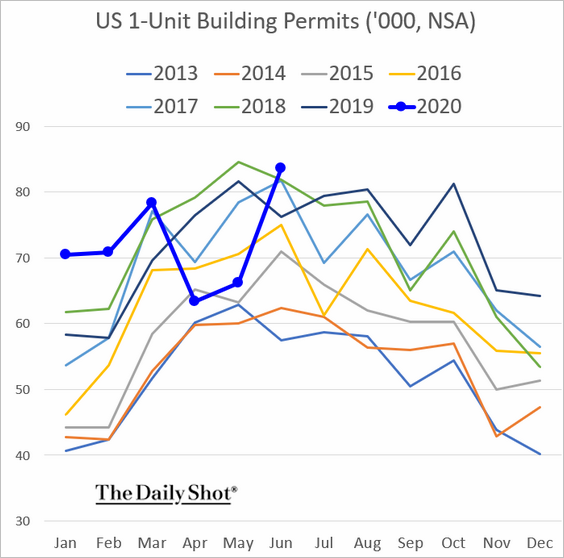
Here is the permits situation for single-family housing without the usual seasonal adjustments. Residential construction remains robust.
——————–
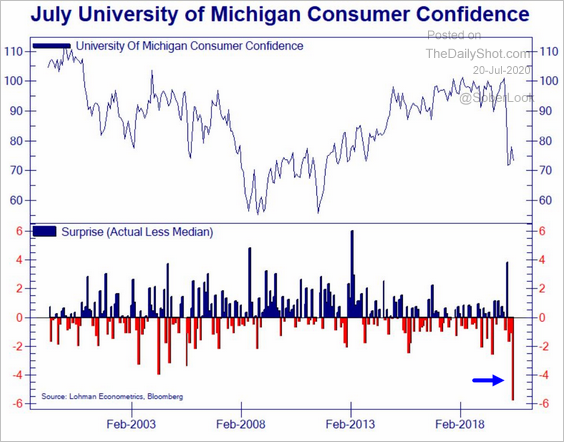
2. The U. Michigan Consumer Sentiment report surprised to the downside as confidence took a turn for the worse in July.
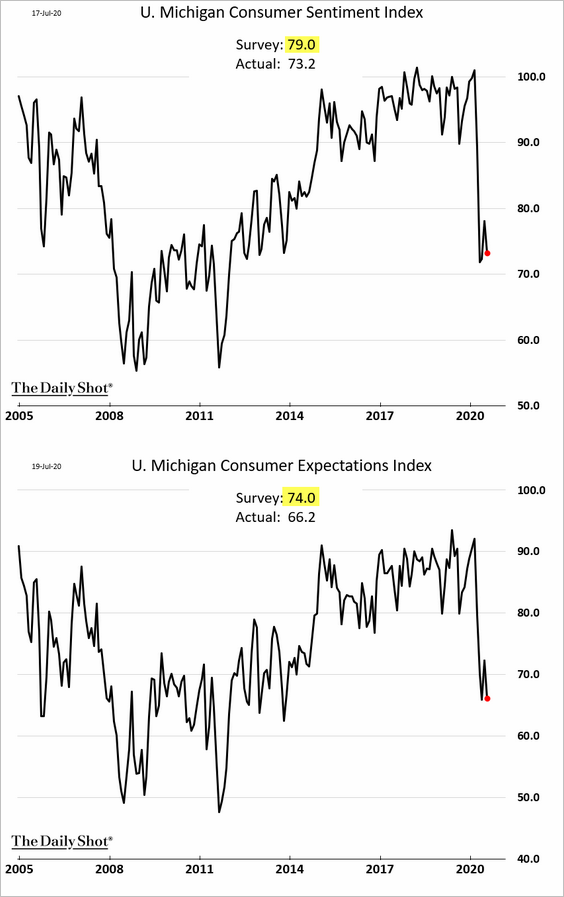
• The downshift in sentiment was substantial.
 Source: @Not_Jim_Cramer
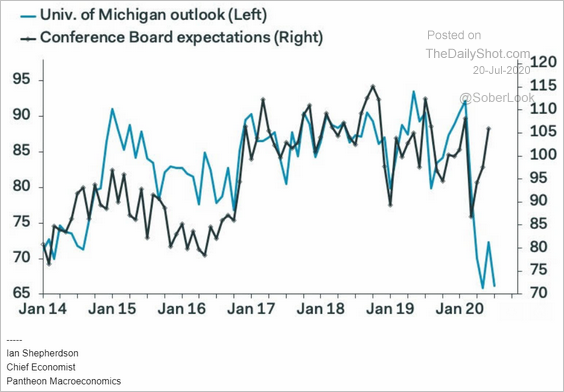
• Will we see a similar downturn in the Conference Board’s confidence indicator as well?
 Source: Pantheon Macroeconomics
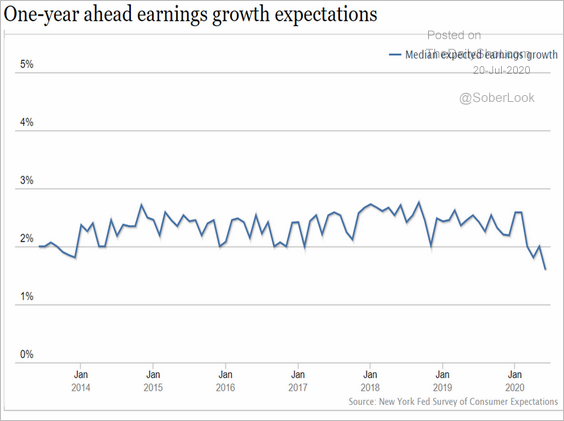
• The New York Fed’s national survey shows worsening expectations of earnings going forward.
 Source: New York Fed
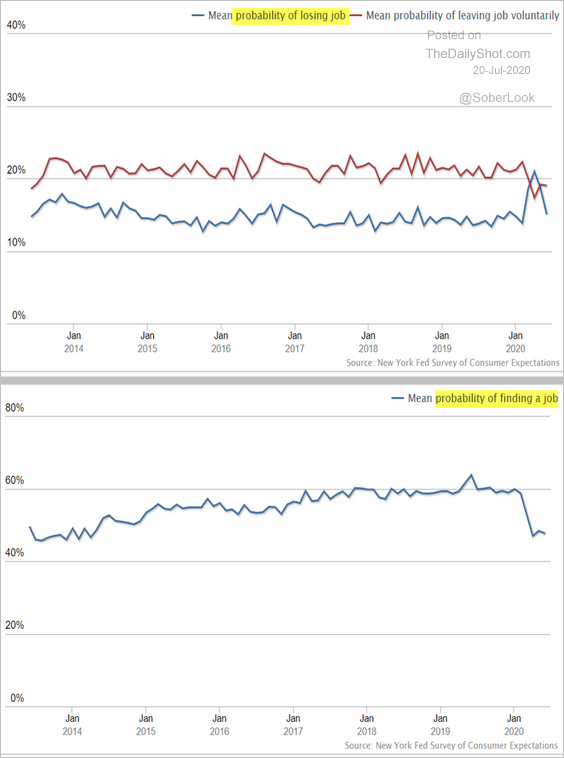
• There is less concern about job loss, but the probability of finding a job has declined.
 Source: New York Fed
——————–
3. This chart illustrates the impact of expanded unemployment benefits on spending. Government cash is the reason we saw such a sharp rebound in retail sales.
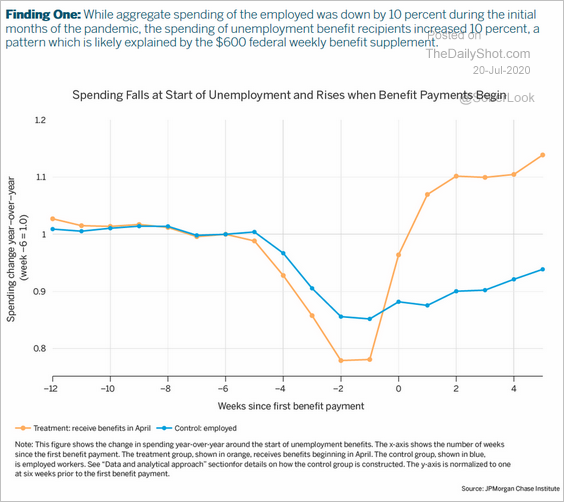 Source: @GregDaco, JPMorgan Chase Institute Read full article
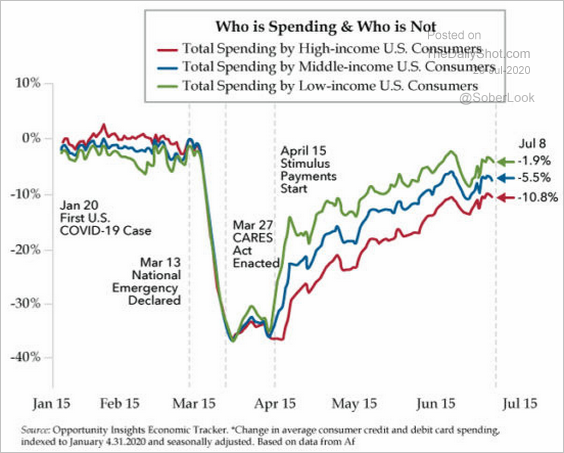
The federal aid is also the reason spending by lower-income consumers recovered faster. Will the government extend the current unemployment benefits beyond July?
 Source: The Daily Feather
——————–
4. Depending on the size of the additional stimulus, the federal deficit could exceed the WW-II high.
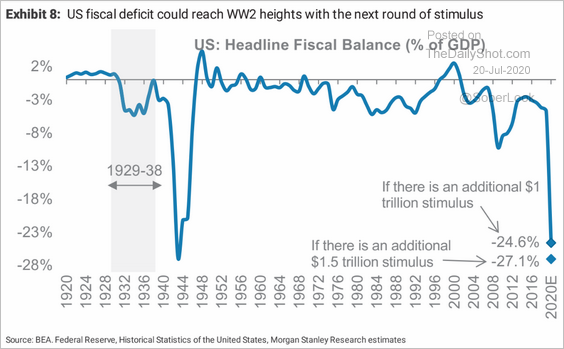 Source: Morgan Stanley Research
• Here the US fiscal response vs. the rest of the world (% of GDP).
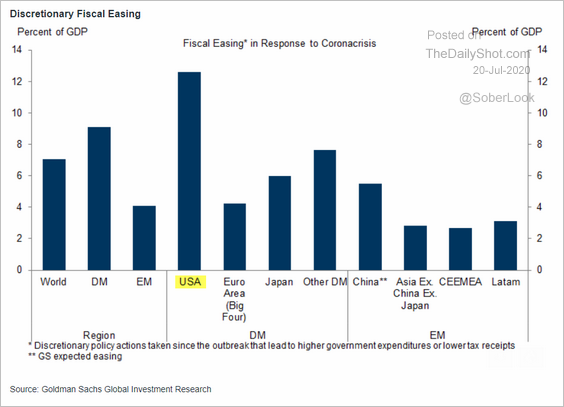 Source: Goldman Sachs
• The federal assistance to state and local governments created a substantial boost to the GDP.
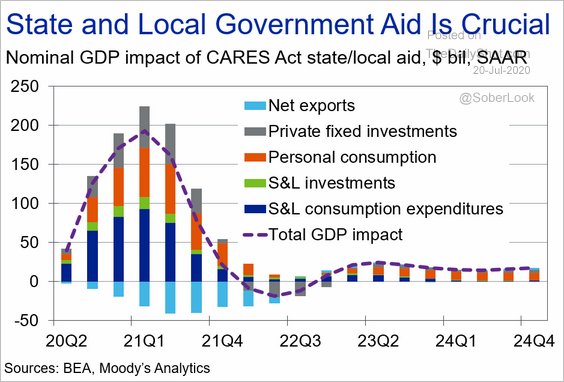 Source: Moody’s Analytics
——————–
5. Railcar loadings appear to be stabilizing.
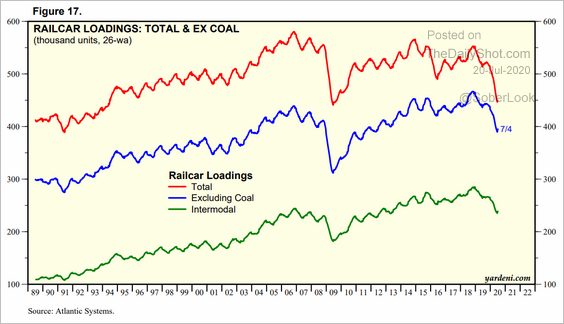 Source: Yardeni Research
6. Childcare establishments’ reopening pace has been slow.
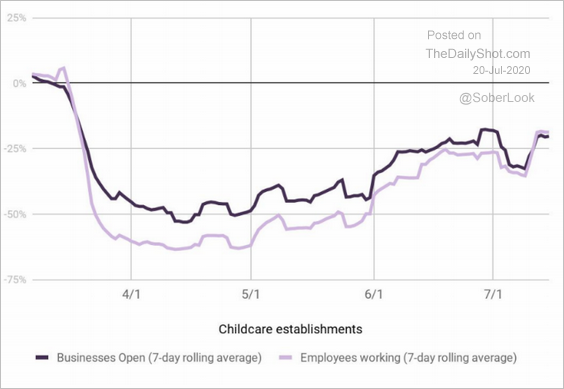 Source: Homebase Read full article
7. According to Gavekal, US infections should peak by mid-August.
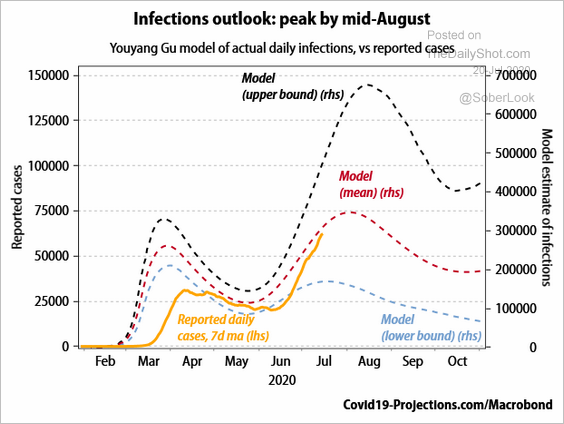 Source: Gavekal
And fatalities will peak between late August and mid-September.
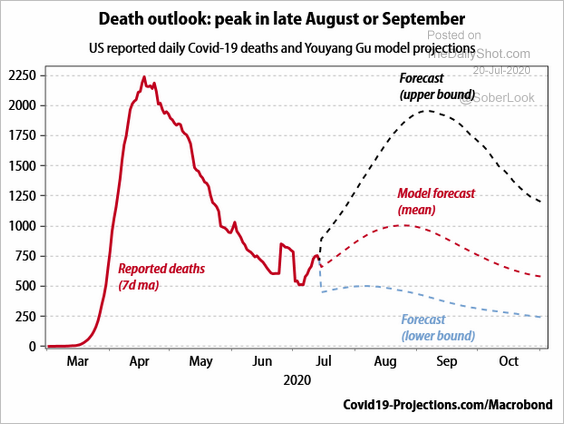 Source: Gavekal
Europe
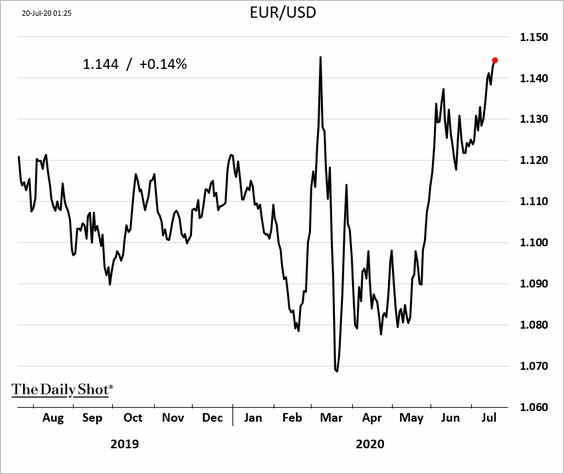
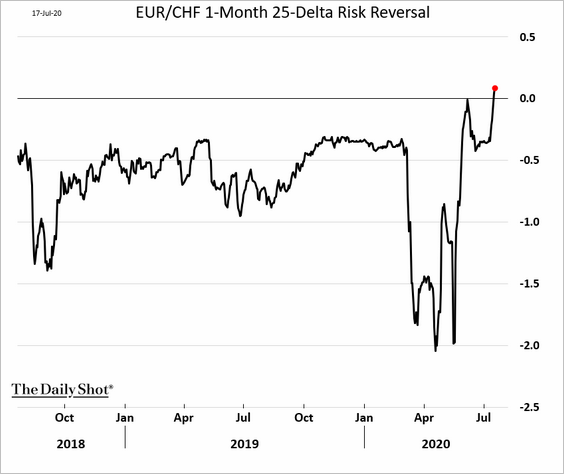
1. The euro continues to advance.
The EUR/CHF risk reversal shows increased bets on the euro vs. the Swiss franc.
 h/t Vassilis Karamanis
——————–
2. Google trends data point to more job losses in the UK.
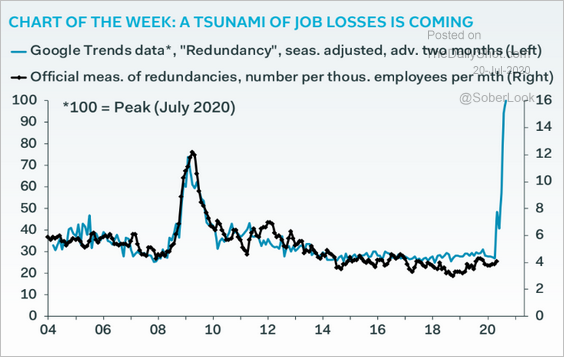 Source: Pantheon Macroeconomics, @samueltombs
3. Will we see unemployment rise in the Eurozone as job retention schemes end?
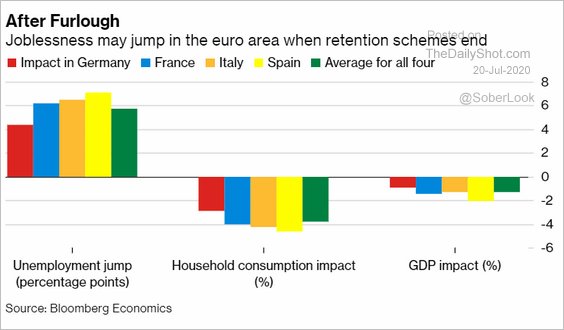 Source: @markets Read full article
Asia – Pacific
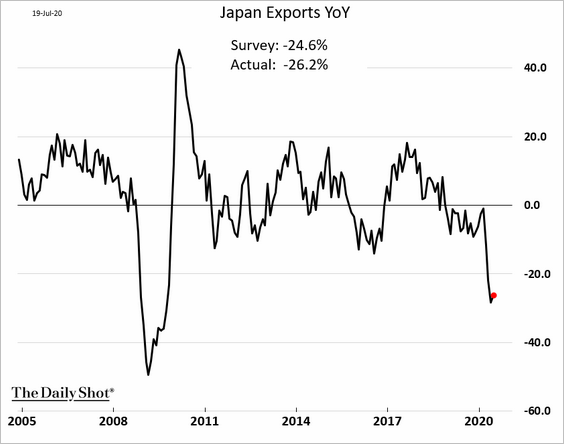
1. Japan’s exports saw no meaningful improvement last month.
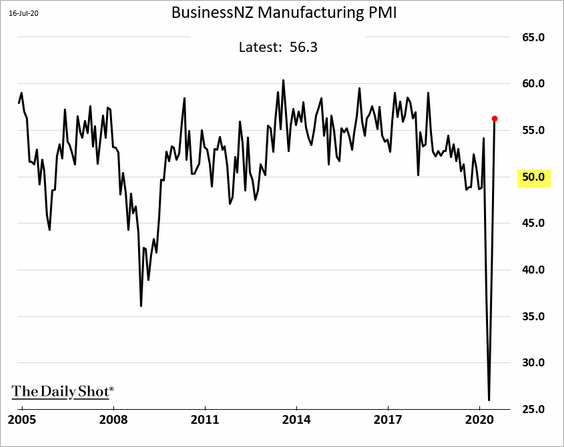
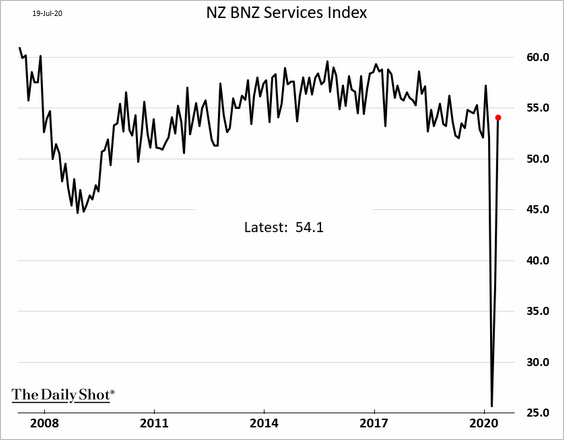
2. New Zealand’s business activity is back in growth mode.
• Manufacturing (see story):
• Services:
——————–
3. Australia’s recent decline in restaurant bookings is outpacing other countries.
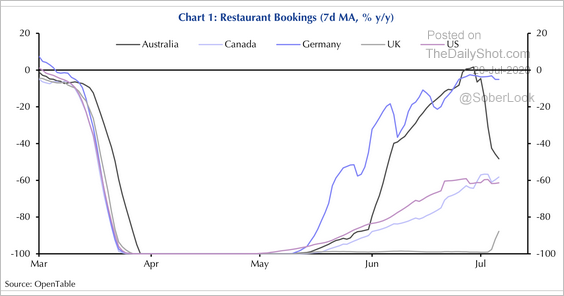 Source: Capital Economics
4. The long-term relationship between AUD and iron-ore has eroded since 2017.
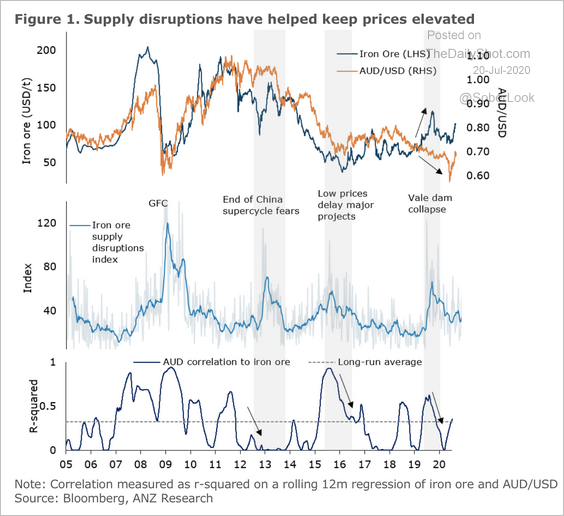 Source: ANZ Research
AUD now has a stronger relationship to commodities such as copper, oil, and gold.
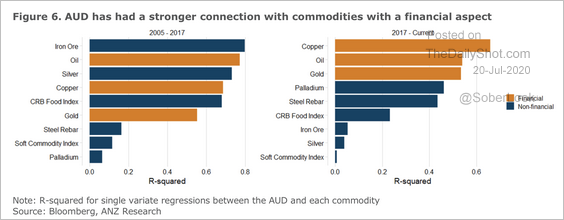 Source: ANZ Research
China
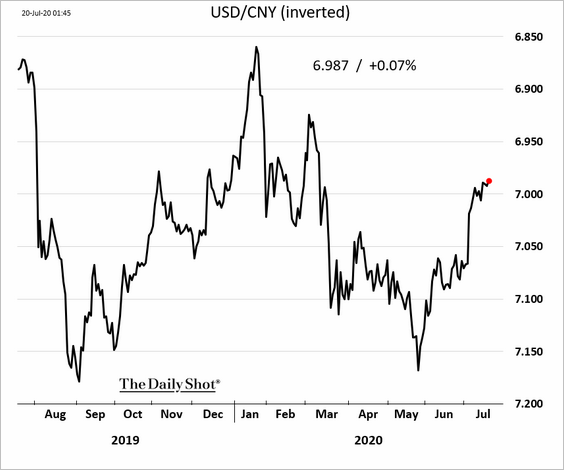
1. The renminbi is grinding higher.
2. Small banks have been issuing subordinated perpetual debt.
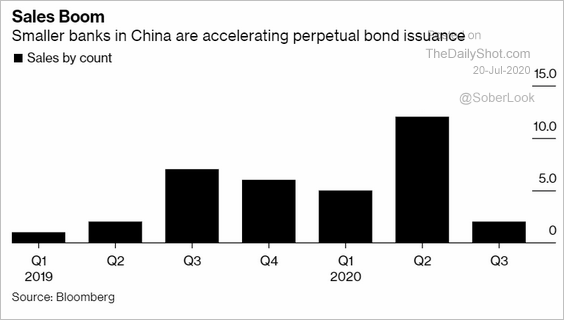 Source: @markets Read full article
3. China’s households increasingly own more than one property.
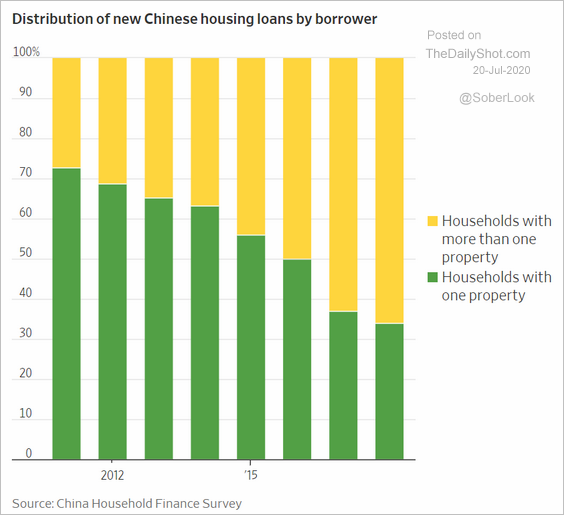 Source: @WSJ Read full article
Emerging Markets
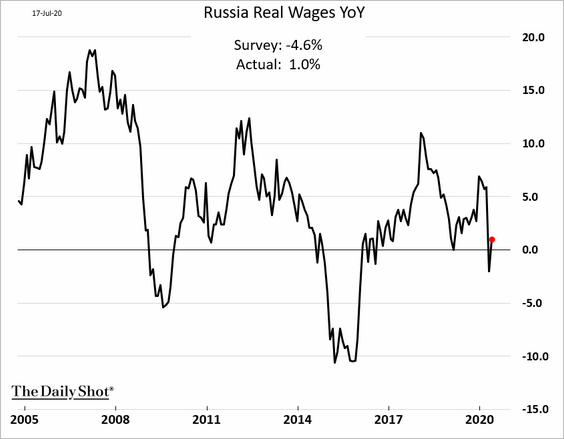
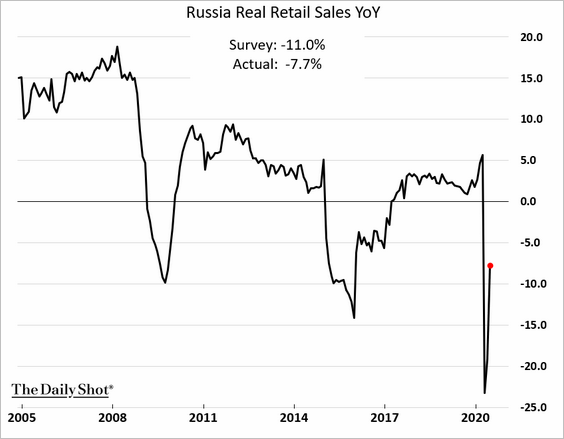
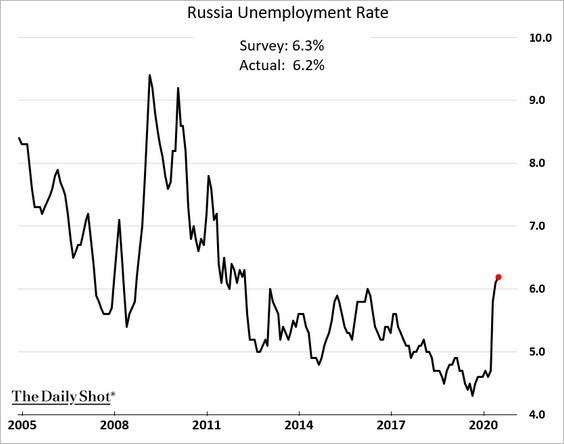
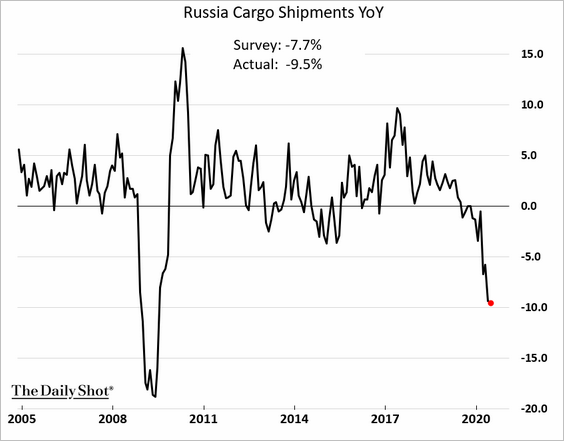
1. Here are some updates on Russia (as of June).
• Real wages (an upside surprise):
• Retail sales:
• The unemployment rate:
• Cargo shipments:
——————–
2. India’s business outlook has been terrible.
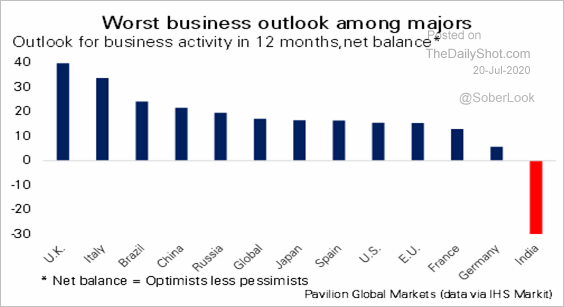 Source: Pavilion Global Markets
Cryptocurrency
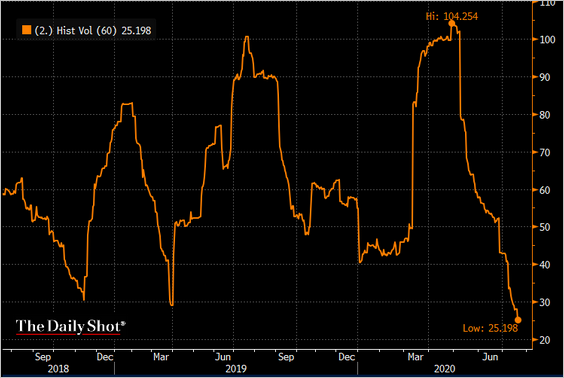
Bitcoin has been locked in a range.
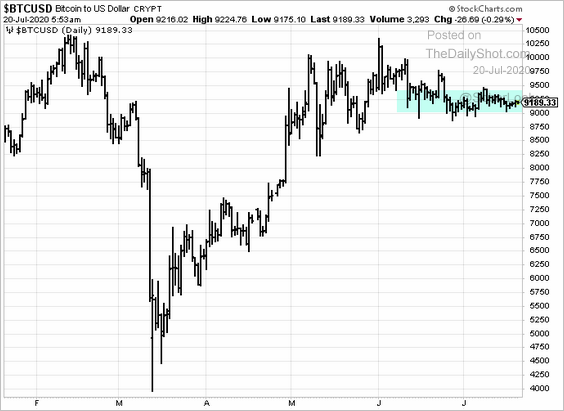
Here is the 60-day realized volatility.
Commodities
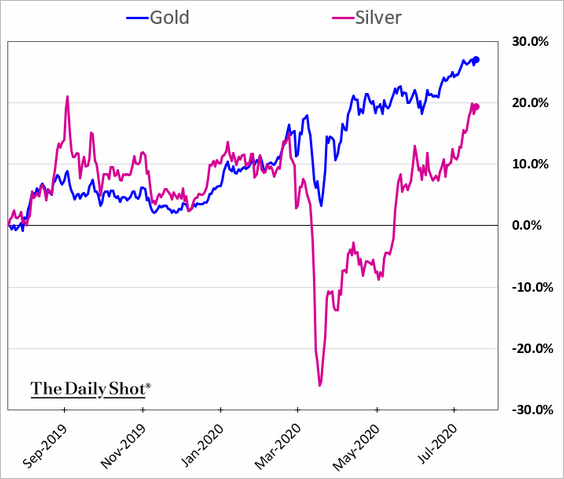
1. Silver is still lagging gold year-to-date, but the gap is closing.
2. What are the key risks for mining firms in the second half of the year?
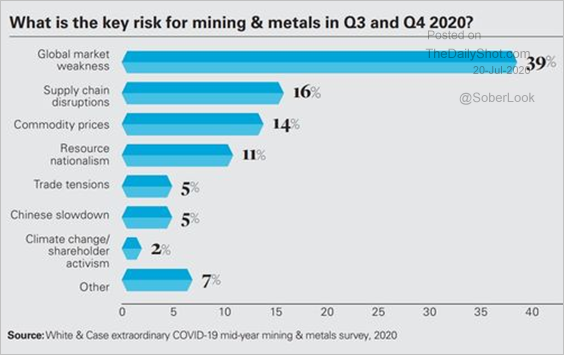 Source: @MiningJournal, @SPGMarketIntel Read full article
3. This chart shows US agricultural exports to China.
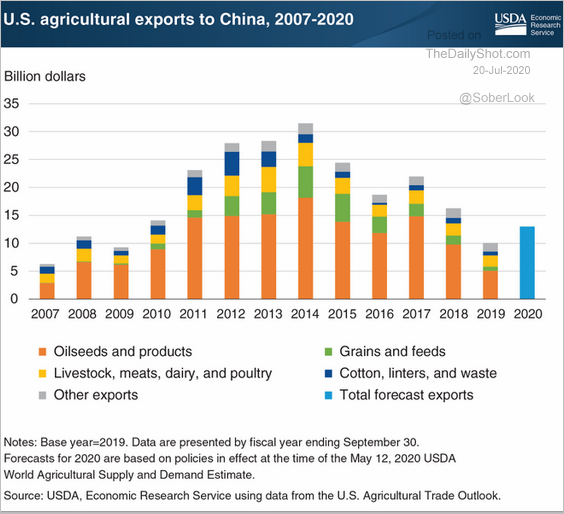 Source: @USDA_ERS Read full article
4. Coffee is rebounding as inventories tighten.
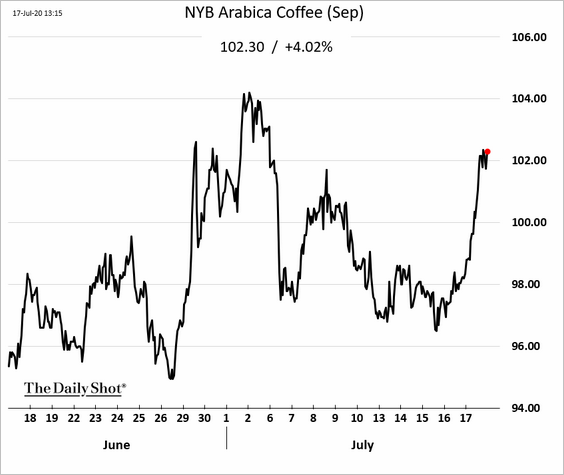
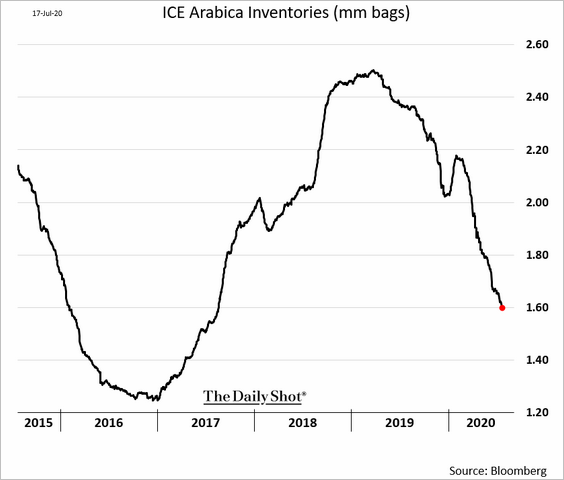 h/t Marvin G. Perez
Energy
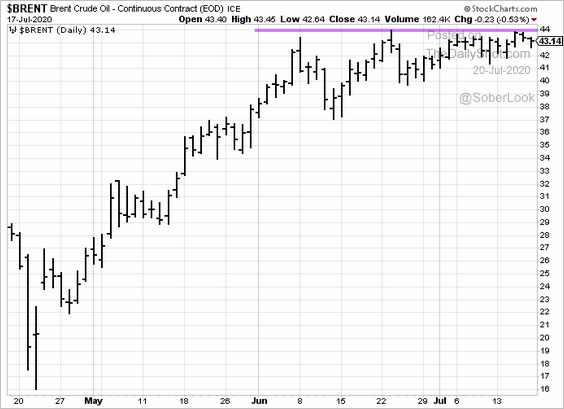
1. Brent is holding resistance.
2. Non-OPEC oil production is highly sensitive to price (which is not the case for most OPEC members).
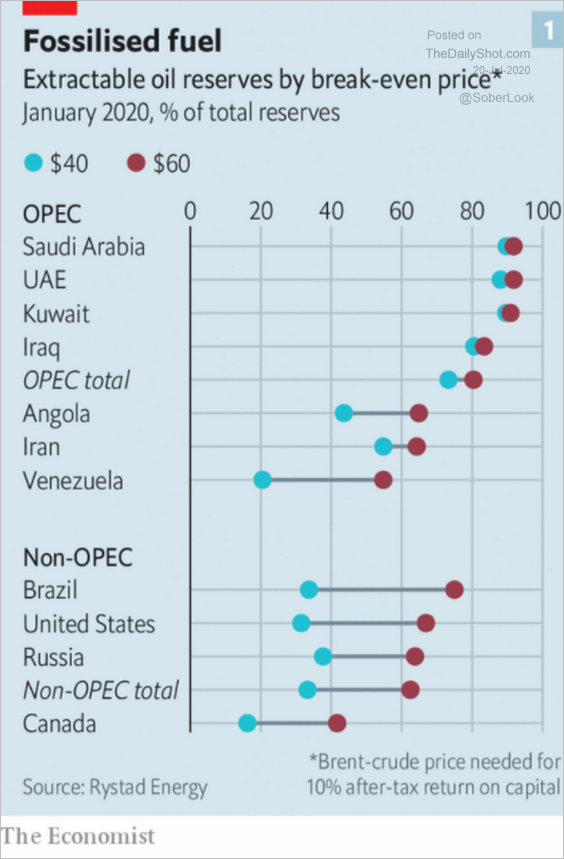 Source: @adam_tooze, @TheEconomist Read full article
Equities
1. Let’s start with the S&P 500 seasonality chart, which shows the market performance 60 days out.
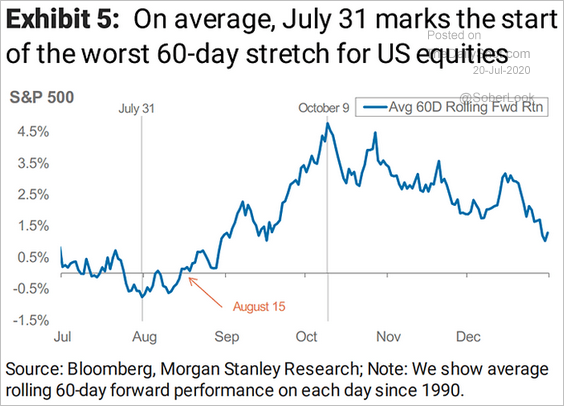 Source: @ISABELNET_SA, @MorganStanley
2. Foreigners boosted US share purchases last month.
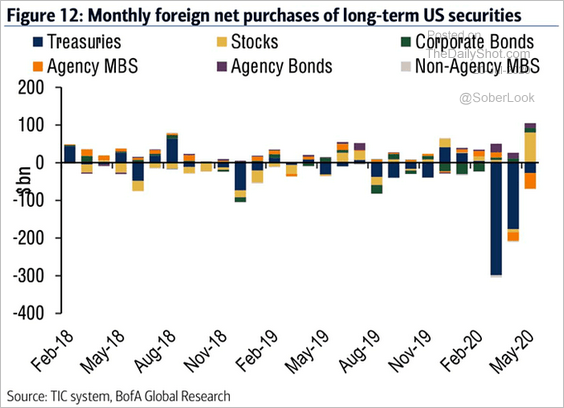 Source: @ISABELNET_SA, @BofAML
3. Investment managers have been bullish.
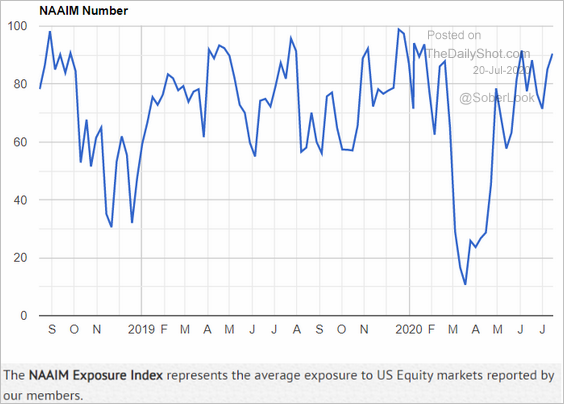 Source: National Association of Active Investment Managers, {ht} @ISABELNET_SA
4. Will global liquidity propel the market higher?
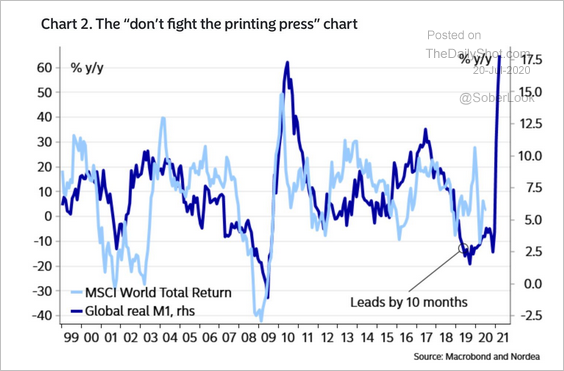 Source: @AndreasSteno Read full article
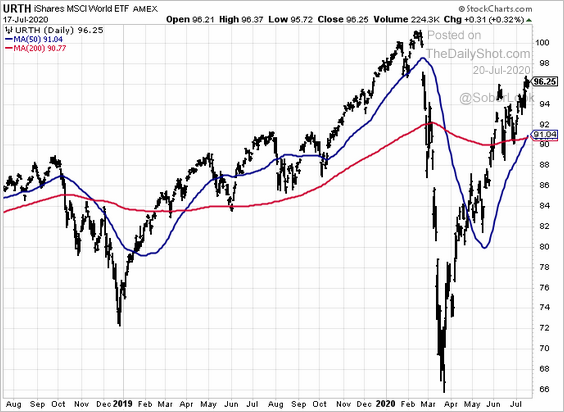
5. The iShares global equity ETF has formed a golden cross.
6. Equity risk premium and the PE ratio have diverged,
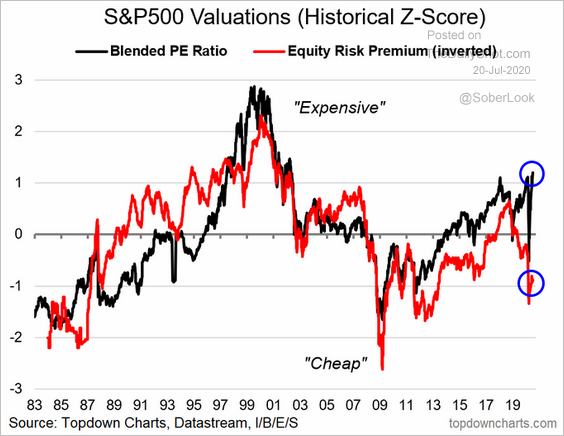 Source: @Callum_Thomas
7. Here is the S&P 500 (year-over-year) vs. the U. Michigan Consumer Sentiment Index.
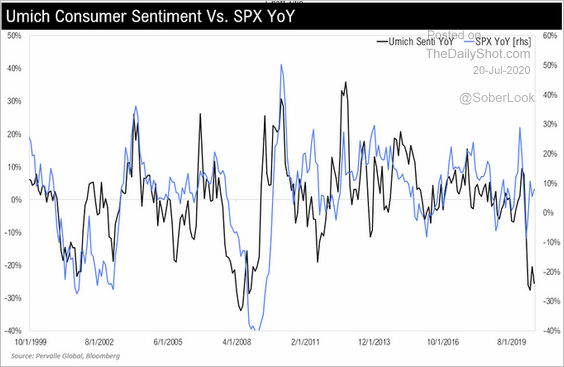 Source: @TeddyVallee
8. The market has been signaling a pause in US recovery.
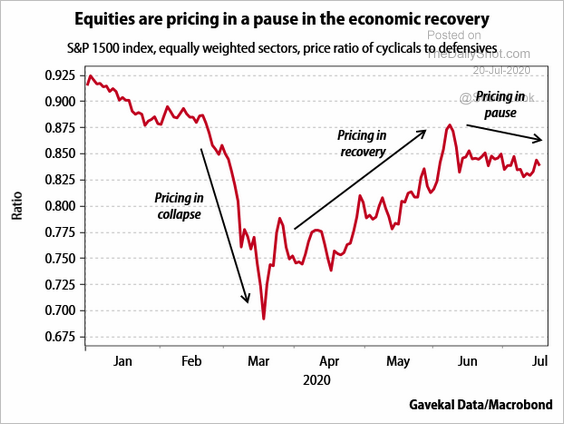 Source: Gavekal
9. Below is a look at market performance year-to-date.
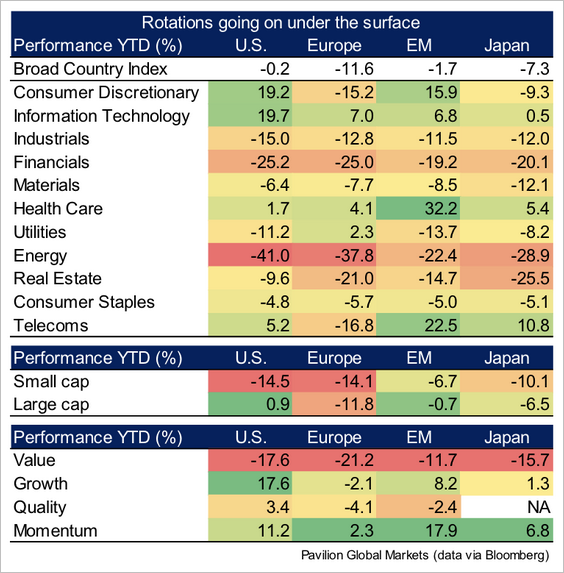 Source: Pavilion Global Markets
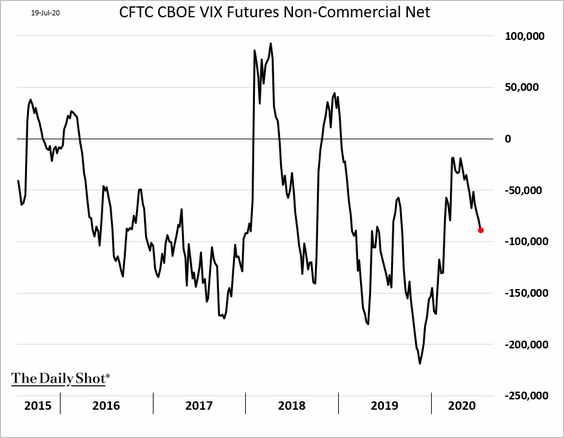
10. Speculative accounts are once again boosting their net-short position in VIX futures.
Credit
1. US corporate bond market size continues to climb.
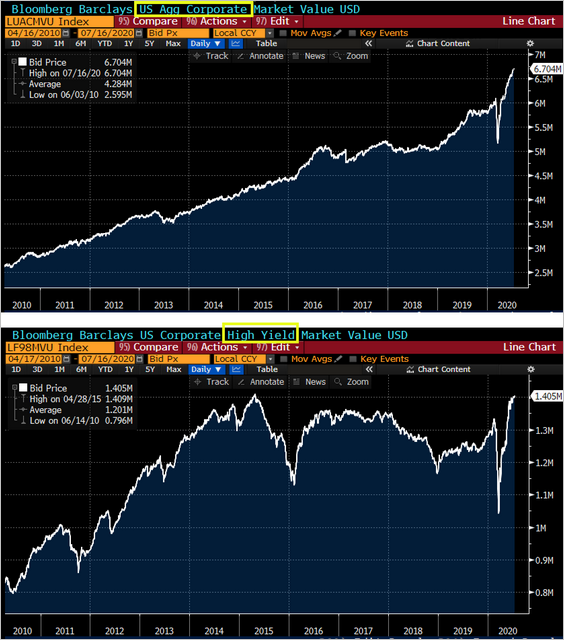 Source: @lisaabramowicz1
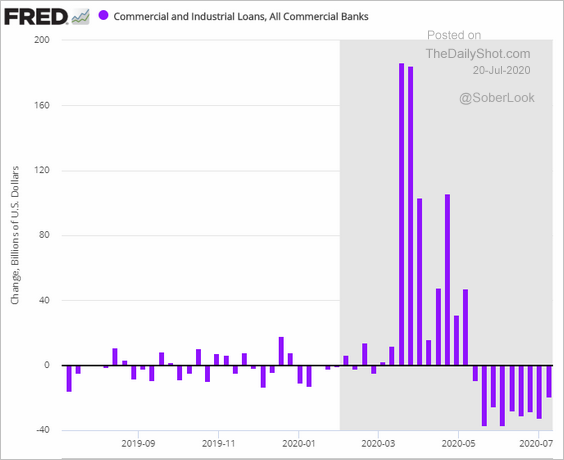
2. Bank-held business loans have been declining as firms tap capital markets to repay their revolving balances.
3. US leveraged loans continue to get covenant-relief amendments.
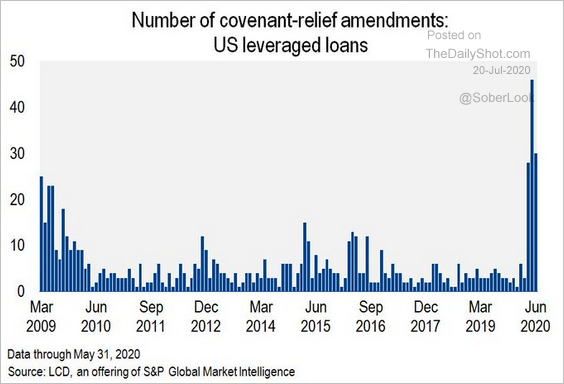 Source: @lcdnews Read full article
4. Finally, we have some data on changes in commercial real estate delinquency rates.
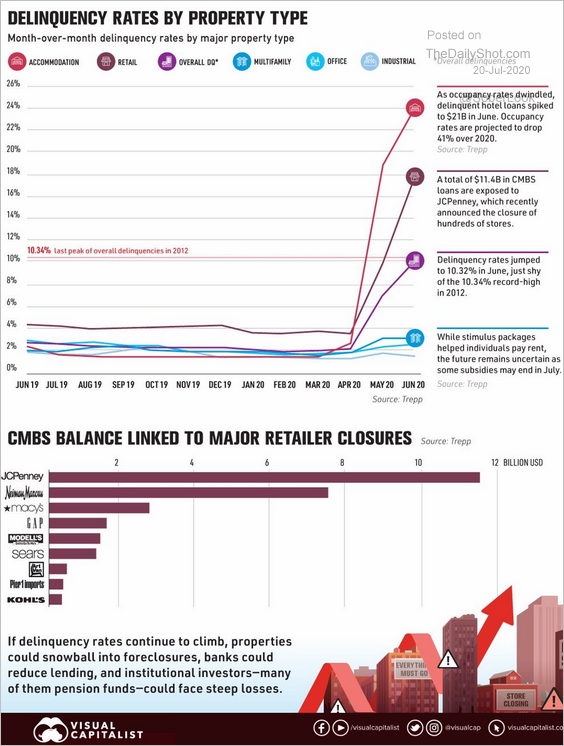 Source: @DiMartinoBooth Read full article
Rates
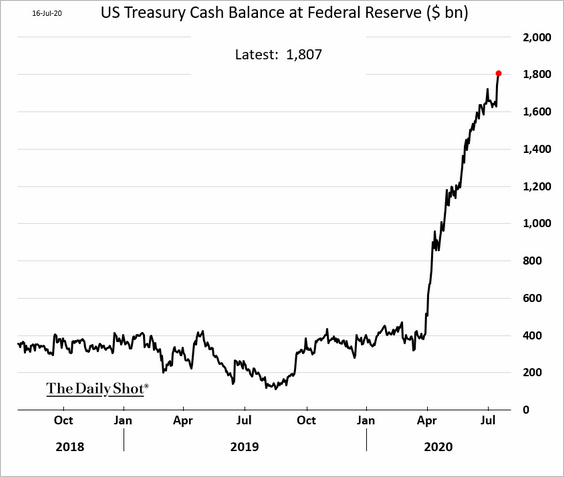
1. Declining reserves have been putting upward pressure on the fed funds rate.
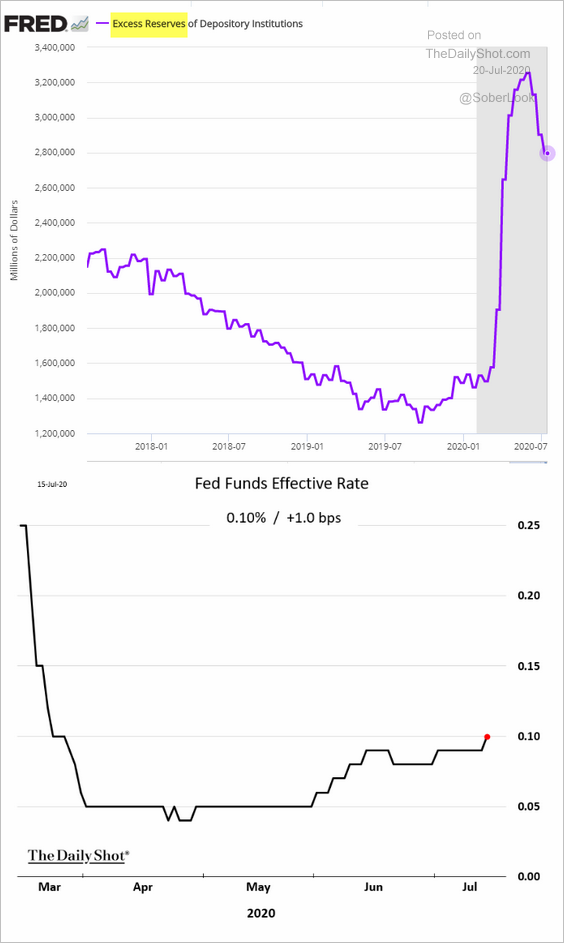
Reserves are lower due to the latest downturn in the Fed’s balance sheet as well as further increases in the US Treasury’s cash holdings with the Federal Reserve (which drains private-sector deposits). The federal government now holds over $1.8 trillion at the Fed.
——————–
2. Here is a summary of the Fed’s credit/liquidity facilities.
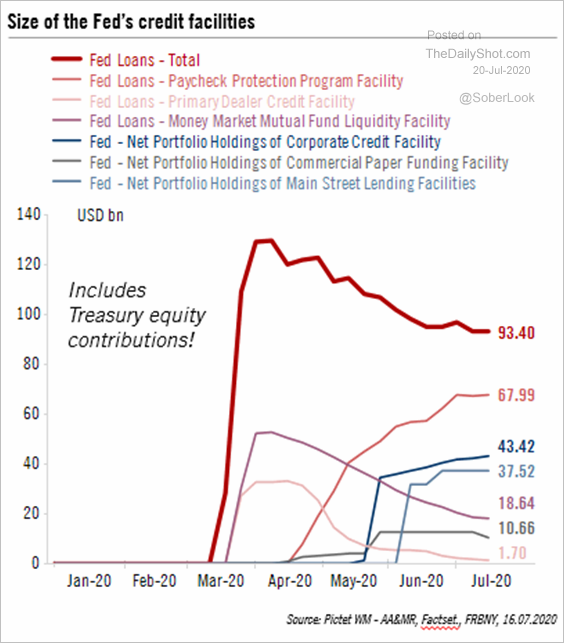 Source: Pictet Wealth Management , @ChatelainRenaud
3. Global government bond yields are converging with JGBs.
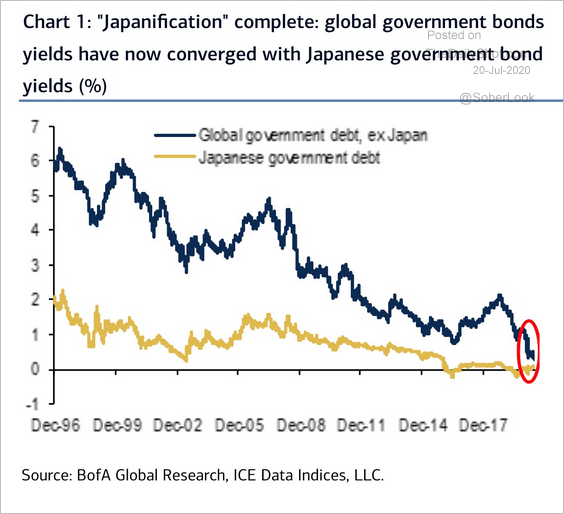 Source: BofA Merrill Lynch Global Research, @Schuldensuehner
Global Developments
1. The trade-weighted US dollar index is testing decade-long uptrend support.
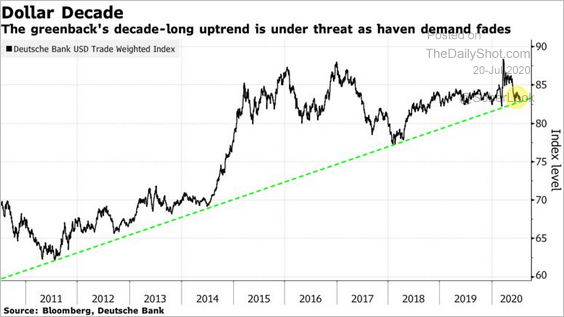 Source: @markets, {ht} @ISABELNET_SA Read full article
Asset managers are betting that support will not hold.
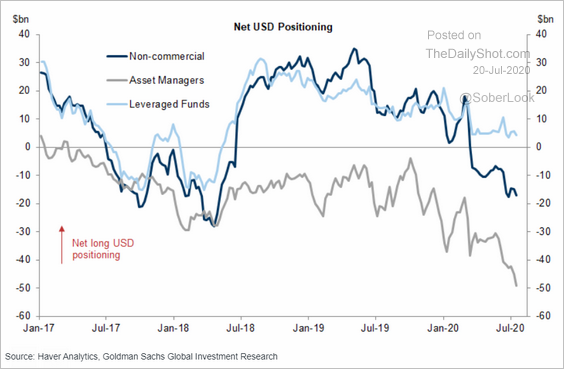 Source: Goldman Sachs
——————–
2. Less than one-third of investors surveyed by Scotiabank are fully invested.
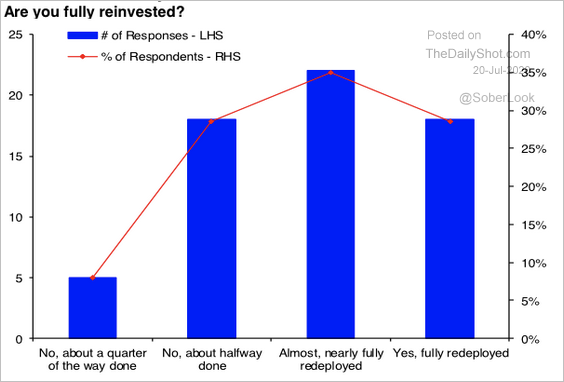 Source: Hugo Ste-Marie, Portfolio & Quantitative Strategy Global Equity Research, Scotia Capital
Investors have increased exposure to equities and, to a lesser extent, corporate bonds.
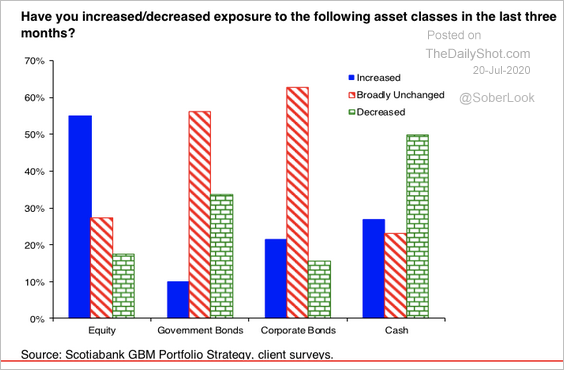 Source: Hugo Ste-Marie, Portfolio & Quantitative Strategy Global Equity Research, Scotia Capital
——————–
3. Advanced economies experienced a much larger downturn in trade than EM countries.
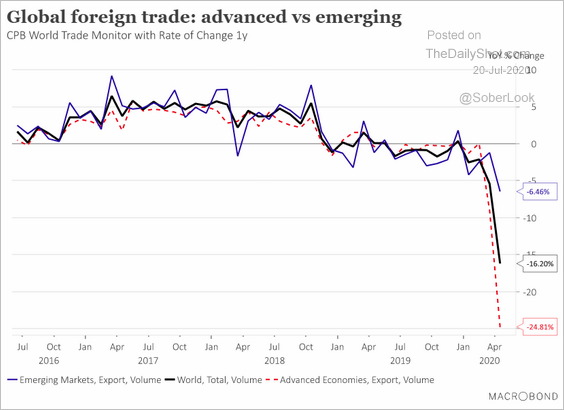 Source: Macrobond
——————–
Food for Thought
1. The most profitable company in each state:
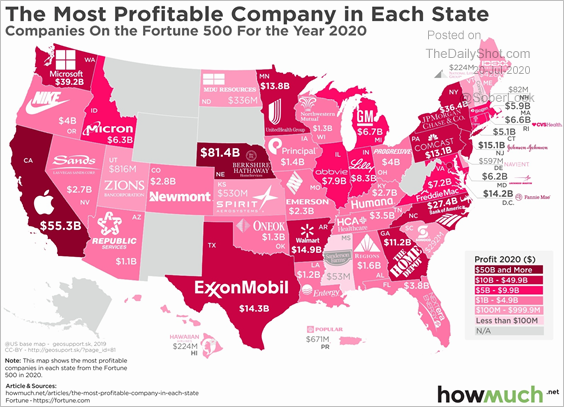 Source: @howmuch_net Read full article
2. Nasdaq shares’ market value:
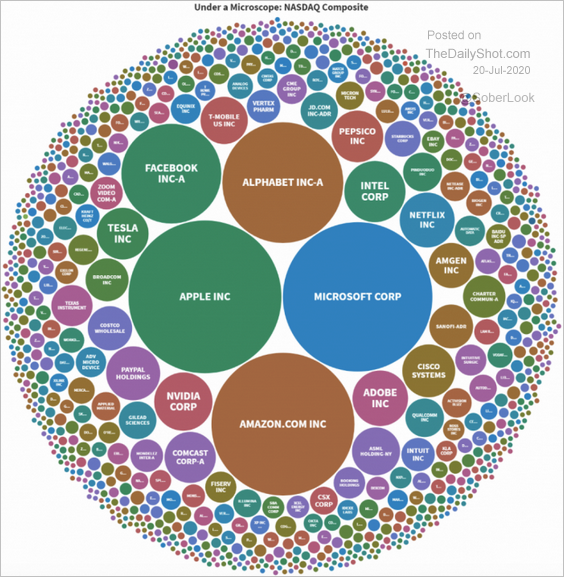 Source: @FinancialSense_ Read full article
3. US sports betting revenues (projections):
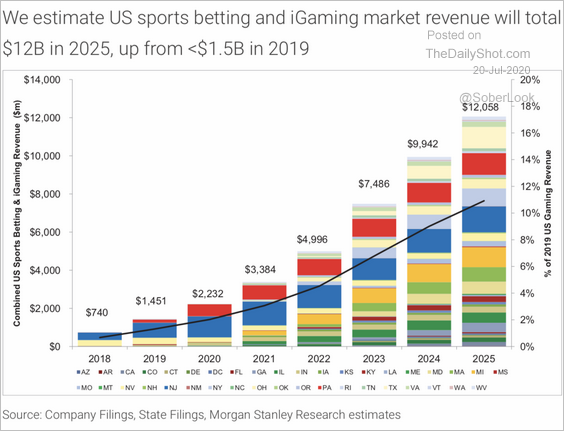 Source: Morgan Stanley Research
4. Population aged 65 and over:
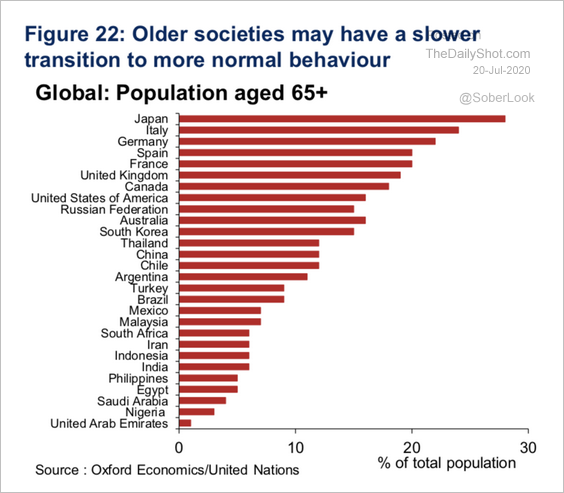 Source: Oxford Economics
5. Youth infections in California:
 Source: @business Read full article
6. Children adopted from outside the US:
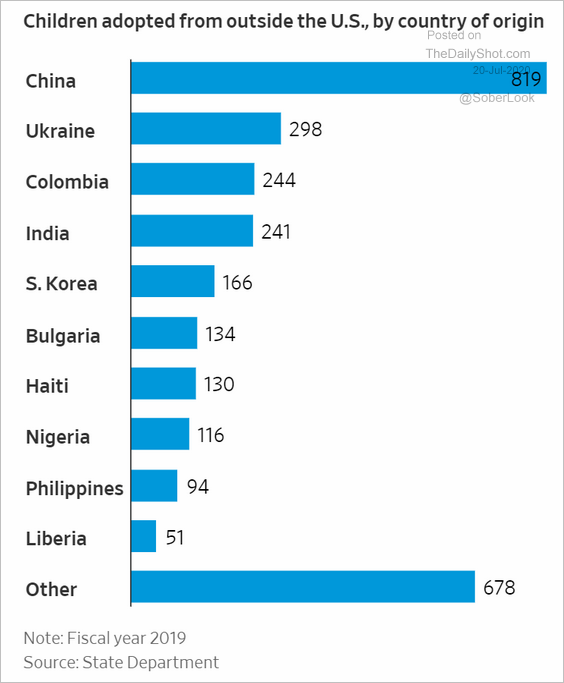 Source: @WSJ Read full article
US adoptions by type:
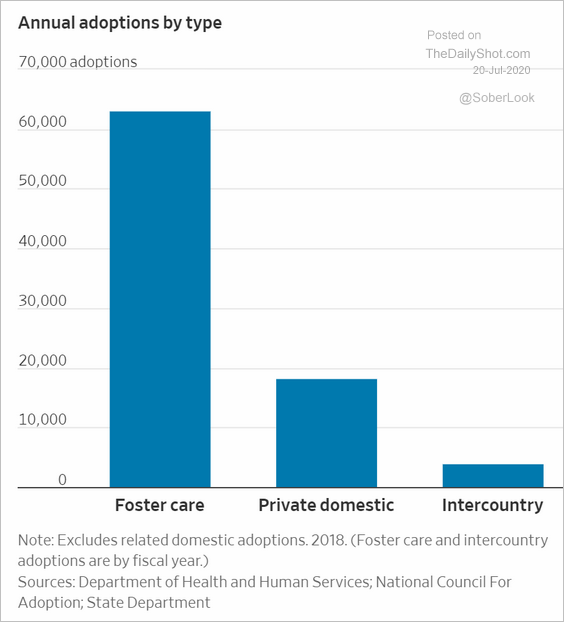 Source: @WSJ Read full article
——————–
7. Female share of employment by sector:
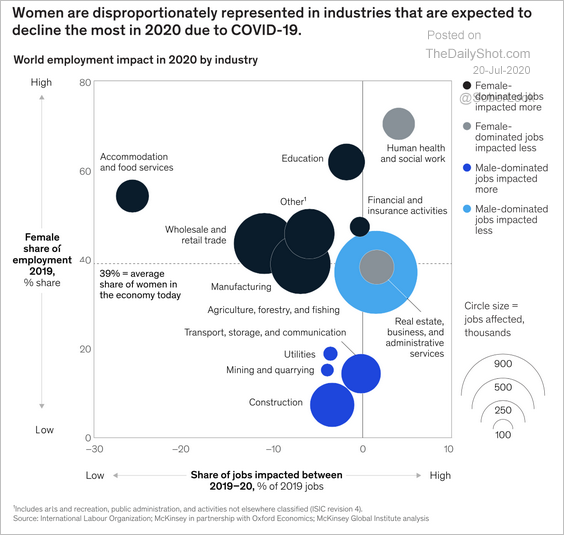 Source: McKinsey & Company Read full article
8. Countries banning plastic bags:
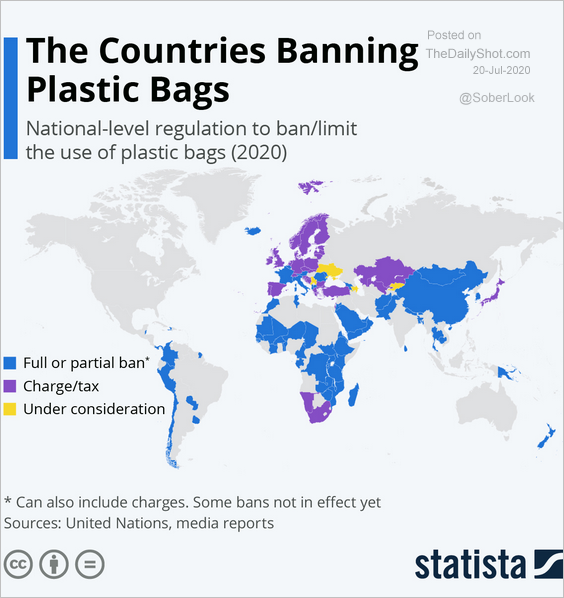 Source: Statista
9. Industry wage vs. perceived industry immorality:
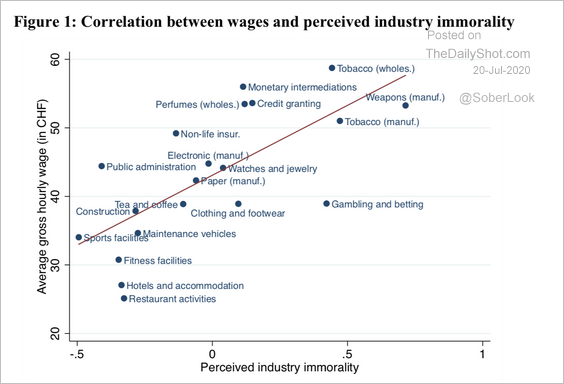 Source: Schneider, Brun, Weber (University of Zurich) Read full article
——————–