
The Daily Shot: 21-Jul-20
• The United States
• Canada
• Europe
• Asia – Pacific
• Emerging Markets
• Commodities
• Energy
• Equities
• Credit
• Rates
• Global Developments
• Food for Thought
The United States
1. Let’s begin with some high-frequency indicators.
• Automobile sales:
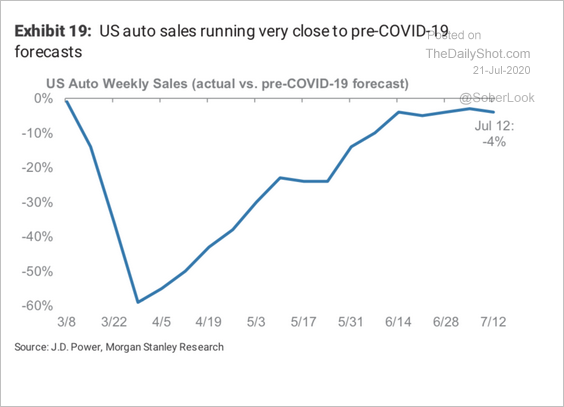 Source: Morgan Stanley Research
• Hotel room occupancy:
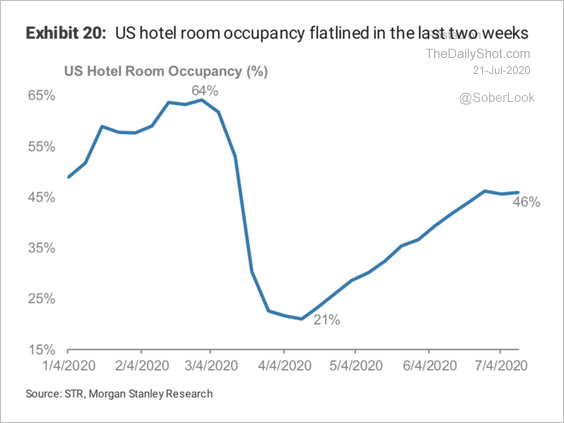 Source: Morgan Stanley Research
• Small business employment (select states):
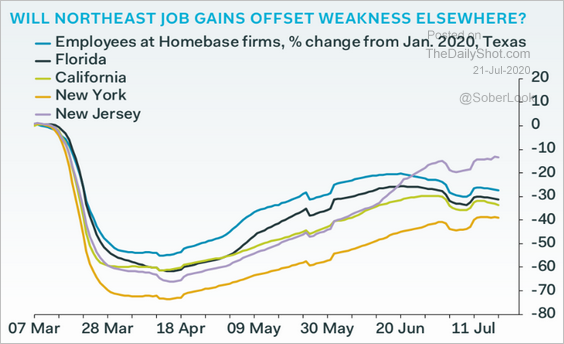 Source: Pantheon Macroeconomics
• Consumer spending:
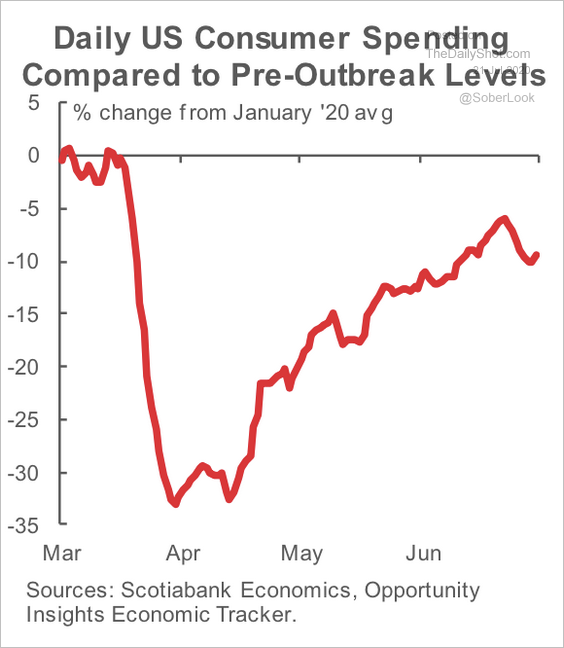 Source: Scotiabank Economics
• Reopening progress:
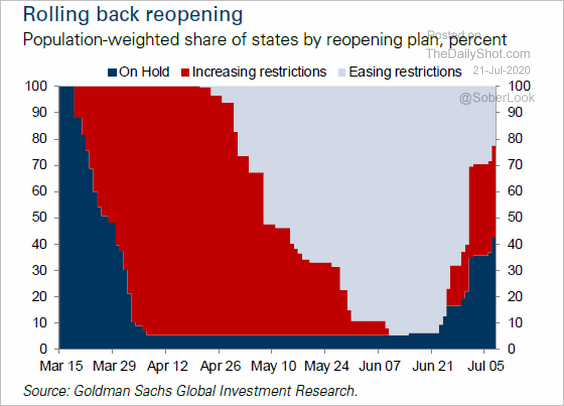 Source: Goldman Sachs, @tracyalloway
• Truck loadings:
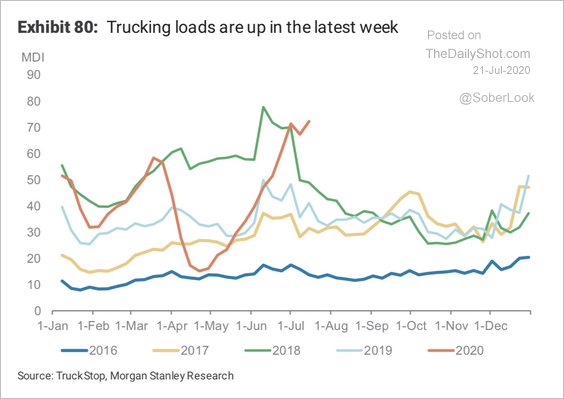 Source: Morgan Stanley Research
——————–
2. Twenty percent of the US labor force is collecting unemployment benefits. This chart combines the regular state unemployment insurance with pandemic-related programs.
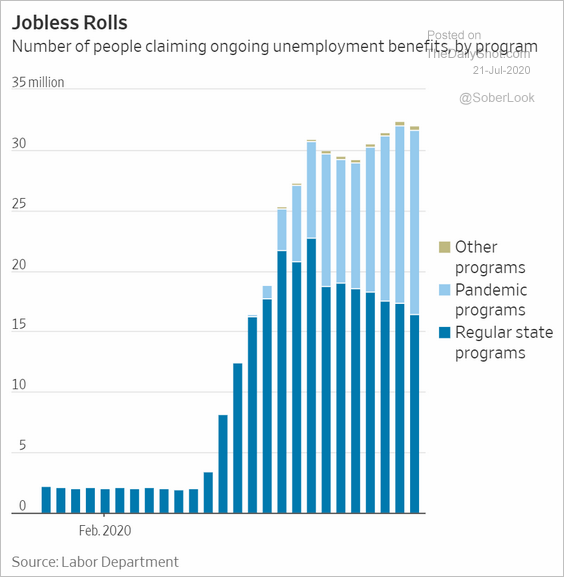 Source: @WSJ Read full article
3. Markets have been confident that the federal government will deliver yet another coronavirus relief package, avoiding the income cliff at the end of the month. What happens if it doesn’t?
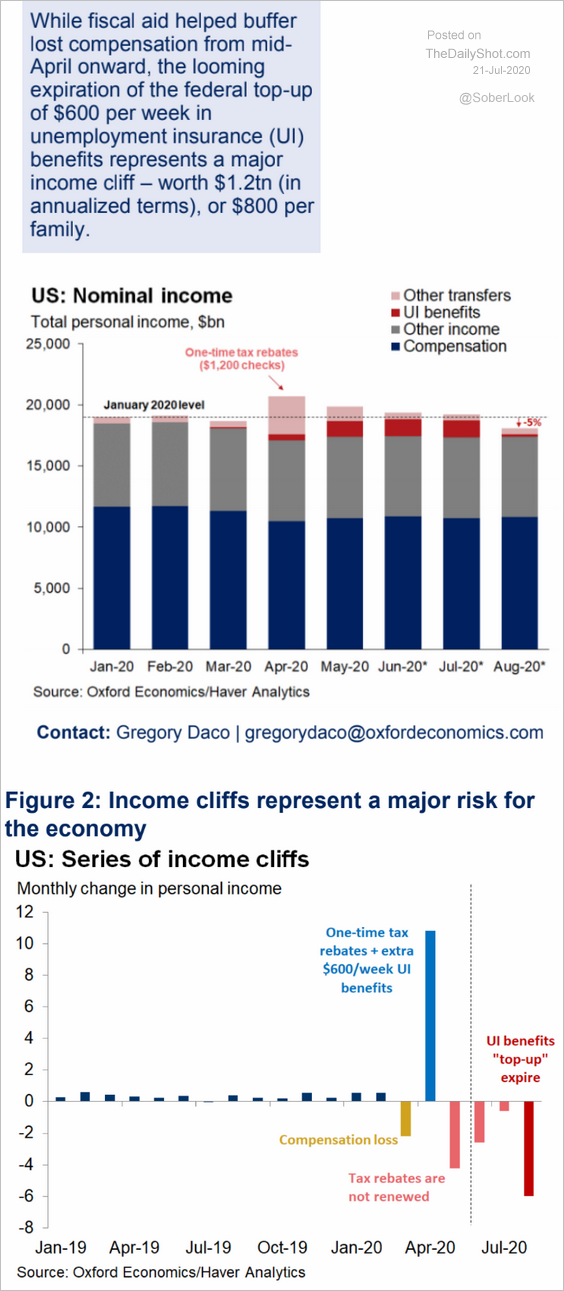 Source: Oxford Economics
4. Rent collections in cities have been declining.
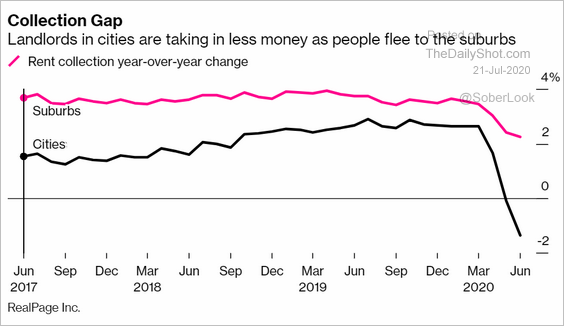 Source: @markets Read full article
5. This chart shows the percentage of shuttered small and medium-sized businesses across industries most impacted by the crisis.
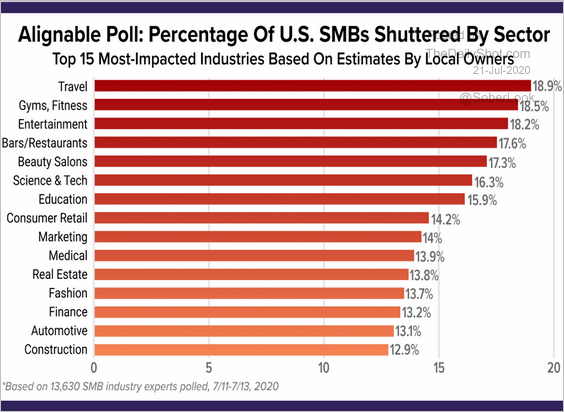 Source: Alignable Read full article
6. US export share has been declining since 2014.
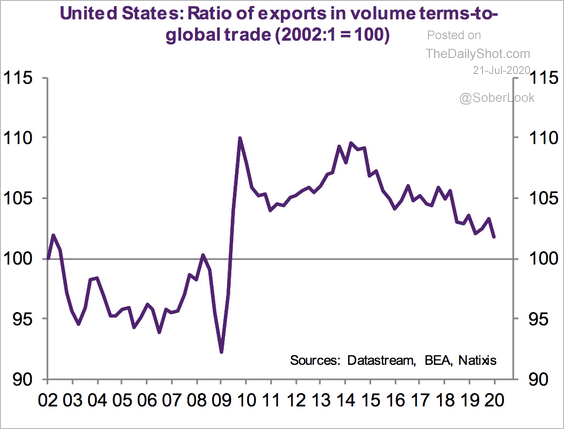 Source: Natixis
Exports to China are now more important than ever.
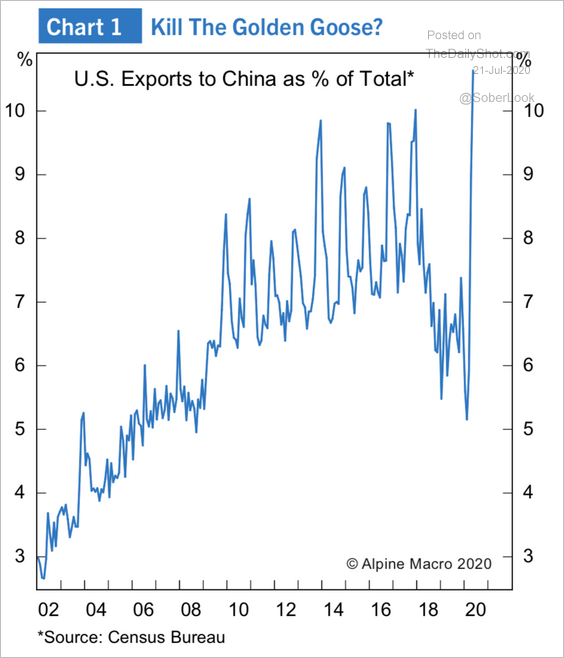 Source: Alpine Macro
——————–
7. The recovery has entered the slow (“pandemic”) phase, according to Moody’s Analytics.
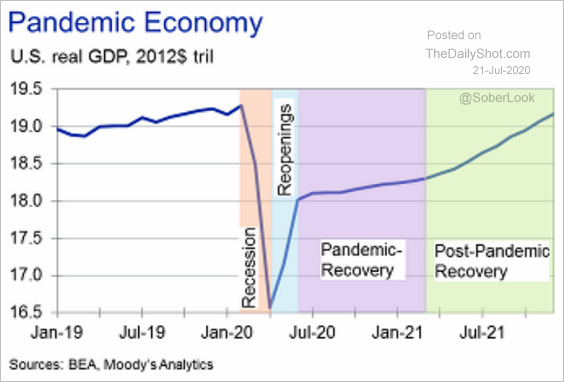 Source: Moody’s Analytics
Canada
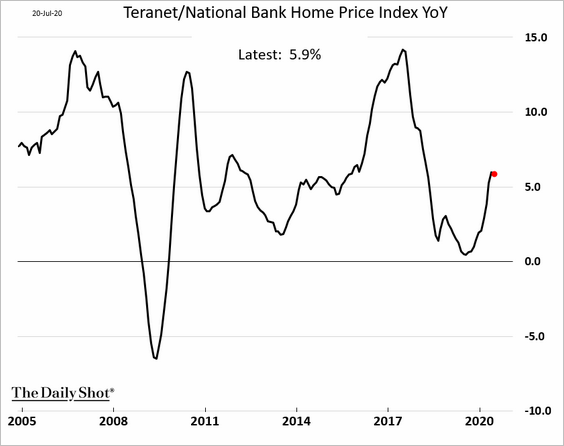
1. Home price appreciation remains robust.
2. This chart shows a range of GDP scenarios.
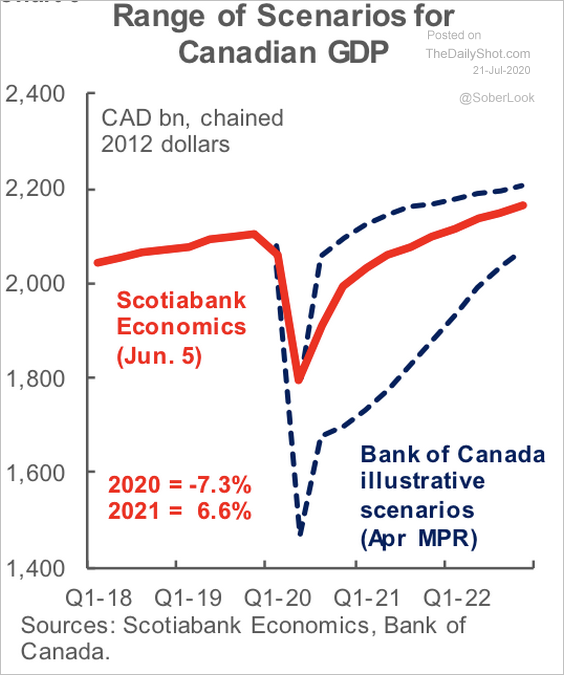 Source: Scotiabank Economics
3. There is a potential gap between the Bank of Canada’s buying of government bonds in the secondary market and the Department of Finance’s planned bond issuance, according to Scotiabank. Will the oversupply push yields higher?
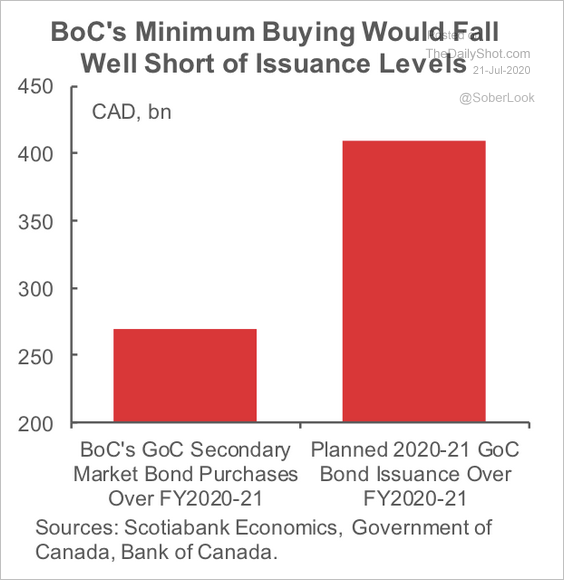 Source: Scotiabank Economics
Europe
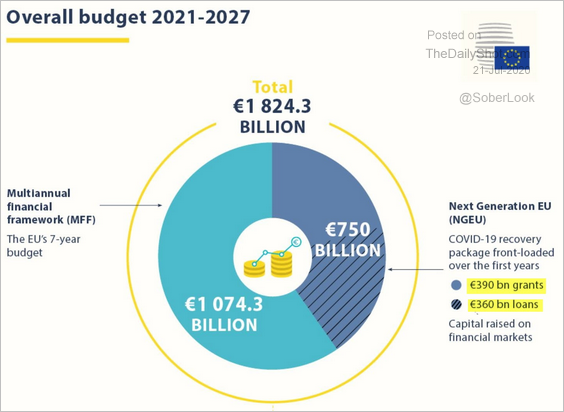
1. We have liftoff.
 Source: @WSJ Read full article
The EU stimulus package is split between grants and low-interest loans.
 Source: @EUCouncilPress Read full article
——————–
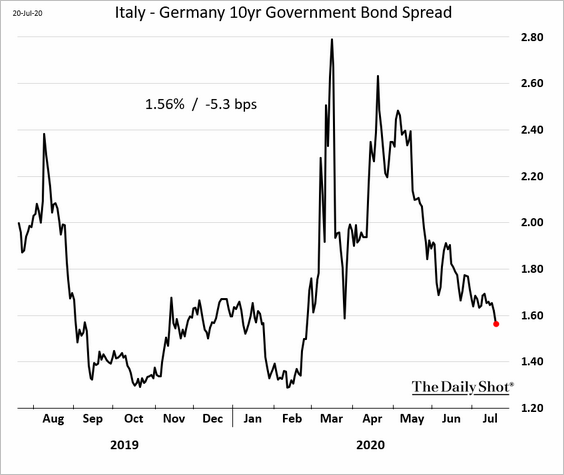
2. Italian spreads have tightened ahead of the stimulus deal.
3. The Euro Stoxx 50 index is at short-term resistance.
 Source: @DantesOutlook
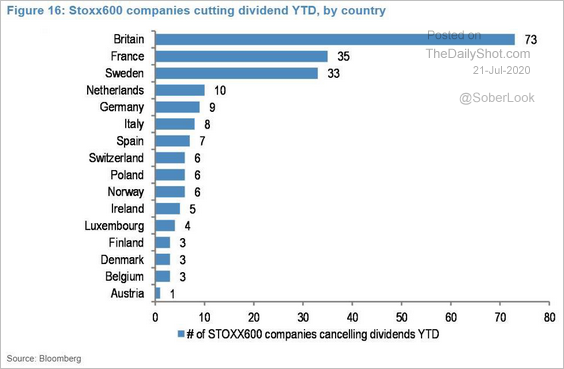
This chart shows Euro Stoxx 600 companies cutting dividends (year-to-date, by country).
 Source: @jsblokland
——————–
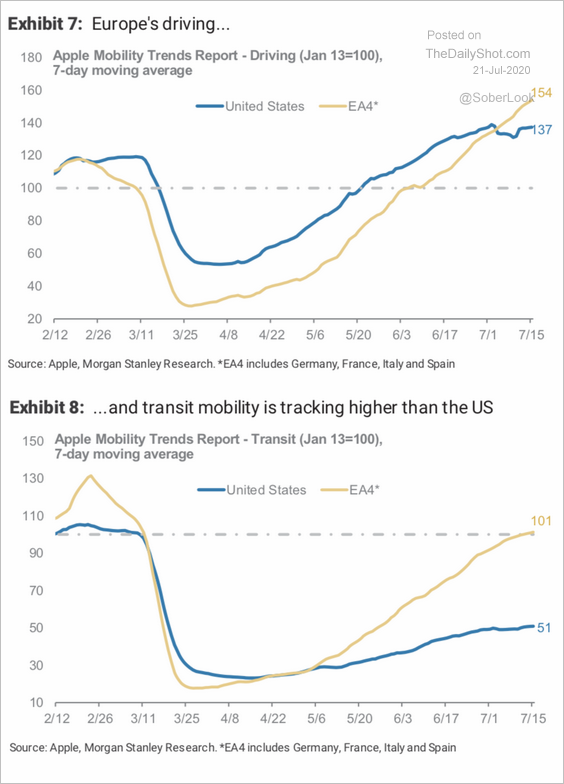
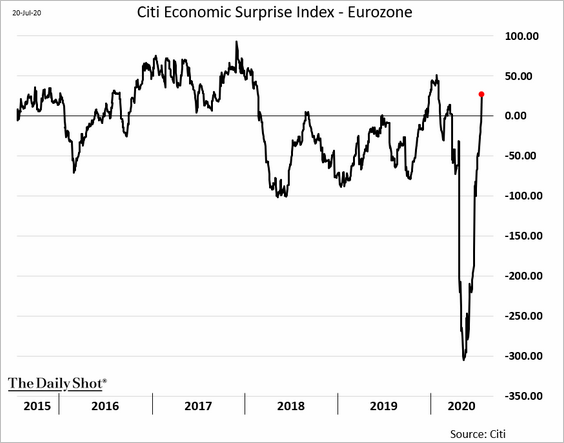
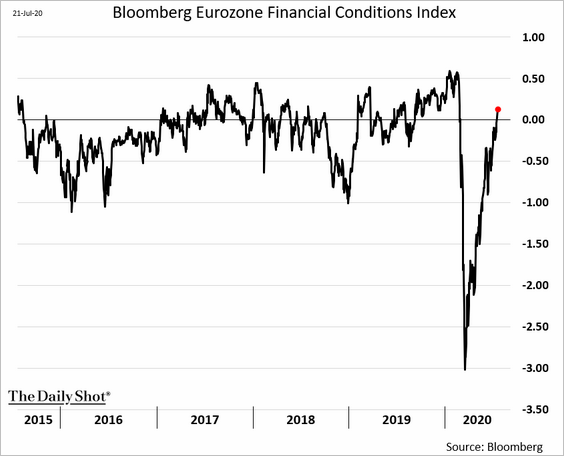
4. The Eurozone recovery continues.
• Mobility indicators (vs. the US):
 Source: Morgan Stanley Research
• The Citi Economic Surprise Index (now in positive territory):
• Bloomberg’s financial conditions index:
——————–
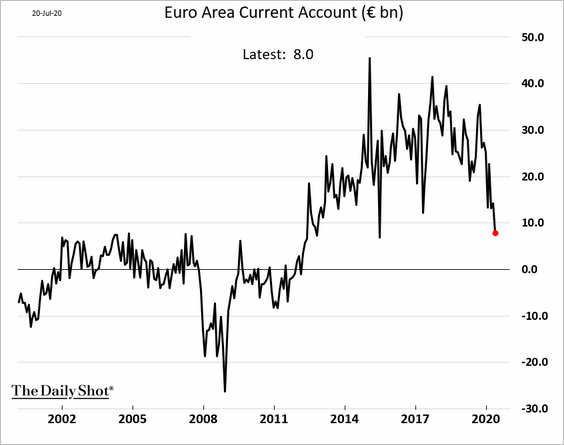
5. The euro-area current account has rolled over.
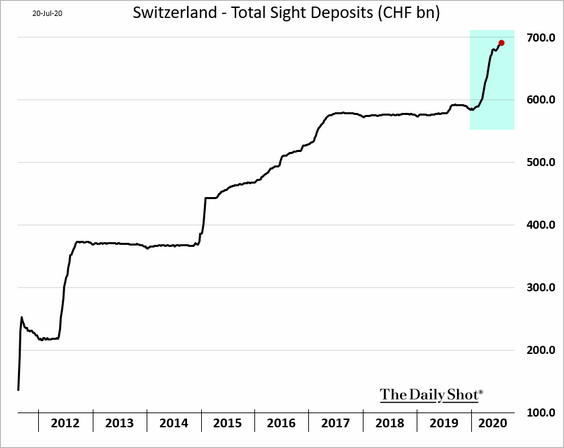
6. Elsewhere in Europe, the Swiss central bank continues to intervene in the foreign exchange markets as it fights deflation.
7. Retail F/X traders have been betting against the British pound.
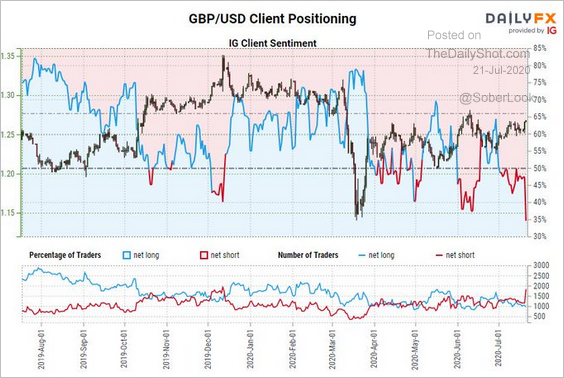 Source: @JohnKicklighter Read full article
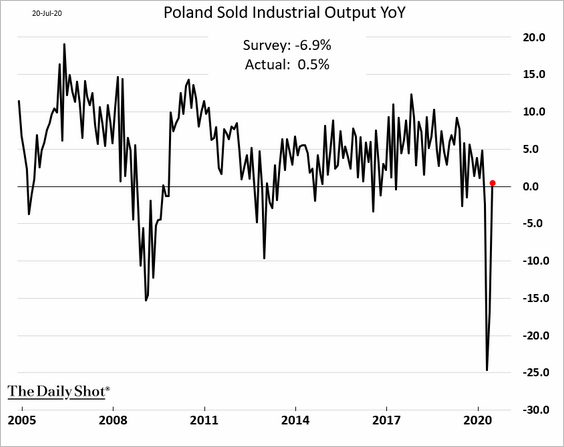
8. Poland’s industrial output rebounded.
Asia – Pacific
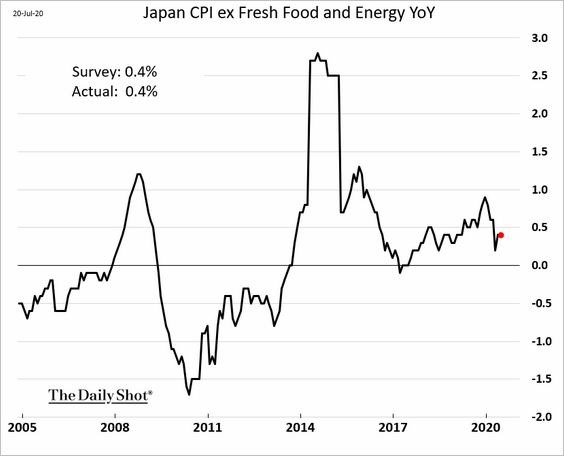
1. Japan’s core CPI is holding at 0.4%.
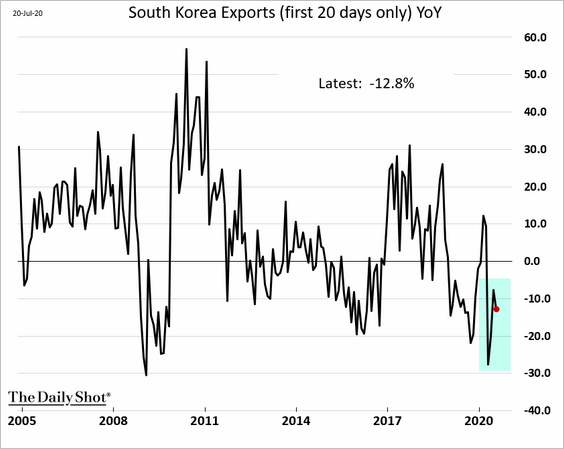
2. South Korea’s exports declined this month.
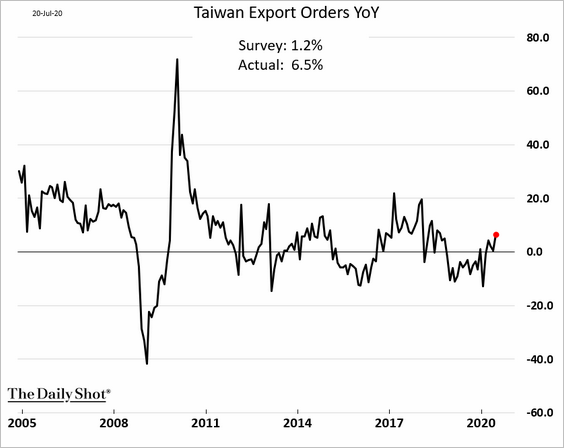
3. Taiwan’s export orders surprised to the upside.
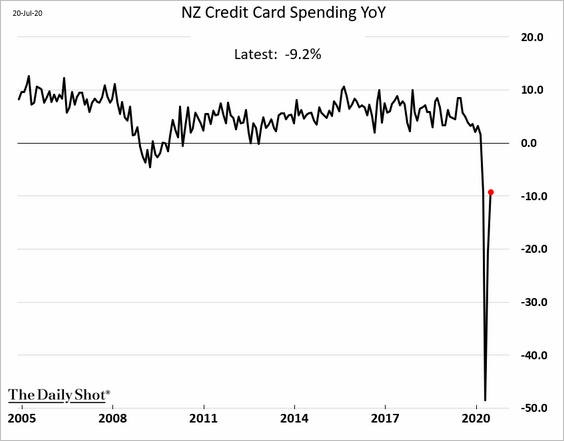
4. New Zealand’s credit card spending bounced from extreme lows.
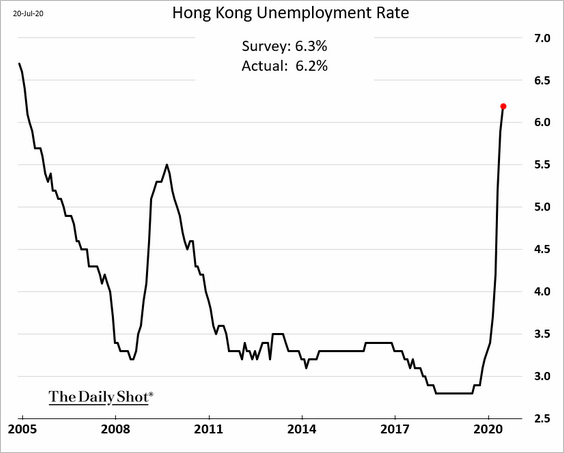
5. Hong Kong’s unemployment rate continues to climb, but the latest increase was smaller than expected.
Emerging Markets
1. Core inflation has decelerated across most of EM Asia, except India.
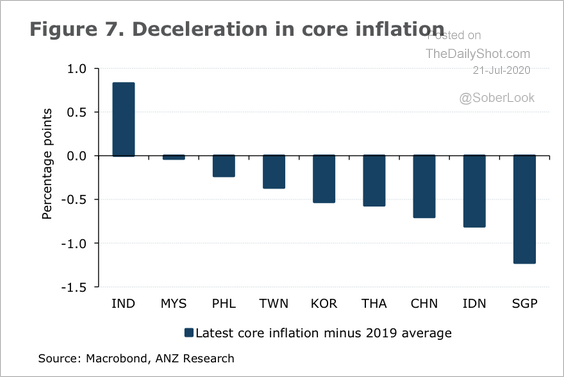 Source: ANZ Research
2. Similar to 2008, Brazilian stock prices are starting to recover, even as 12-month earnings expectations remain subdued.
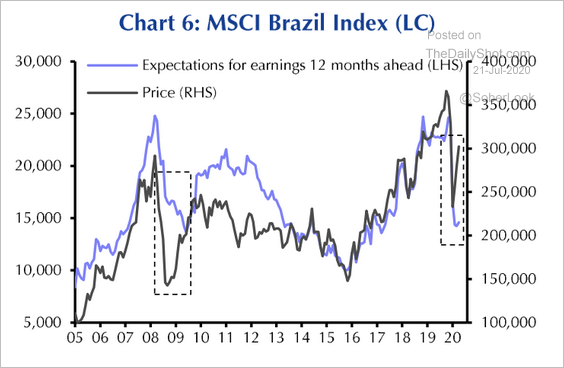 Source: Capital Economics
3. EM equity trading volumes have been moderating.
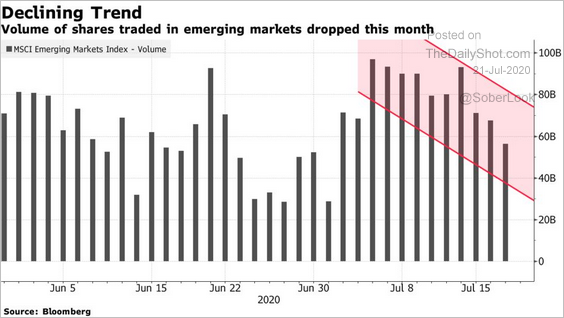 Source: @markets Read full article
4. The correlation between EM FX and the S&P 500 is starting to fall.
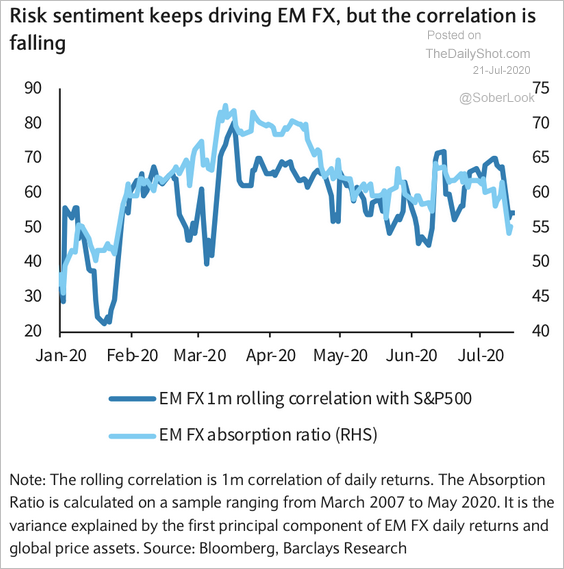 Source: Barclays Research
Commodities
1. Let’s begin with gold.
• Falling real rates are boosting gold prices.
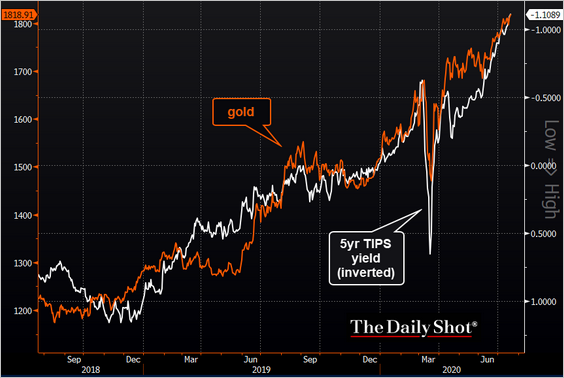 Source: @TheTerminal
• This chart shows net purchases of gold by central banks.
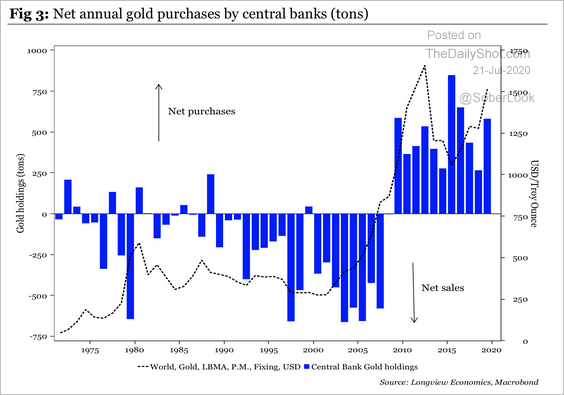 Source: Longview Economics
Here is the breakdown by country.
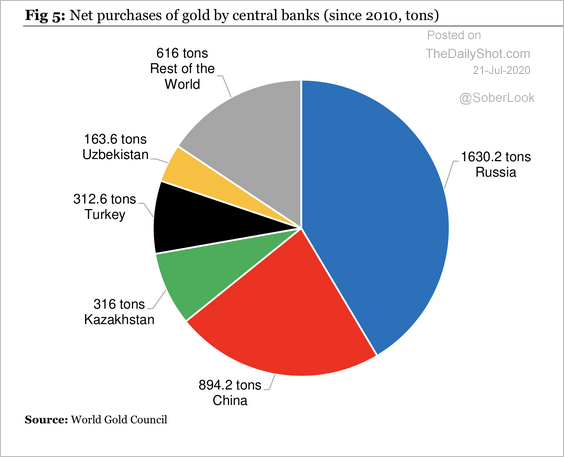 Source: Longview Economics
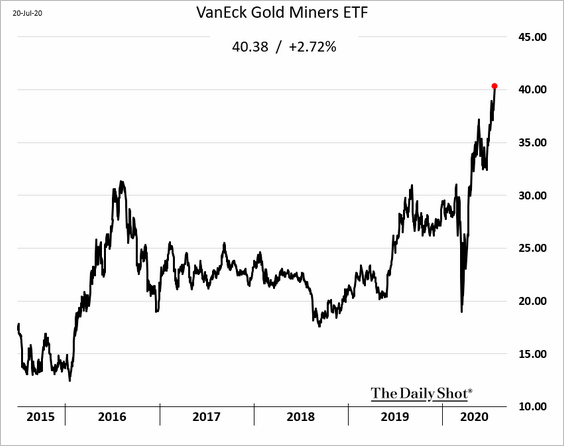
• Shares of gold miners are hitting multi-year highs.
——————–
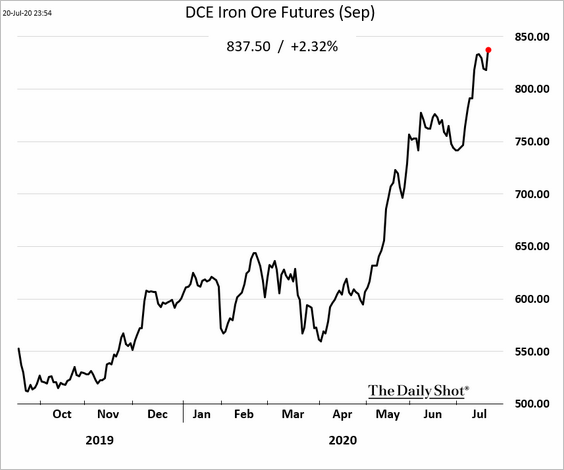
2. The rally in iron ore continues.
3. Adding a commodity sleeve to risk-parity portfolios can help insulate investors against inflationary shocks over the long run.
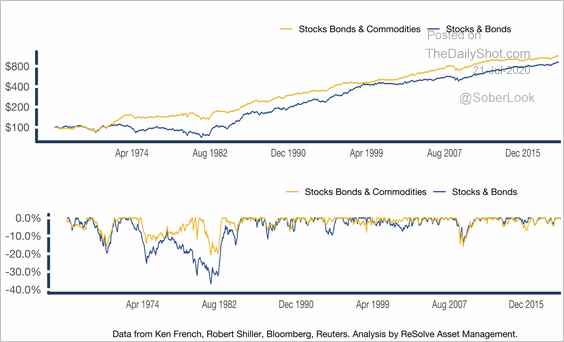 Source: @GestaltU Read full article
4. Cocoa futures are holding support.
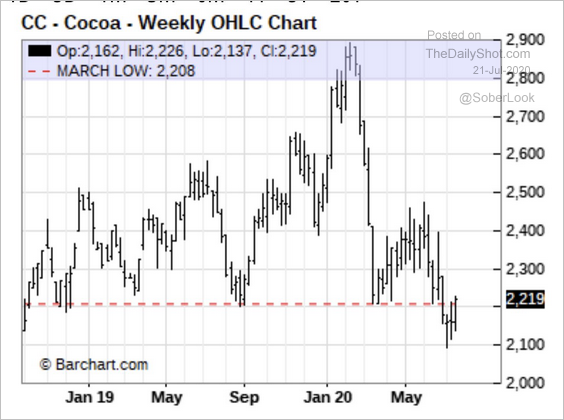 Source: @TheJayTrader
5. US wheat futures are at long-term support.
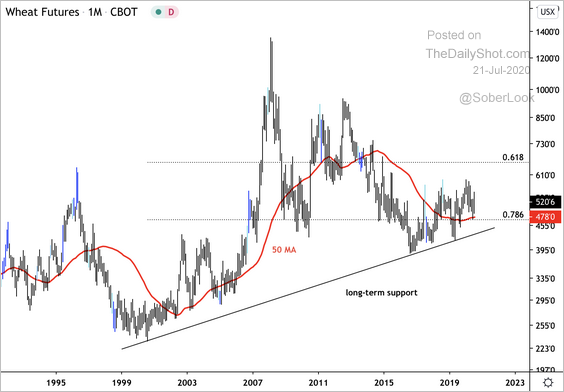 Source: @DantesOutlook
Energy
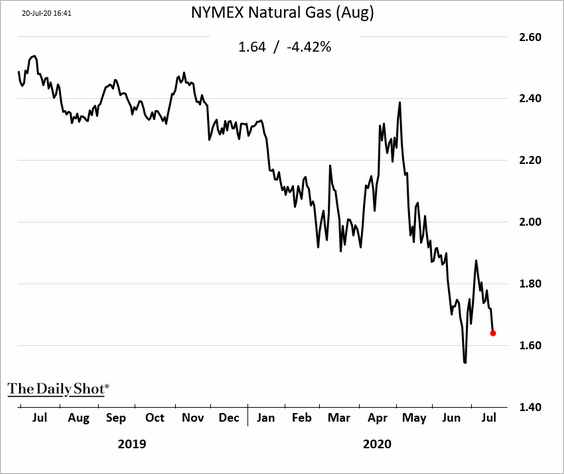
The heatwave across the US hasn’t boosted natural gas prices. Increased US production and a massive decline in LNG demand have been weighing on natural gas (LNG export production is down 60% from March).
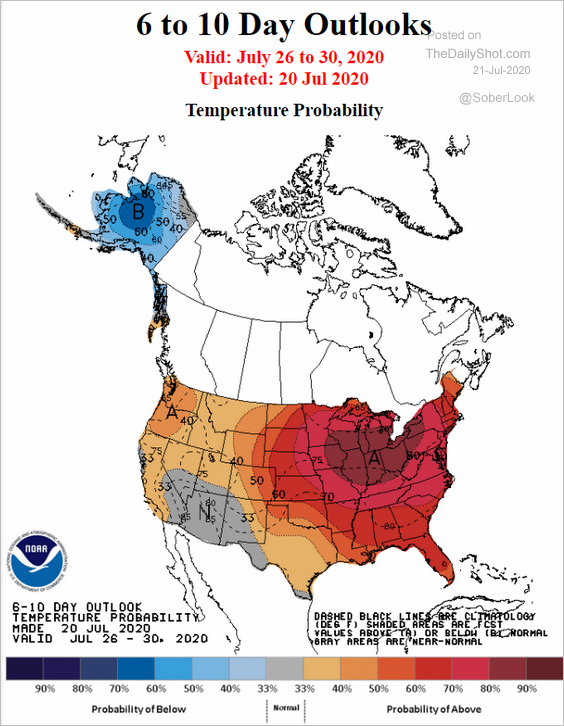 Source: NOAA
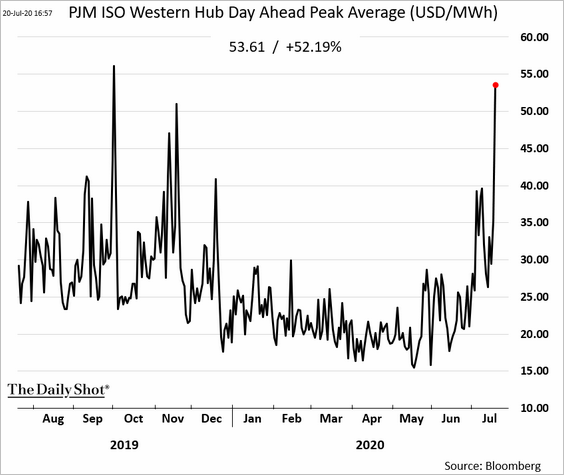
However, power prices are up sharply.
Equities
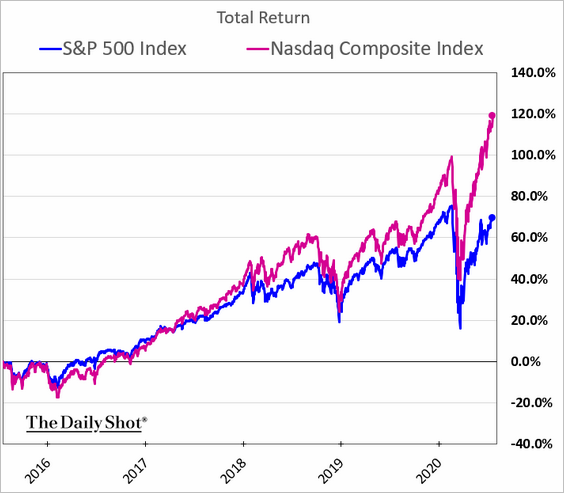
1. The Nasdaq Composite hit another record high. Here is the relative performance over the past five years.
2. The Nasdaq Composite Fear/Greed Indicator is deep in “greed” mode.
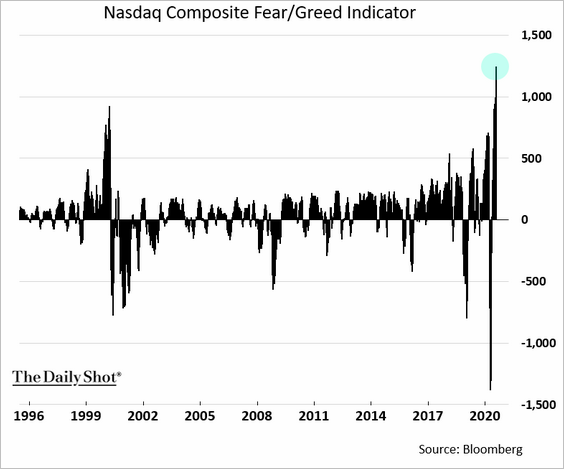 h/t David Wilson
3. Retail traders are chasing ‘hot’ stocks.
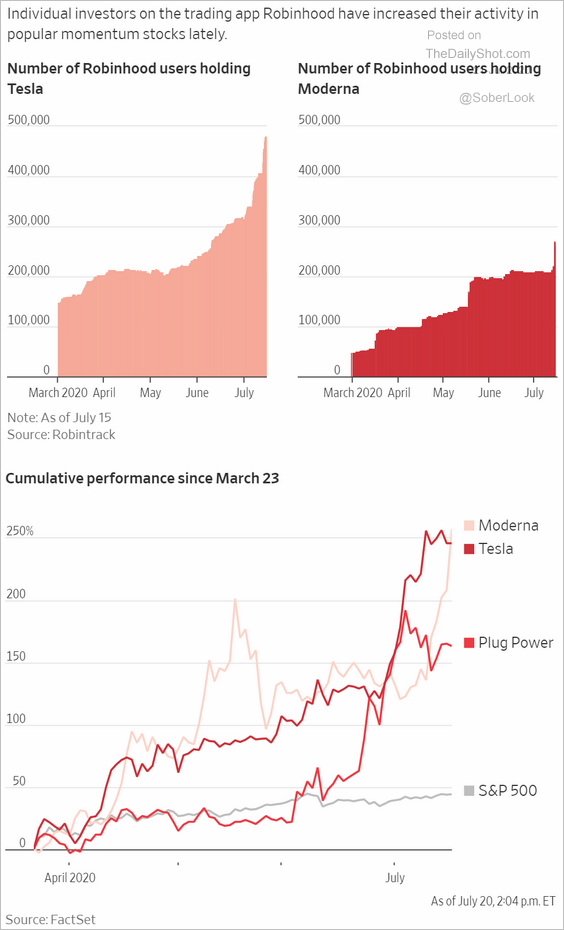 Source: @WSJ Read full article
4. The Nasdaq trading volume has soared this year.
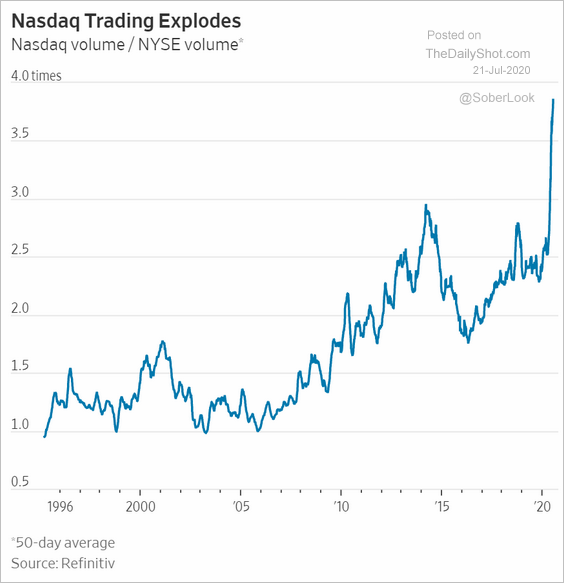 Source: @WSJ Read full article
5. The S&P 500 concentration (top five stocks) continues to climb.
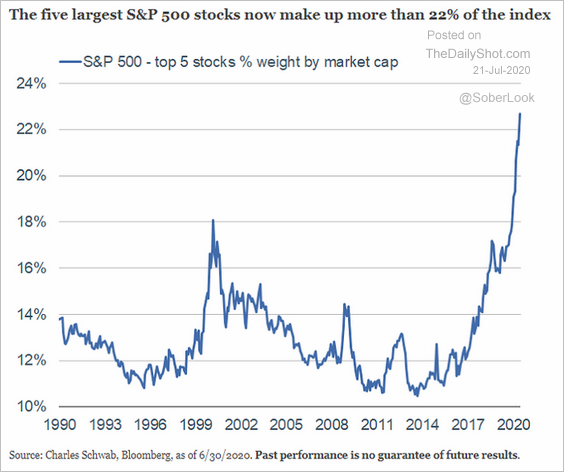 Source: @SchwabResearch Read full article
6. Profit margins have deteriorated.
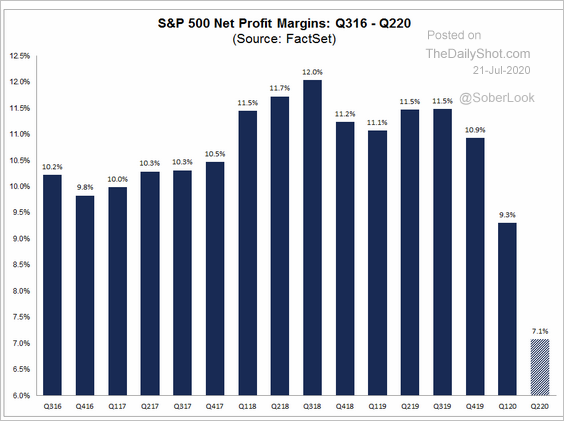 Source: @FactSet Read full article
7. Analysts expect a v-shape recovery in earnings.
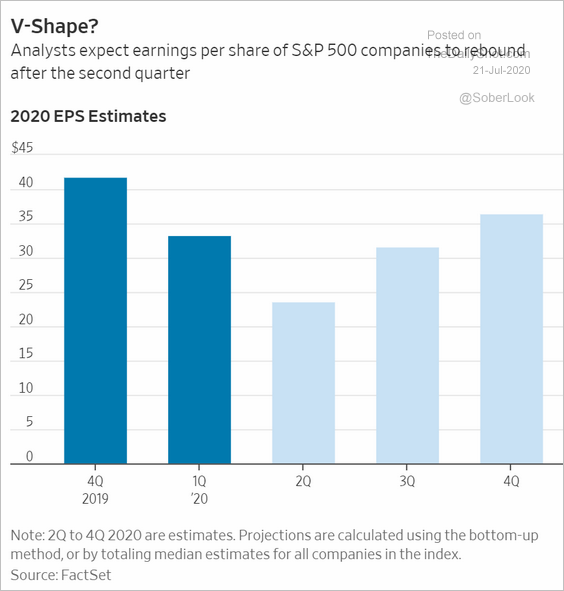 Source: @WSJ Read full article
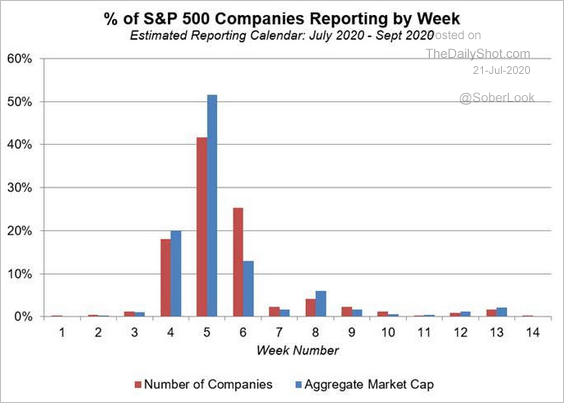
8. Here is the Q2 reporting calendar for S&P 500 stocks.
 Source: Michael Dick, Mizuho Americas Trading Desk
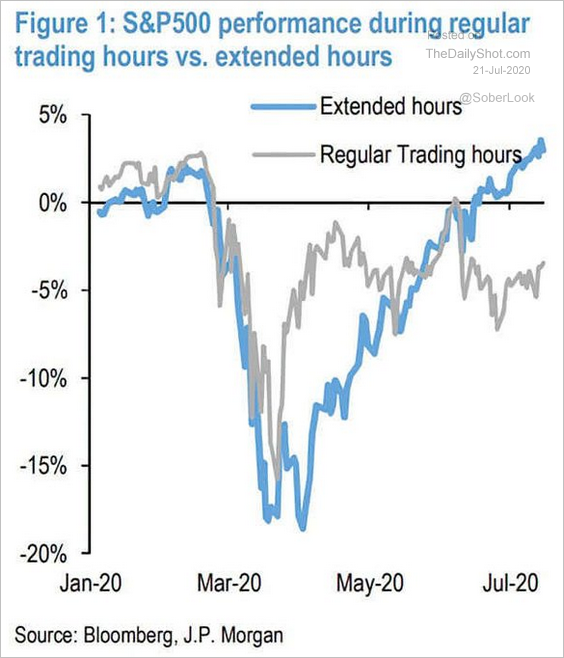
9. This chart shows the S&P 500 performance during regular vs. extended hours.
 Source: @ISABELNET_SA, @jpmorgan
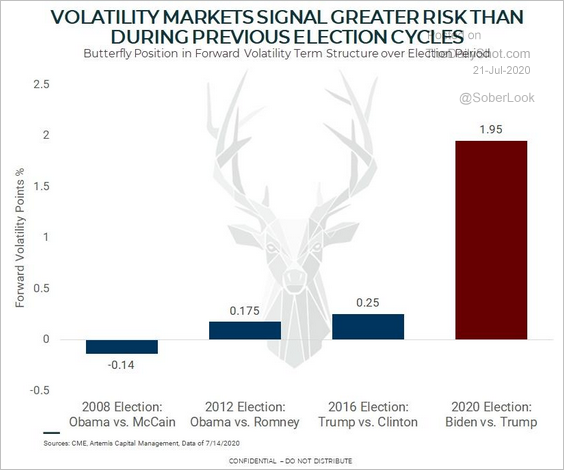
10. The risk premium priced into VIX futures is well above the levels we saw before previous elections.
 Source: Artemis, {ht} Tilo Marotz
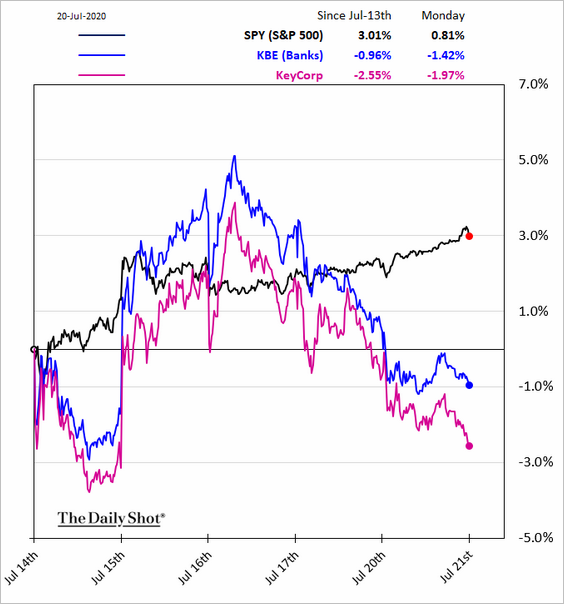
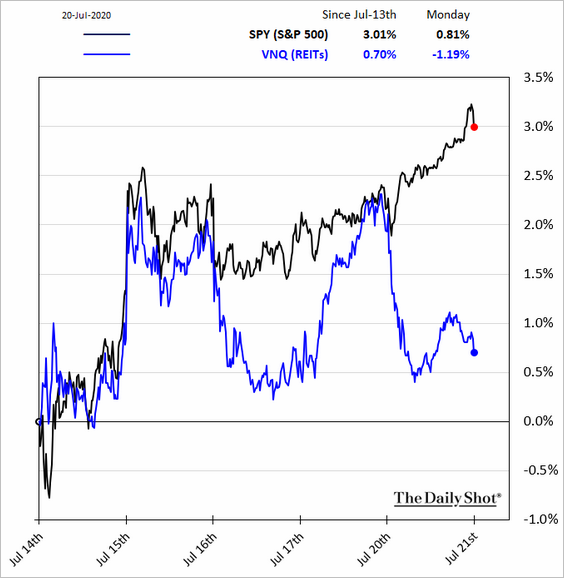
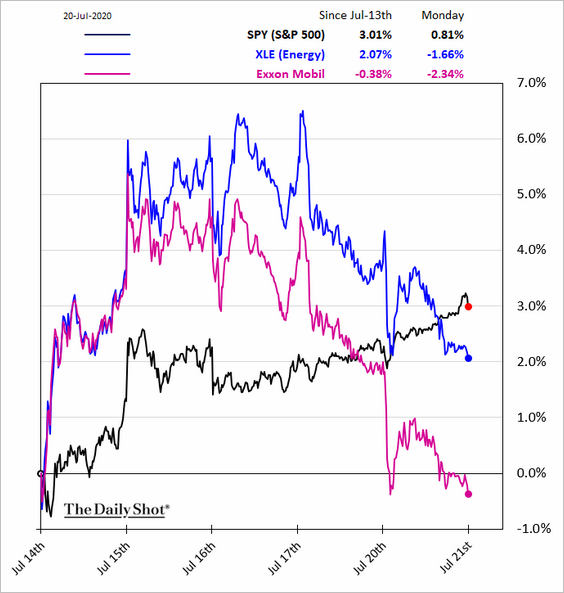
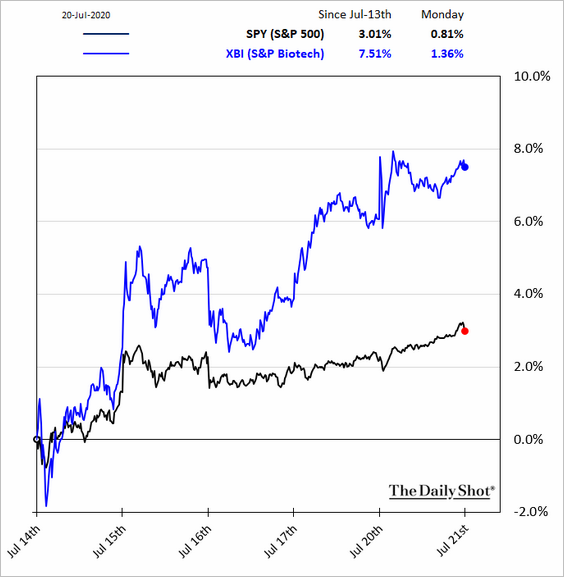
11. Finally, we have some sector performance updates (five business days).
• Banks:
• Real estate operators (REITs):
• Energy:
• Biotech:
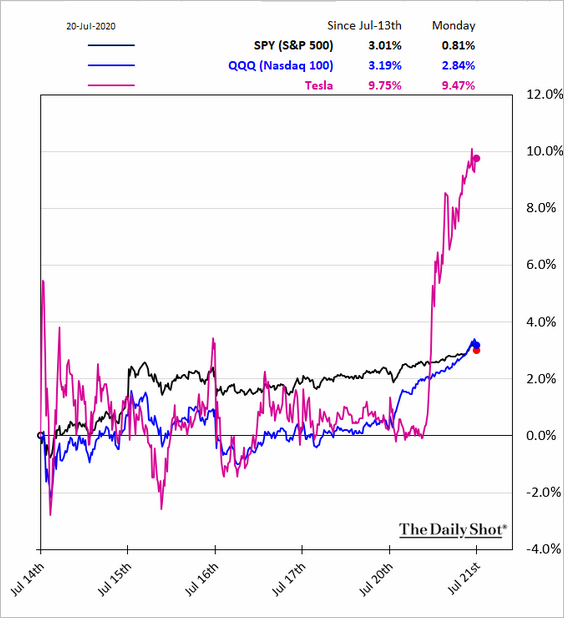
• Nasdaq 100:
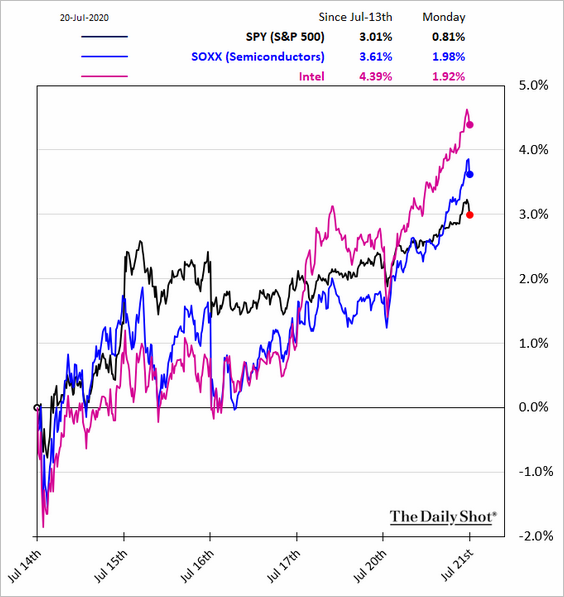
• Semiconductors:
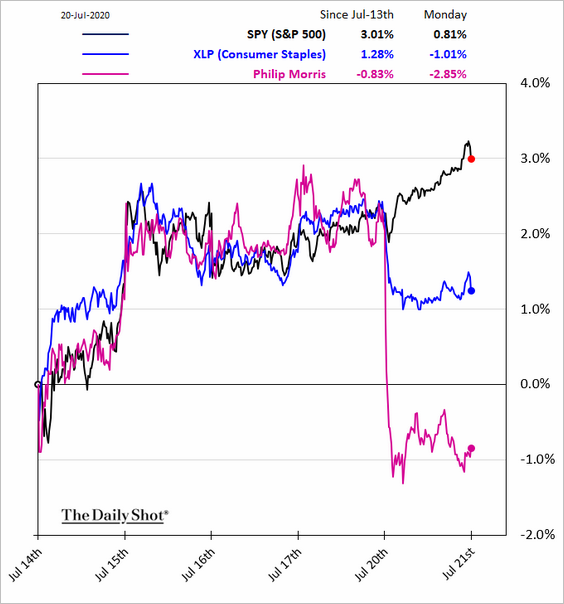
• Consumer staples:
Credit
1. Average leveraged loan and high-yield bond ratings have diverged. All the fallen angels boosted the quality of the high-yield universe, while rating agencies have been aggressively downgrading leveraged loans.
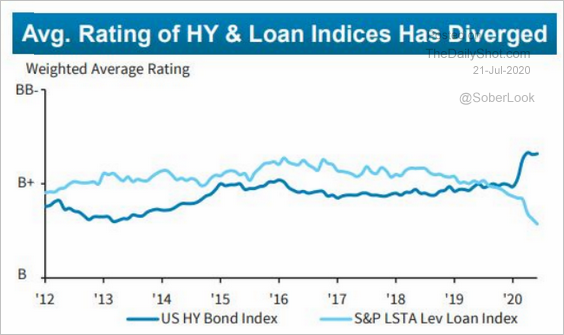 Source: Barclays Research
2. The probability of default for industries most impacted by the pandemic has declined substantially.
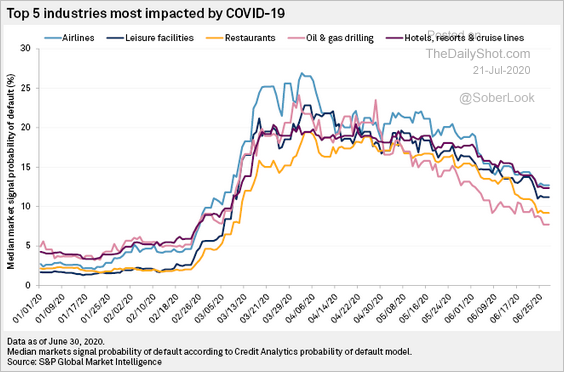 Source: S&P Global Market Intelligence Read full article
3. This map shows oil patch defaults by state.
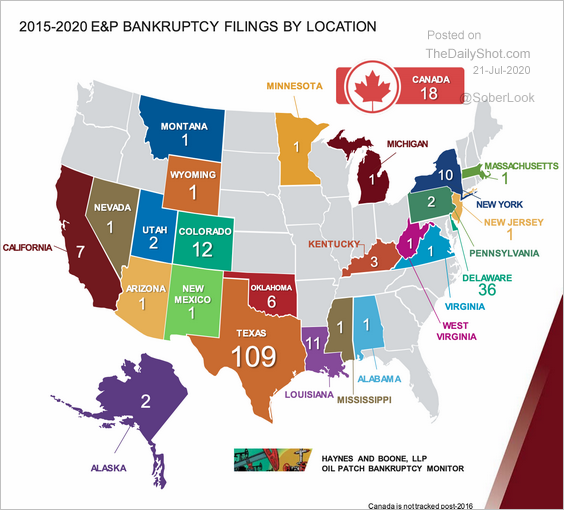 Source: @adam_tooze Read full article
4. TBA prices and specified mortgage pool prices converged at the start of the crisis in March. See the comment below from the NY Fed.
 Source: Liberty Street Economics Read full article
5. Is the increase in US permanent job losses signaling a spike in Chapter 11 filings ahead?
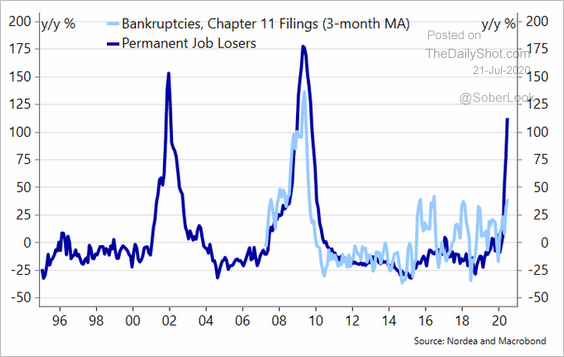 Source: @meremortenlund
Rates
1. The 10yr Treasury yield tends to decline in August.
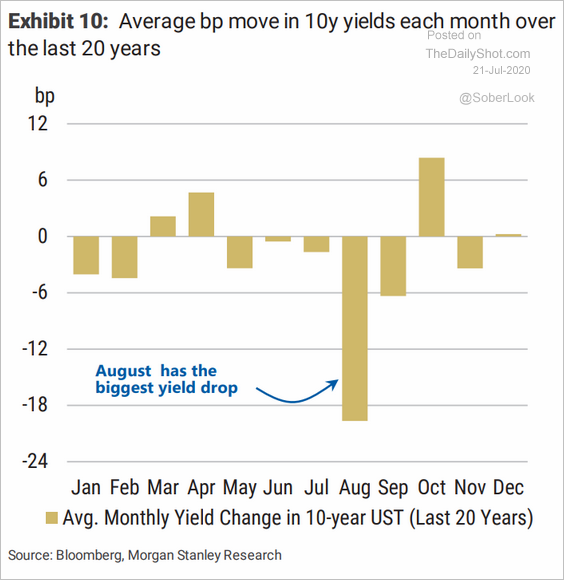 Source: Morgan Stanley Research
2. Despite unprecedented levels of issuance this year, Treasury bills have not cheapened much.
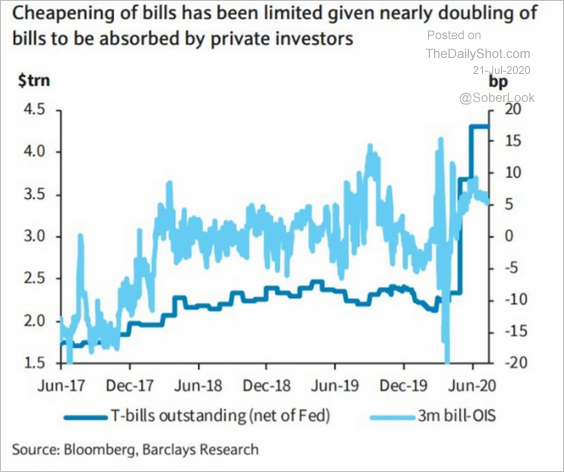 Source: Barclays Research
3. This chart shows Treasury yields going back to 1790.
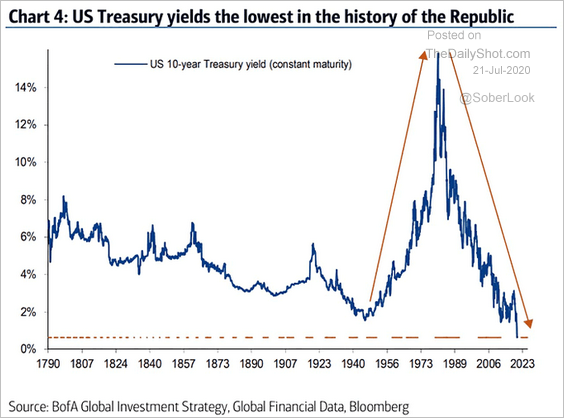 Source: @ISABELNET_SA, @BofAML
4. The global negative-yielding debt market value is climbing again.
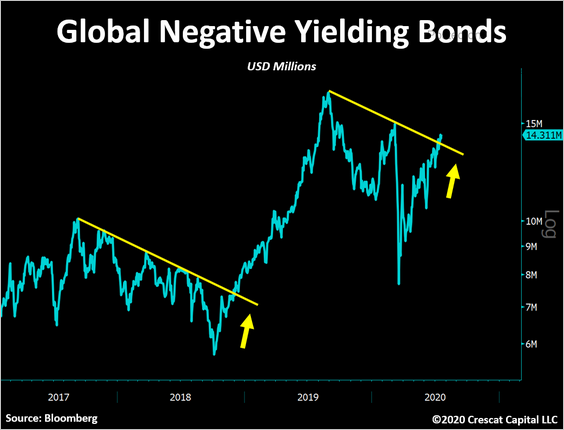 Source: @TaviCosta
Global Developments
1. How have debt levels (as % of GDP) changed since 2008?
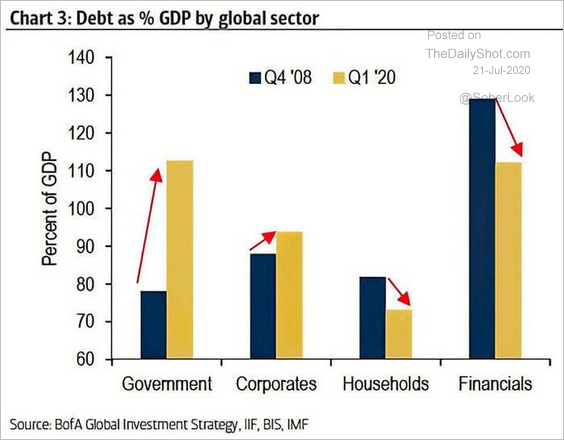 Source: @ISABELNET_SA, @BofAML
2. The US and Japan have a private sector saving surplus.
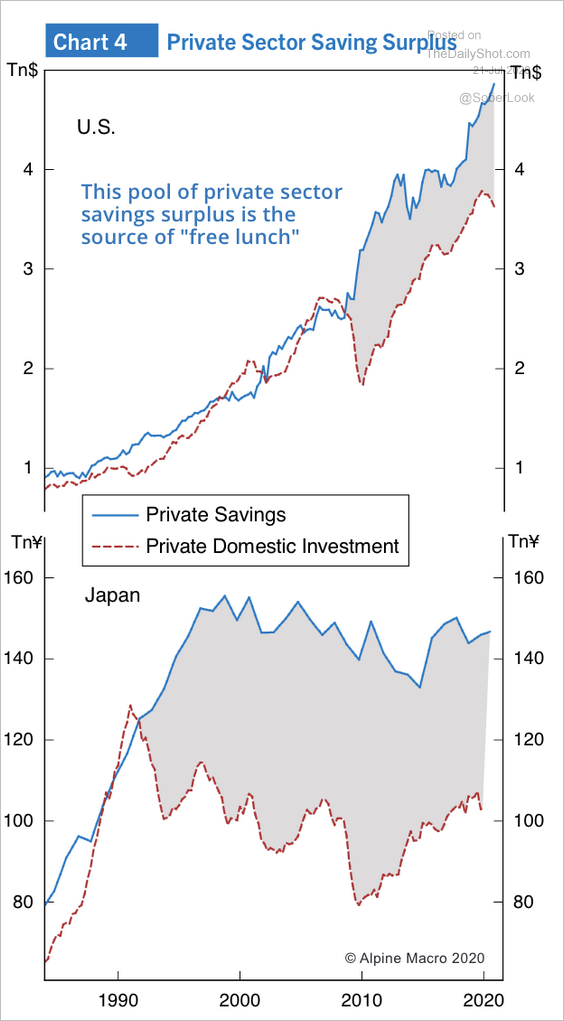 Source: Alpine Macro
3. The composite implied volatility (across several markets) is at pre-crisis levels.
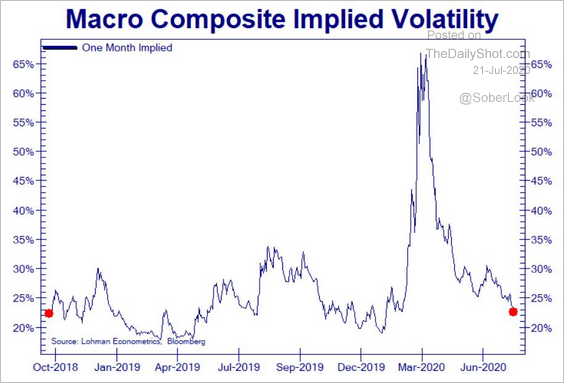 Source: @Not_Jim_Cramer
4. How sensitive are different currencies to stocks (y-axis), rates (x-axis), and oil (size of bubble)?
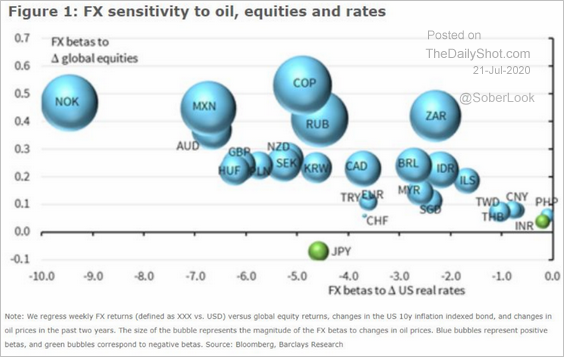 Source: Barclays Research
——————–
Food for Thought
1. When was the last time you used cash?
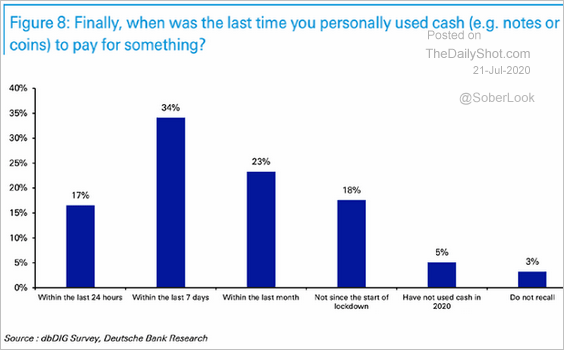 Source: @ISABELNET_SA, @DeutscheBank
2. Renewable and nuclear energy, by country:
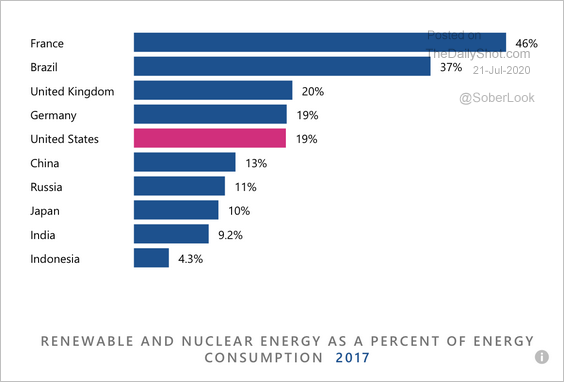 Source: USA Facts Read full article
3. Growth in US graduate school tuition:
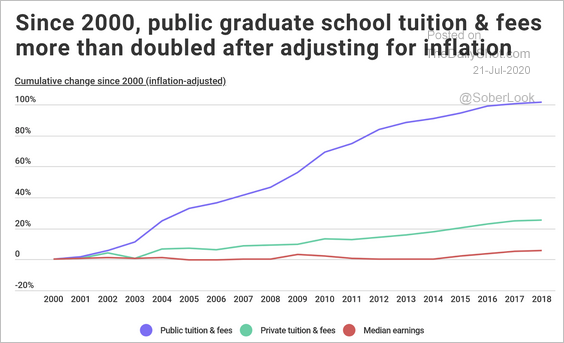 Source: Volusion Read full article
4. Desert locust infestation:
 Source: WEF Read full article
5. US military installations in Germany:
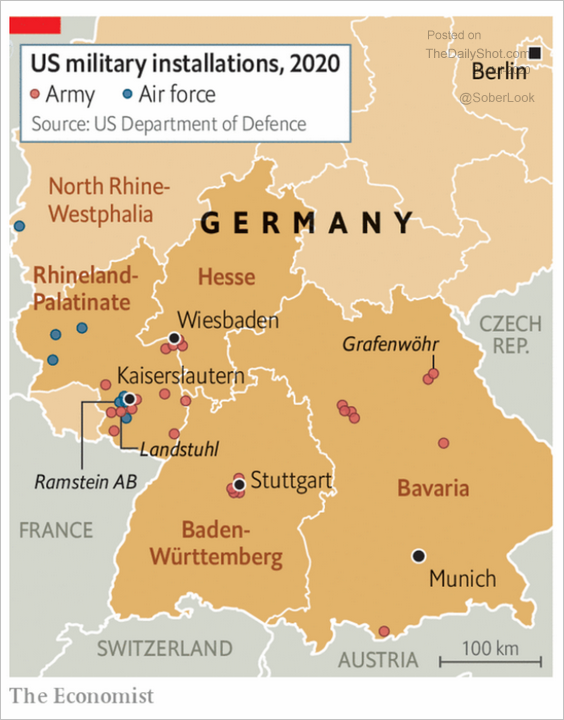 Source: @adam_tooze, The Economist Read full article
6. Face mask usage (2 charts):
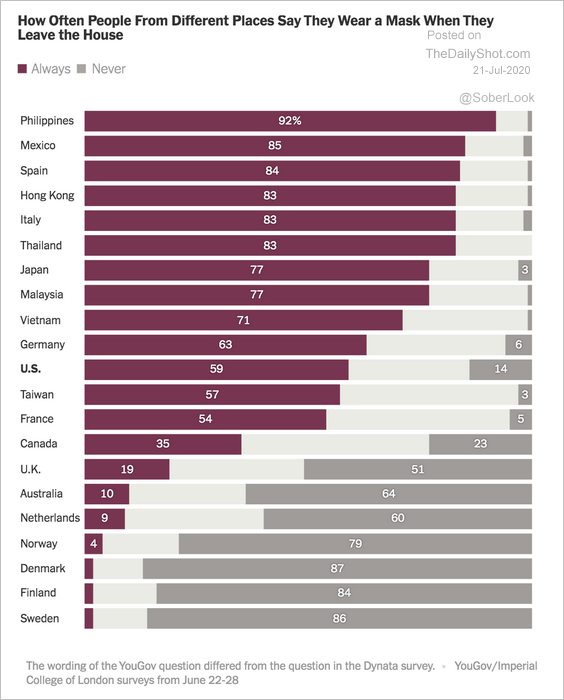 Source: The New York Times Read full article
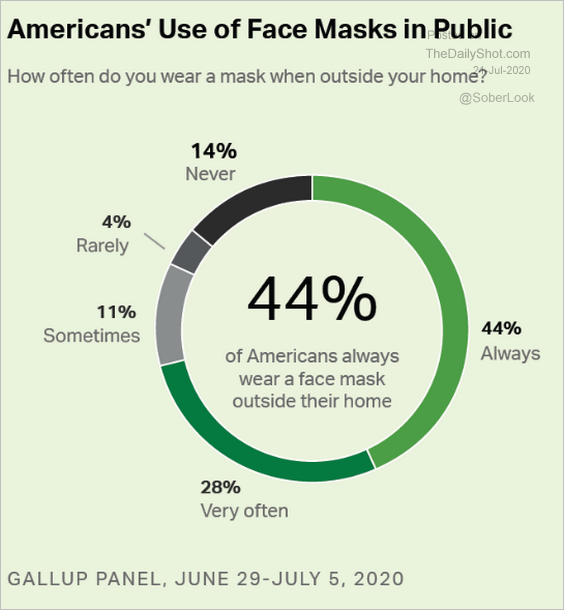 Source: Gallup Read full article
——————–
7. Increases in COVID-related deaths in select cities:
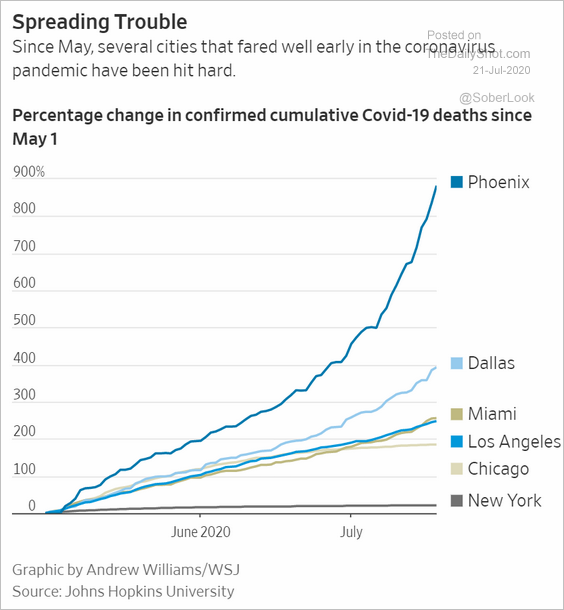 Source: @WSJ Read full article
8. Views on the death penalty:
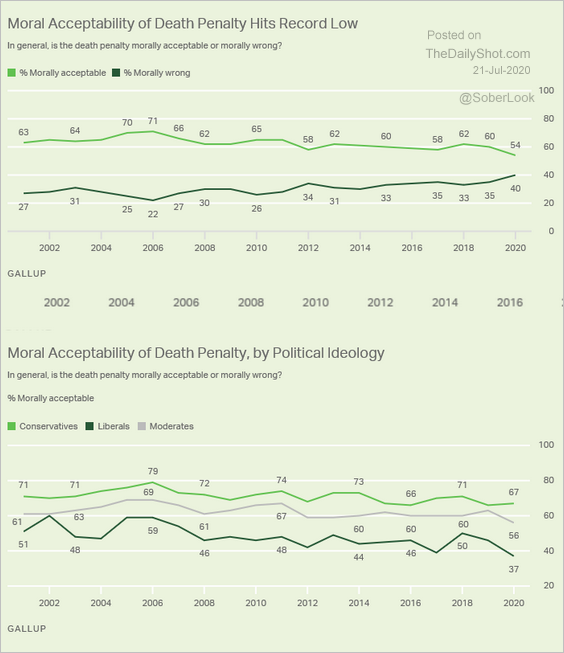 Source: Gallup Read full article
9. The largest economies:
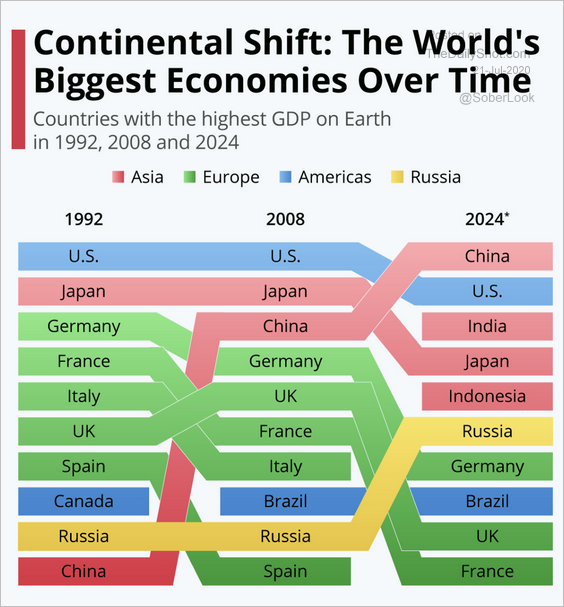 Source: Statista
——————–