
The Daily Shot: 22-Jul-20
• Equities
• Alternatives
• Credit
• Rates
• Commodities
• Emerging Markets
• China
• Japan
• The Eurozone
• The United Kingdom
• The United States
• Global Developments
• Food for Thought
Equities
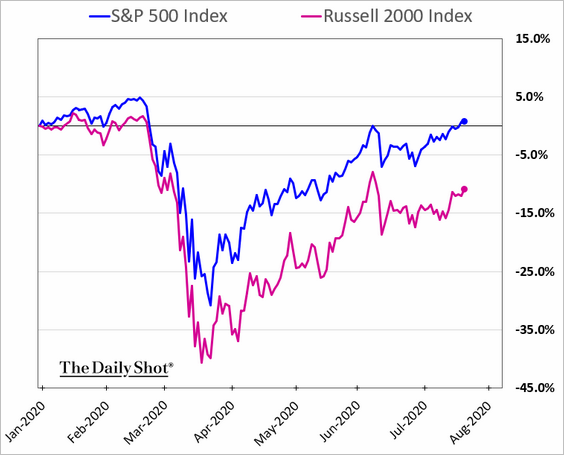
1. The S&P 500 has erased all of the 2020 losses and is now up on the year. Small-cap stocks continue to lag.
2. The speed of this rebound has been remarkable.
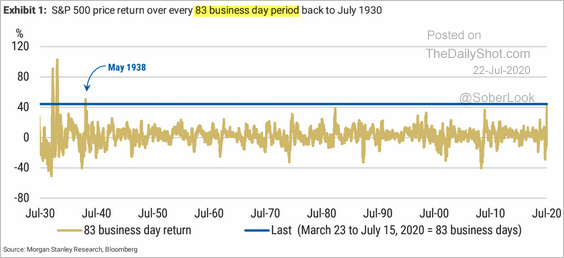 Source: Morgan Stanley Research
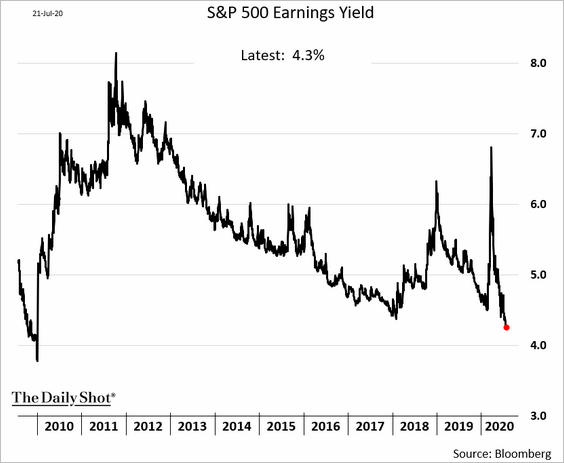
3. According to Bloomberg, the S&P 500 earnings yield is now at its lowest in over a decade.
 h/t @LizAnnSonders
4. Half the stocks in the S&P 500 are lagging the index by over 10%. Only 22% of the members are outperforming by more than 10%. Such divergence is highly unusual.
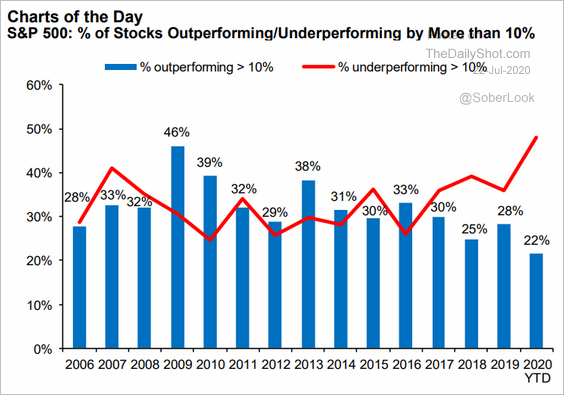 Source: Hugo Ste-Marie, Portfolio & Quantitative Strategy Global Equity Research, Scotia Capital
5. The Nasdaq 100 index hasn’t deviated this much from its 100-day moving average since 2000.
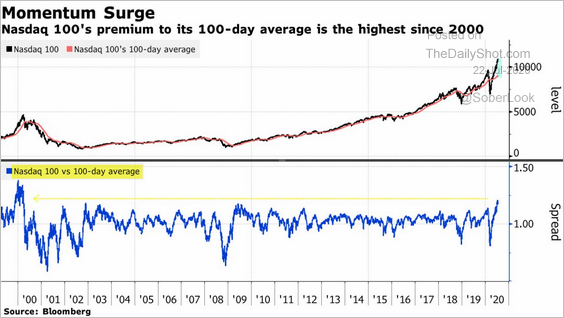 Source: @jessefelder, @markets Read full article
6. Nasdaq’s market cap has surpassed the EU’s GDP.
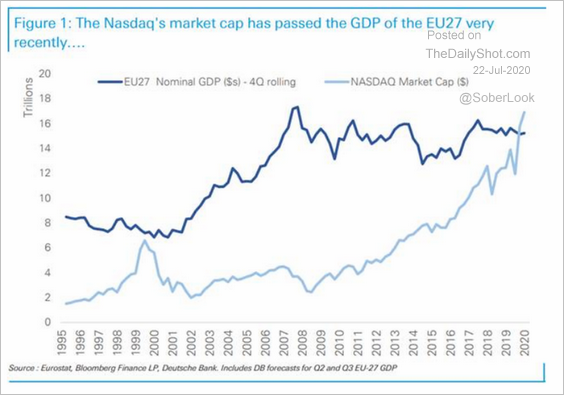 Source: Deutsche Bank Research, @lisaabramowicz1
7. Here is the Google search frequency for “tech stocks.”
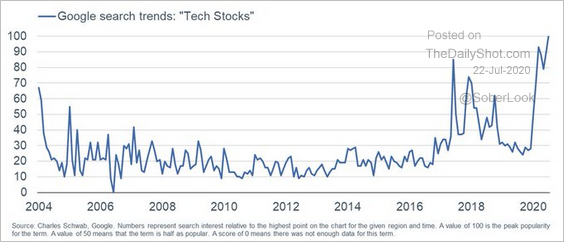 Source: @LizAnnSonders, @Google
8. Money-losing small-cap firms have been outperforming profitable companies.
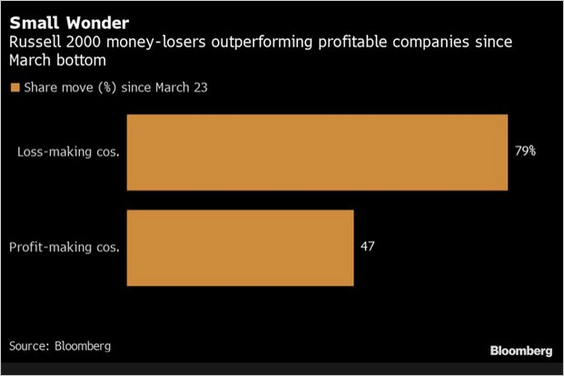 Source: @lisaabramowicz1 Read full article
9. Analysts have been upgrading global earnings estimates (2 charts).
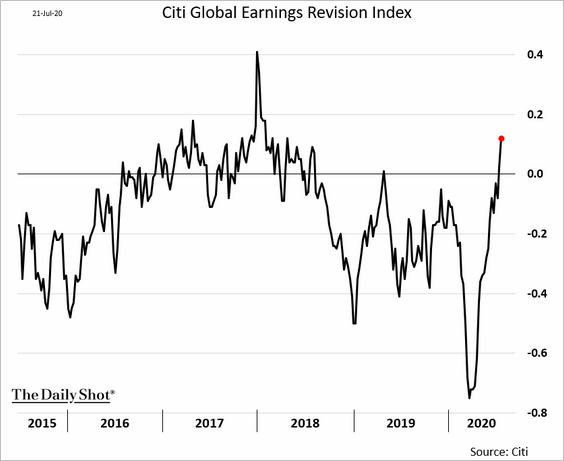
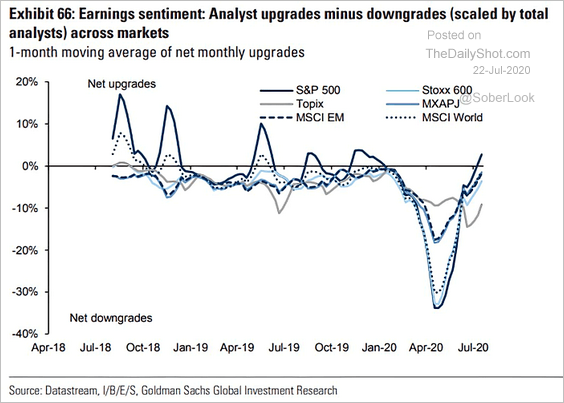 Source: @ISABELNET_SA, @GoldmanSachs
——————–
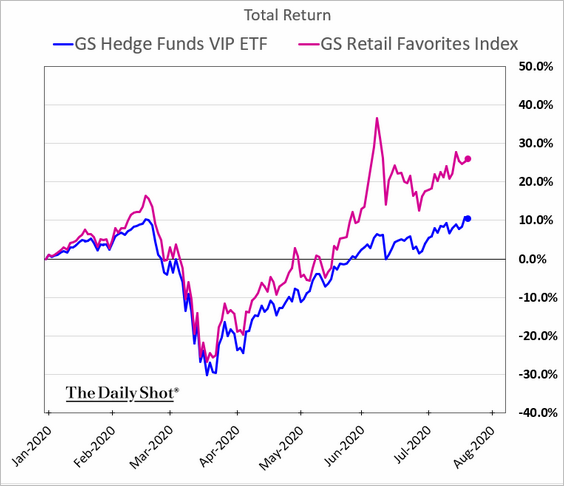
10. Hedge funds’ stock picks have been outperforming the market.
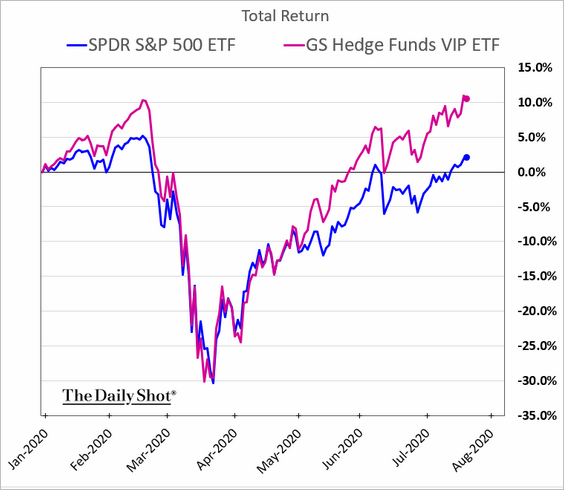
But retail investors’ favorite stocks are beating hedge funds.
——————–
11. Given their relatively small AUM, hedge funds have an outsize influence on stock prices.
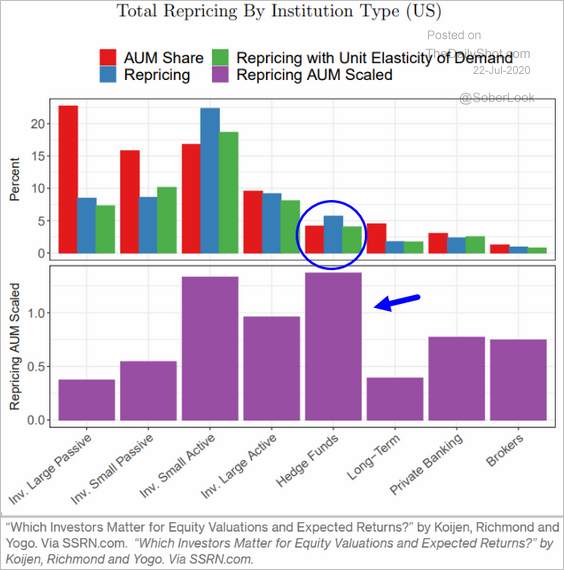 Source: @markets Read full article Further reading
12. VIX futures are holding support.
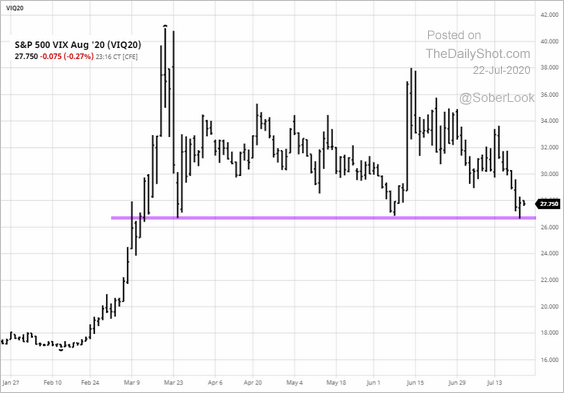 Source: barchart.com
Alternatives
1. Private equity deal volume has been subdued relative to last year.
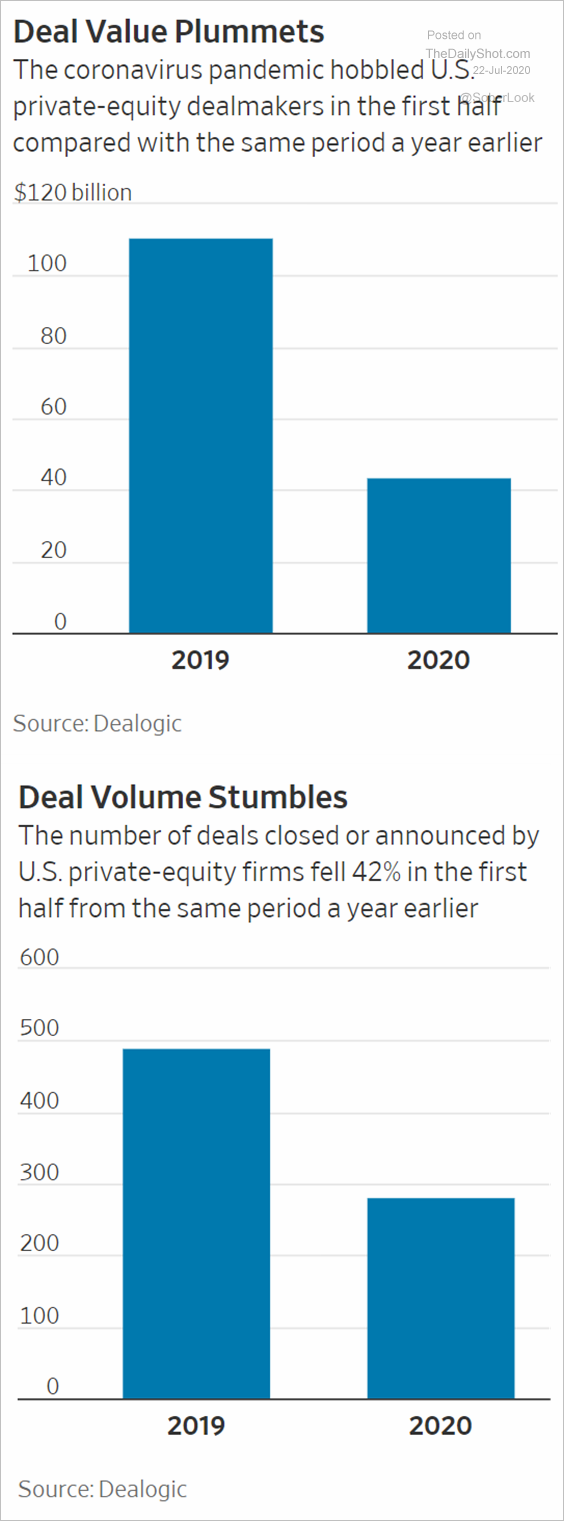 Source: @WSJ Read full article
Global venture deals have been slowing as well.
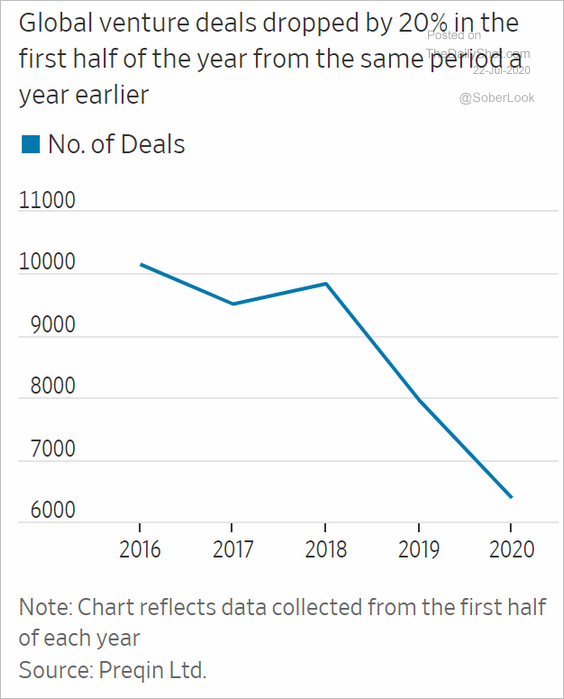 Source: @WSJ Read full article
——————–
2. SPACs have been popular in recent years, with demand ratcheting up in 2020.
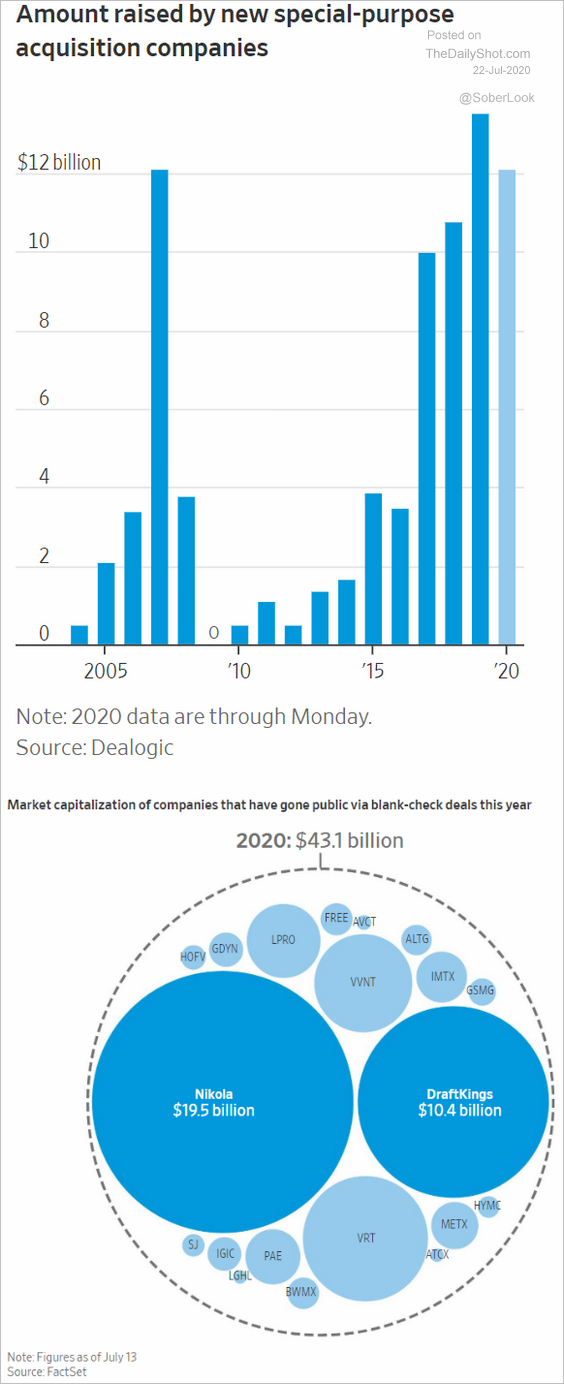 Source: @WSJ Read full article
3. This chart shows private debt assets by fund type.
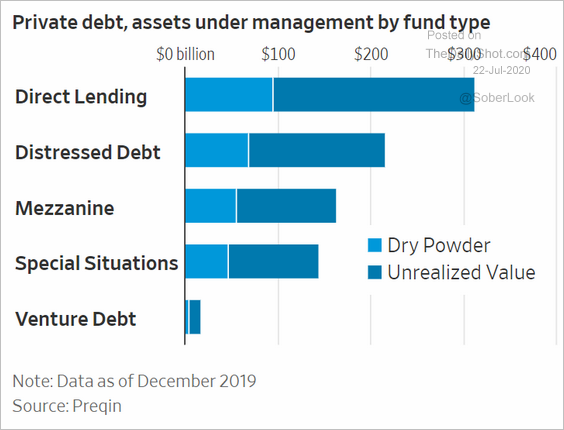 Source: @WSJ Read full article
4. Public pensions have been boosting their allocations to real estate.
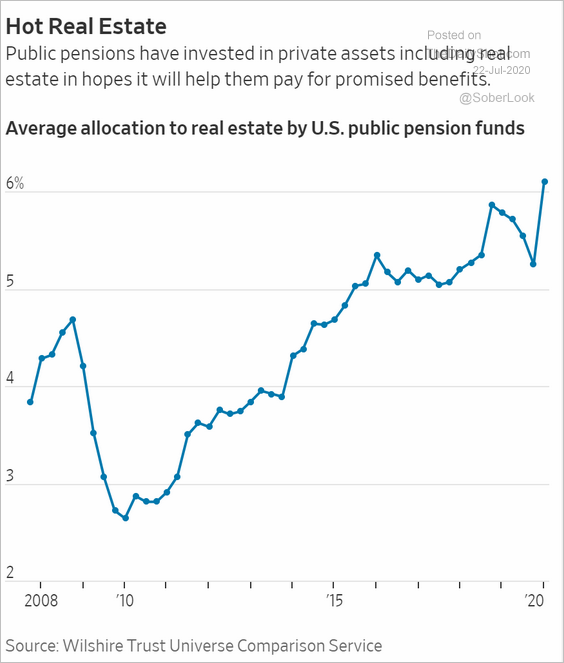 Source: @WSJ Read full article
5. Finally, we have the annualized returns for alternative investments (including art) since 1985.
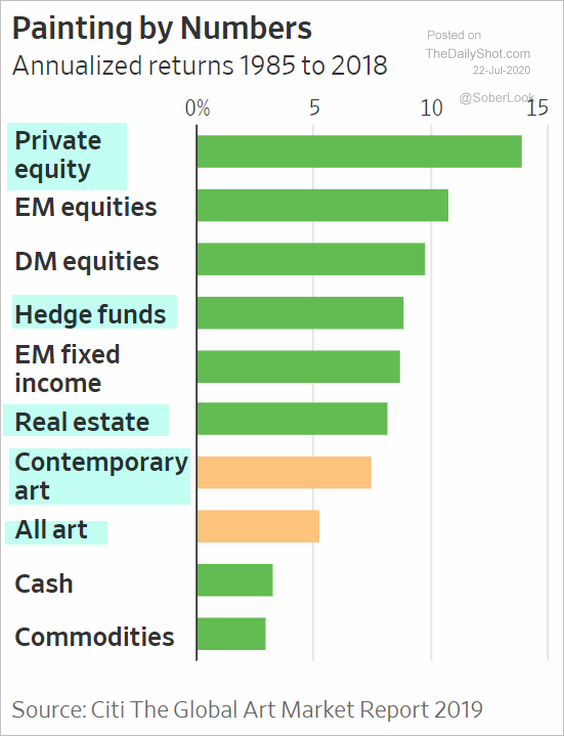 Source: @WSJ Read full article
Credit
1. Yields on US sub-investment-grade bonds are tumbling.
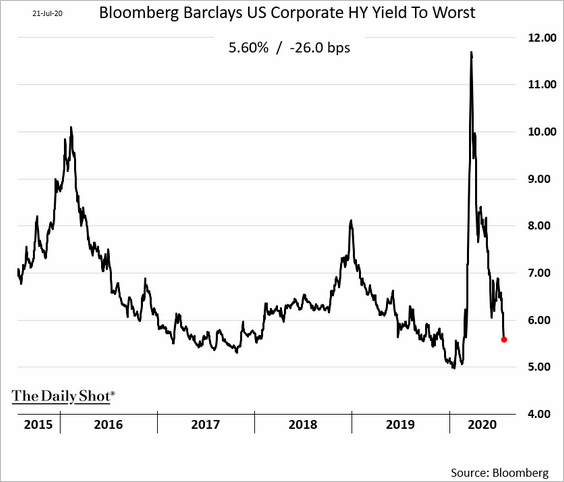 h/t @lisaabramowicz1
2. The pipeline of potential downgrades from investment-grade to junk remains elevated.
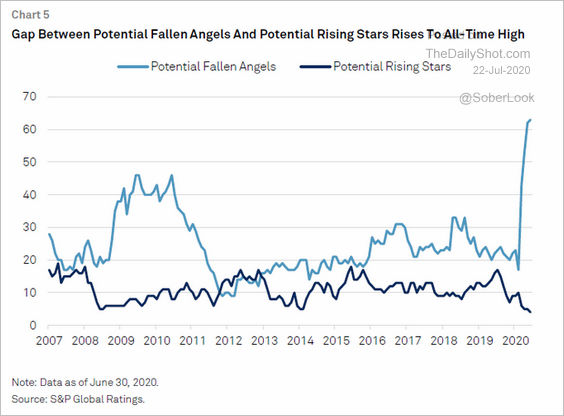 Source: S&P Global Ratings, @lisaabramowicz1
3. The Fed’s stimulus measures in March helped tighten agency CMBS spreads.
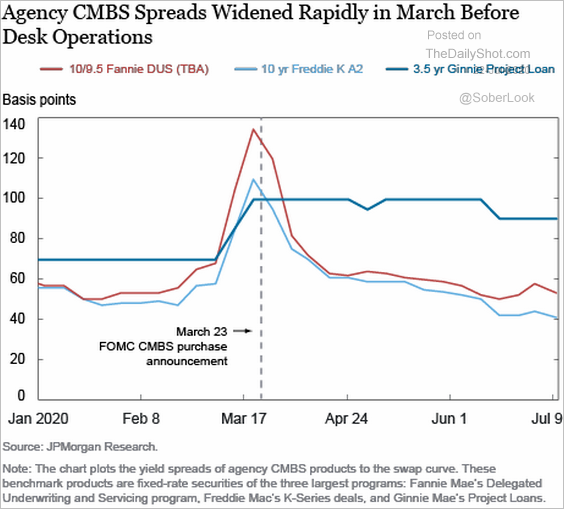 Source: Liberty Street Economics Read full article
4. There have been fewer muni auctions this year, with more business going to dealers.
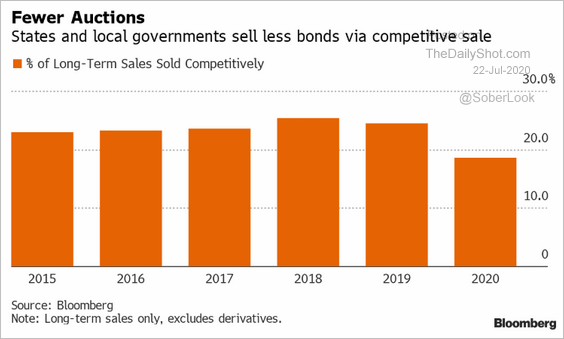 Source: Bloomberg Law Read full article
5. Here is the year-to-date performance across US muni markets.
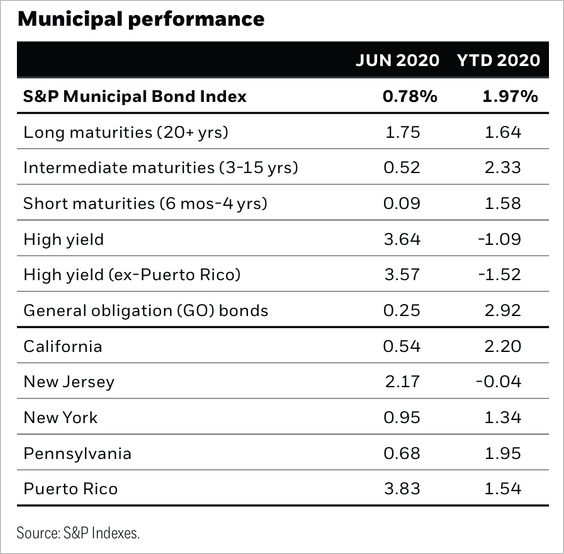 Source: BlackRock
Rates
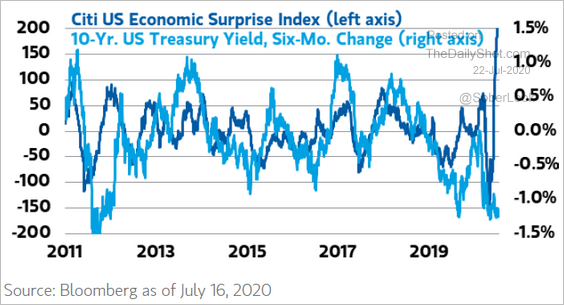
1. Fundamentals point to higher Treasury yields.
• The Citi Economic Surprise Index:
 Source: @ISABELNET_SA, @MorganStanley
• Cyclicals/defensives ratio (equities):
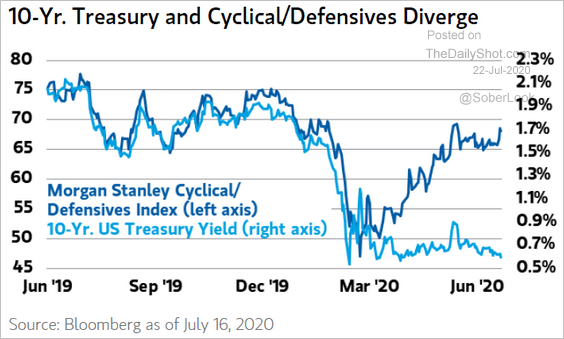 Source: @ISABELNET_SA, @MorganStanley
——————–
2. Central banks will need to boost their purchases to keep up with the rising supply of government debt.
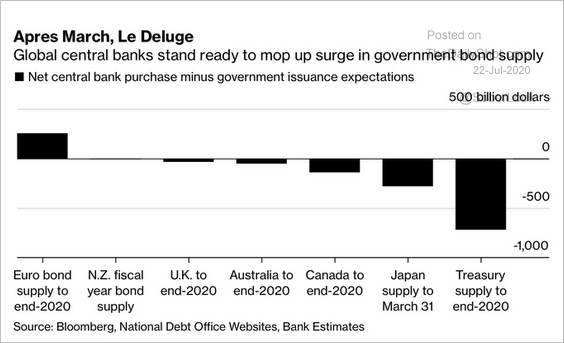 Source: @jessefelder, @markets Read full article
3. Algos pulled out of the Treasury market at the height of the crisis. Liquidity plummetted.
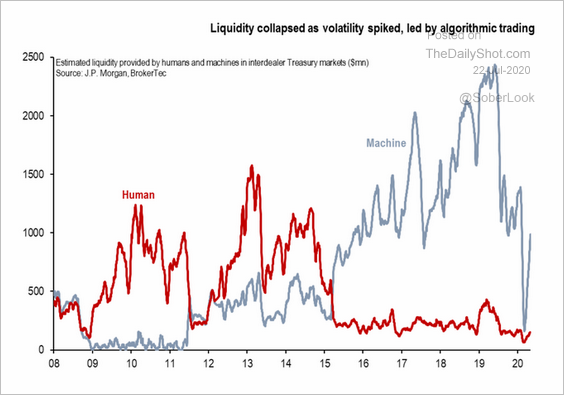 Source: @adam_tooze, @Brad_Setser Read full article
Commodities
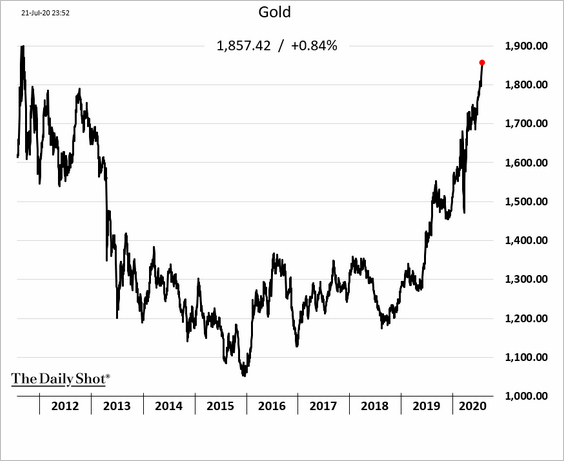
1. Gold continues to rally.
And silver is soaring.
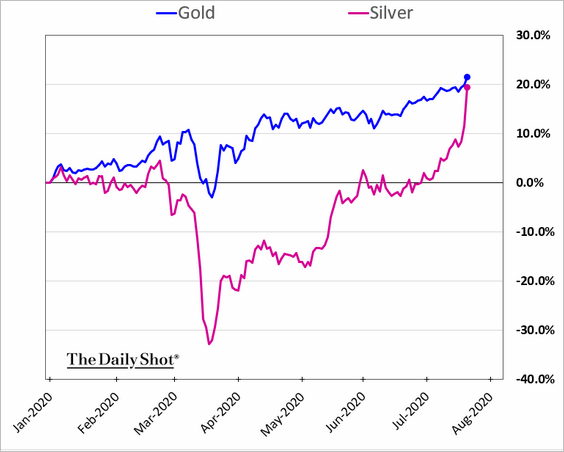
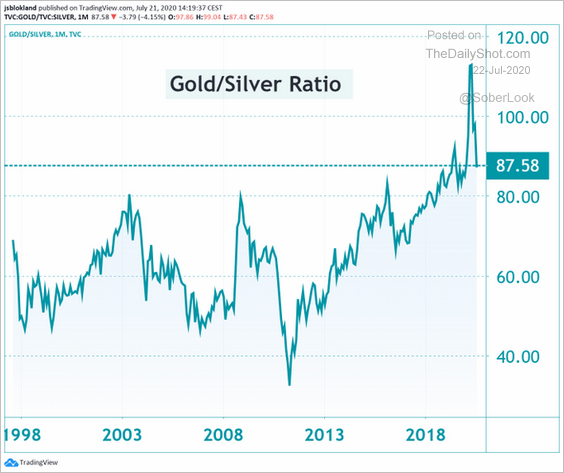 Source: @jsblokland
——————–
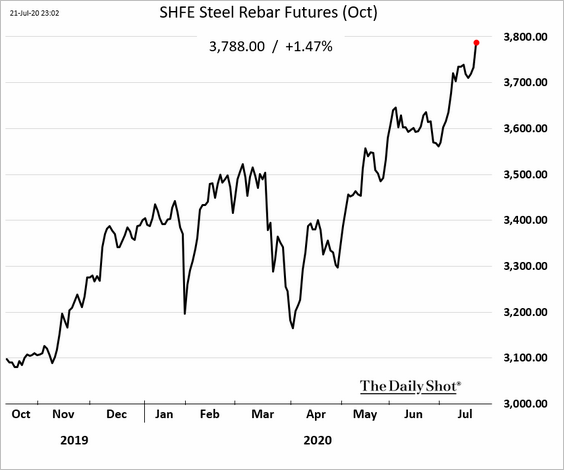
2. China’s iron ore and steel prices keep moving higher.
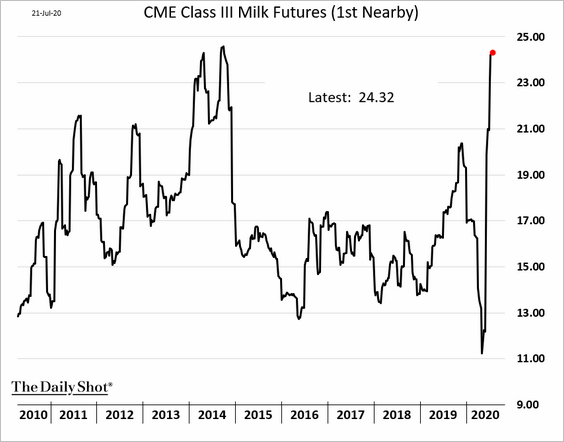
3. US milk futures are at multi-year highs.
Emerging Markets
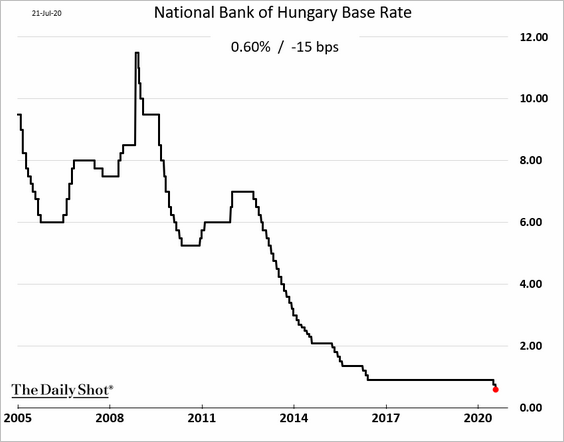
1. Hungarian central bank cut rates again.
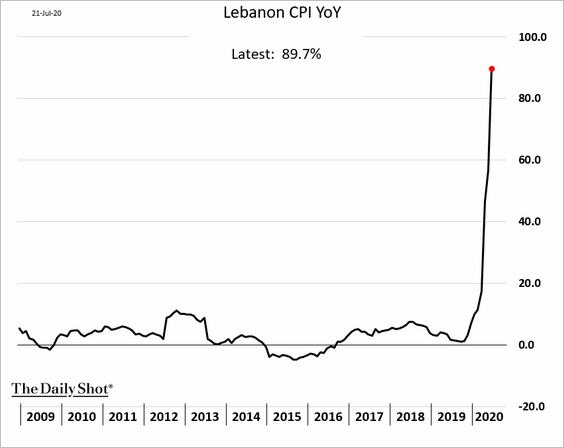
2. Lebanon’s crisis worsens.
• Inflation:
• “Other assets” (?) on the central bank’s balance sheet:
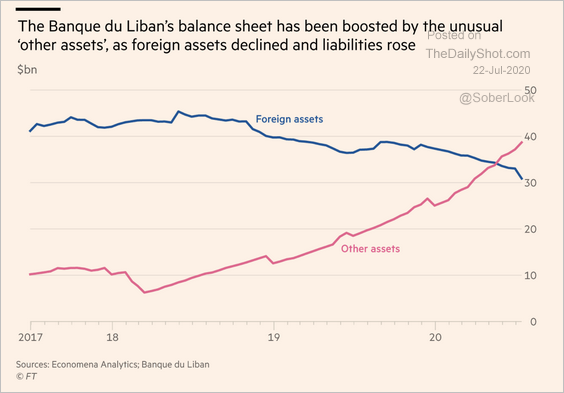 Source: @financialtimes Read full article
——————–
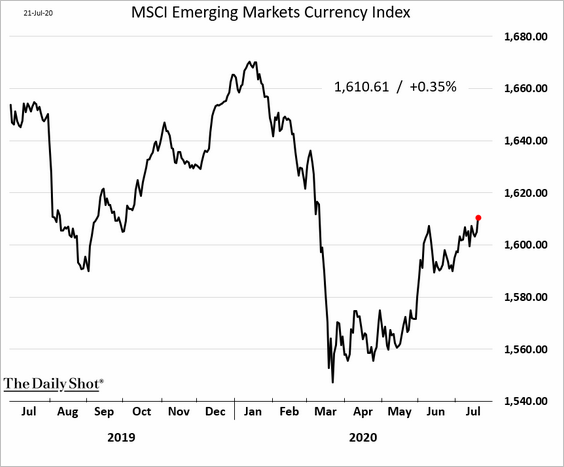
3. EM currencies continue to recover.
4. EM earnings estimates have bottomed.
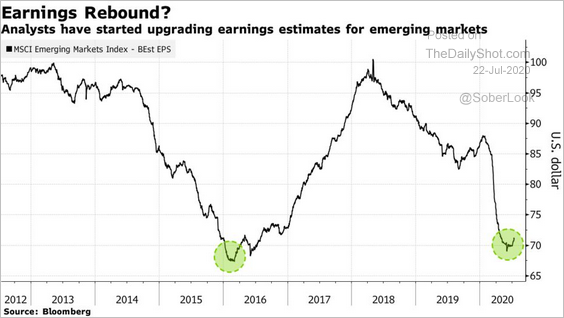 Source: @markets Read full article
China
1. The Shanghai freight index keeps moving higher (increased activity).
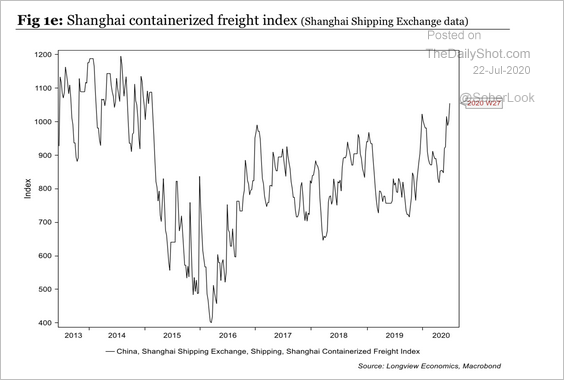 Source: Longview Economics
2. The World Economics SMI report shows acceleration in business sentiment recovery.
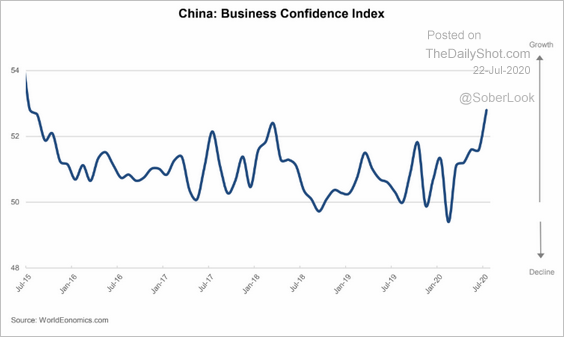 Source: World Economics
3. There have been substantial improvements in the ease of doing business in China.
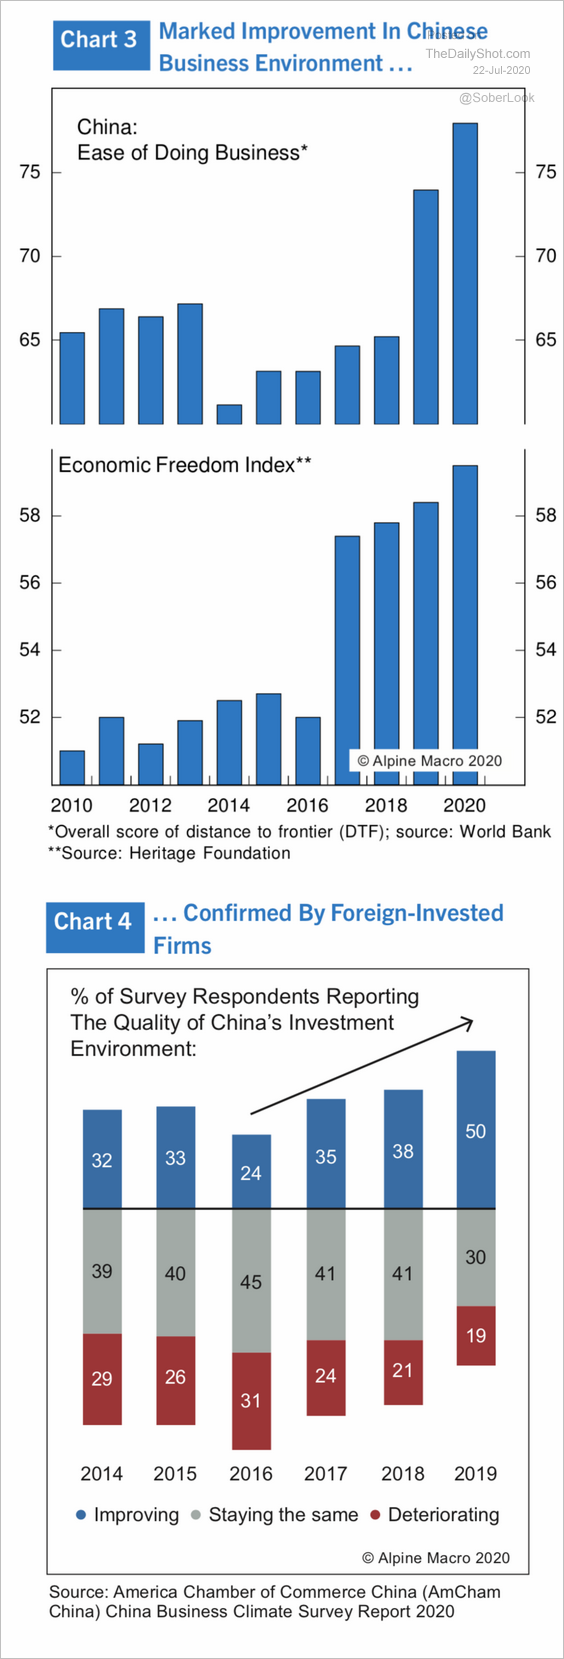 Source: Alpine Macro
4. Given the nation’s GDP per capita, China’s high-tech sector is quite large.
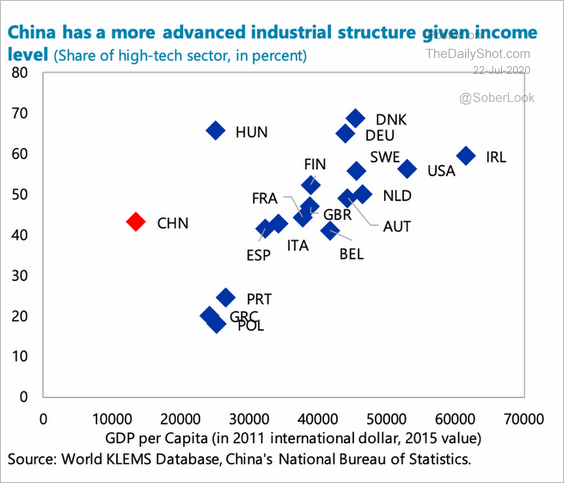 Source: @adam_tooze, IMF Read full article
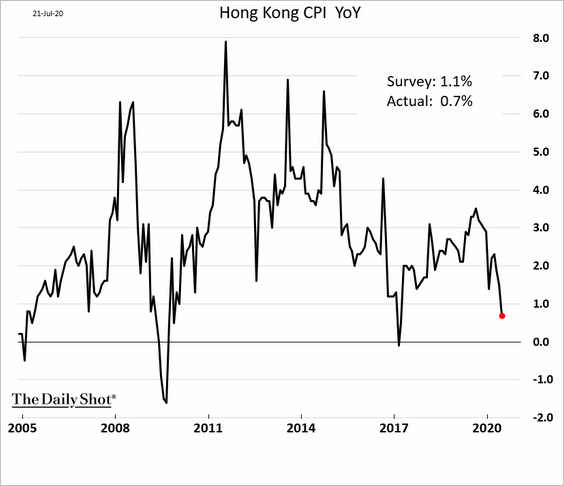
5. Hong Kong’s CPI dipped below 1%.
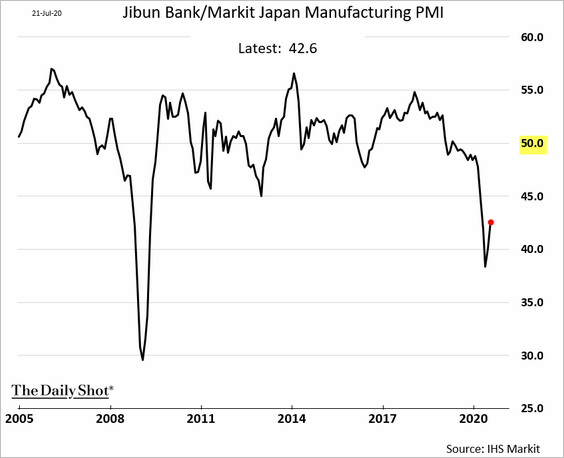
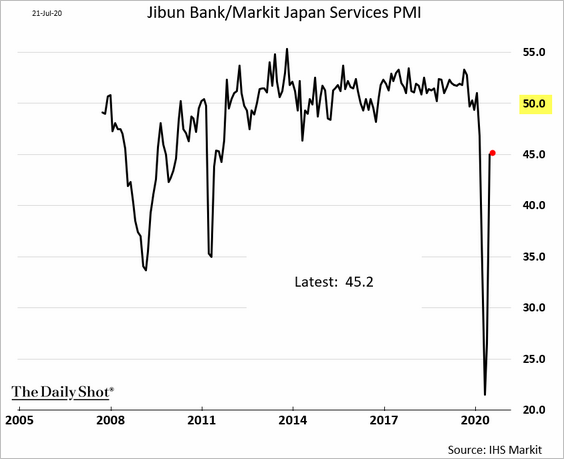
Japan
1. Busienss activity remains in ctontraction mode (PMI < 50).
• Manufacturing:
• Services:
——————–
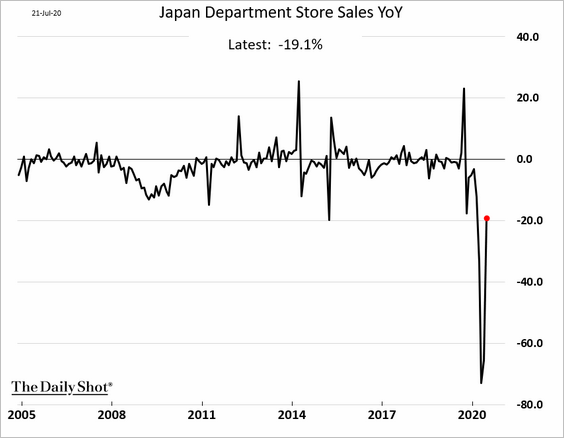
2. Department store sales bounced from extreme lows.
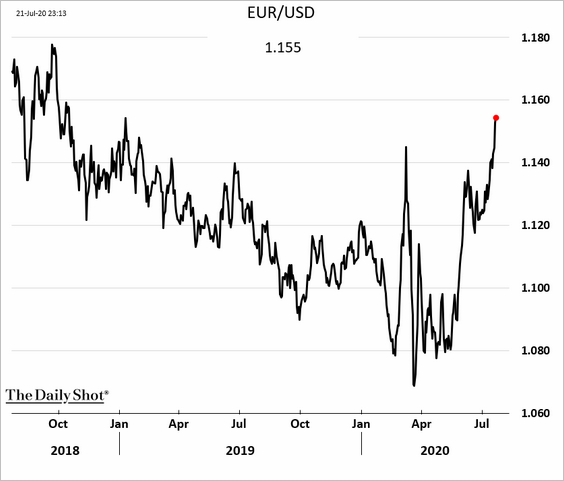
The Eurozone
1. The euro advanced further after the EU fiscal stimulus measures agreement.
2. Germany’s DAX index recovered all of the 2020 losses.
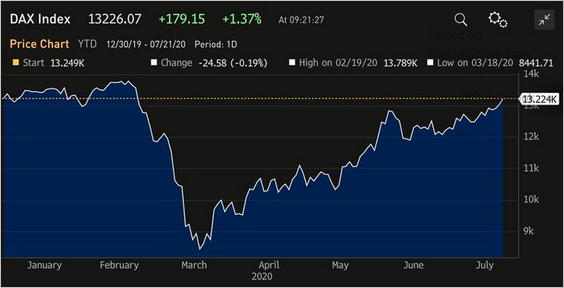 Source: @Schuldensuehner, @TheTerminal
3. The latest TLTRO tranche sharply increased the ECB’s (Eurosystem) balance sheet.
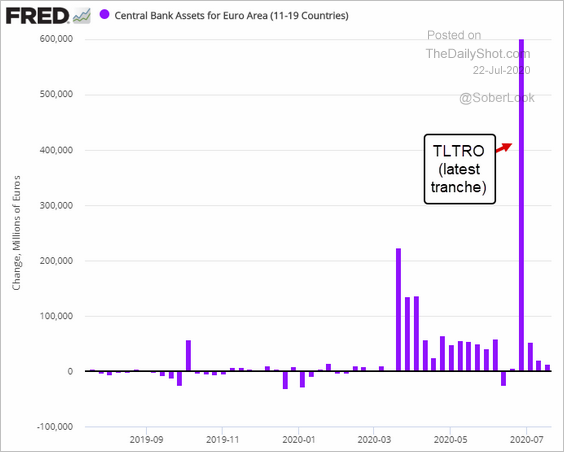
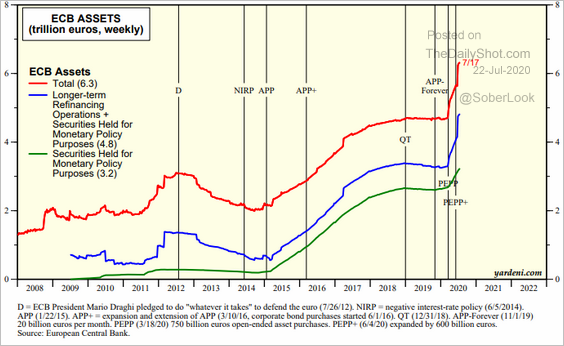 Source: Yardeni Research
——————–
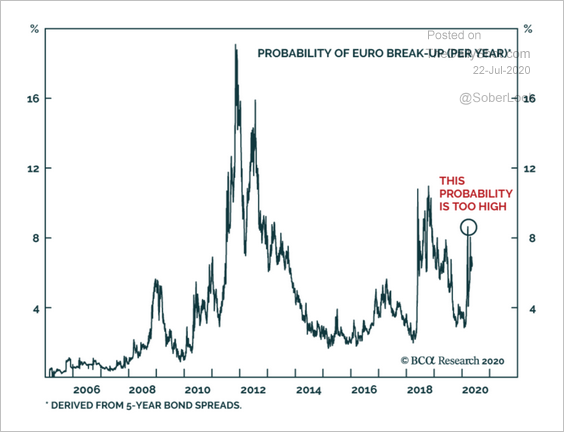
4. Here is a comment from BCA Research on the probability of a euro break-up.
The annual probability of a euro break-up over the coming five years embedded in European bond prices is currently 6.5%, which is a relatively elevated reading, even compared to the post-GFC environment. Yet, the euro is still overwhelmingly popular across member states, even in Italy.
 Source: BCA Research
5. French public debt-to-GDP ratio is above 120% as the deficit spikes.
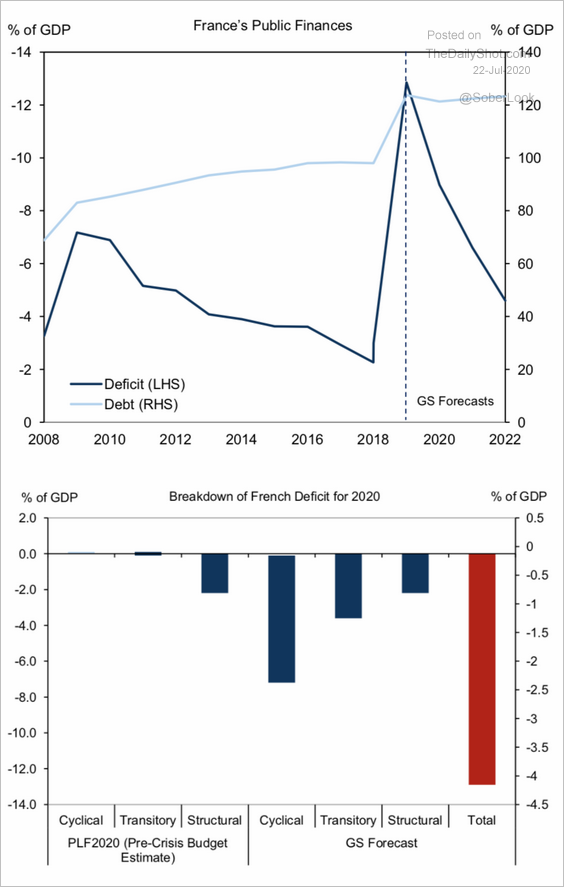 Source: Goldman Sachs
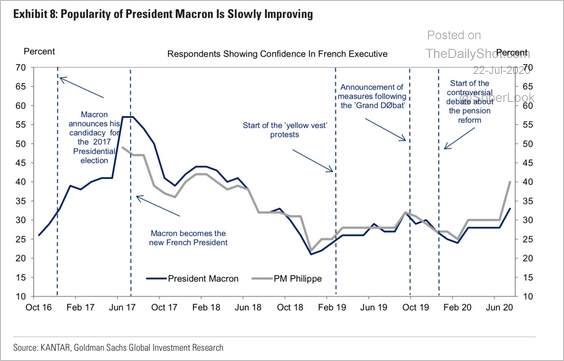
Separately, President Macron’s approval ratings have been improving.
 Source: Goldman Sachs
The United Kingdom
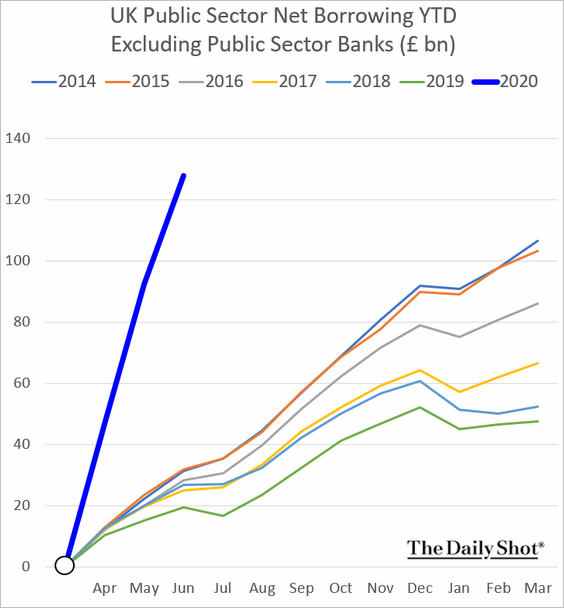
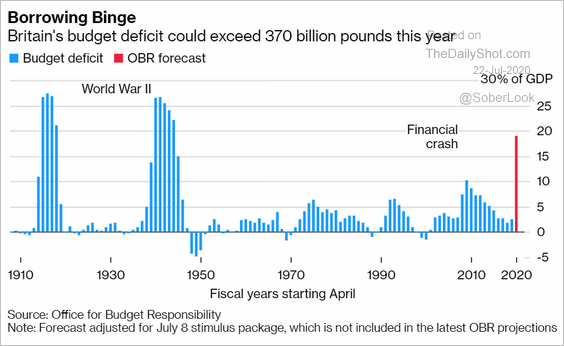
1. The breakneck pace of public borrowing continues (2 charts).
 Source: @business Read full article
——————–
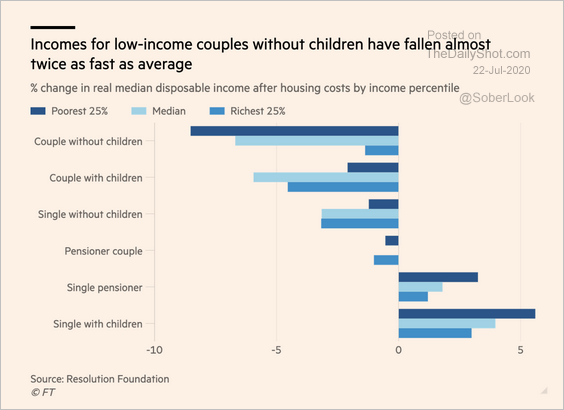
2. The shock to household incomes in 2020 has been severe (2 charts).
 Source: @financialtimes Read full article
 Source: @financialtimes Read full article
——————–
3. Daily coronavirus cases are rising again.
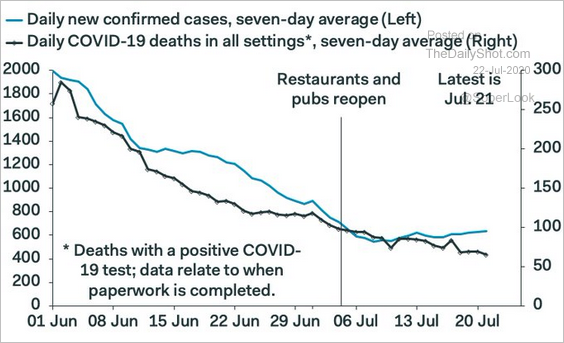 Source: @samueltombs
The United States
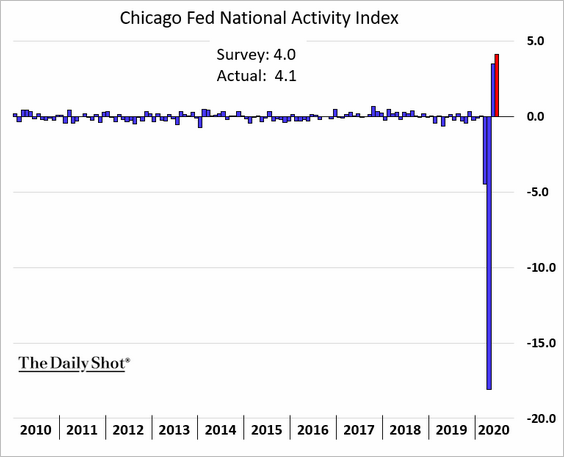
1. The Chicago Fed National Activity Index improved further in June.
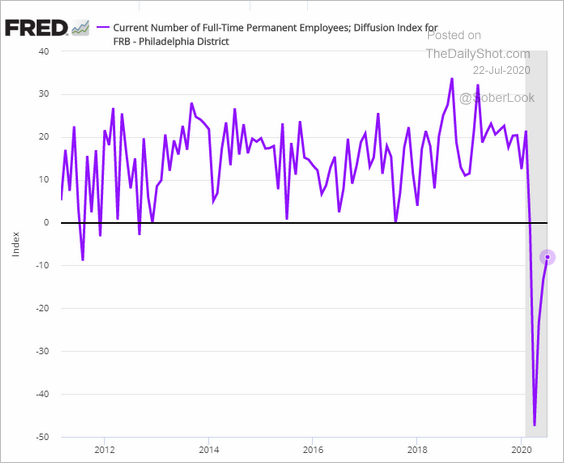
2. The Philly Fed’s regional non-manufacturing activity has stabilized after coming to a complete stop in April.
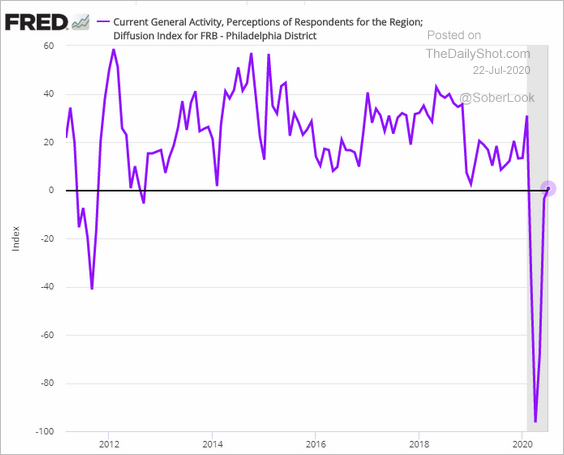
New orders have been rising.
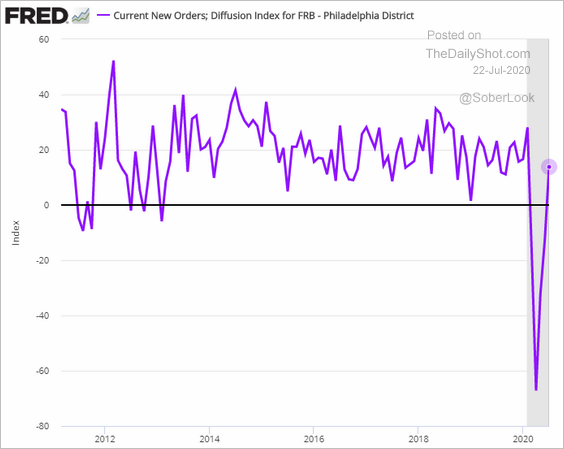
But employment remains soft.
——————–
3. At the national level, the World Economics SMI report still shows business activity in contraction territory.
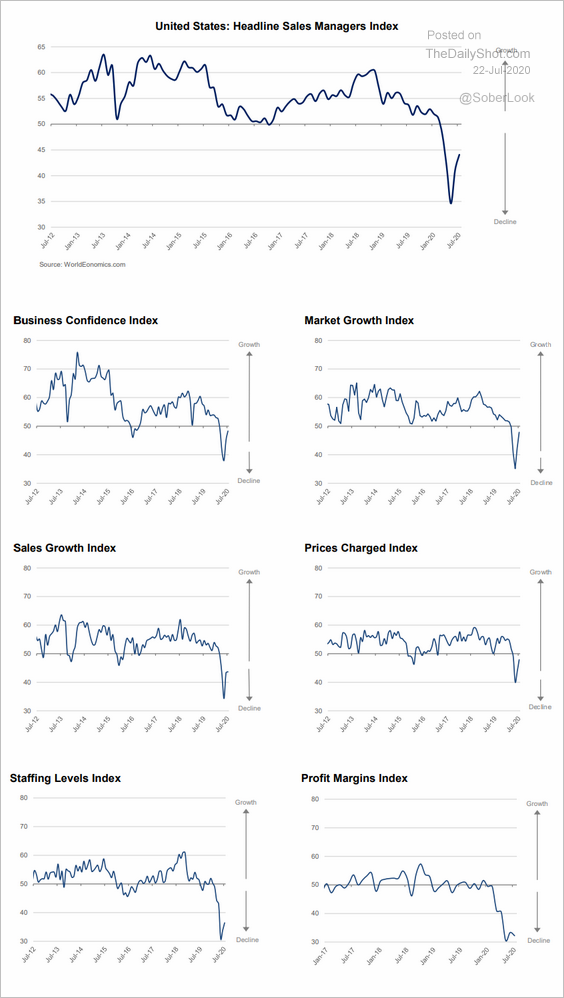 Source: World Economics
4. Home price appreciation has accelerated.
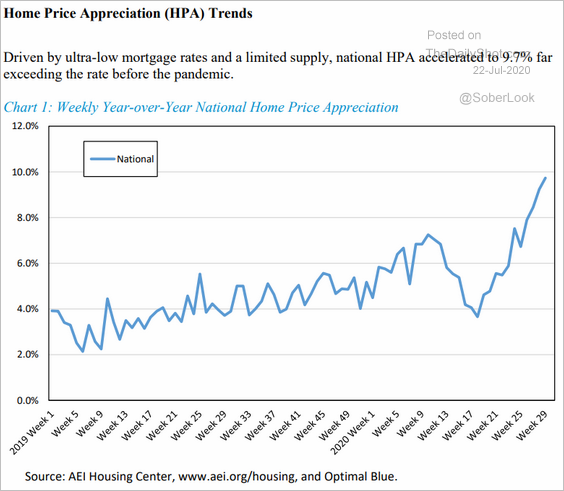 Source: AEI Housing Center
5. Goldman Sachs expects the new fiscal package to keep the disposable personal income growth in positive territory this quarter.
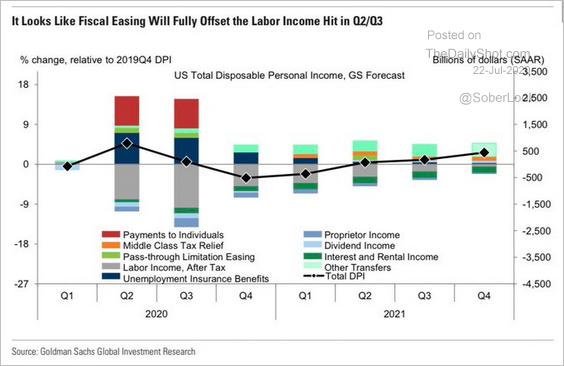 Source: Goldman Sachs, @carlquintanilla
6. This scatterplot shows job losses vs. industry average pay.
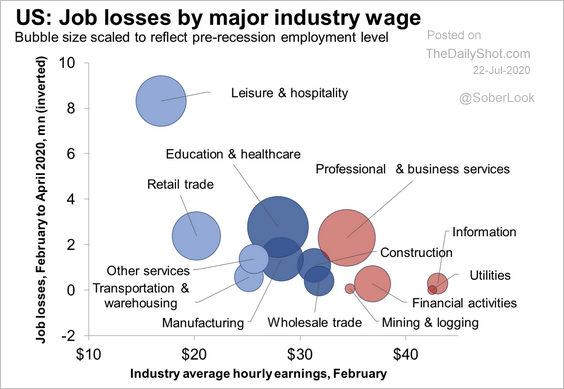 Source: Oxford Economics
7. US air travel recovery has stalled.
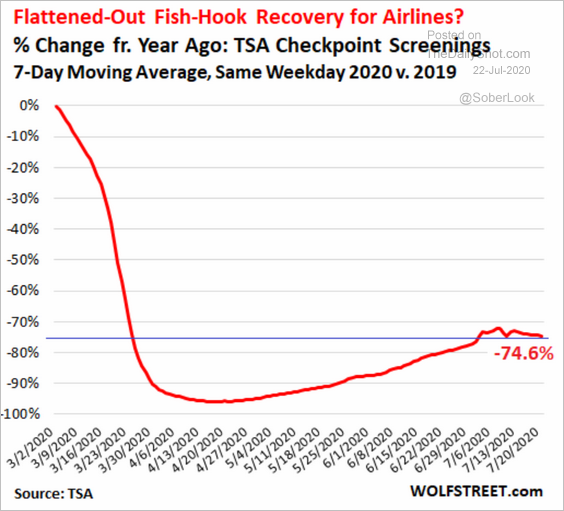 Source: @wolfofwolfst Read full article
8. The US dollar is approaching March lows.
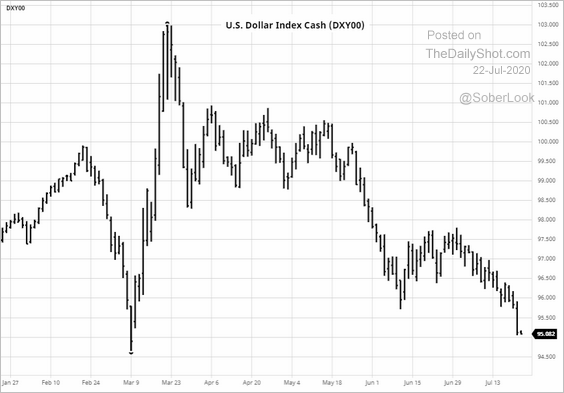 Source: barchart.com
Global Developments
1. This chart shows each currency’s over/undervaluation based on the Big Mac index and the PPP.
 Source: @adam_tooze, @TheEconomist Read full article
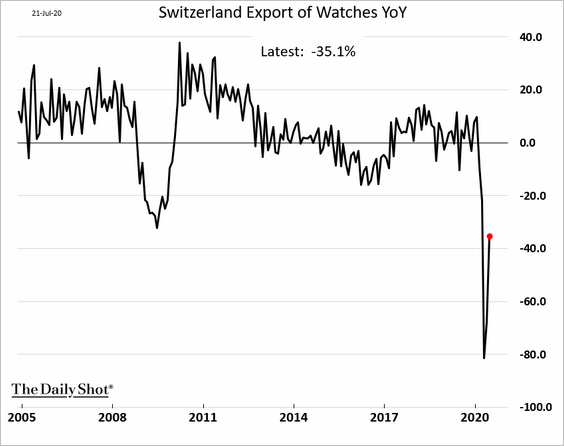
2. Swiss watch exports suggest that luxury demand remains weak.
3. Singapore’s electronics exports point to a rebound in corporate earnings.
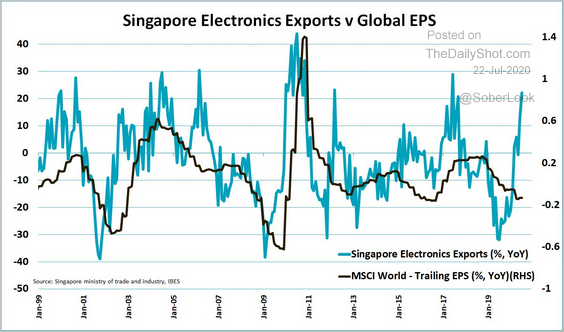 Source: @jsblokland
4. Finally, this chart shows world trade growth by decade and the Oxford Economics’ forecast for the next ten years.
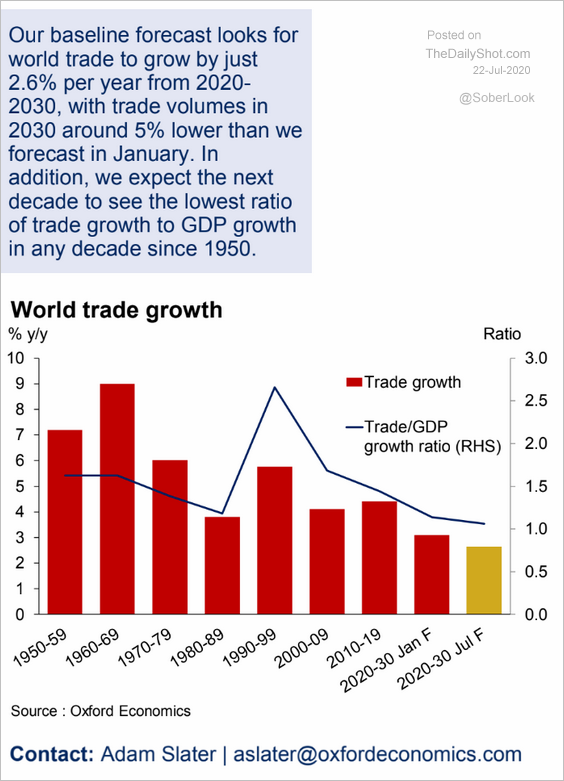 Source: Oxford Economics
——————–
Food for Thought
1. Global recorded music revenues:
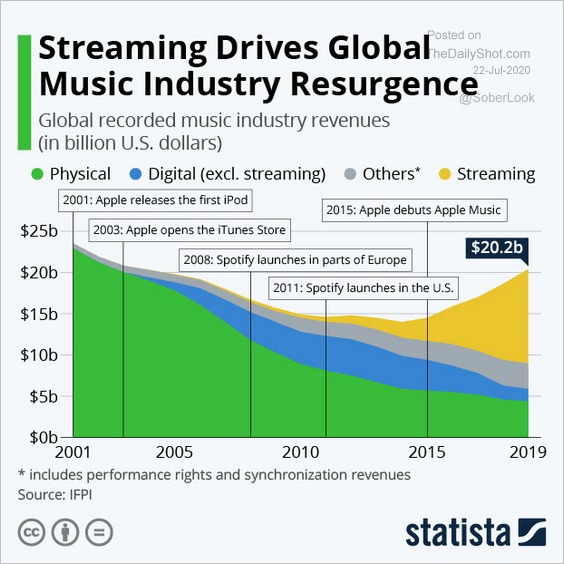 Source: Statista
2. Changes in consumer online shopping behavior:
 Source: Benedict Evans, Snippet.Finance Read full article
3. Electric vehicle sales:
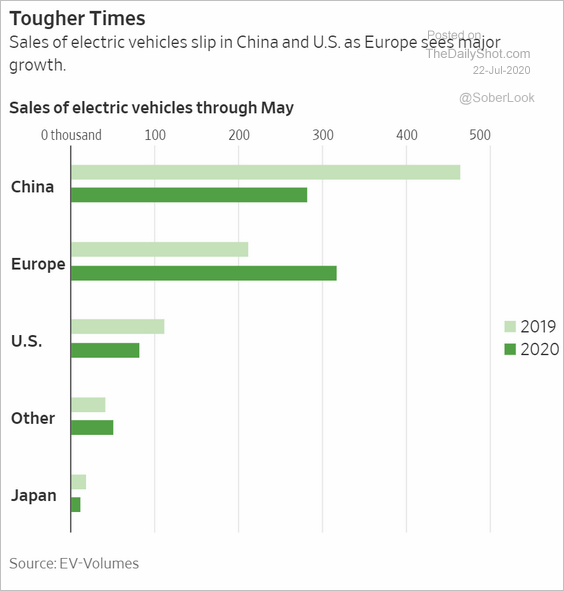 Source: @WSJ Read full article
4. TV and radio political ad spending:
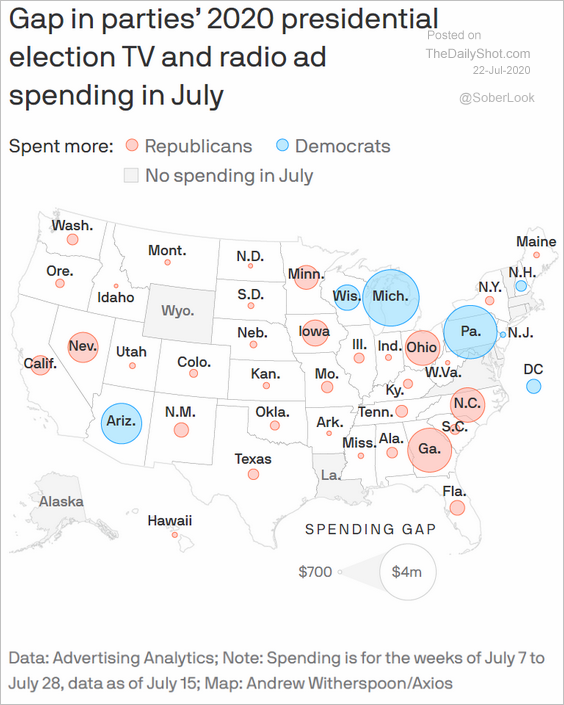 Source: @axios Read full article
5. US Supreme Court justices favorability ratings:
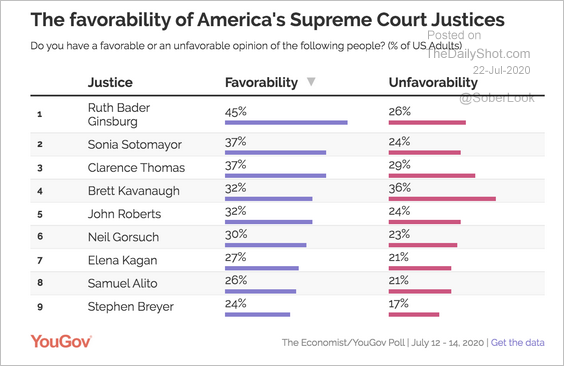 Source: YouGov Read full article
• Estimated ideologies of Supreme Court justices (based on this term):
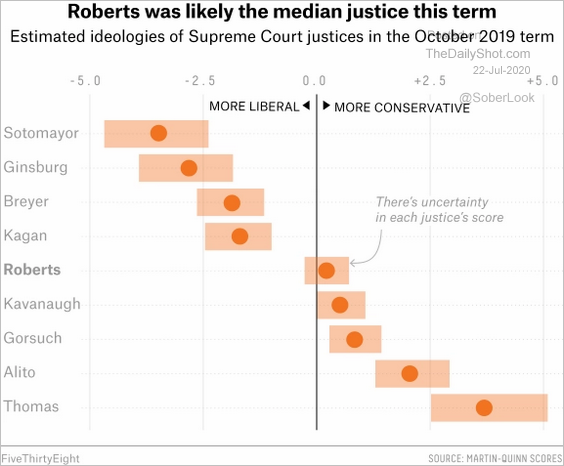 Source: FiveThirtyEight Read full article
——————–
6. Energy savings from working at home:
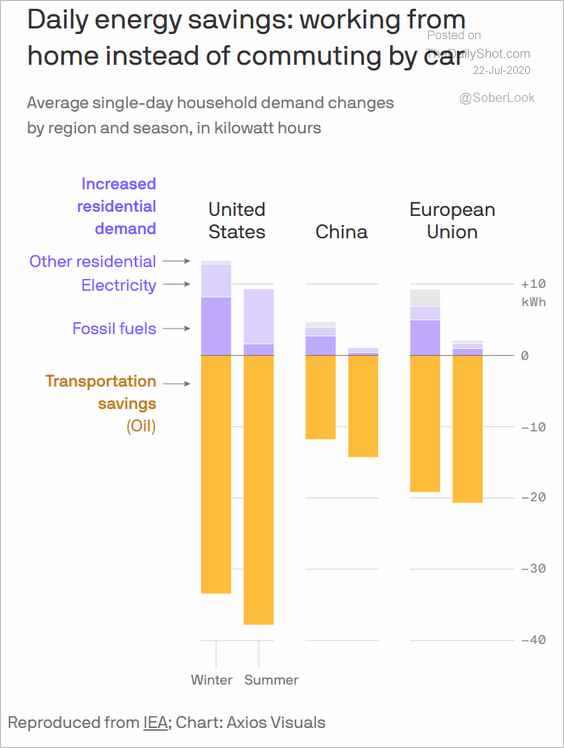 Source: @axios Read full article
7. The cost of delaying college:
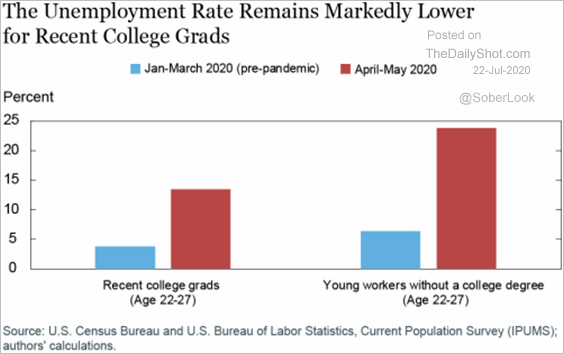 Source: Liberty Street Economics Read full article
8. Retail space asking rents in Manhattan:
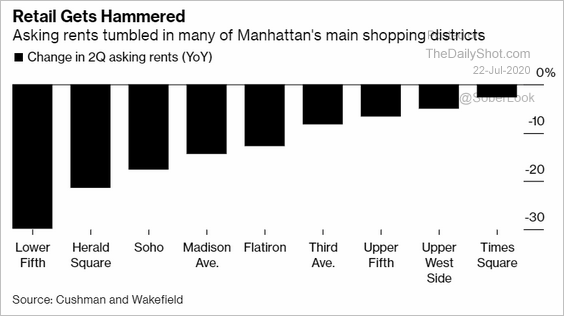 Source: @business Read full article
9. Radioactive fallout from the Chernobyl disaster in 1986:
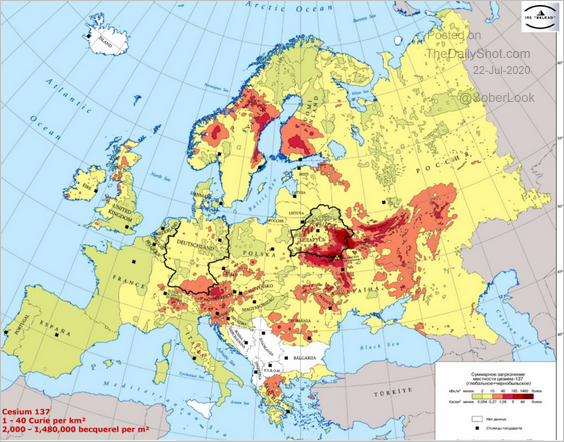 Source: @adam_tooze Read full article
——————–