
The Daily Shot: 23-Jul-20
• Important Update Regarding The Daily Shot
• The United States
• Canada
• The Eurozone
• Europe
• Asia – Pacific
• China
• Emerging Markets
• Cryptocurrency
• Commodities
• Energy
• Equities
• Credit
• Rates
• Global Developments
• Food for Thought
Important Update Regarding The Daily Shot
The Daily Shot will no longer be published by The Wall Street Journal beginning on August 1. The Daily Shot will still be available as an independent publication. If you would like to continue to receive The Daily Shot, you can get more information on how to subscribe here.
The United States
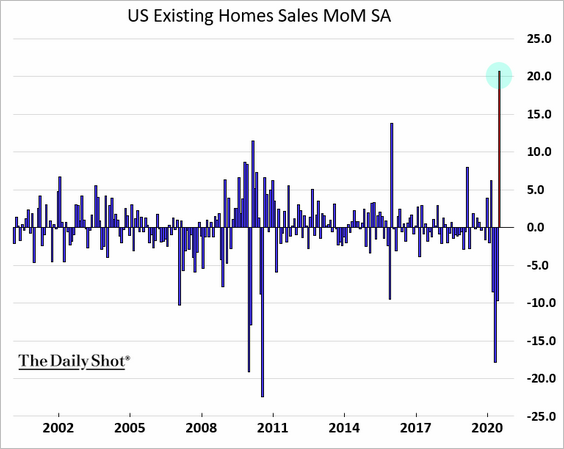
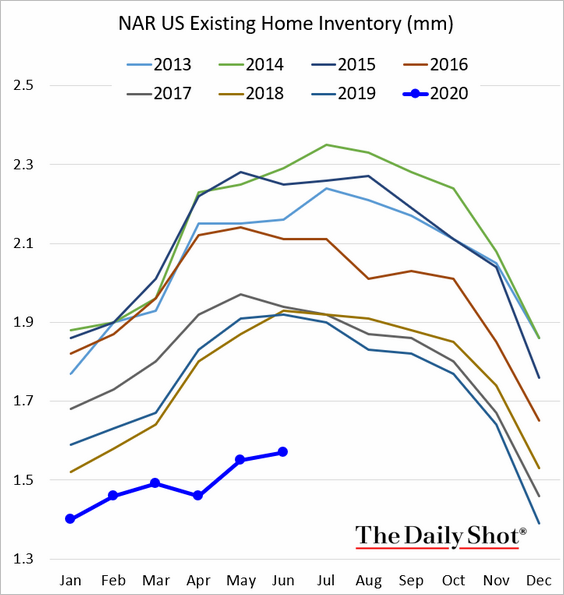
1. Let’s begin with the housing market.
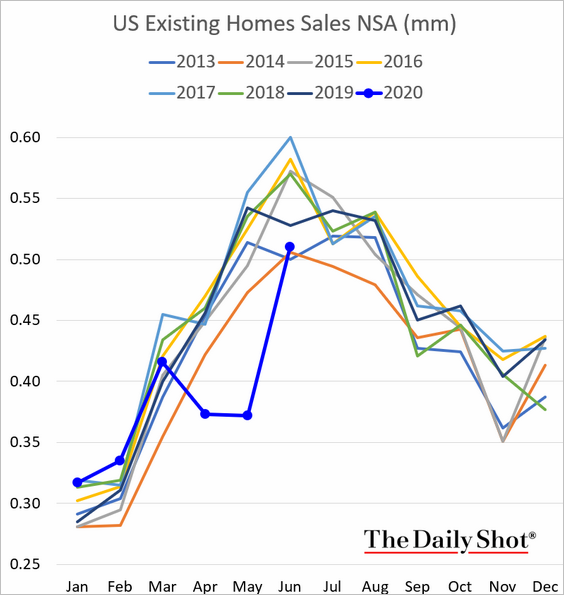
• Existing home sales rose sharply in June.
– Despite the increase, sales are running just above the levels we saw in 2014.
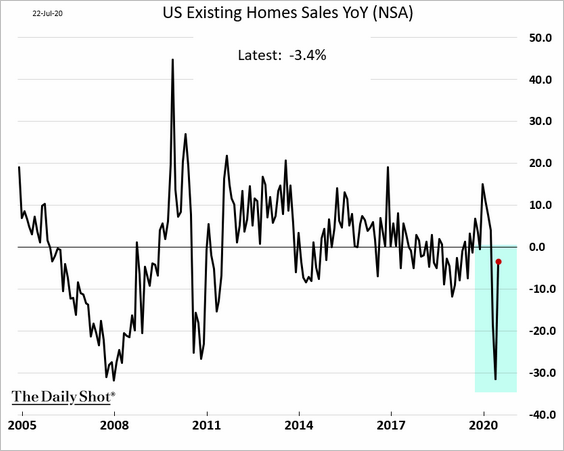
– Here is the year-over-year change.
– This chart shows the regional breakdown.
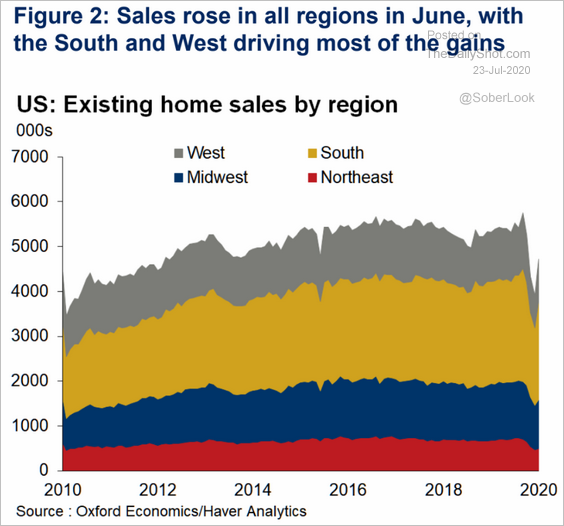 Source: Oxford Economics
– Inventories remain at multi-year lows.
– Record-low mortgage rates and brisk loan applications point to further improvements in home sales (2 charts).
 Source: Piper Sandler
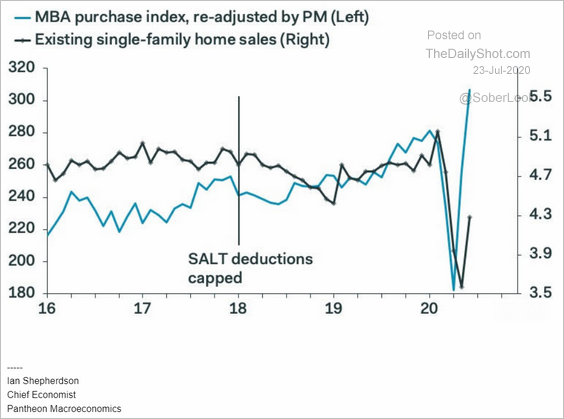 Source: Pantheon Macroeconomics
——————–
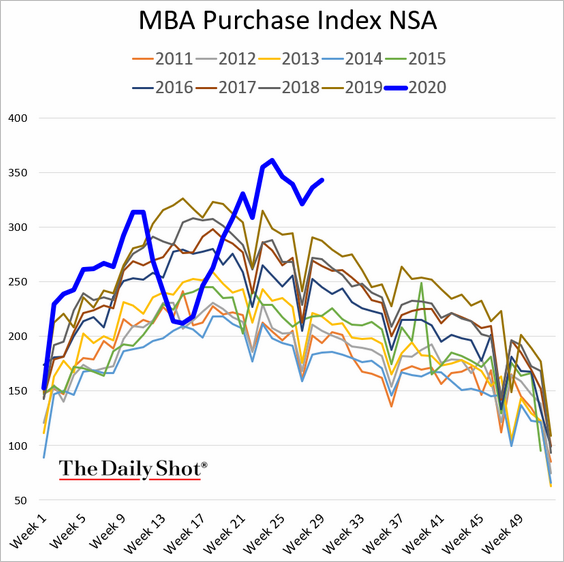
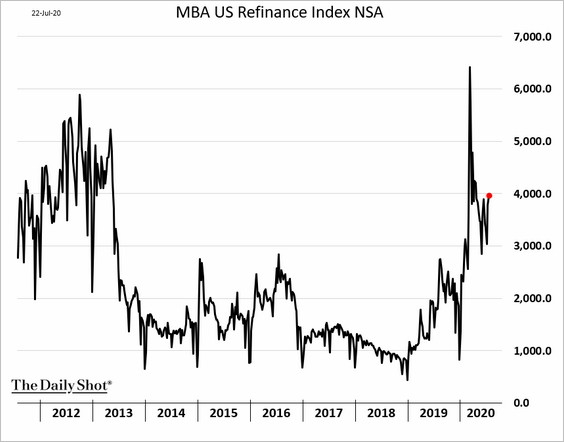
• Mortgage applications remain elevated.
– Home purchase applications:
– Refinance applications:
——————–
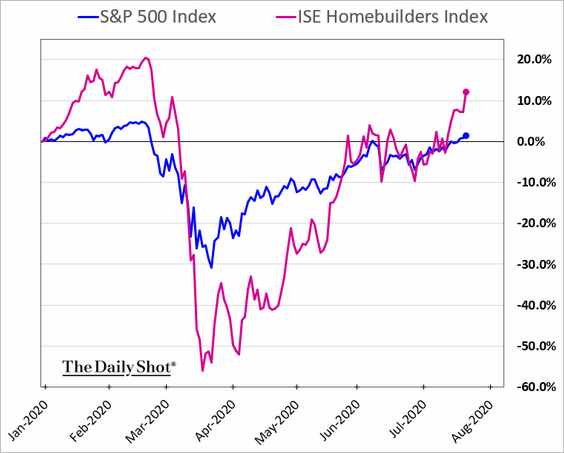
• Homebuilder shares are now outperforming year-to-date.
——————–
2. The Household Pulse Survey (from the Census Bureau) suggests that the labor market rebound peaked in mid-June and has been reversing since.
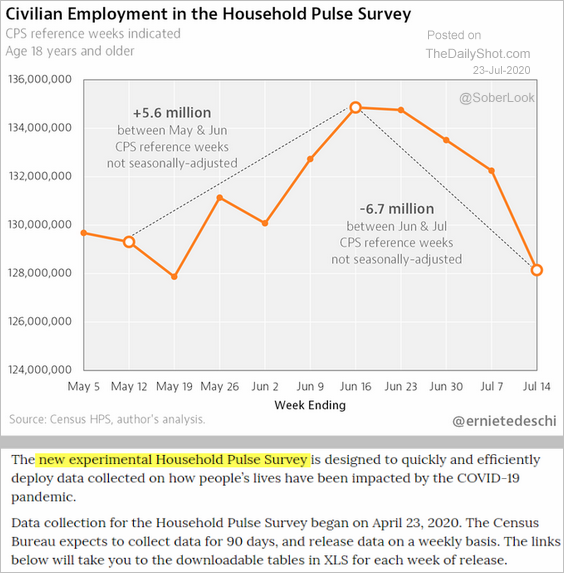 Source: @ernietedeschi, @uscensusbureau Further reading
3. Measures of consumer sentiment remain subdued.
• The Morning Consult Index of Consumer Sentiment:
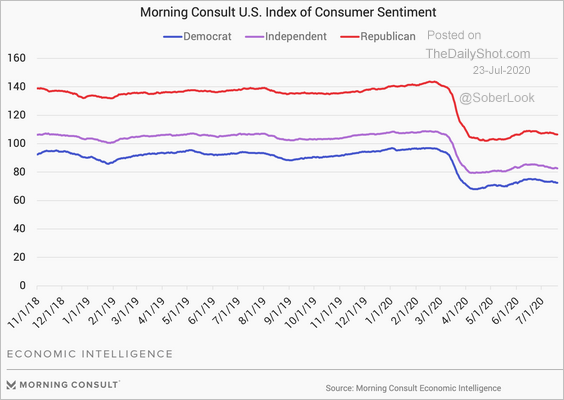 Source: Morning Consult Read full article
• The HPS-CS Economic Sentiment Index:
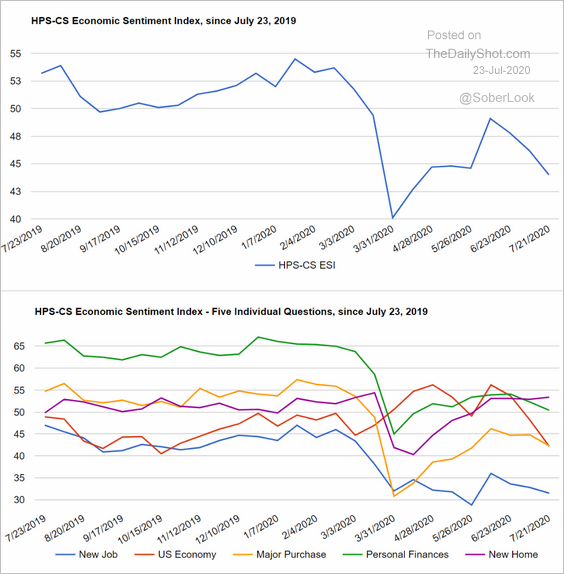 Source: @HPSInsight, @CivicScience
By the way, notice the strength in the housing component of the above index (purple).
——————–
4. Next, we have some high-frequency indicators of economic activity.
• Hotel room purchases (weekly changes):
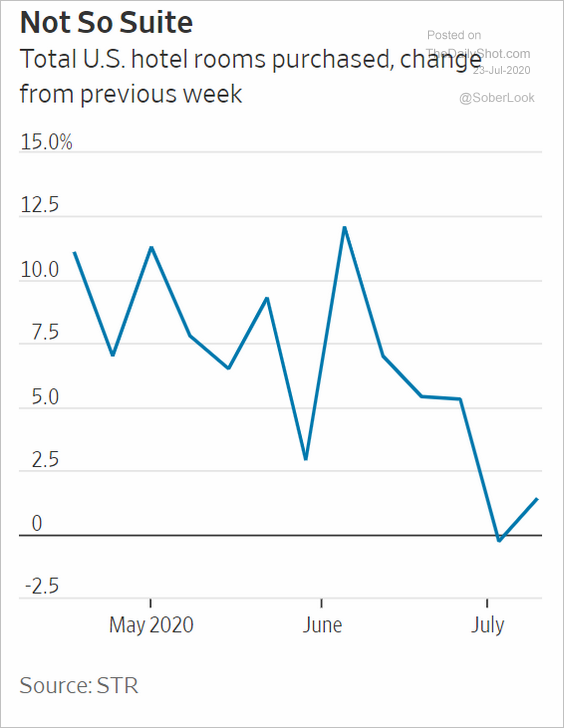 Source: @WSJ Read full article
• Restaurant reservations:
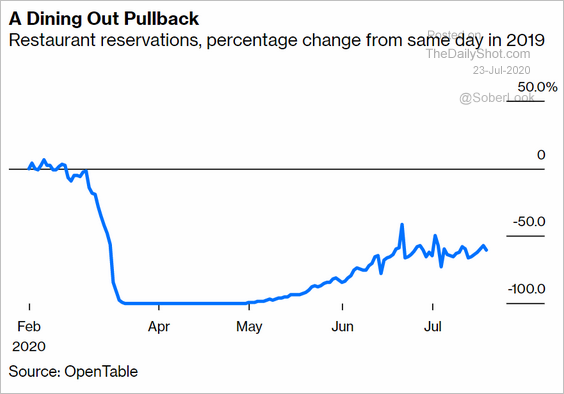 Source: @Noahpinion, @bopinion Read full article
• The NY Fed’s economic activity index (WEI):
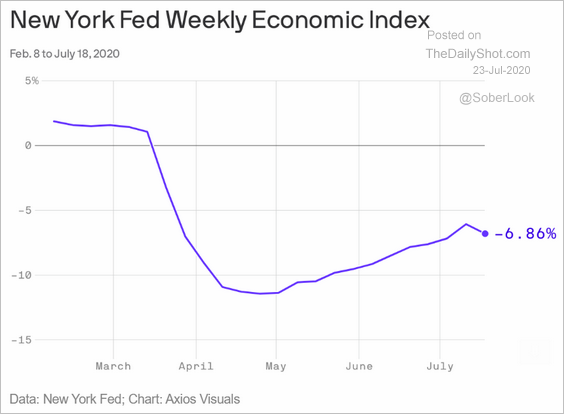 Source: @axios Read full article
——————–
5. Finally, financial Twitter sentiment has been most upbeat on the consumer.
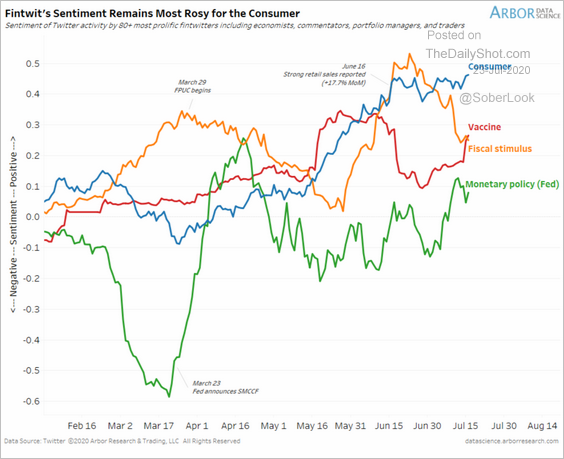 Source: Arbor Research & Trading
Canada
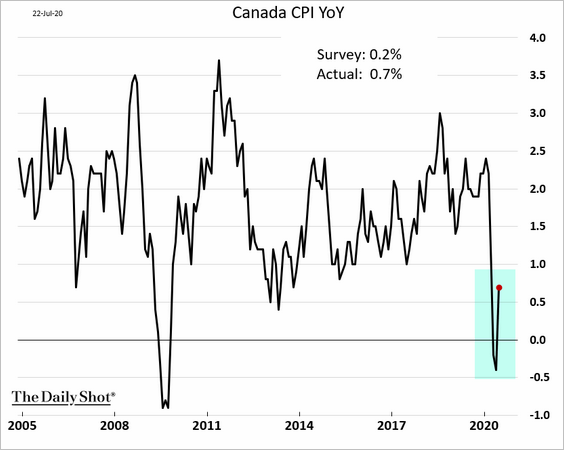
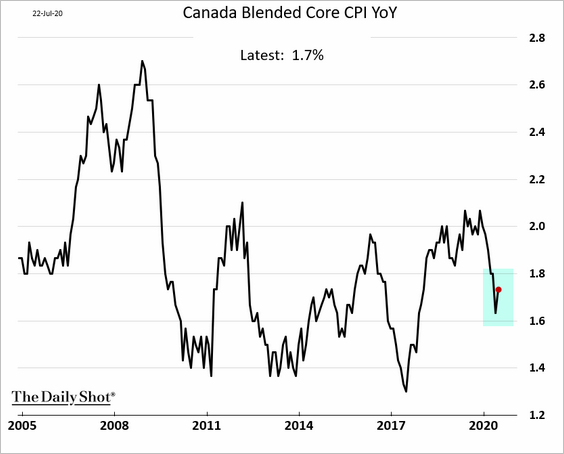
1. Inflation surprised to the upside.
 Source: Reuters Read full article
• Headline CPI:
• Core CPI:
——————–
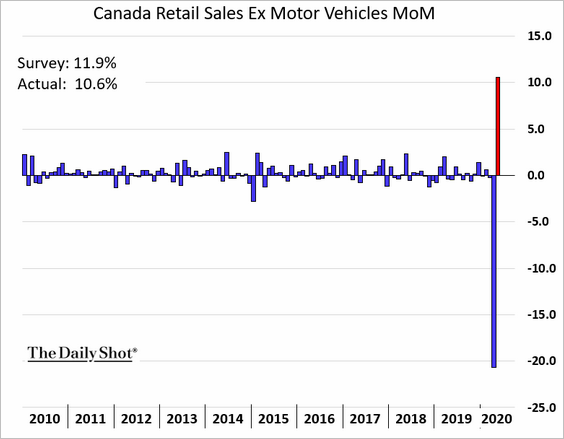
2. Retail sales rose sharply in May, after a record decline.
Car sales rebounded in June.
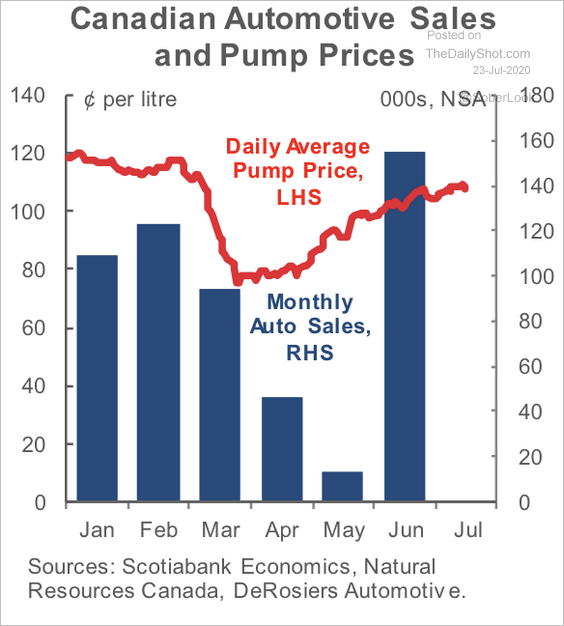 Source: Scotiabank Economics
The Eurozone
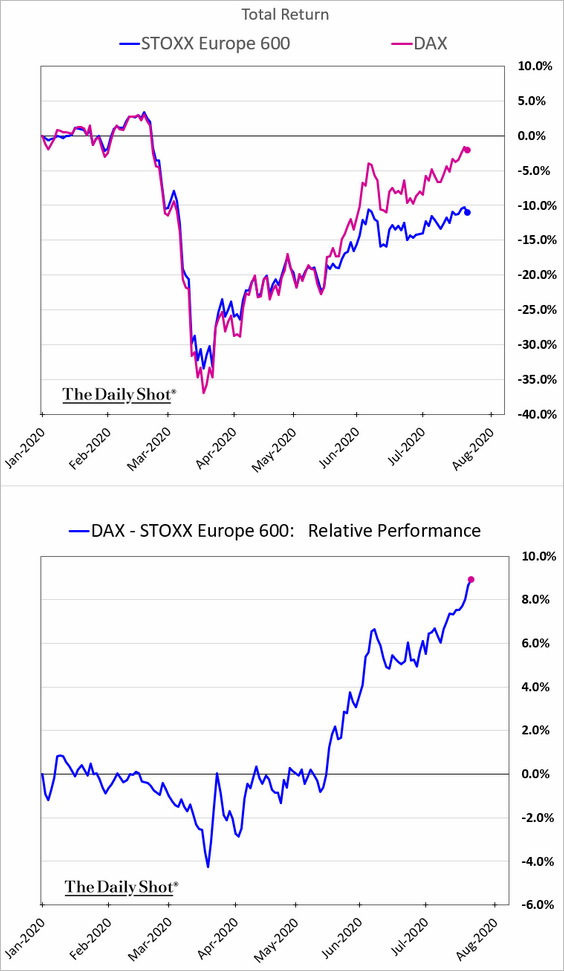
1. Germany’s DAX index has been outperforming.
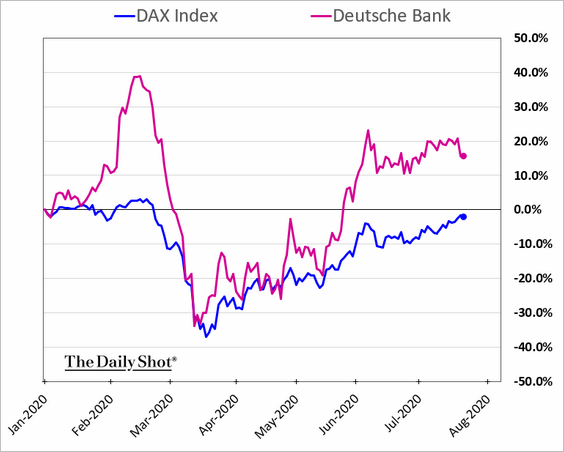
The rebound in Deutsche Bank shares has been especially impressive.
——————–
2. Italian 30yr government bond yield dipped below 2% for the first time since March.

3. Euro-area bond funds have been experiencing capital outflows since 2014.
 Source: Goldman Sachs
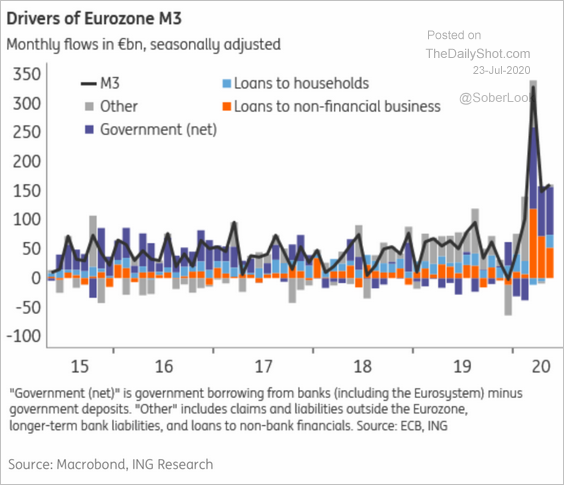
4. There were two key drivers behind the recent spike in the broad money supply.
• Banks purchased massive amounts of government debt to sell to the ECB, as the central bank accelerated its QE.
• Liquidity needs boosted corporate borrowing, a good portion of which was tapping existing credit lines.
 Source: ING
——————–
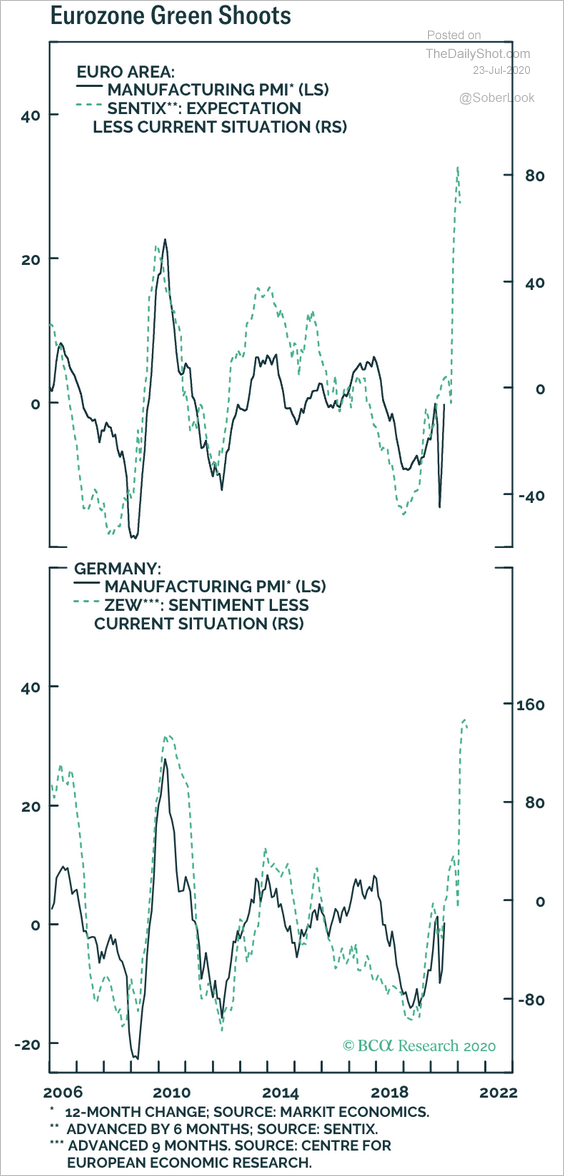
5. Recent improvements in German business expectations point to a significant recovery in manufacturing PMIs.
 Source: BCA Research
Scotiabank expects July PMIs to signal an expansion (PMI above 50).
 Source: Scotiabank Economics
Europe
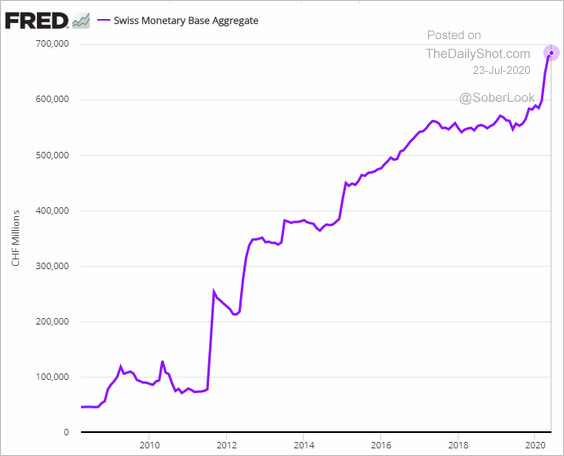
1. The Swiss monetary base is approaching CHF 700 bn. It’s now bigger than the annualized GDP of Switzerland (based on Q1 2020).
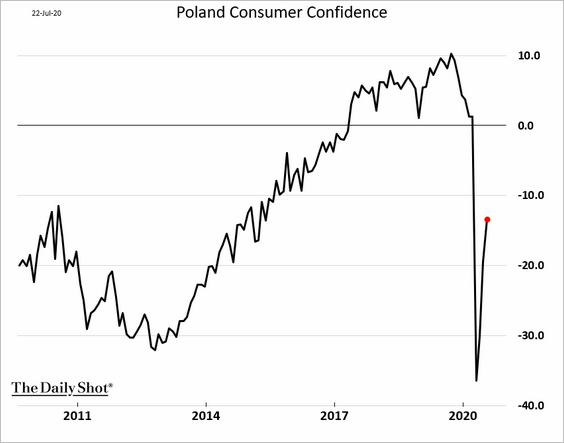
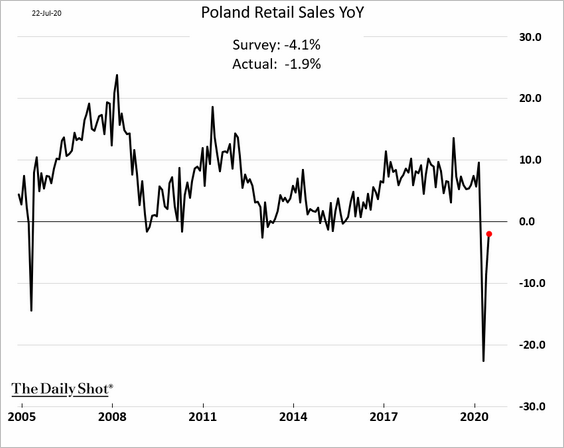
2. Poland’s economy is rebounding.
• Consumer confidence:
• Retail sales (June):
——————–
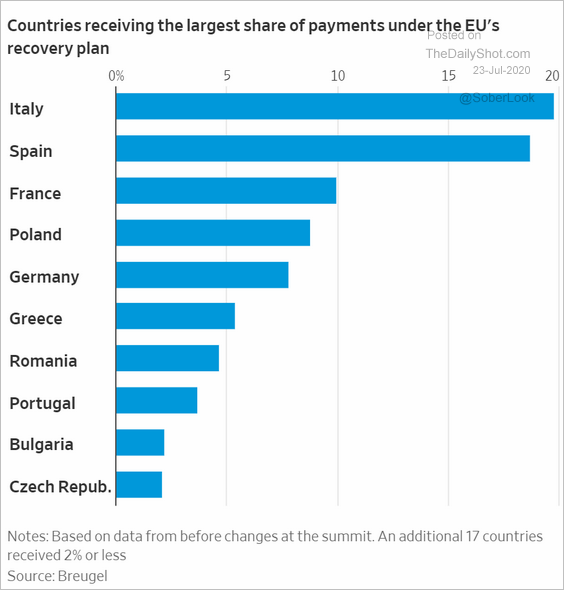
3. Which countries benefit the most from the EU stimulus plan?
 Source: @WSJ Read full article
4. Here are the GDP growth forecasts for the largest EU economies.
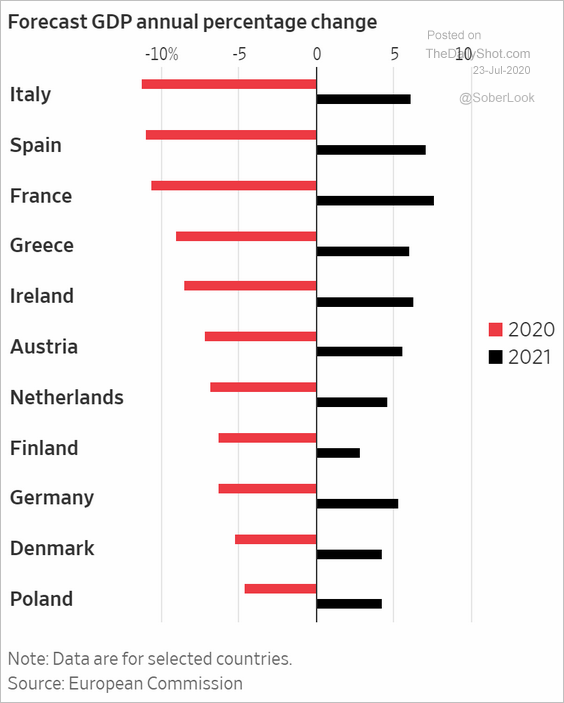 Source: @WSJ Read full article
5. Finally, we have the debt-to-GDP ratios by country.
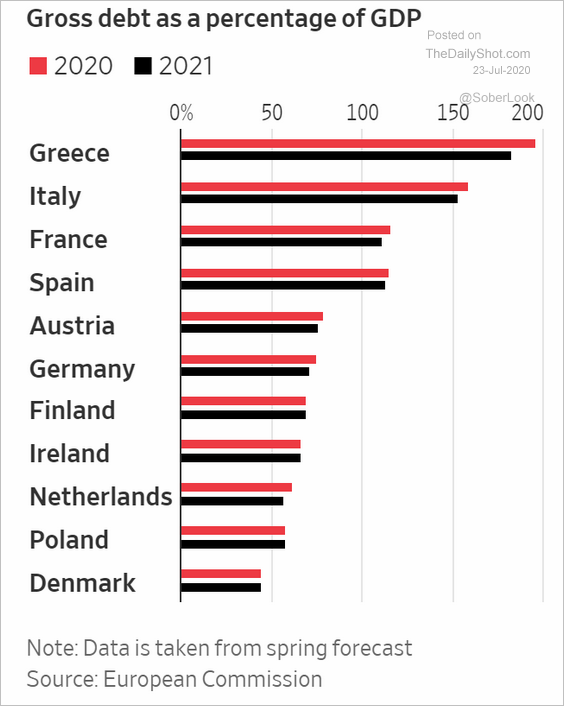 Source: @WSJ Read full article
Asia – Pacific
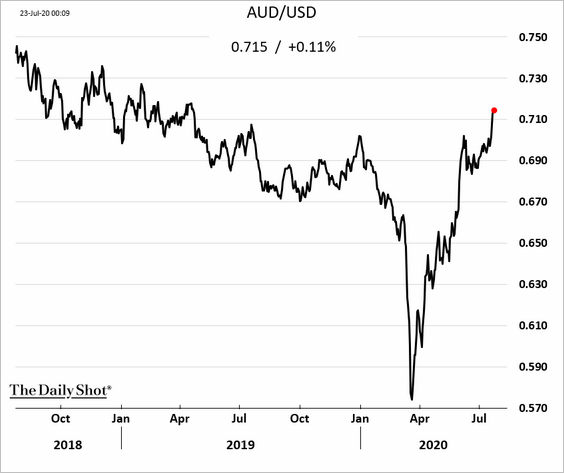
1. The Aussie dollar rebound has been impressive.
2. South Korea is officially in a recession as the Q2 GDP surprises to the downside (2 charts).
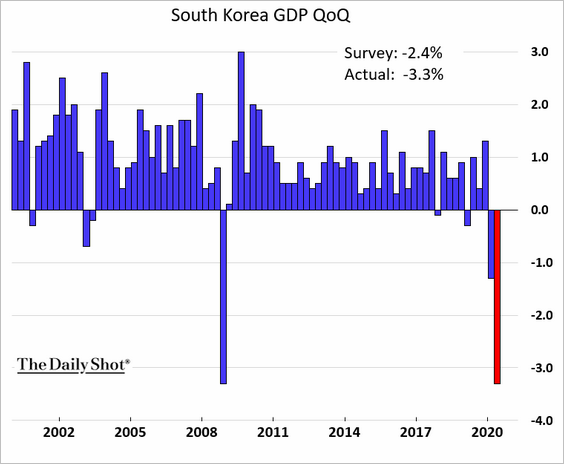
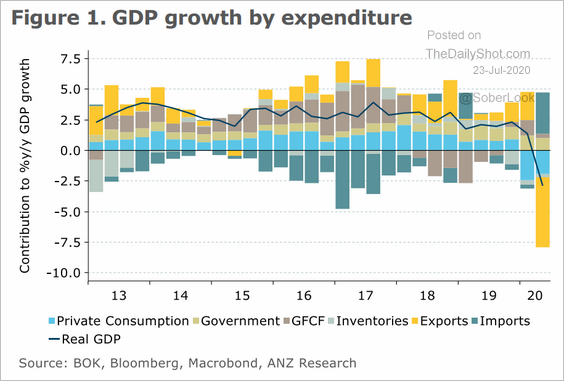 Source: ANZ Research
But economists expect a rebound this quarter.
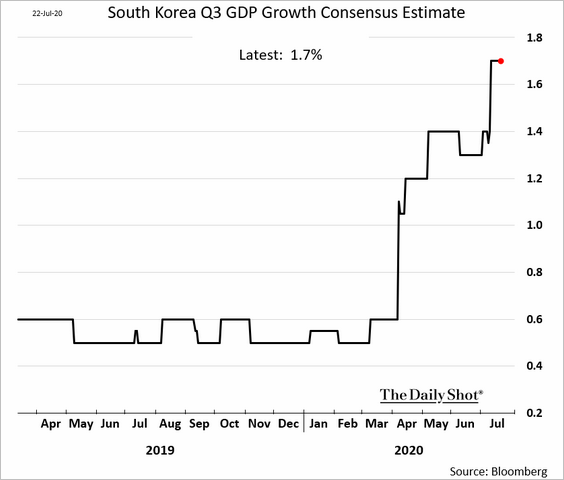 (Based on Bloomberg’s survey)
——————–
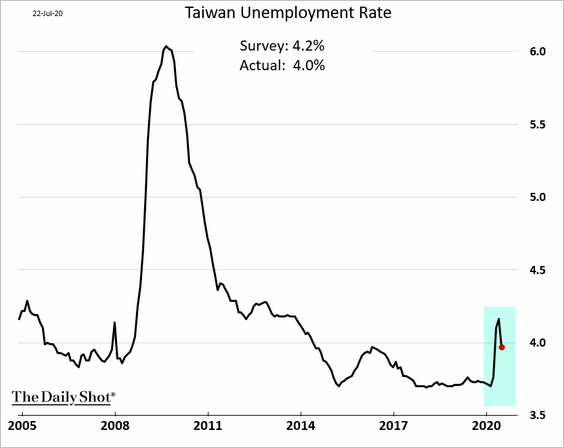
3. Taiwan’s unemployment rate unexpectedly declined.
China
1. China is investing heavily in housing renovation projects.
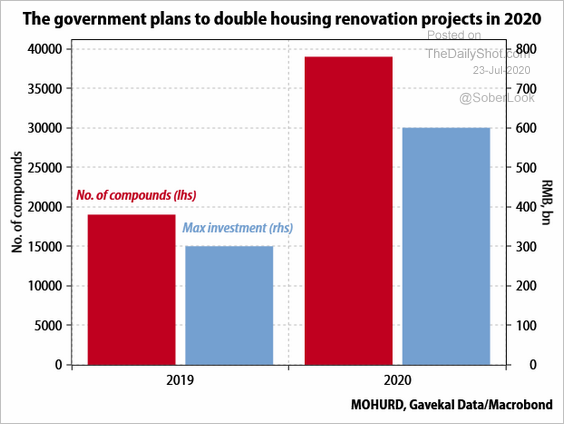 Source: Gavekal
2. Beijing plans to unify its fragmented bond market.
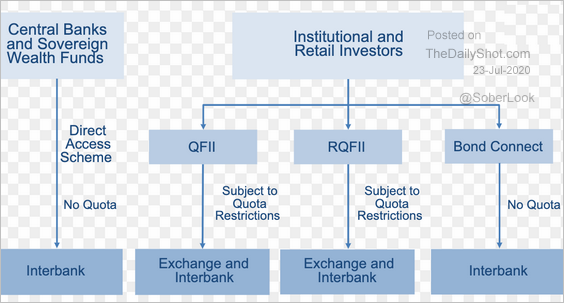 Source: @adam_tooze, Caixin Global Read full article
3. Rental property yields have been depressed in recent years.
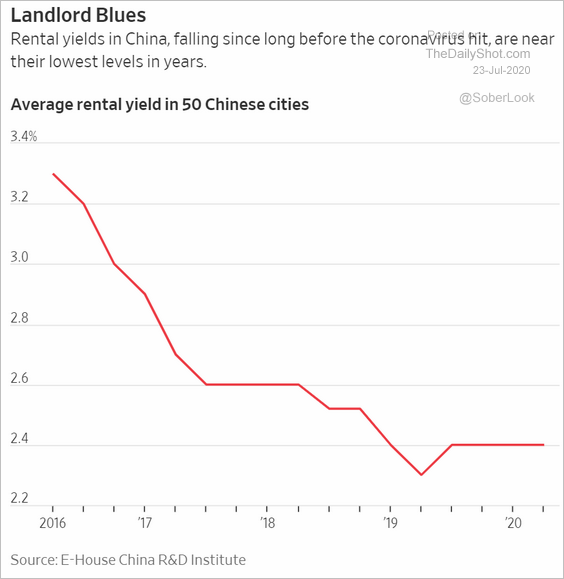 Source: @WSJ Read full article
4. There is a significant variation in regional economic growth.
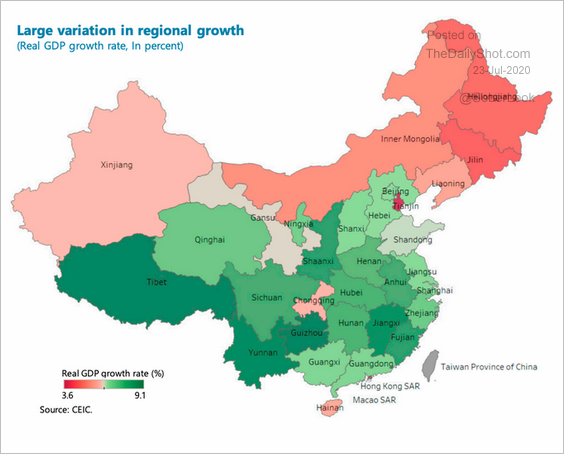 Source: @adam_tooze, IMF Read full article
5. Hong Kong’s coronavirus cases are on the rise.
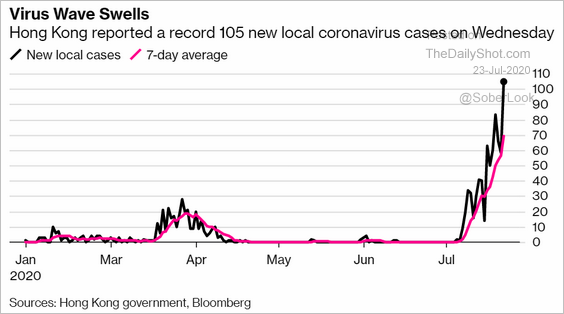 Source: @business Read full article
Emerging Markets
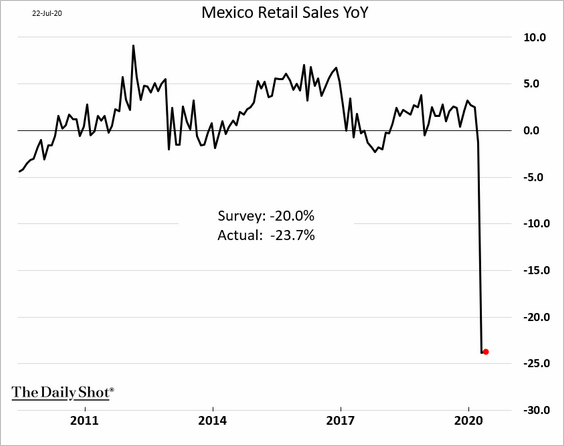
1. Mexico’s retail sales showed no improvement in May.
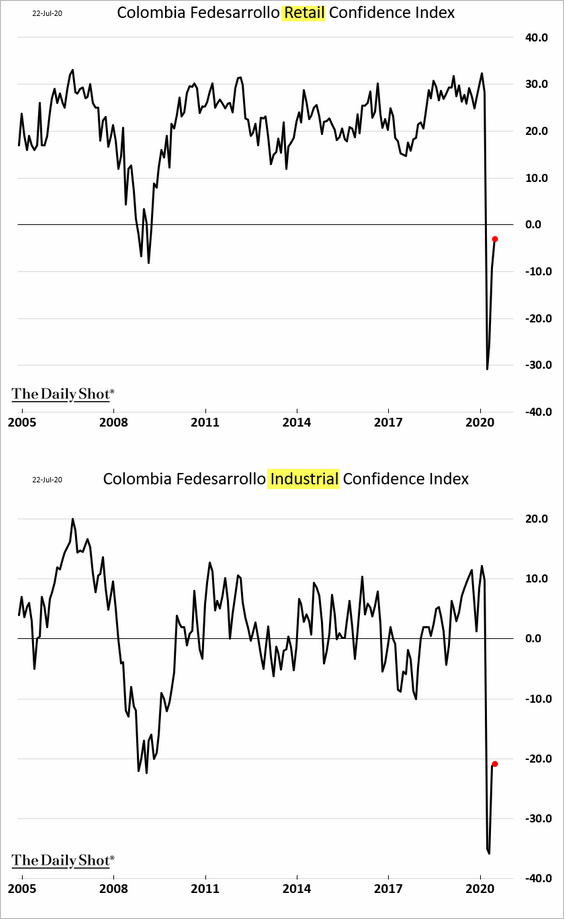
2. Colombia’s sentiment indicators are still extremely weak.
3. This chart shows the number of countries with inflation running below, within, and above central banks’ targets.
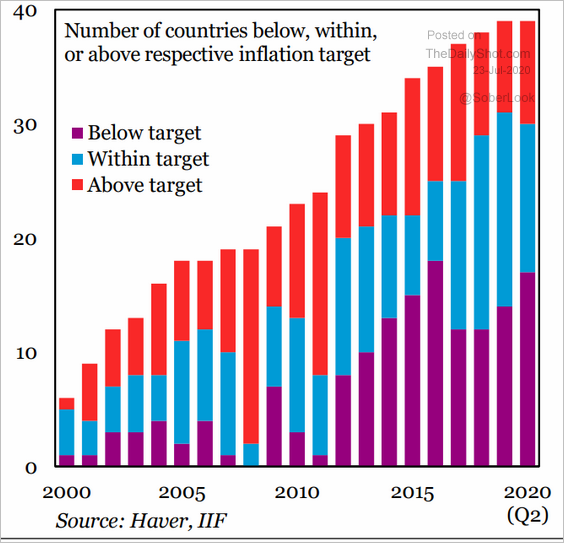 Source: IIF
Cryptocurrency
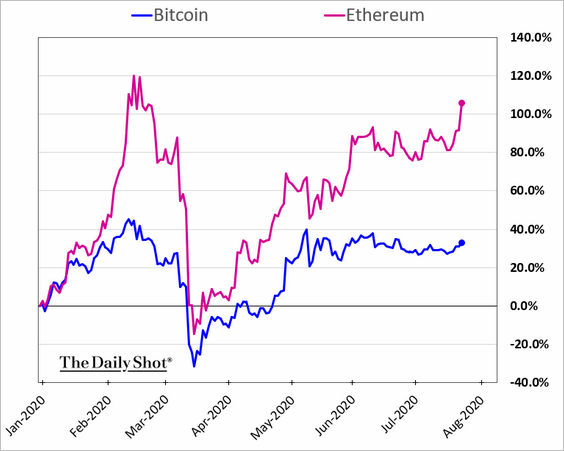
1. Ethereum has been outperforming Bitcoin this year.
2. Next, we have the demographics of consumers interested in gold and cryptocurrency.
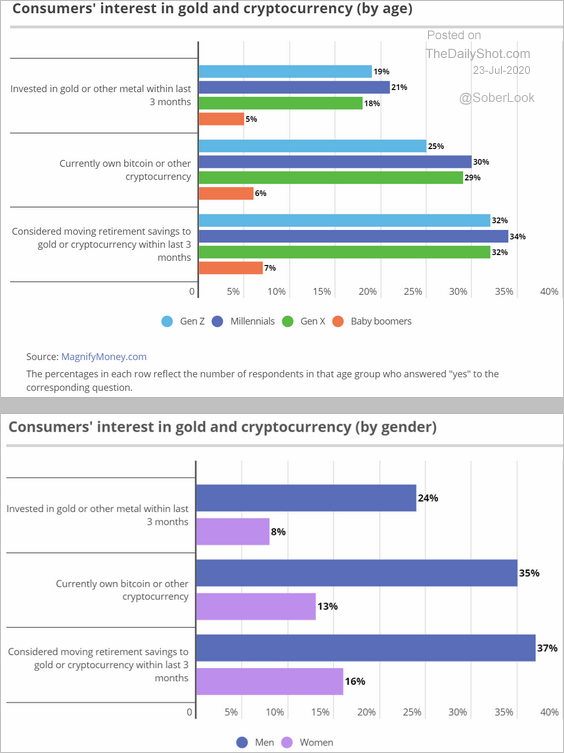 Source: MagnifyMoney.com Read full article
3. What percentage of consumers have purchased cryptocurrency?
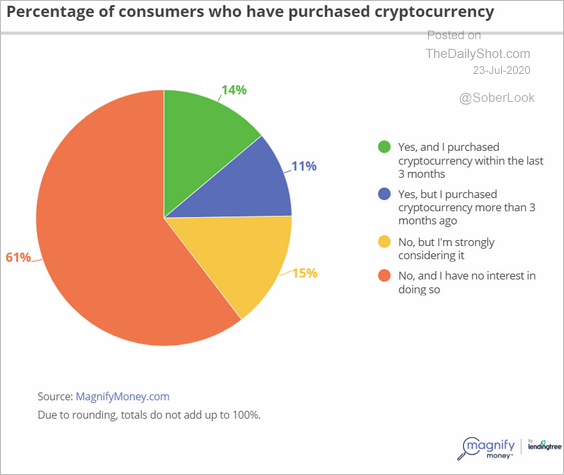 Source: MagnifyMoney.com Read full article
Commodities
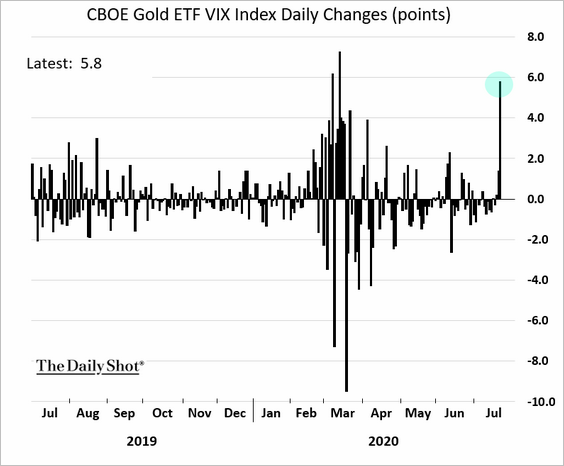
1. On Wednesday, gold implied volatility increased by most since March.
2. The largest silver mining ETF continues to get inflows.
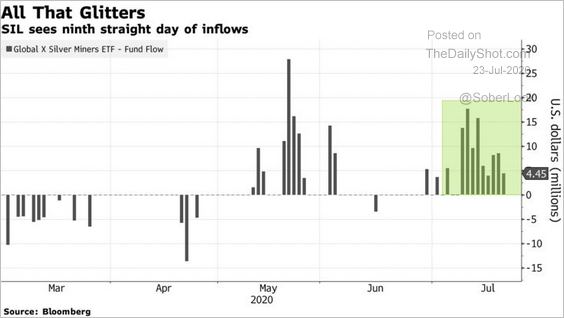 Source: @markets Read full article
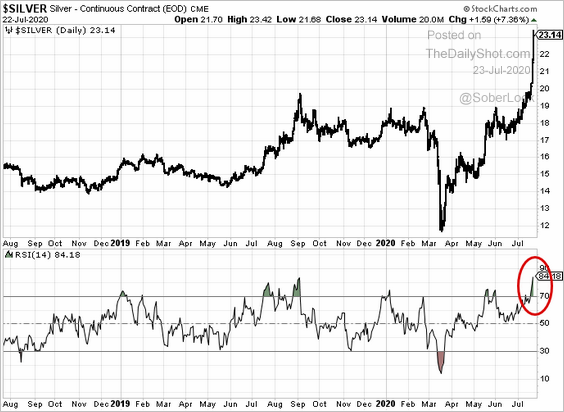
The massive rally in silver appears to be stretched.
• The RSI:
• Silver risk reversal (shows a spike in demand for call options):
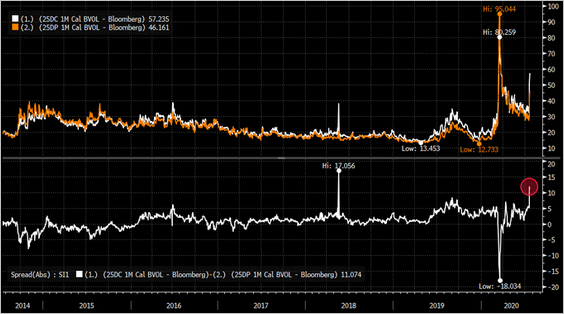 Source: @iv_technicals
——————–
3. The next chart shows the inflation-adjusted prices of oil, gold, and silver, going back to 1860.
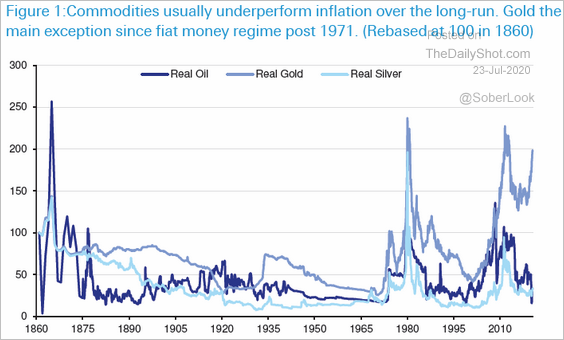 Source: Deutsche Bank Research
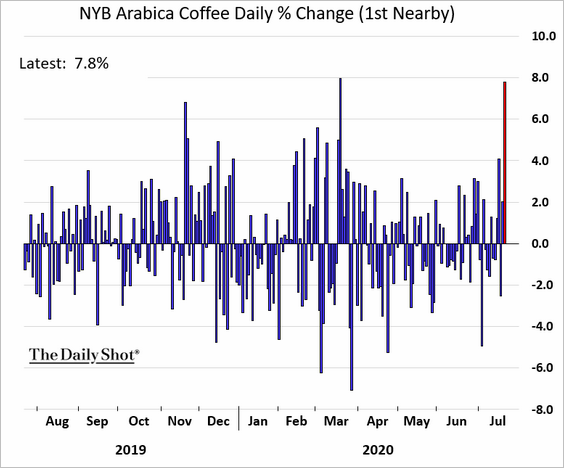
4. Coffee prices rose by most since March due to colder weather hitting southern Brazil.
 Source:
Energy
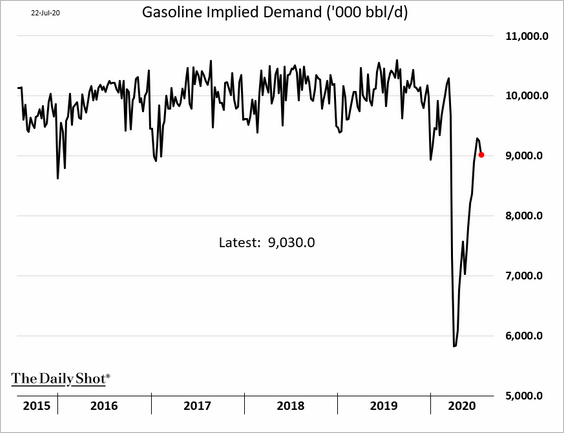
1. The rebound in US gasoline demand is fading.
2. Refinery inputs remain well under the low end of the 10-year range.
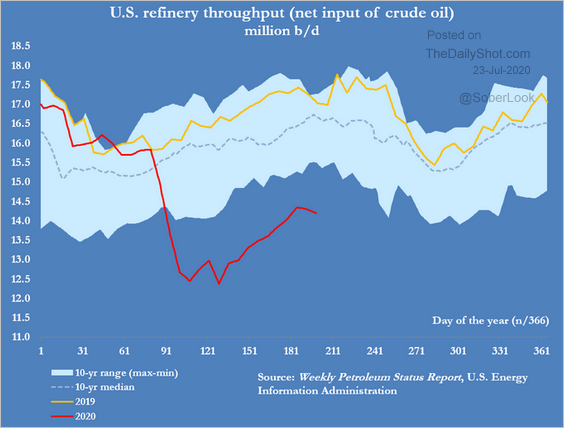 Source: @JKempEnergy
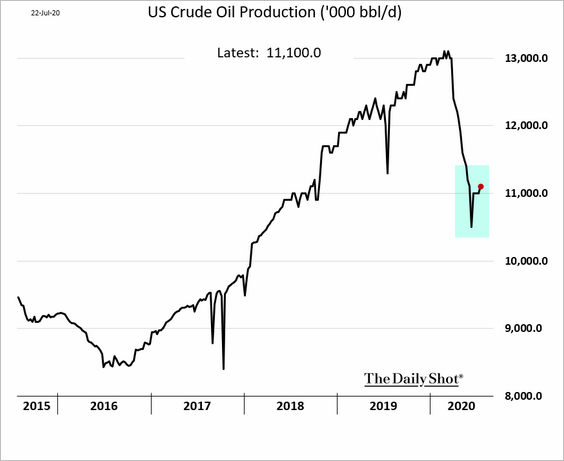
3. US oil production appears to have bottomed.
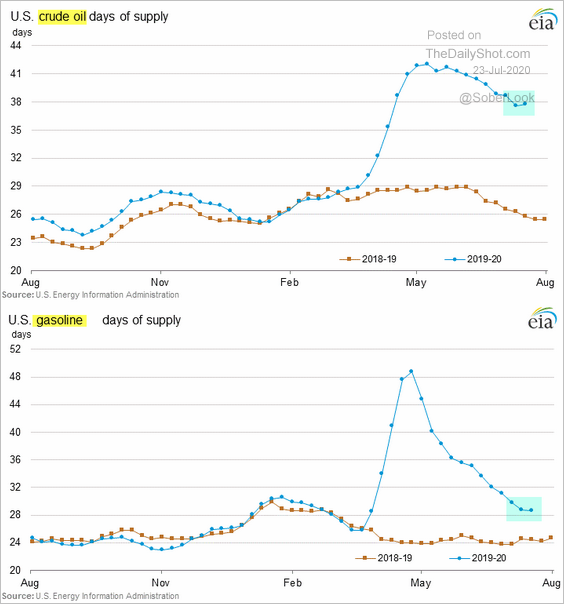
4. US crude oil and gasoline inventory declines paused last week.
5. With crude oil prices still well below fiscal breakevens, Middle-East oil exporters’ government budgets remain under pressure.
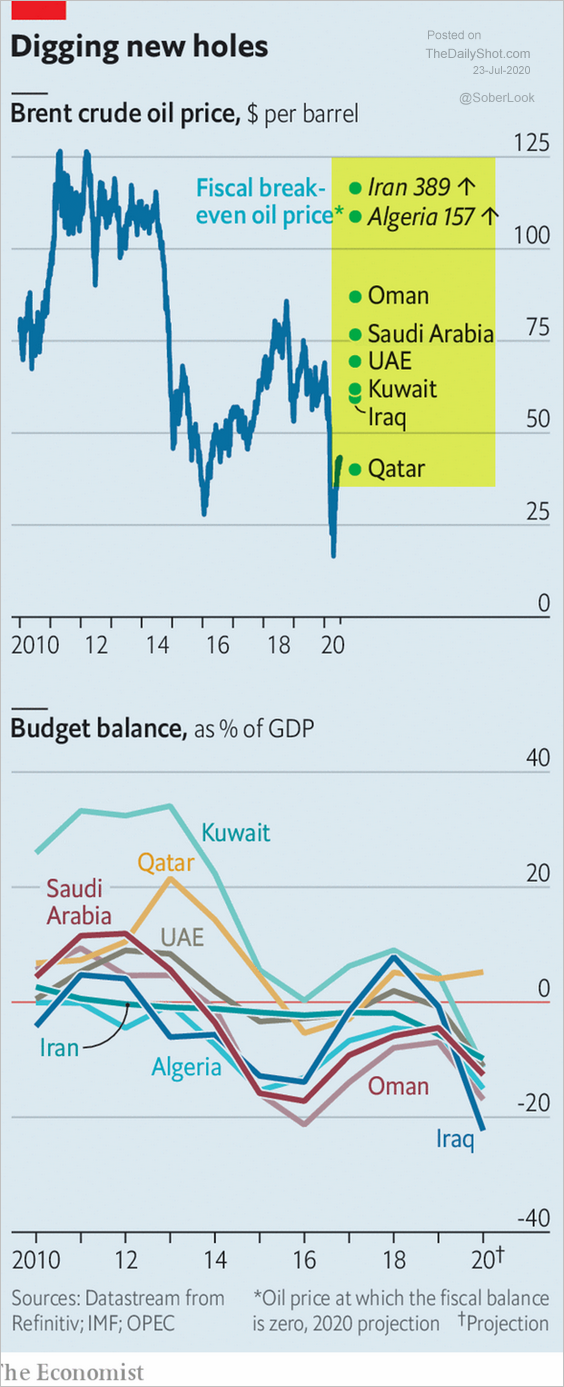 Source: @adam_tooze, The Economist Read full article
6. Shares of alternative energy firms have outperformed significantly over the past 12 months.
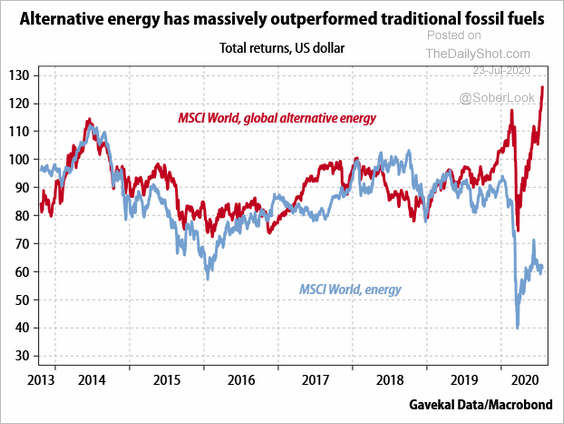 Source: Gavekal
Equities
1. Since March, investors have been rewarding companies that focus on total return (dividends and share buybacks) rather than CapEx and R&D.
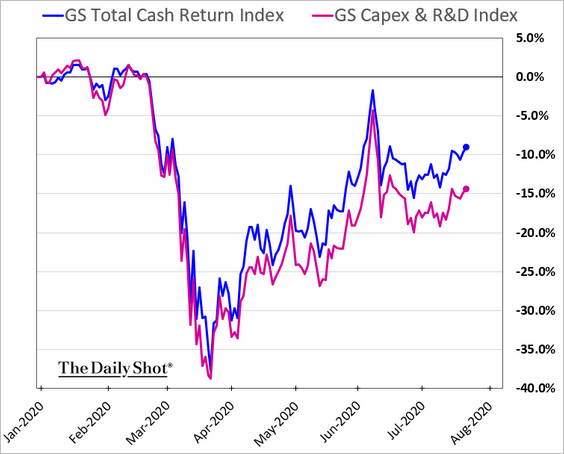 Source: Goldman Sachs
2. The tech mega-cap outperformance has been impressive.
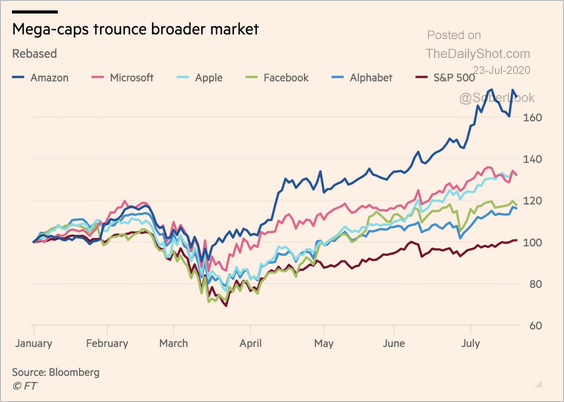 Source: @financialtimes Read full article
The above trend shows up in the underperformance of the Nasdaq 100 equal-weight index.
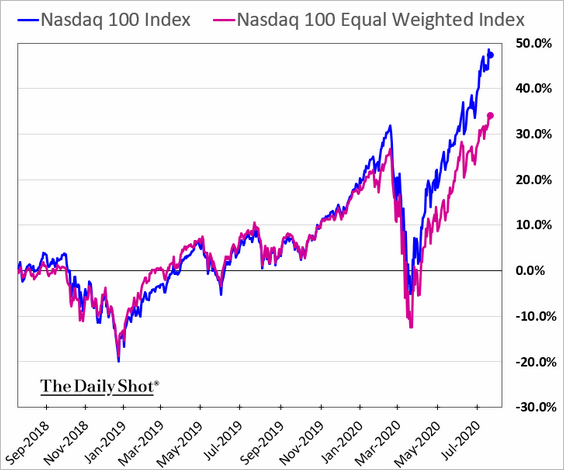 h/t @LizAnnSonders
——————–
3. Here is Tesla’s market cap vs. the US, Europe, and Japan automotive sectors’ market value.
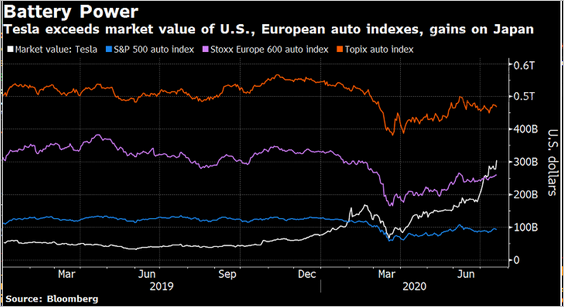 Source: @lisaabramowicz1, @TheOneDave, @theterminal
4. The S&P 500/US dollar inverse correlation remains intact.
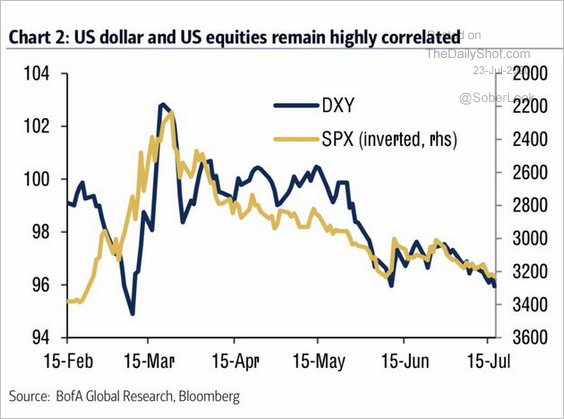 Source: BofA Merrill Lynch Global Research, @WallStJesus
5. The recent rise in market-based inflation expectations (breakeven rates) hasn’t done much to lift value stocks.
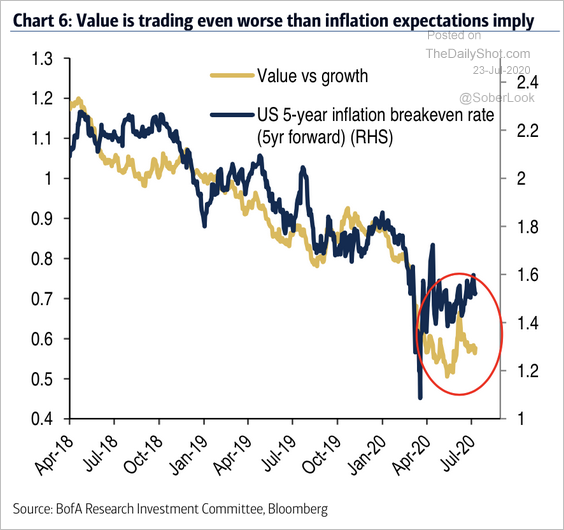 Source: BofA Merrill Lynch Global Research
6. Insiders have been selling.
 Source: @markets Read full article
7. Hedge funds cut their exposure to Nasdaq 100 futures.
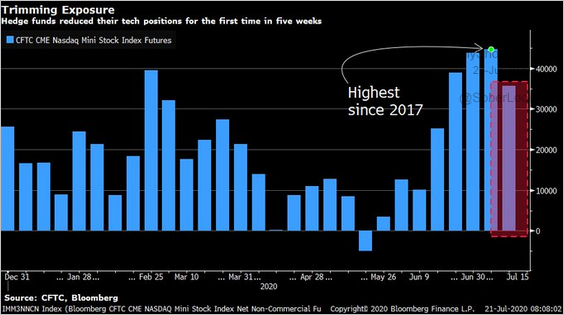 Source: @Bloomberg, @LizAnnSonders
8. How has equity beta changed this year (by sector)?
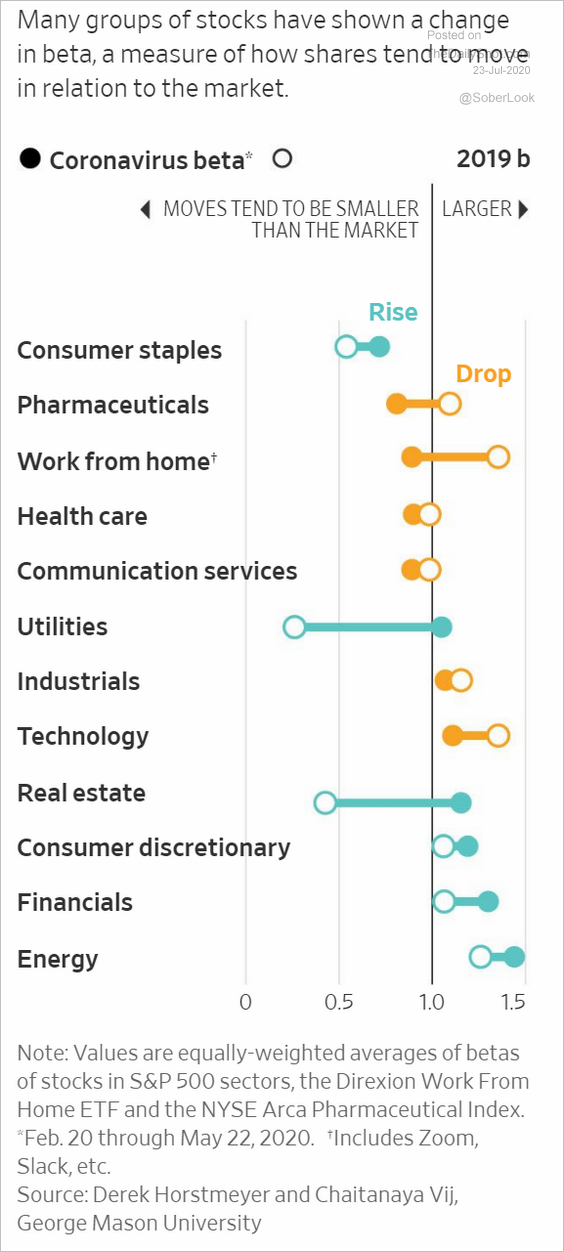 Source: @WSJ Read full article
Credit
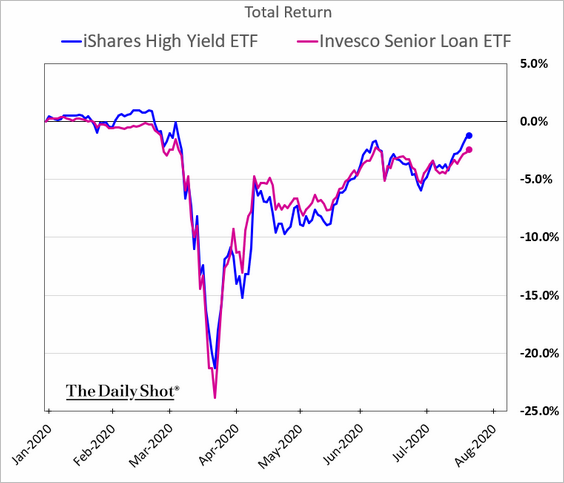
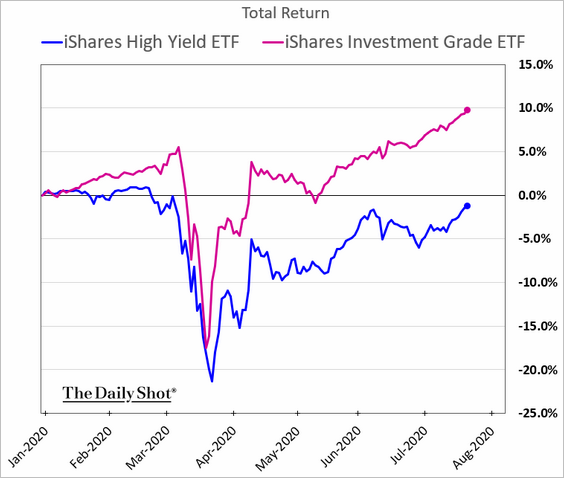
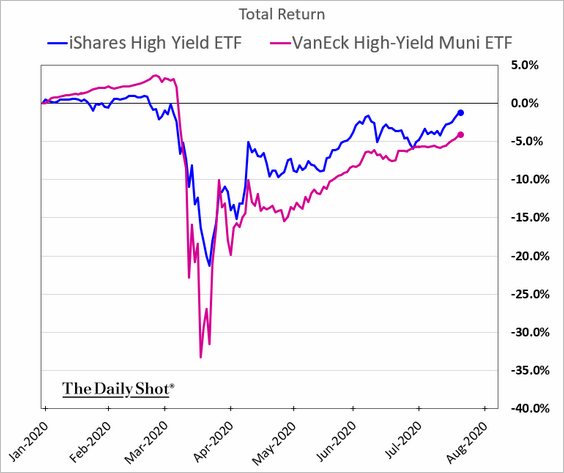
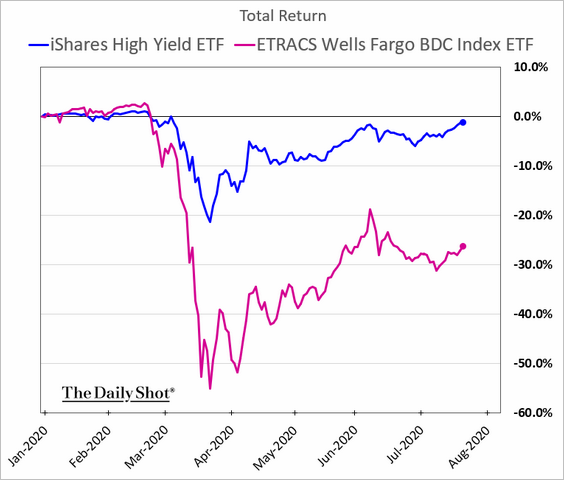
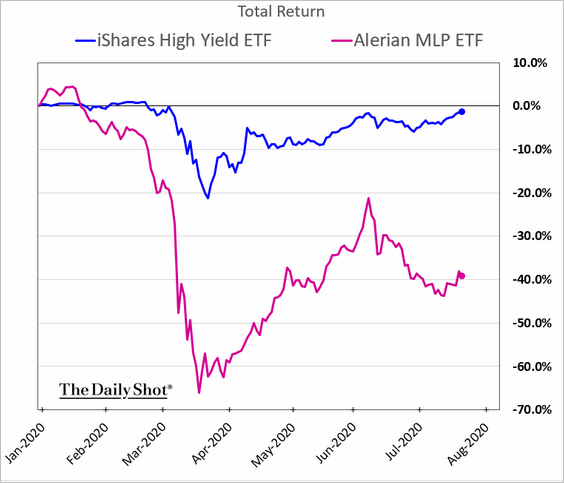
1. Let’s start with the relative performance of credit/income products year-to-date.
• Leveraged loans vs. high-yield:
• Investment-grade vs. high yield:
• High-yield munis vs. high-yield corporates:
• BDCs (lenders to small and medium-sized firms):
• MLPs (pipeline companies):
——————–
2. This chart shows the percentage of property loans that had to be modified.
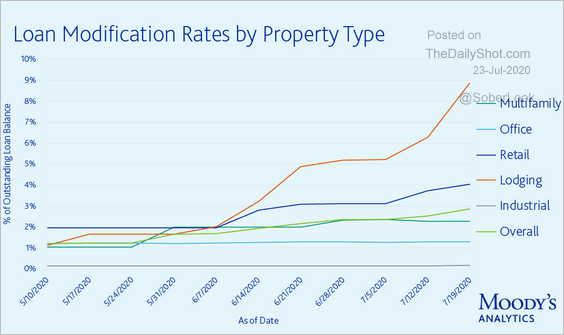 Source: Moody’s Analytics
3. State and local budget shortfalls have been massive (2 charts).
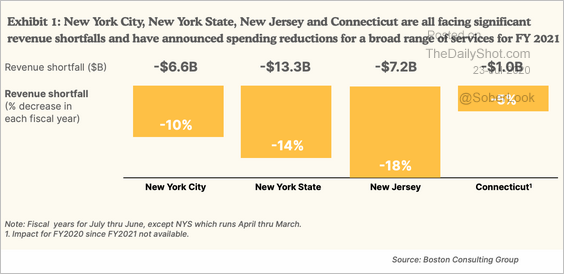 Source: @adam_tooze, Partnership for New York City Read full article
 Source: Alpine Macro
Rates
1. The 10yr Treasury yield is at support.
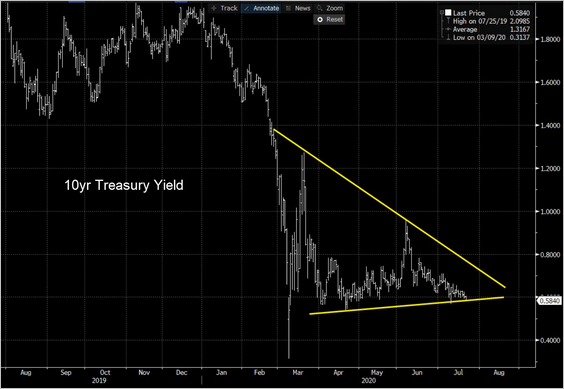 Source: @Not_Jim_Cramer, @TheTerminal
2. The highest real rates are now found in defensive currencies.
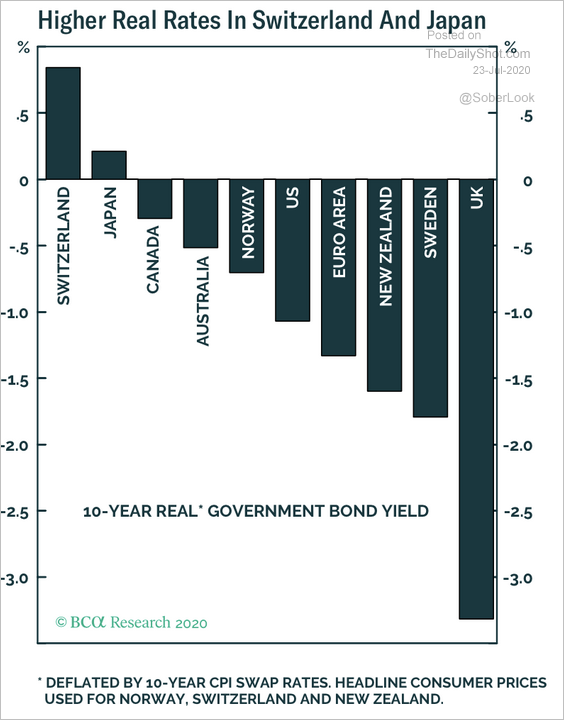 Source: BCA Research
Global Developments
1. Gold has diverged from the yen (both usually trade as risk-off assets). One explanation for this gap is investors’ concerns about inflation.
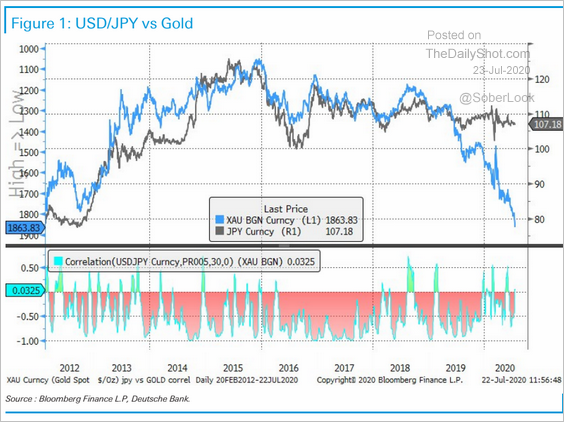 Source: Deutsche Bank Research
2. Global bond-stock correlations remain subdued.
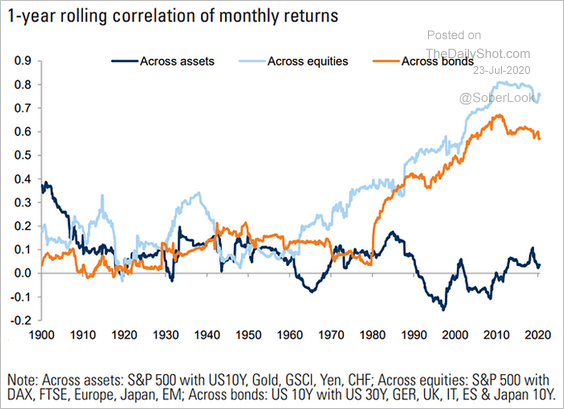 Source: @ISABELNET_SA, @GoldmanSachs
3. Driving has made a strong comeback across advanced economies.
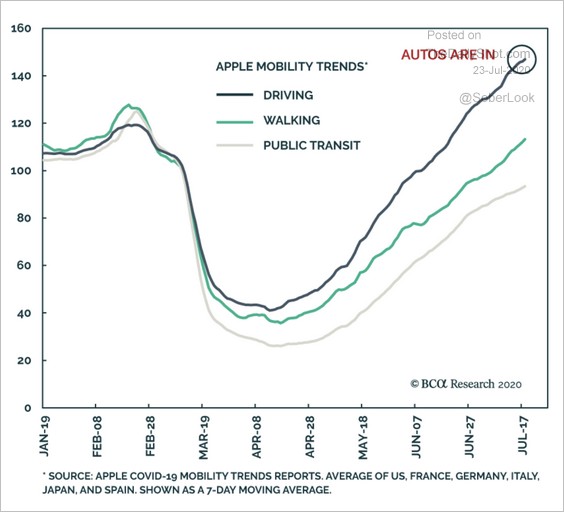 Source: BCA Research
——————–
Food for Thought
1. Planned vs. actual usage of US stimulus checks:
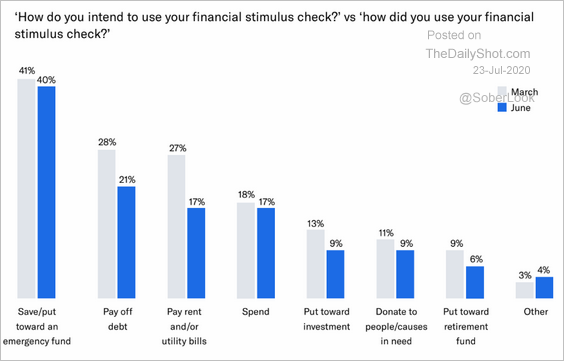 Source: Betterment Read full article
2. Average US car loan size:
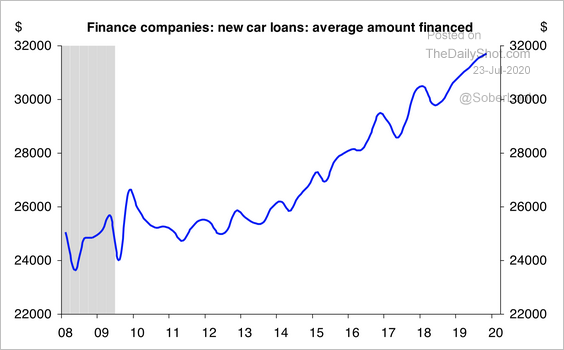 Source: Deutsche Bank Research
3. Restaurant closures:
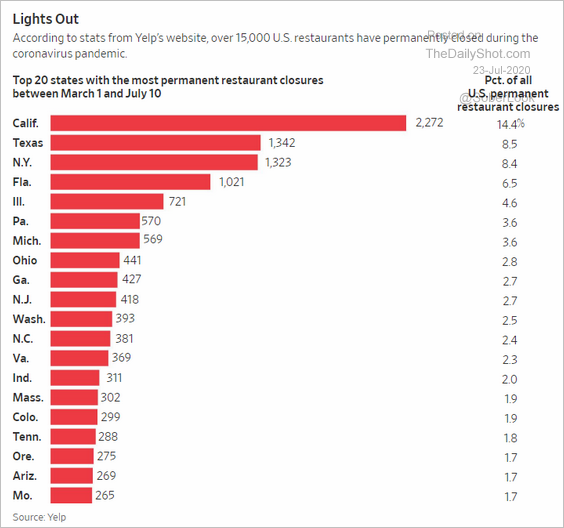 Source: @WSJ Read full article
4. Federal aid for small business (PPP) per capita:
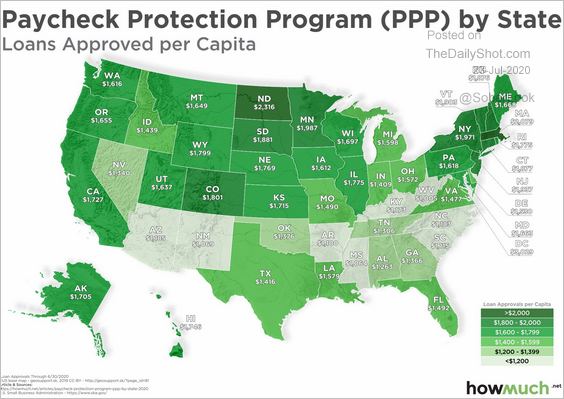 Source: @howmuch_net Read full article
5. How much longer?
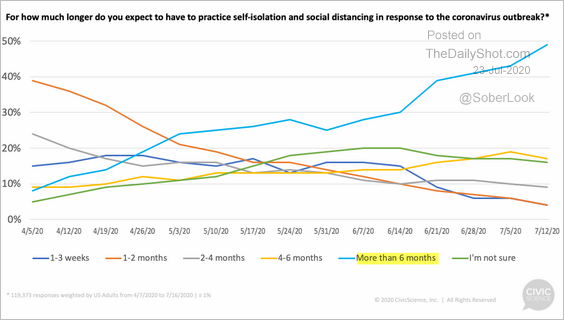 Source: @CivicScience Read full article
6. Changes in the number of uninsured:
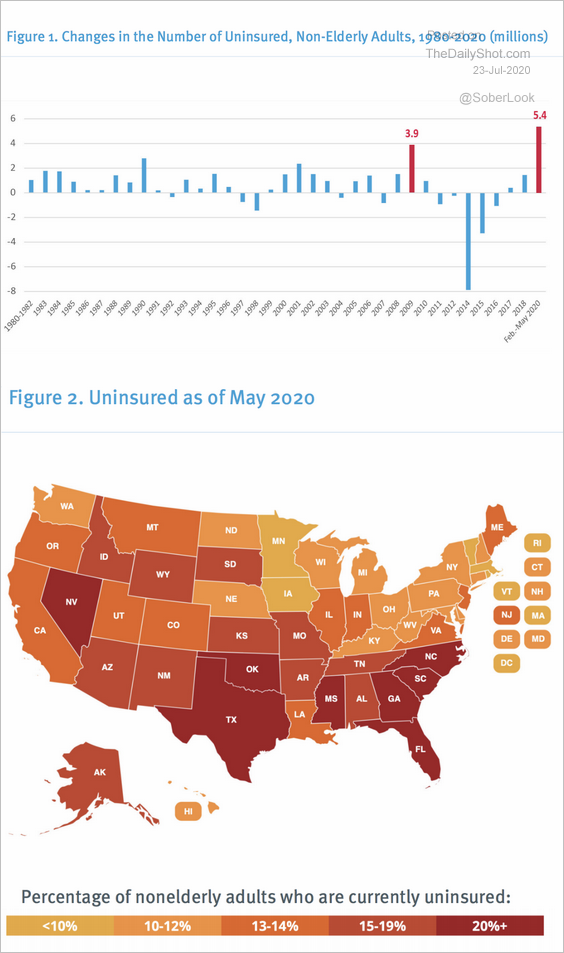 Source: FamiliesUSA Read full article
7. Absentee ballots (days before the election):
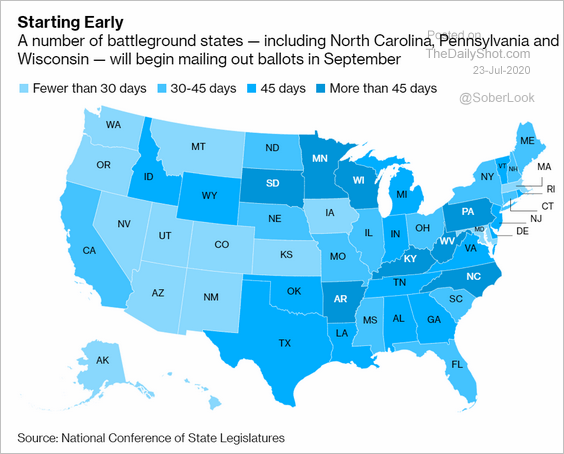 Source: @bpolitics Read full article
8. Support for actions companies took in response to the recent protests:
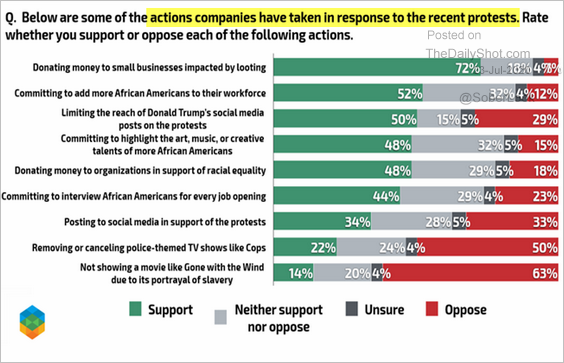 Source: Echelon Insights
9. The proliferation of emojis:
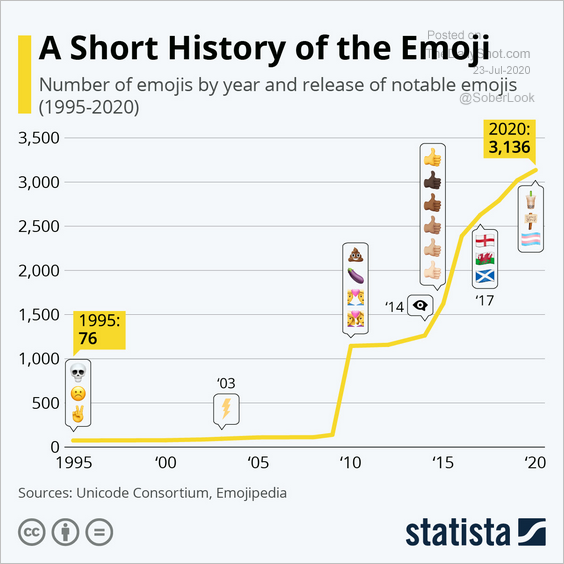 Source: Statista
——————–