
The Daily Shot: 29-Jul-20
• The United States
• Canada
• The United Kingdom
• Europe
• Asia – Pacific
• China
• Emerging Markets
• Commodities
• Energy
• Equities
• Alternatives
• Credit
• Rates
• Food for Thought
The United States
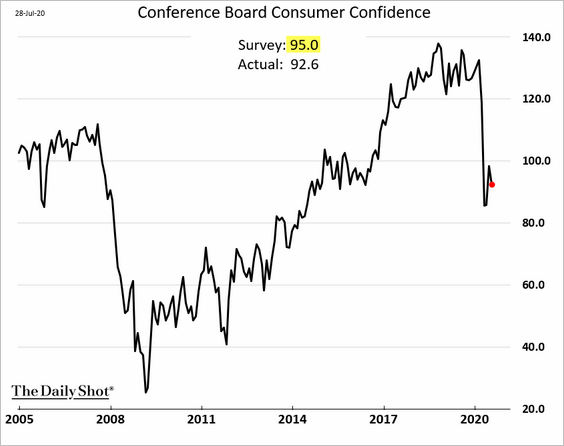
1. Consumer confidence weakened in July, with the Conference Board’s index surprising to the downside.
 Source: MarketWatch Read full article
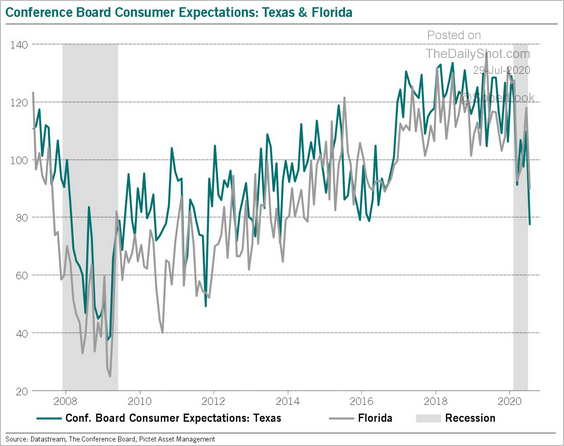
Expectations deteriorated in Texas and Florida.
 Source: @BittelJulien
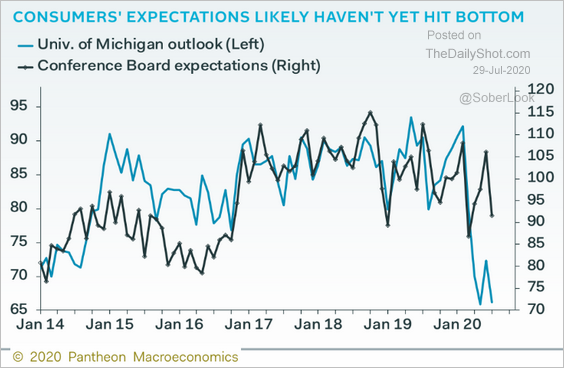
And the Conference Board’s expectations indicator at the national level may decline further.
 Source: Pantheon Macroeconomics
——————–
The labor differential index (‘jobs plentiful’ – ‘jobs hard to get’) continues to recover.

——————–
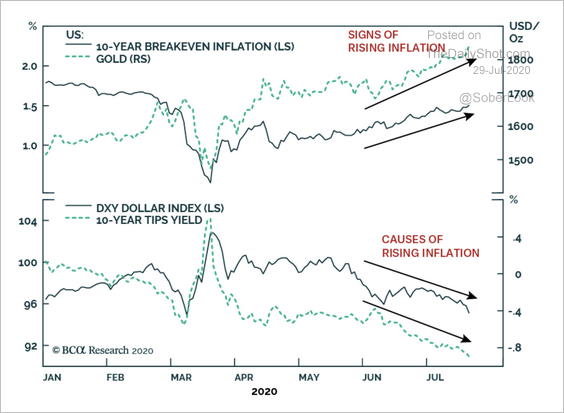
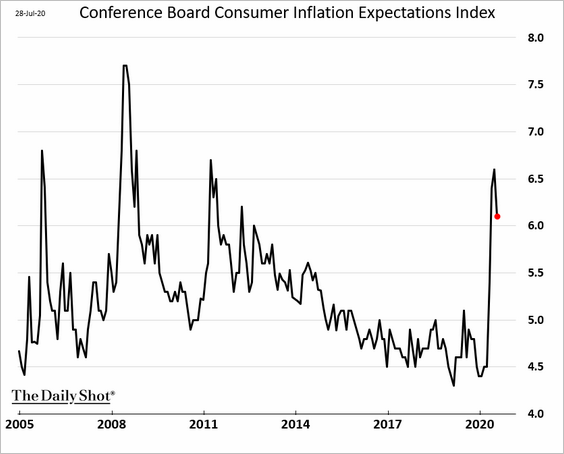
2. The market has been pricing in higher inflation in the coming years, supported by a weaker dollar.
 Source: BCA Research
And consumer inflation expectations remain elevated.
——————–
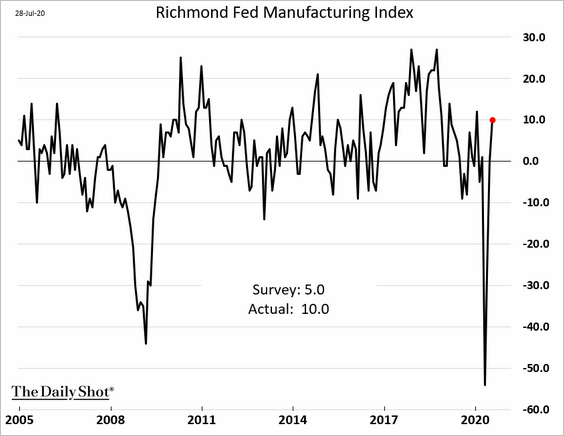
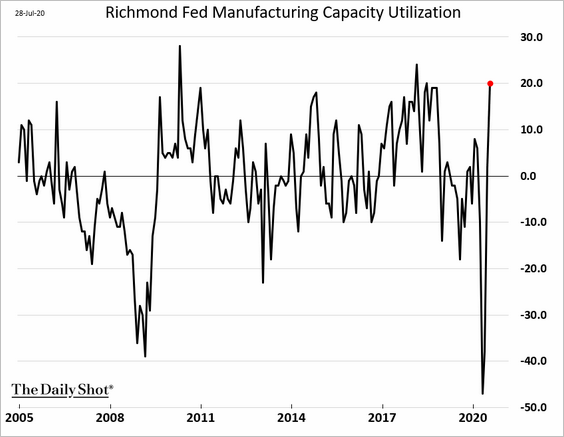
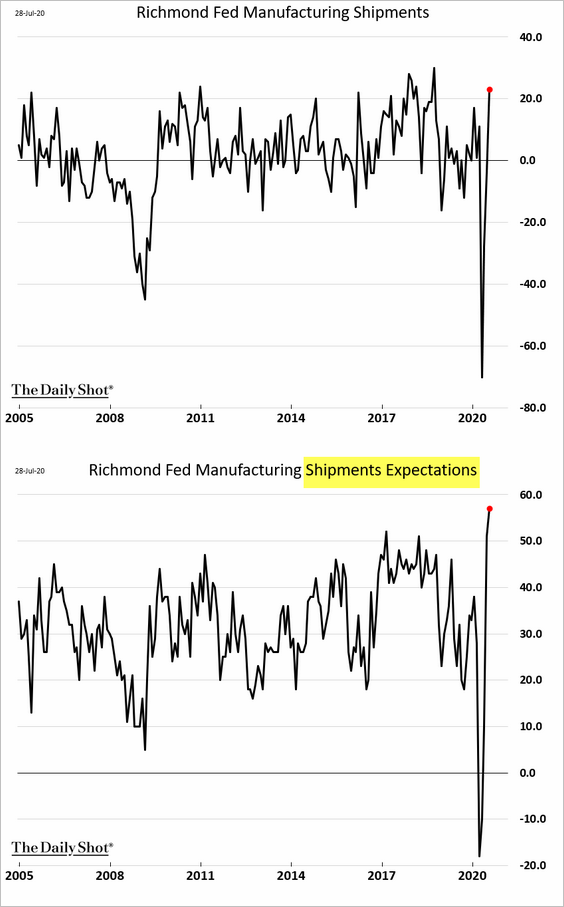
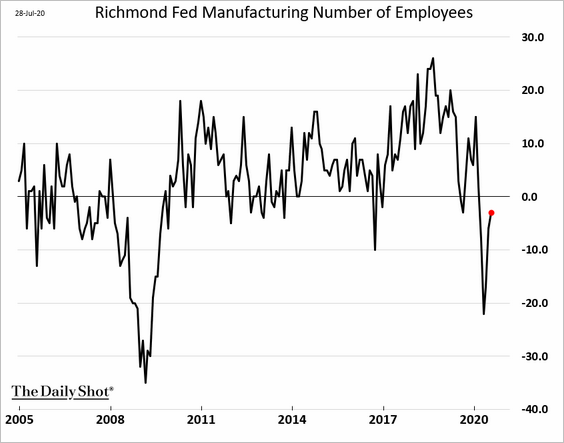
3. The Richmond Fed’s regional factory gauge showed manufacturing activity improving further. This rebound is consistent with the recent trends in other Fed districts.
• Capacity utilization:
• Shipments (current and expected):
However, factory employment remains fragile.
——————–
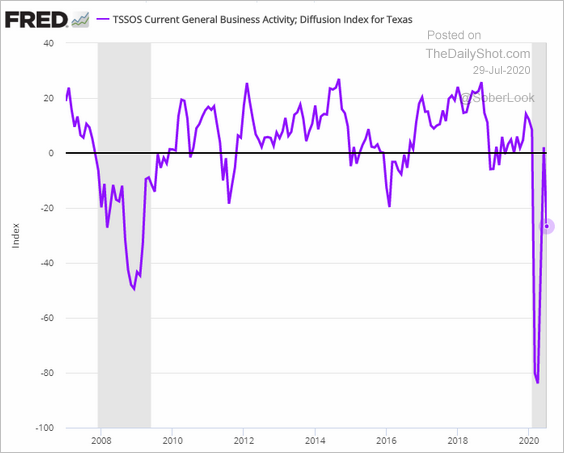
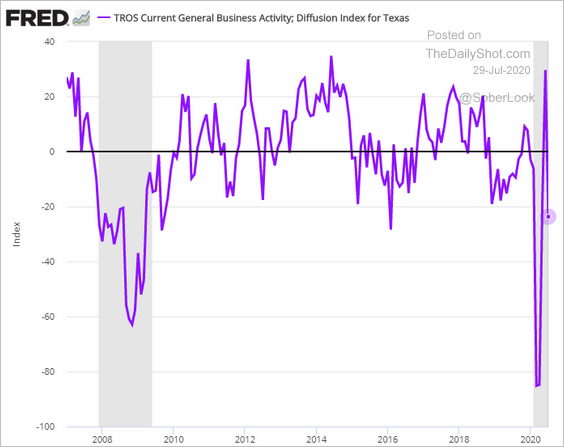
4. Texas-area service and retail-sector activity weakened this month as the pandemic situation worsened.
• Services:
• Retail:
——————–
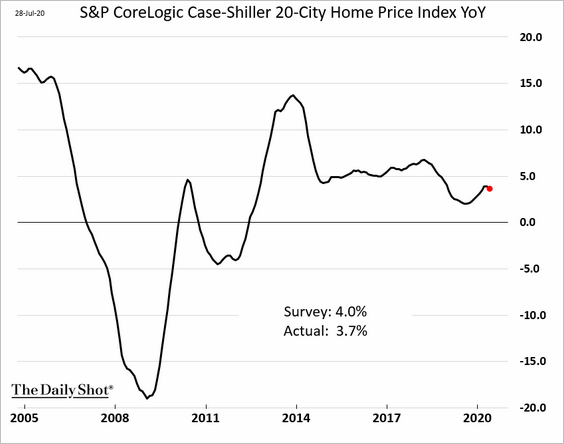
5. Next, we have some updates on housing.
• Home price appreciation unexpectedly softened in May.
• Google search activity suggests that the housing rebound may be slowing.
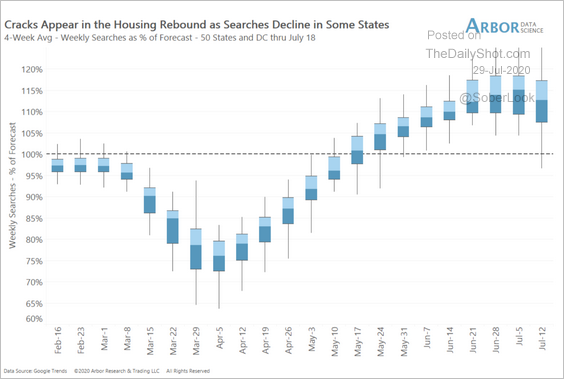 Source: Arbor Research & Trading
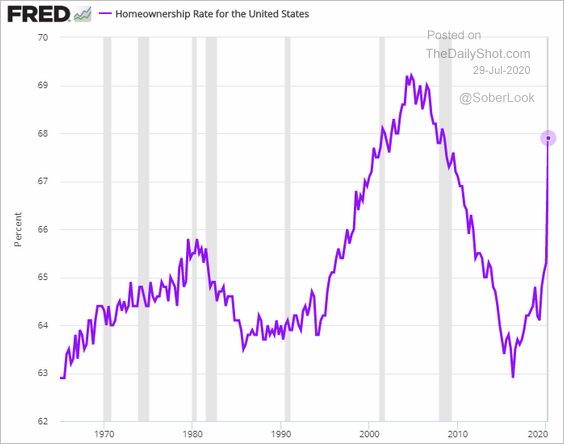
• US homeownership rate climbed in Q2 as record-low mortgage rates improved affordability. However, there was a change in the Census Bureau’s data collection methodology, which may explain some (but not all) of the gains.
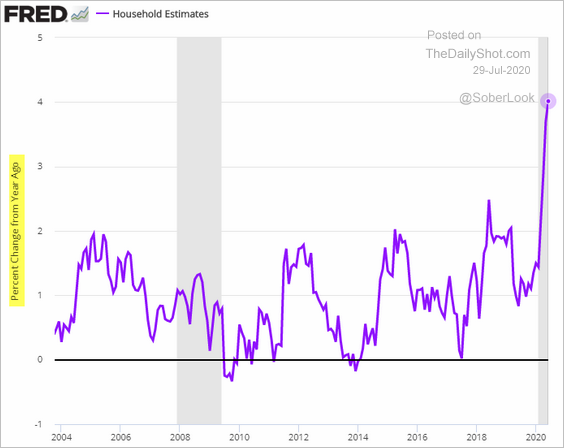
Higher homeownership rates translated into faster household formation (again, the data is a bit suspect).
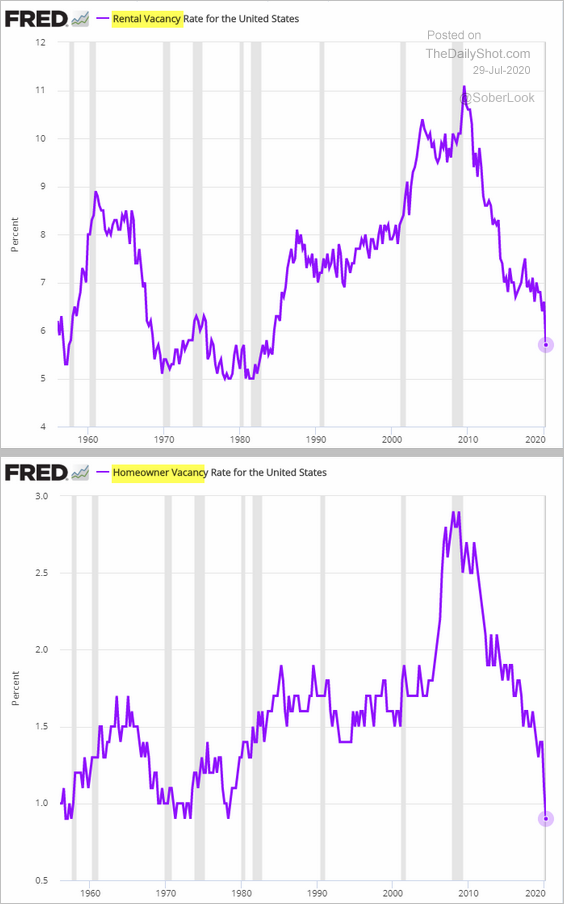
• The US rental vacancy rate dipped to the lowest level since the 1980s.
 Source:
However, many renter households will face evictions in the months to come.
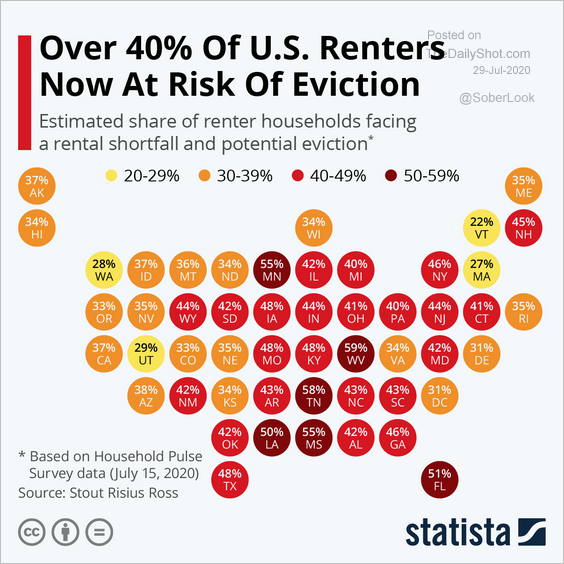 Source: Statista
——————–
6. RV shipments accelerated last month as Americans shun airports and hotels.
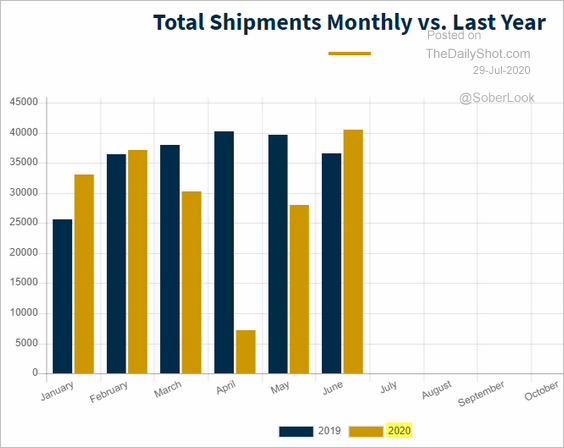 Source: RV Industry Association Further reading
7. Next, we have the New York City Recovery Index, which appears to have peaked this month. The second panel shows the latest weekly changes in the index and its components.
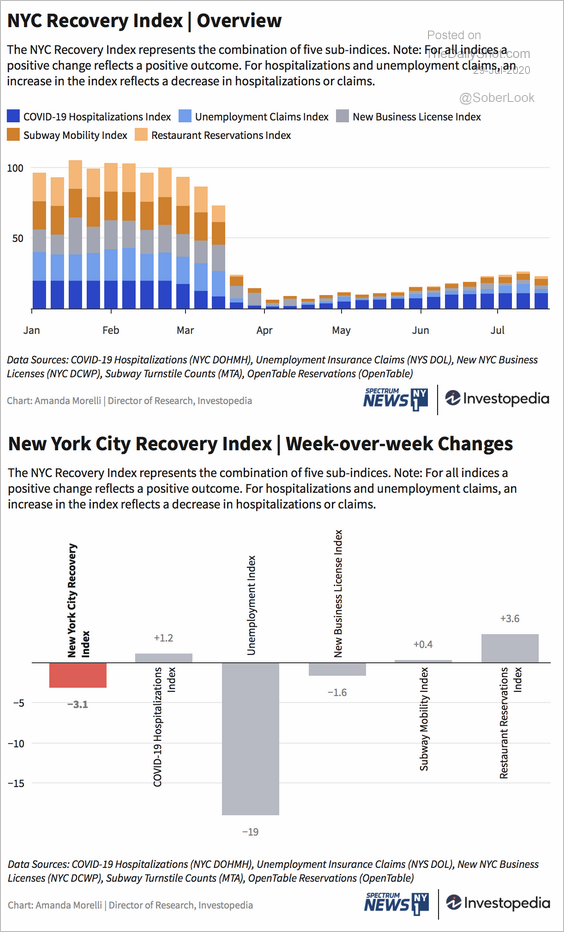 Source: Investopedia Read full article
8. Finally, here is the number of retail businesses listed as temporarily or permanently closed.
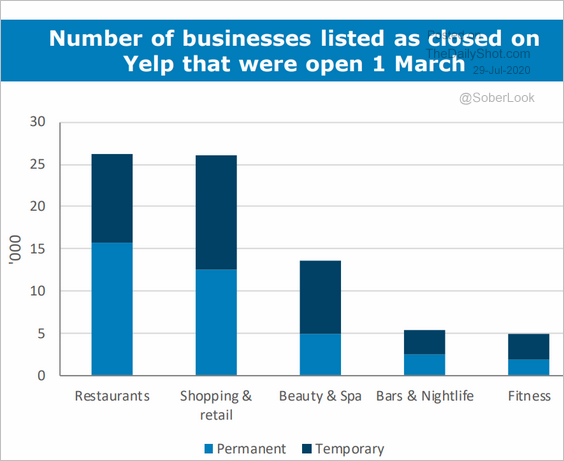 Source: ANZ Research
Canada
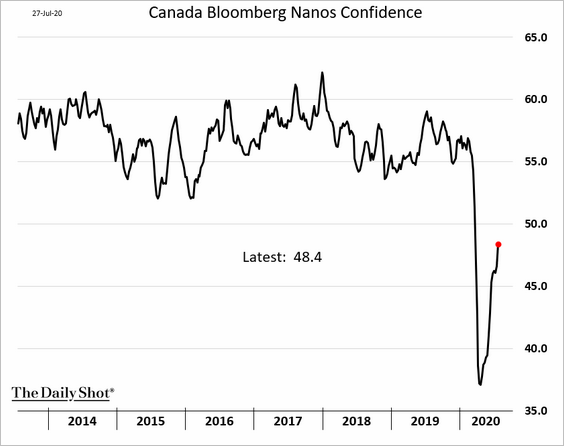
1. Consumer confidence continues to rebound.
2. Here is a forecast for Canada’s employment recovery (from Oxford Economics).
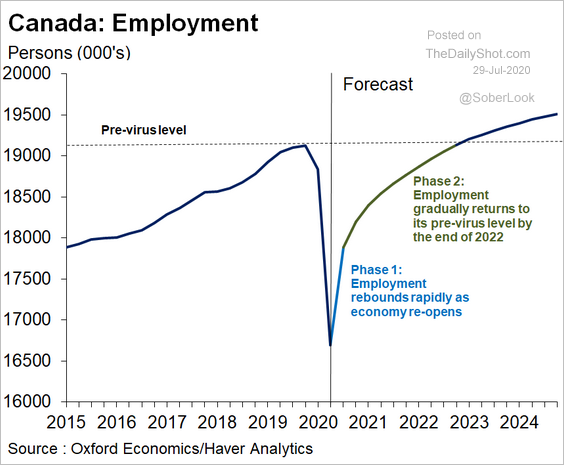 Source: Oxford Economics
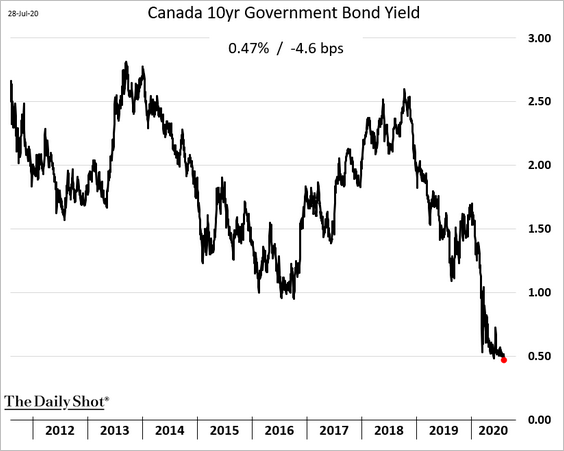
3. Canada’s 10yr government bond yield hit a new low.
The United Kingdom
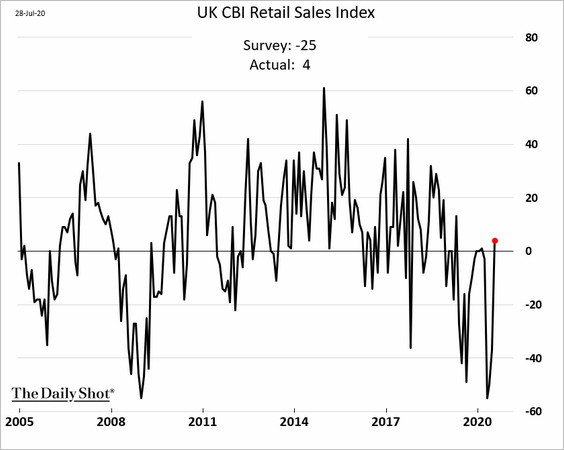
Retail sales have strengthened substantially this summer.
• The CBI index rebounded sharply in July.
 Source: Reuters Read full article
• The jump in household goods demand led the recovery in retail sales last month (2 charts).
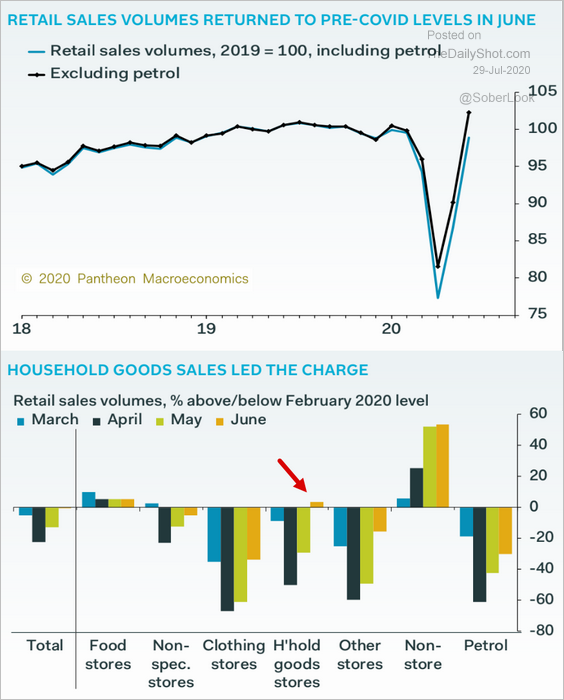 Source: Pantheon Macroeconomics
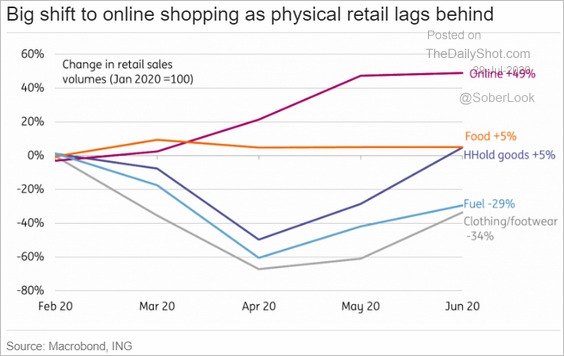 Source: ING
Europe
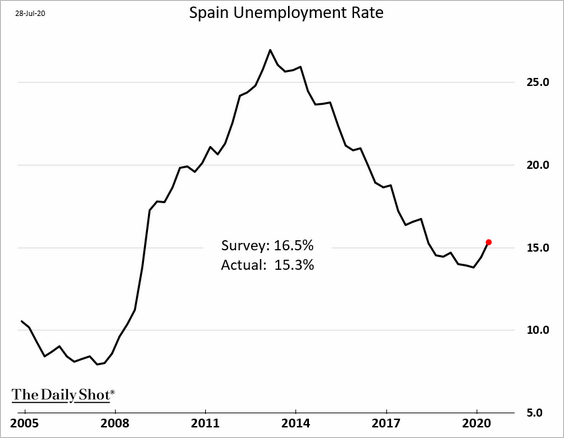
1. Elsewhere in Europe, Spain’s unemployment rate rose less than expected last quarter.
2. The ECB is pressuring banks to keep dividend payouts on hold for now.
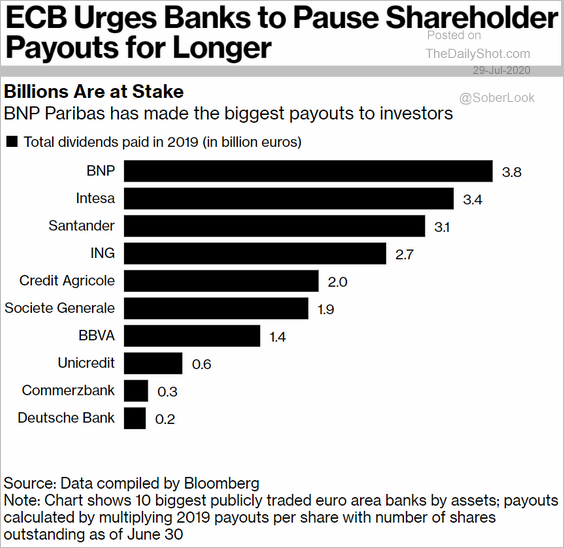 Source: @business Read full article
3. Euro net long speculative positioning continues to climb, …
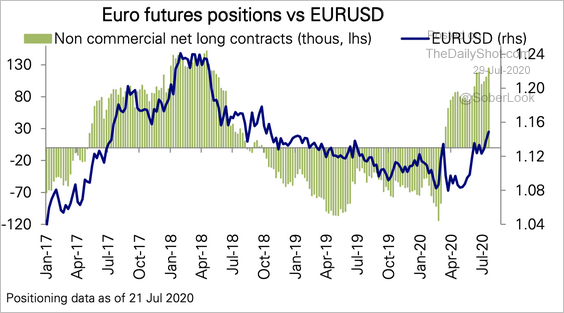 Source: Deutsche Bank Research
… led by asset managers.
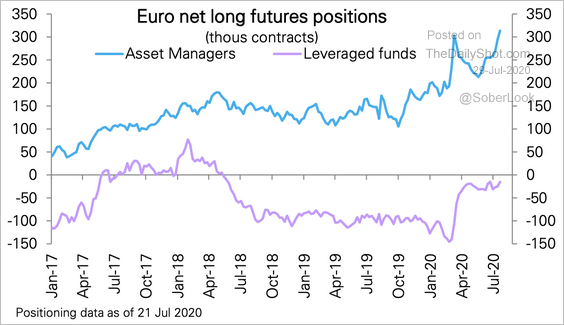 Source: Deutsche Bank Research
——————–
4. The euro area’s share of global equity mutual fund assets has been declining over the past few years.
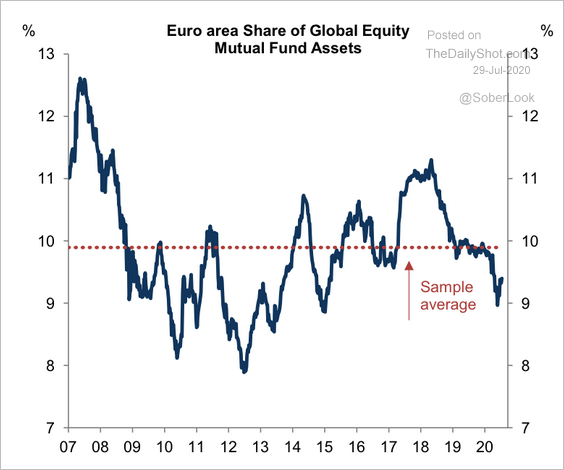 Source: Goldman Sachs
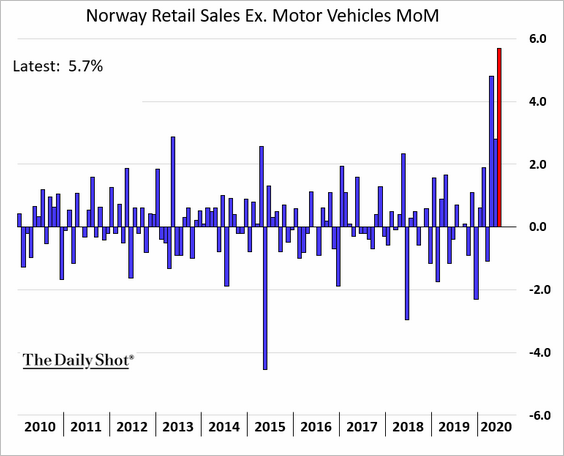
5. Norway’s retail sales rebounded sharply last month.
Asia – Pacific
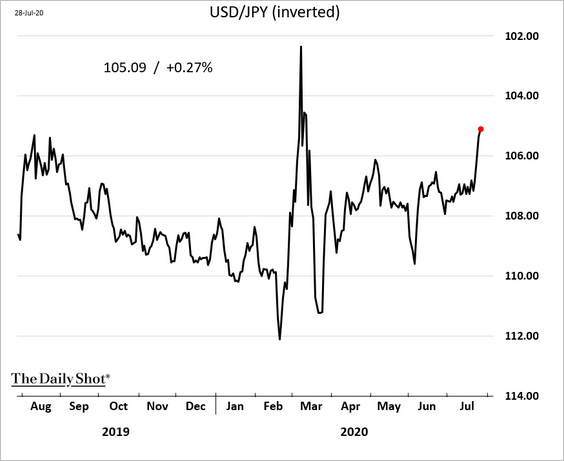
1. The yen continues to strengthen.
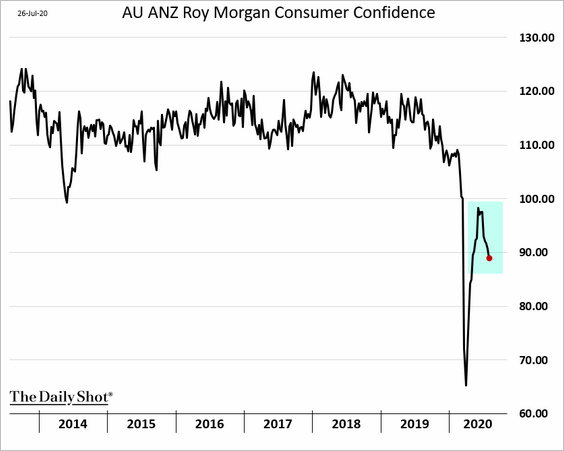
2. Australia’s consumer confidence is deteriorating.
The charts below show Australia’s payroll trends since the start of the crisis.
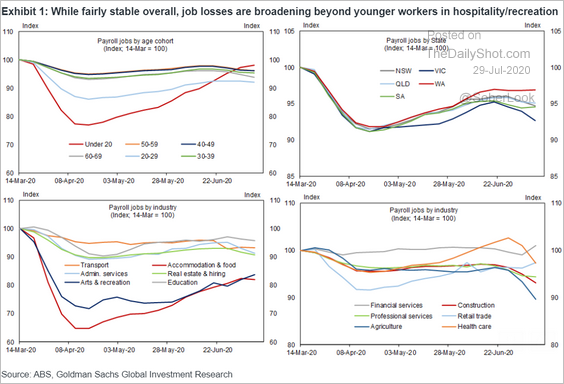 Source: Goldman Sachs
China
1. The stock rally will entice households and corporates to replace bank deposits with equity assets in their portfolio, according to ANZ Research.
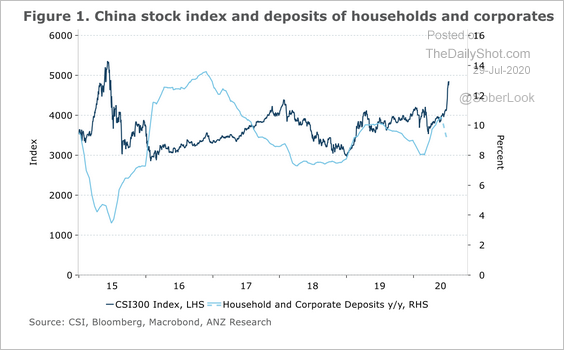 Source: ANZ Research
2. Morgan Stanley is forecasting a 7.6% fiscal deficit this year.
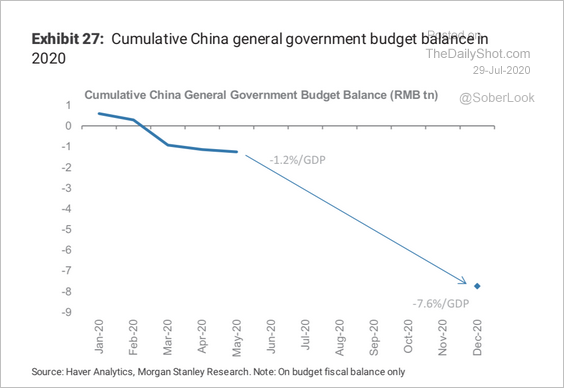 Source: Morgan Stanley Research
Emerging Markets
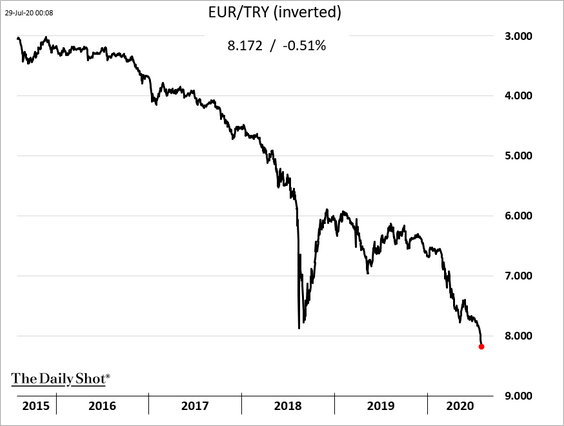
1. The Turkish lira came under pressure on Tuesday.
 Source: CNBC Read full article
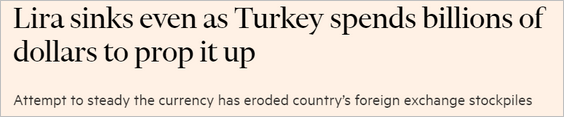 Source: @financialtimes Read full article
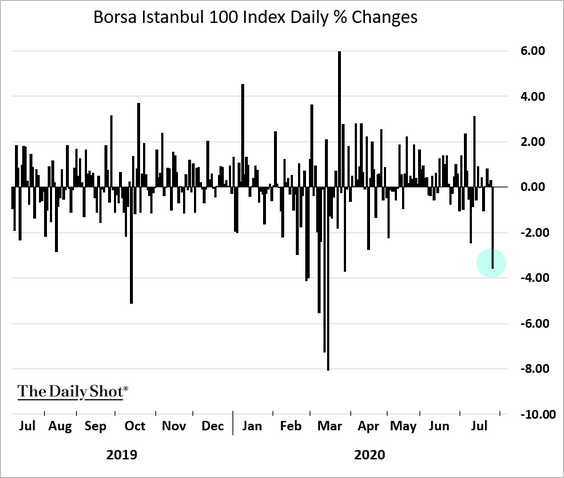
The stock market took a hit.
——————–
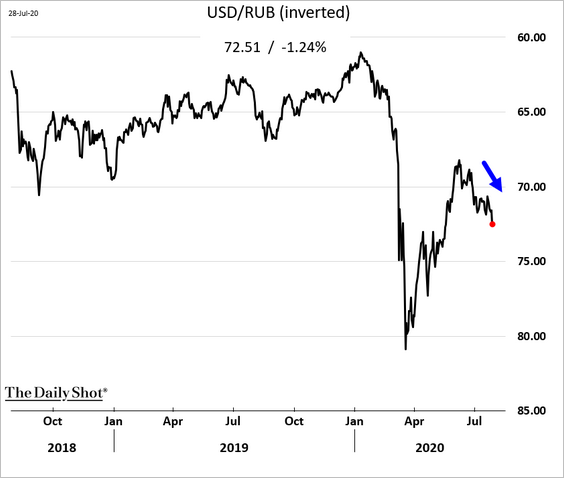
2. The Russian ruble has been rolling over.
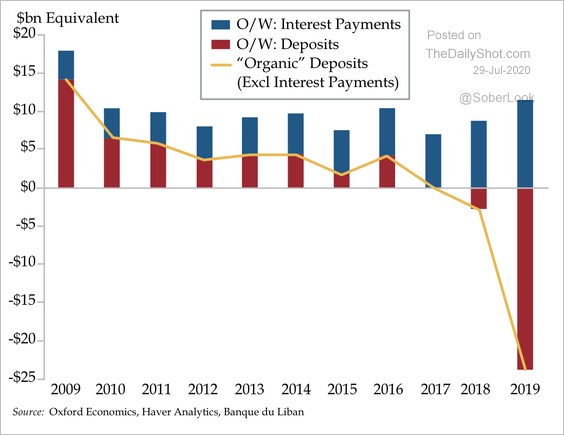
3. Lebanese bank deposits have collapsed.
 Source: Quill Intelligence
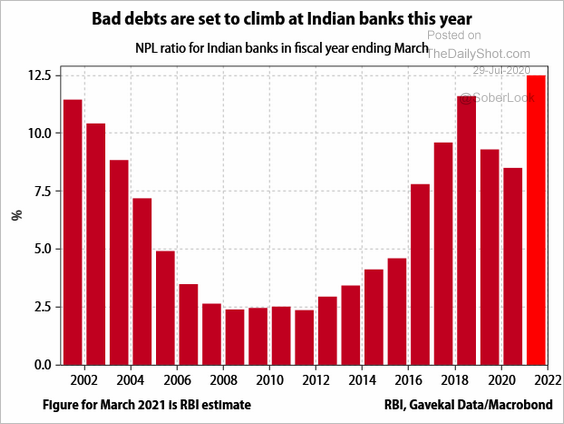
4. India’s nonperforming loan ratio is expected to hit a multi-decade high.
 Source: Gavekal
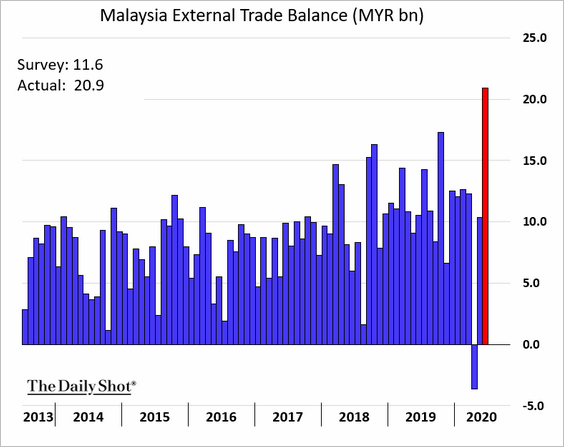
5. Malaysia’s exports rebounded sharply last month.
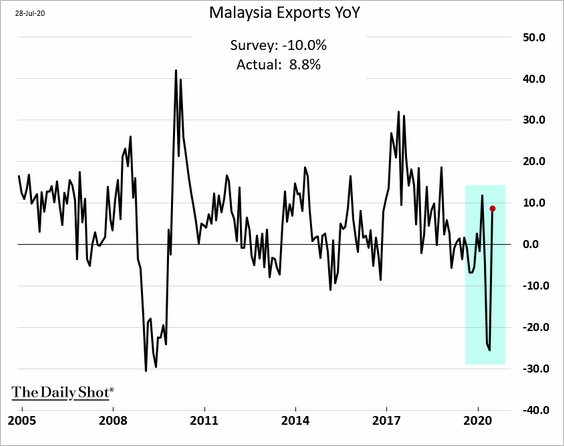
The nation’s trade surplus hit a new record.
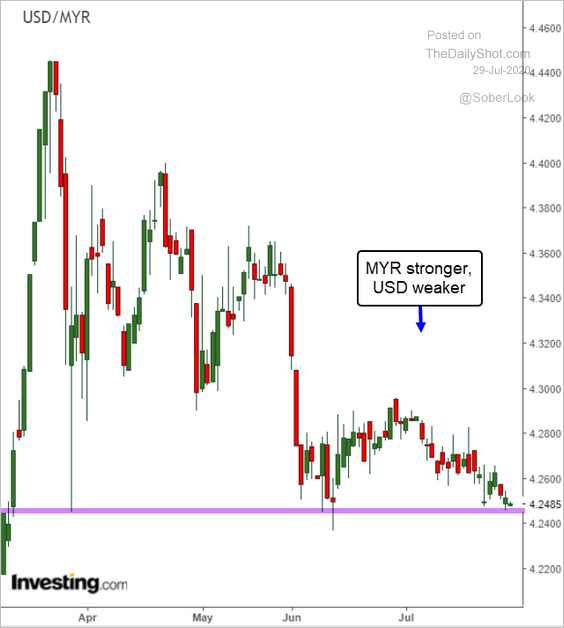
USD/MYR is at support.
——————–
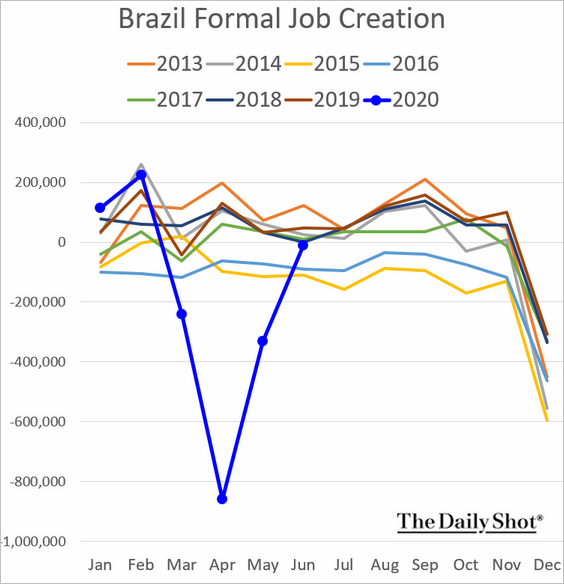
6. Brazil’s job losses appear to be over.
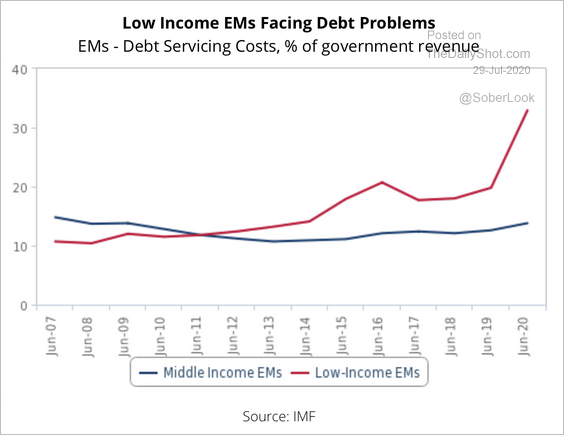
7. Low income emerging markets face higher debt servicing costs as a percentage of government revenue.
 Source: Fitch Solutions Macro Research
Commodities
1. Net long speculative futures positioning in gold remains well off its highs.
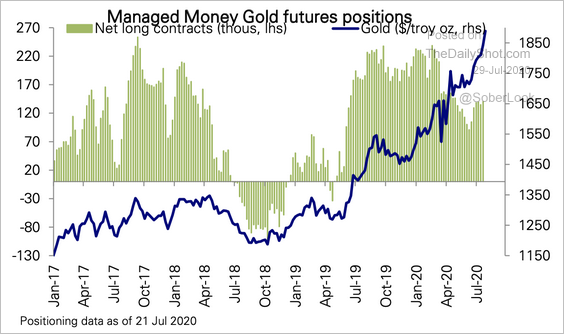 Source: Deutsche Bank Research
2. Growing conditions for US corn and soybeans surged 3 points each last week to 72% good/excellent (the first such increase during late July since 2001).
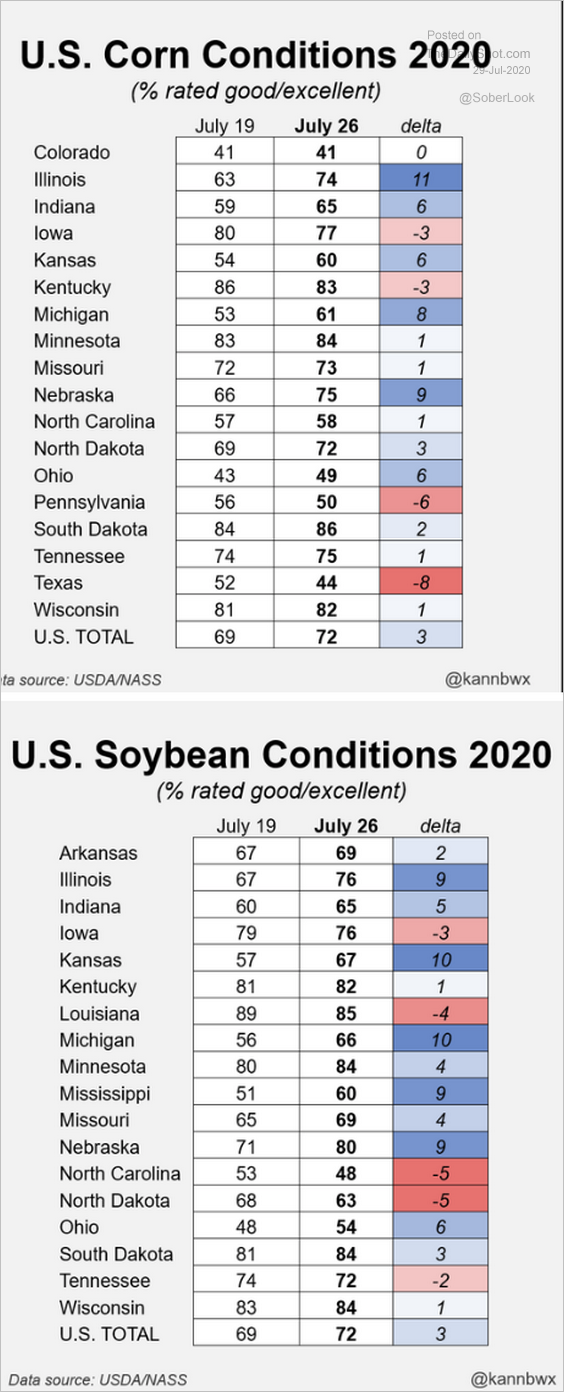 Source: @kannbwx
Here is a note on corn yield from Eric Hunt, Atmospheric and Environmental Research.
This chart shows the present value of US corn yield going back to 1986. While we will set a new record this year for corn yield and production, it’s not a record with regard to trend. The darker the red (blue) markers, the more below (above) trend a season was.
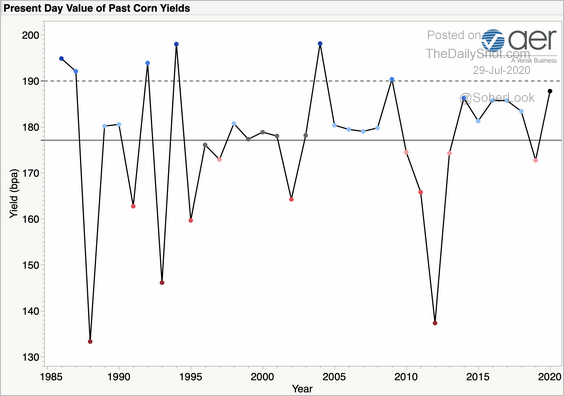 Source: @DroughtLIS, Atmospheric and Environmental Research, Inc.
Energy
1. 2020 is shaping up to be the worst year on record for energy shares.
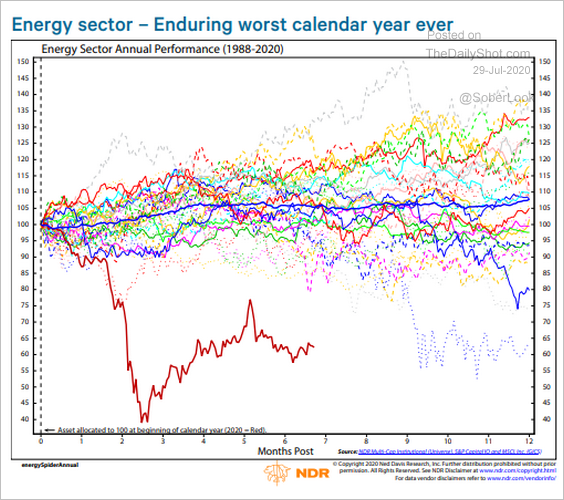 Source: @WarrenPies
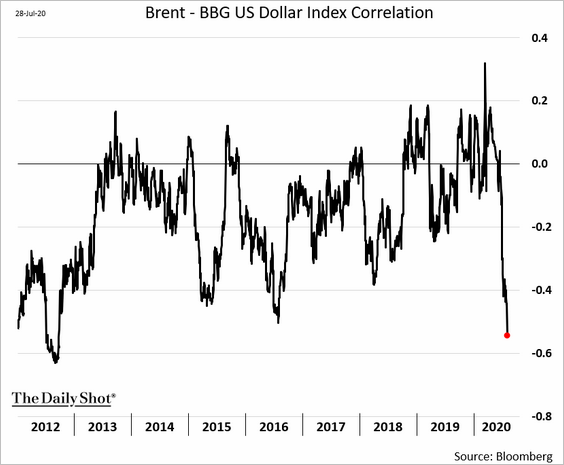
2. The Brent – US dollar inverse correlation is the strongest since 2012.
 h/t Andrew Janes
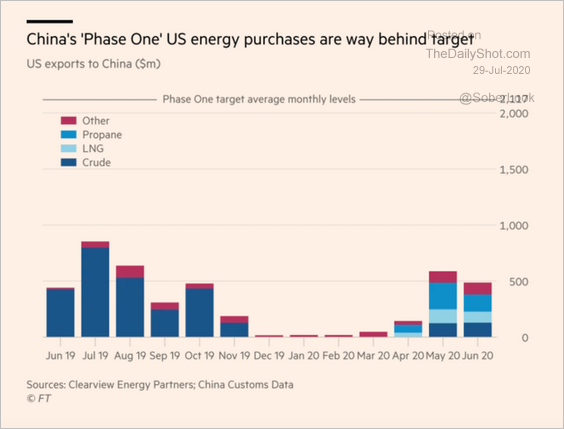
3. China’s purchases of US energy products are well below the target set by the phase-one agreement.
 Source: @adam_tooze, @FT Read full article
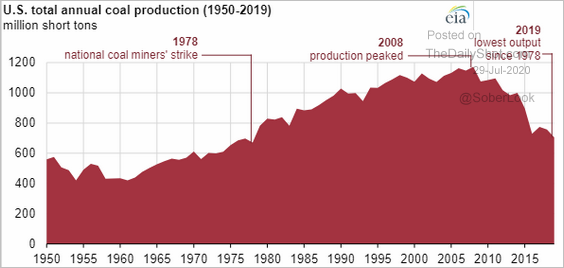
4. Next, we have some updates on coal.
• US coal production (lowest since 1978):
 Source: EIA
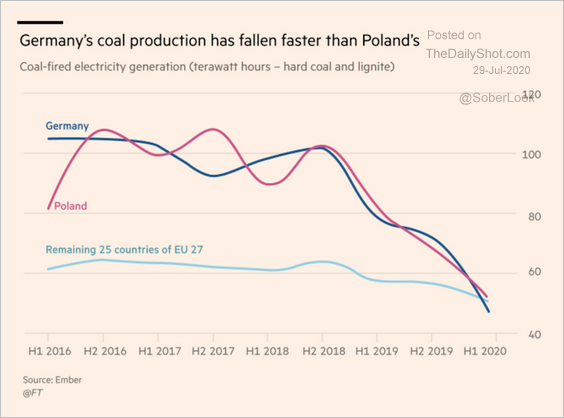
• German and Polish coal production:
 Source: @adam_tooze, @JamesShotter Read full article
• Coal inventories at US power plants:
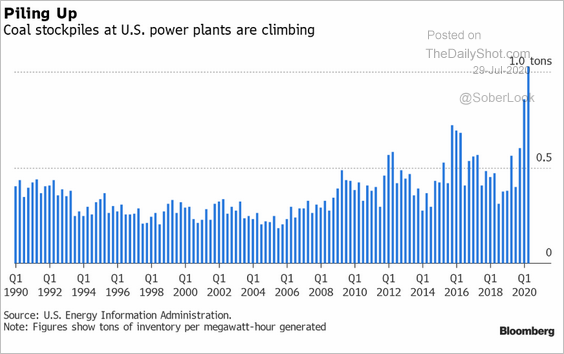 Source: Will Wade, @TheTerminal
Equities
1. Returns over the past two weeks have strongly favored cyclical growth sectors.
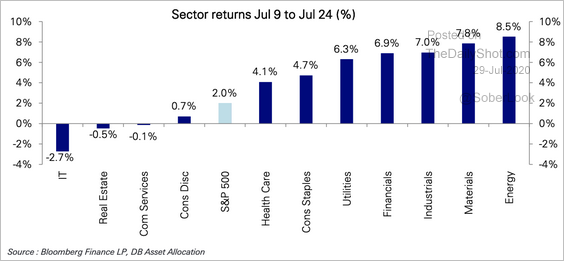 Source: Deutsche Bank Research
2. Growth stocks look crowded.
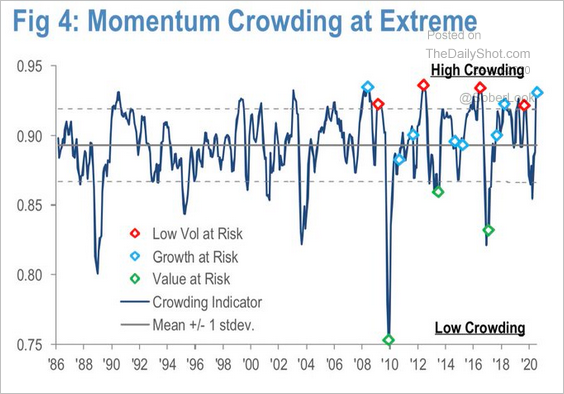 Source: JP Morgan, @carlquintanilla
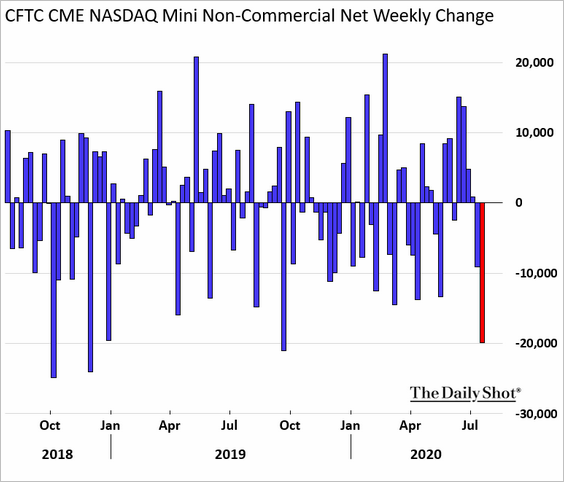
3. Speculative accounts have been reducing their bets on Nasdaq 100 futures.
4. The Nasdaq 100 put/call ratio continues to show elevated risk appetite.
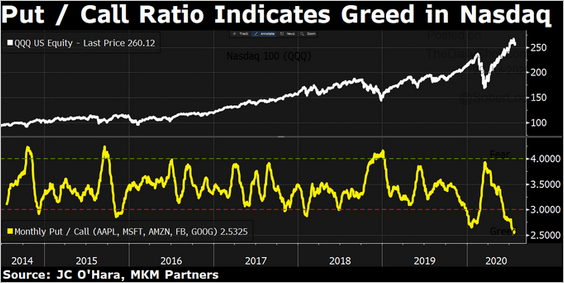 Source: @sentimentrader
5. The overall equity positioning remains low.
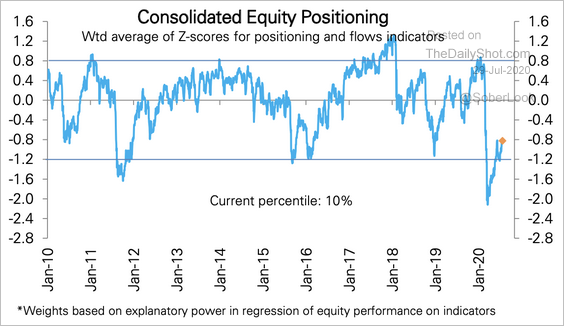 Source: Deutsche Bank Research
6. US stocks and consumer confidence have diverged.
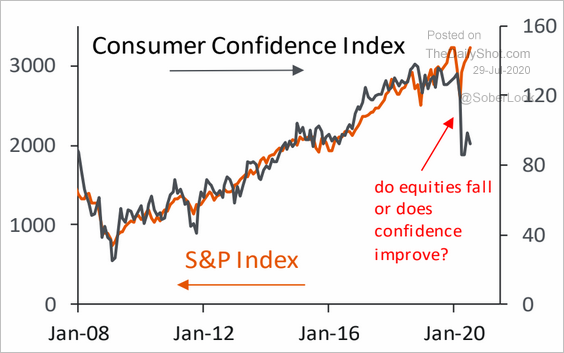 Source: Piper Sandler
7. Big tech dealmaking has been robust this year.
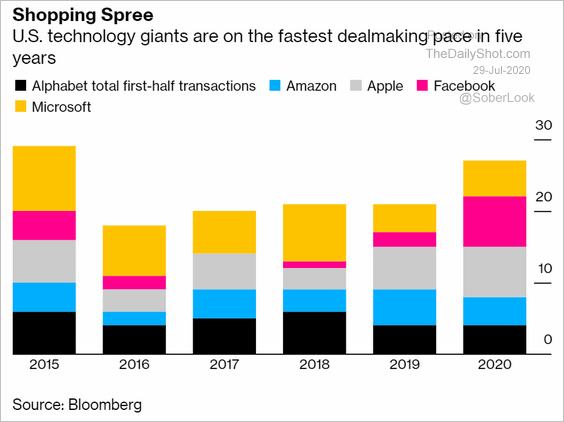 Source: @technology Read full article
8. Here is how stocks trade before and after the announcement of inclusion in the S&P 500.
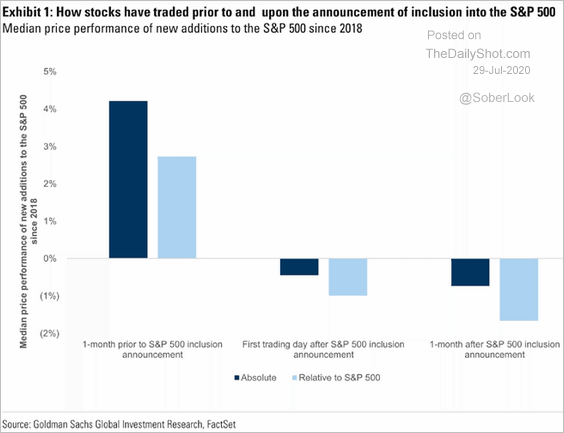 Source: @ISABELNET_SA, @GoldmanSachs
9. Fee compression in ETFs continues.
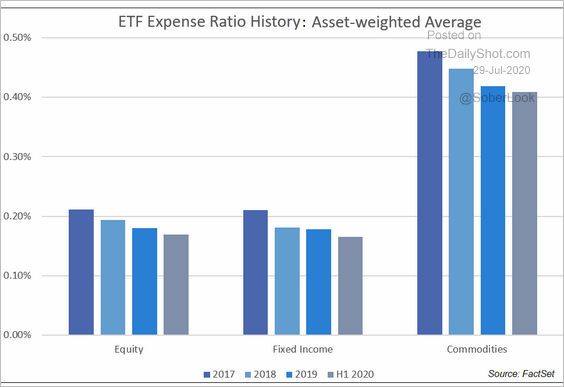 Source: @FactSet Read full article
Alternatives
1. This chart shows trailing 1-year hedge fund flows by sector.
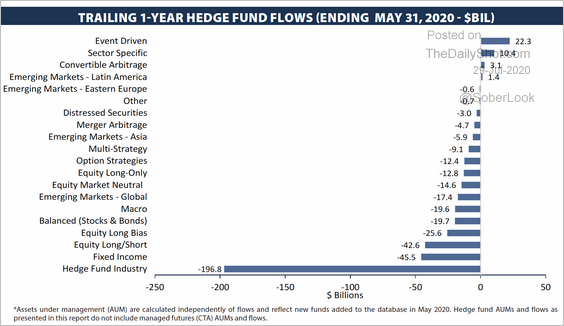 Source: BarclayHedge
2. Managed futures experienced another month of inflows in May.
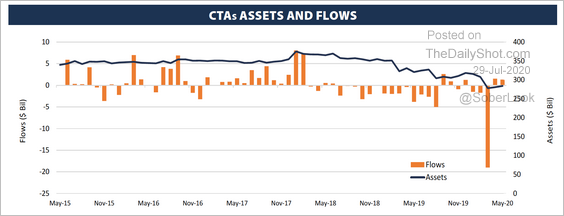 Source: BarclayHedge
3. Institutional investors are boosting their hedge fund holdings.
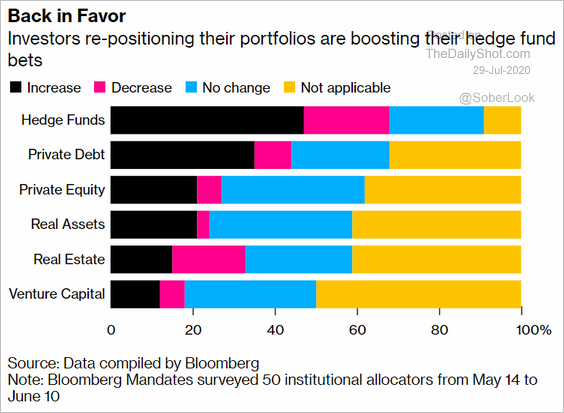 Source: @markets Read full article
4. Hedge fund fee compression continues:
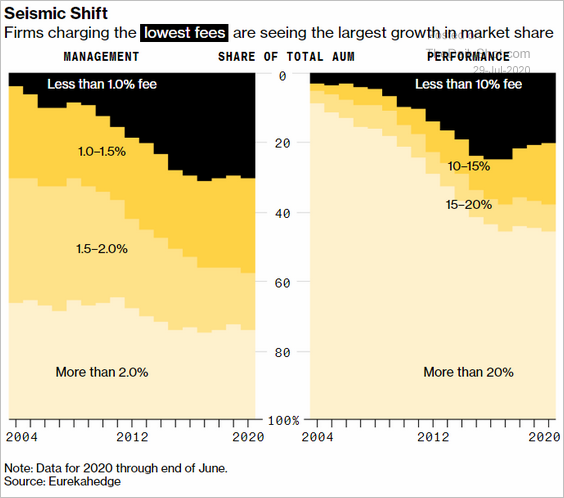 Source: @bbgvisualdata Read full article
5. How are sovereign wealth funds repositioning their portfolios?
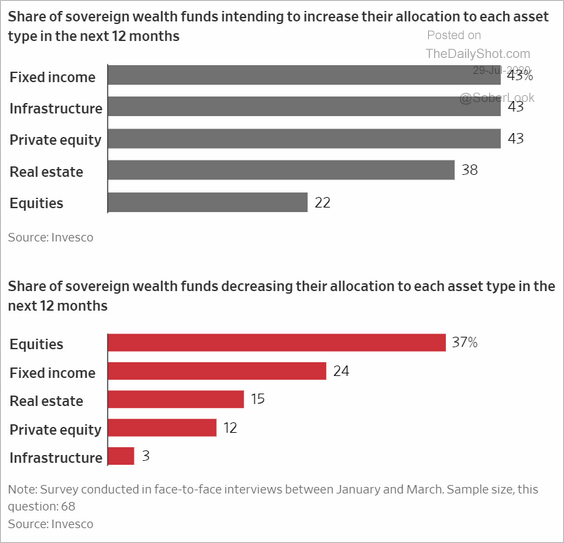 Source: @WSJ Read full article
6. Tech-focused private equity fundraising has been strong this year.
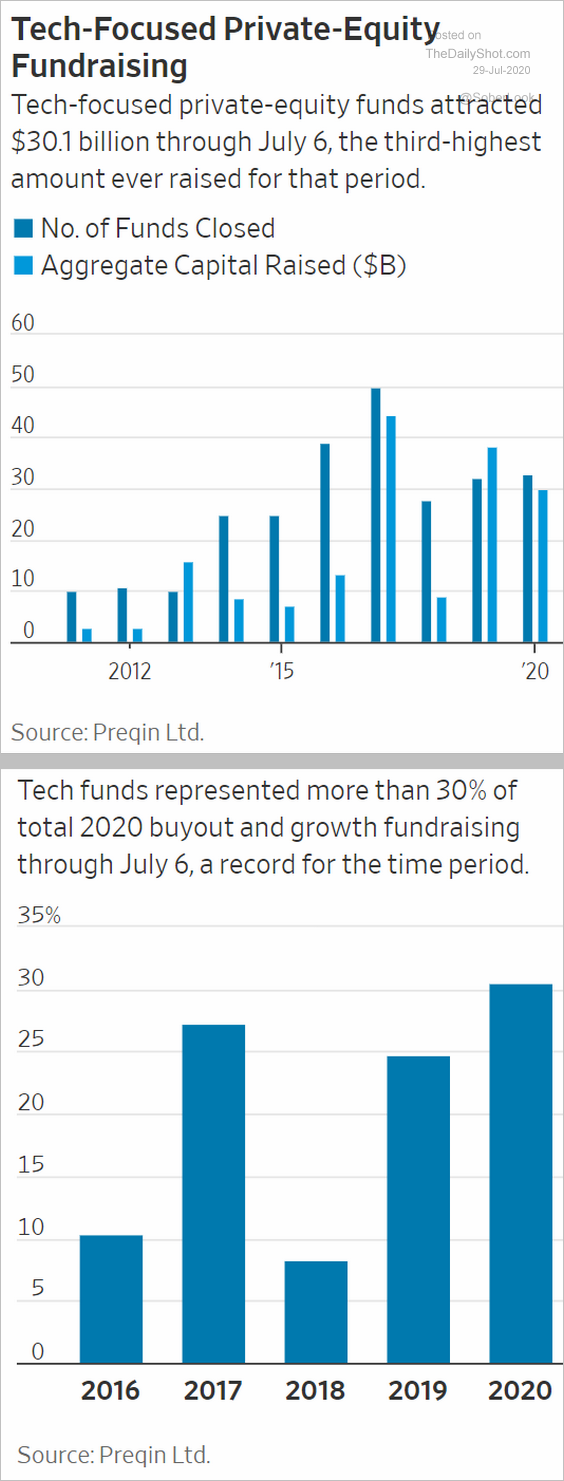 Source: @WSJ Read full article
7. Funding for venture-backed firms has slowed.
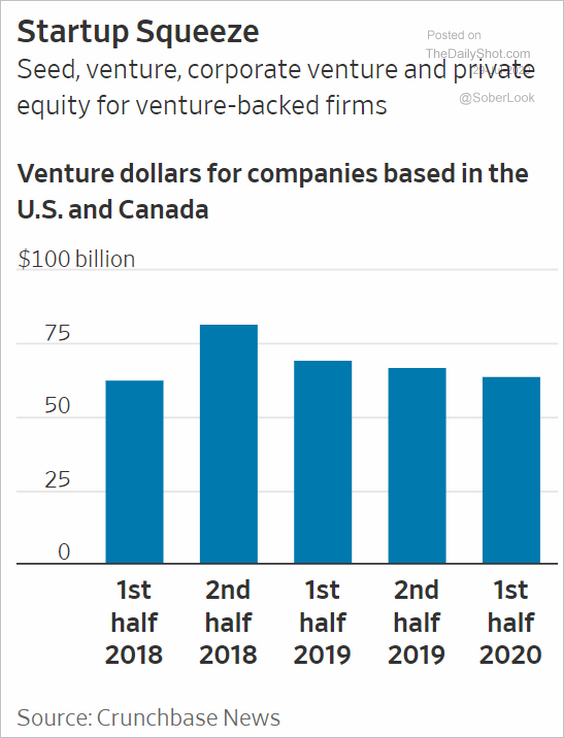 Source: @WSJ Read full article
Credit
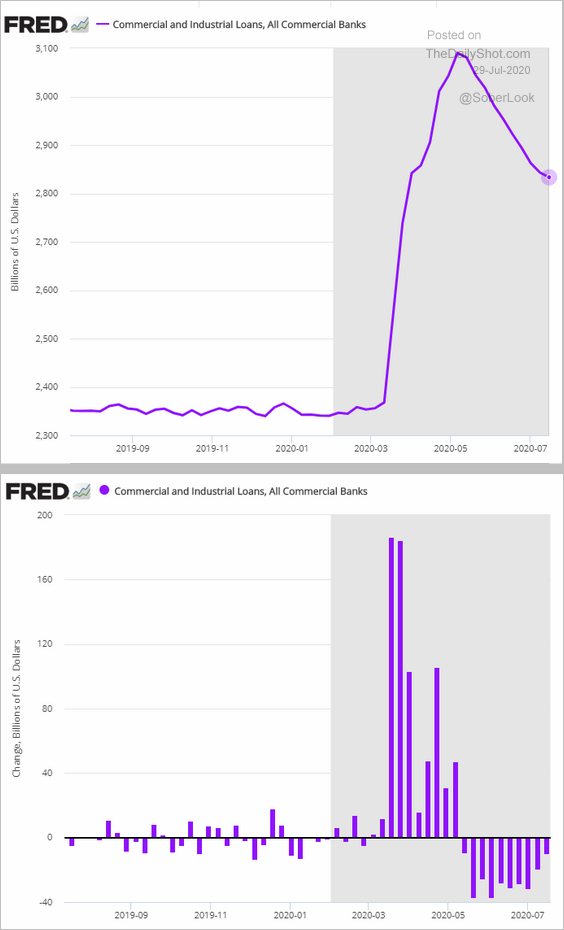
1. US firms have been paying down their bank credit facilities amid robust capital markets.
2. Companies have been extending their debt maturities as bond yields collapse (first panel). The second panel shows the amount of US corporate debt maturing in 15+ years.
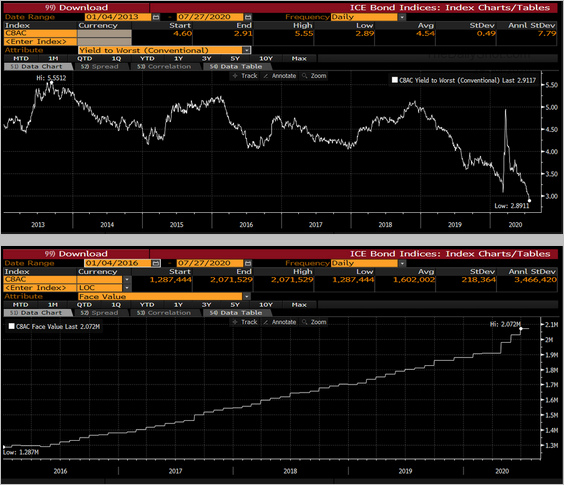 Source: @lisaabramowicz1
3. US corporate bankruptcies are expected to peak in October.
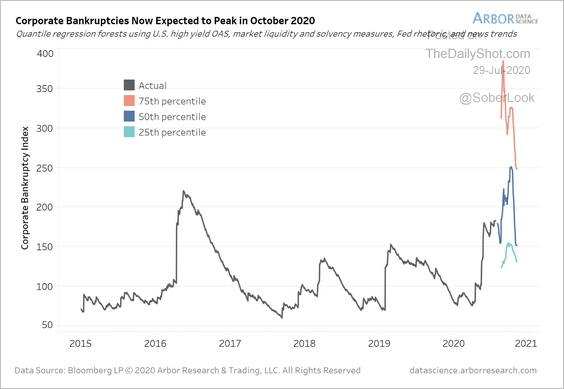 Source: Arbor Research & Trading
4. Next, we have oil & gas bankruptcies in North America.
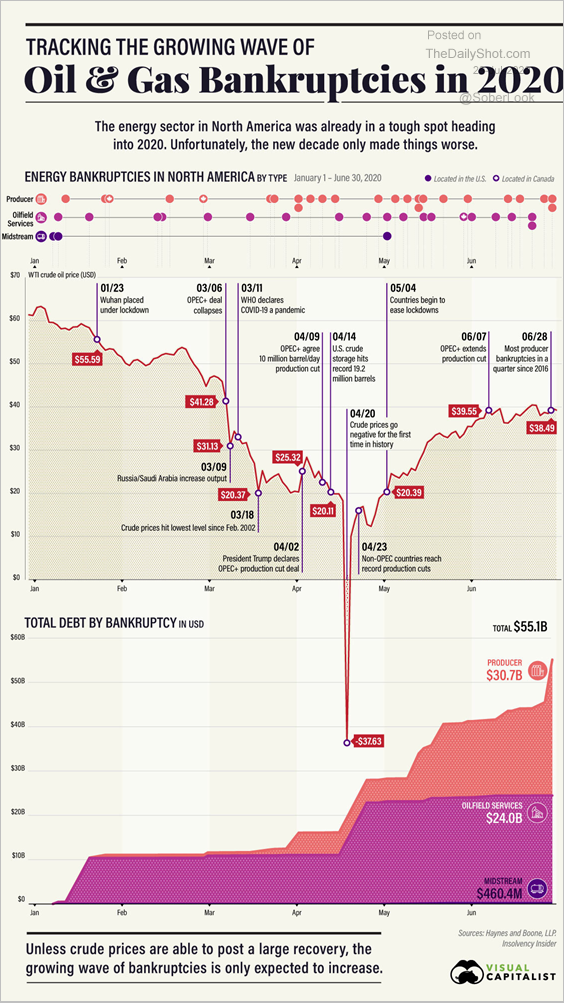 Source: Visual Capitalist Read full article
Rates
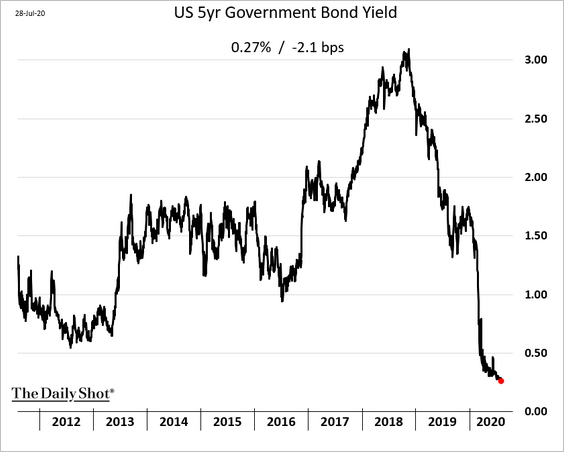
1. The 5yr Treasury yield hit a record low.
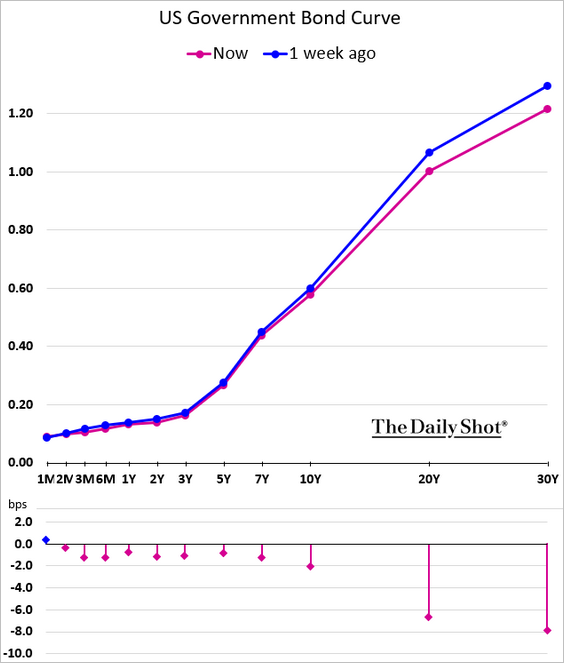
And the Treasury curve continues to flatten.
But risks to the upside (for yields) are building.
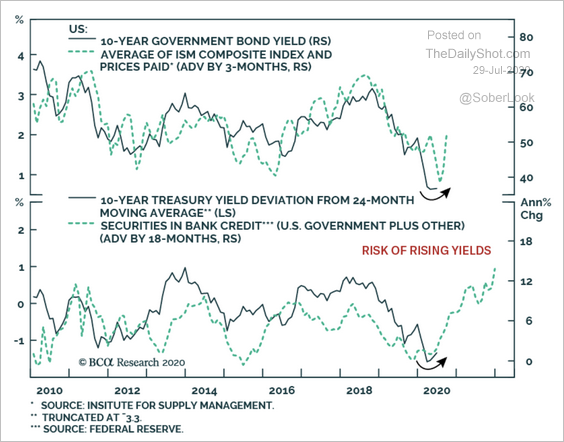 Source: BCA Research
——————–
2. At what point will the rapidly growing US debt supply begin to put upward pressure on yields?
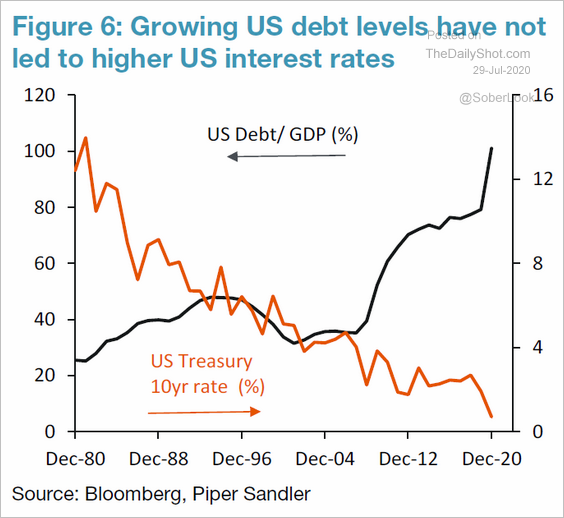 Source: Piper Sandler
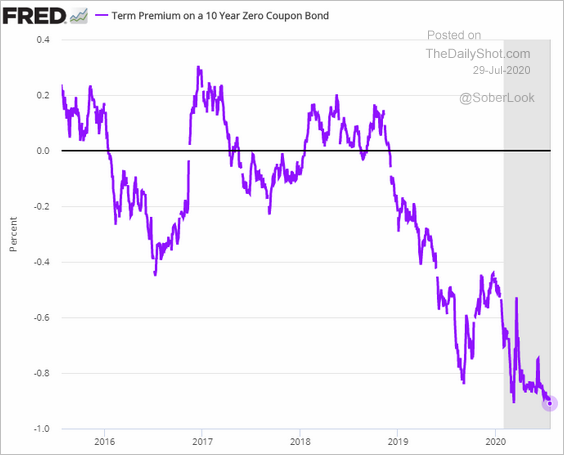
3. This chart shows the Treasury term premium.
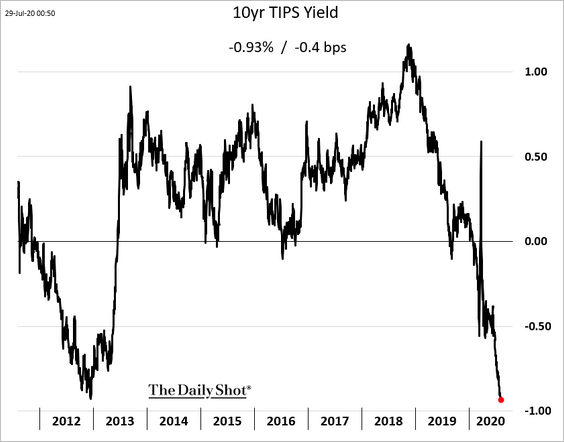
4. The 10yr US real yield hit a record low (which has been supporting gold prices).
5. 10-year Treasury futures volume is back near December lows.
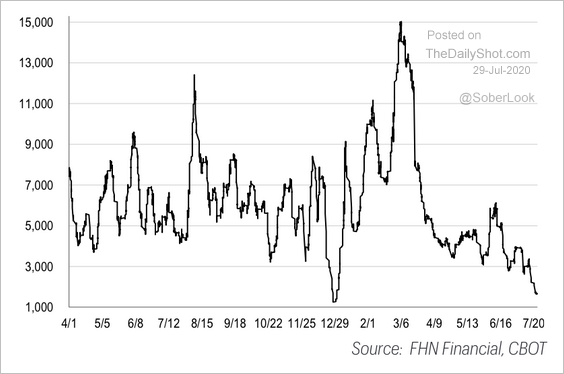 Source: FHN Financial
6. The gap between mortgage rates and Treasury yields has been narrowing.
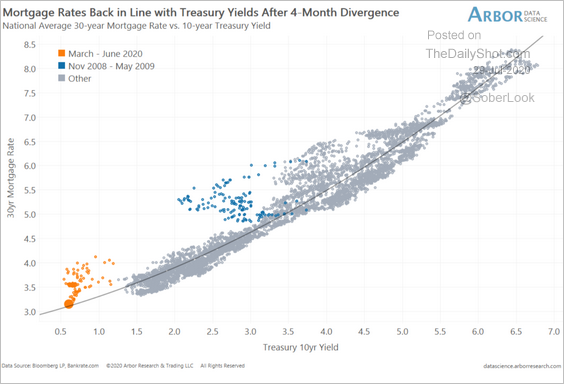 Source: Arbor Research & Trading
7. Global negative-yielding debt balances continue to climb.
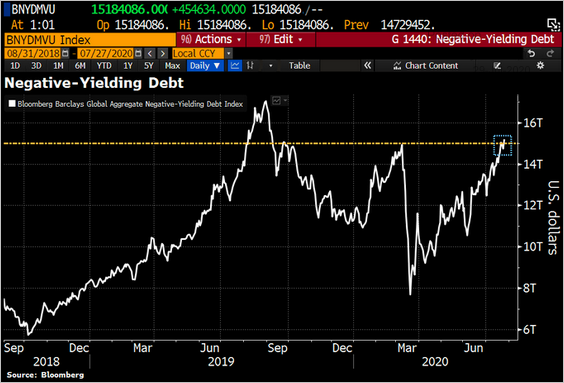 Source: @Schuldensuehner
——————–
Food for Thought
1. Commercial aircraft deliveries:
 Source: Statista
2. The legal status of casinos in the US:
 Source: Hoya Capital Real Estate
3. Most profitable US companies:
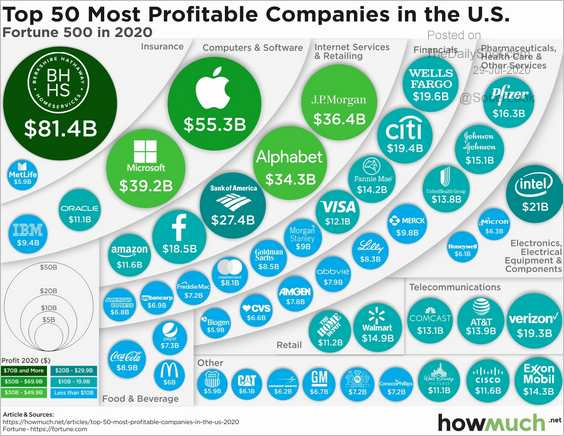 Source: @howmuch_net, @fortune Read full article
4. What causes evictions?
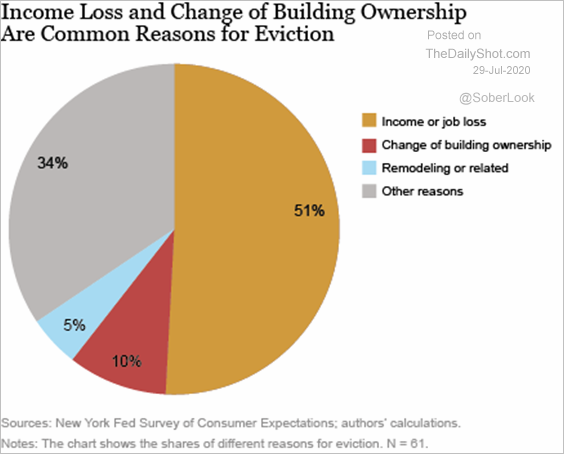 Source: Liberty Street Economics Read full article
5. Countries with the largest populations:
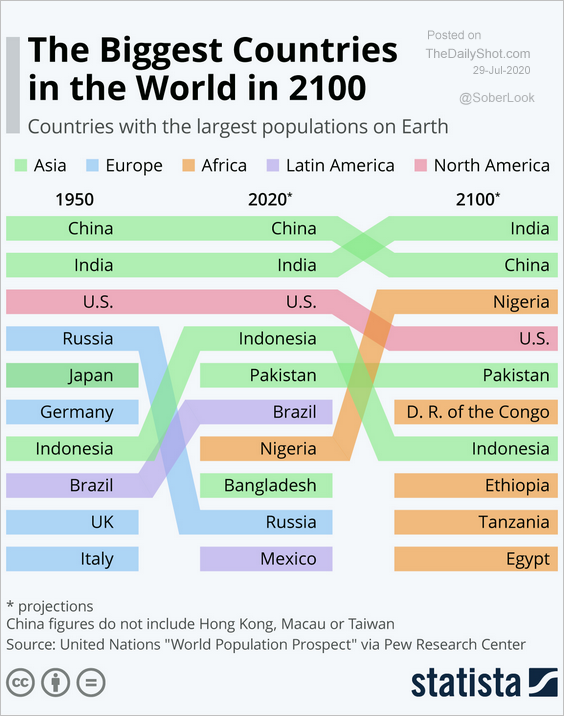 Source: Statista
6. US seniors living with school-age children:
 Source: @KFF Read full article
7. The impact of Medicare on financial health:
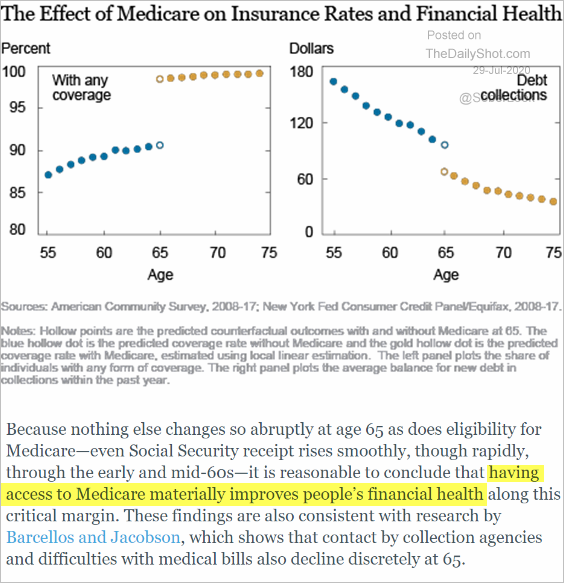 Source: Liberty Street Economics Read full article
8. Air temperature anomalies:
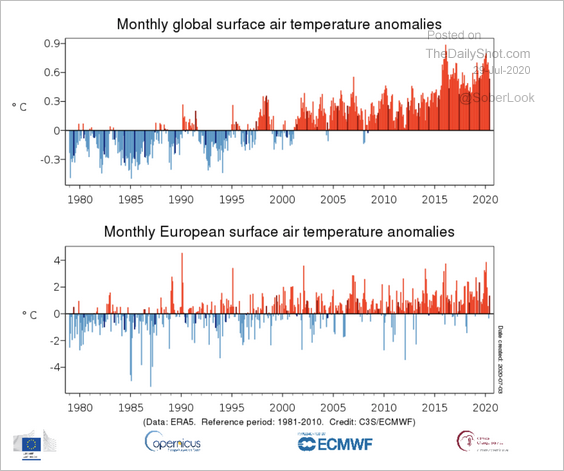 Source: @CopernicusECMWF Read full article
9. Most-watched Netflix original movies:
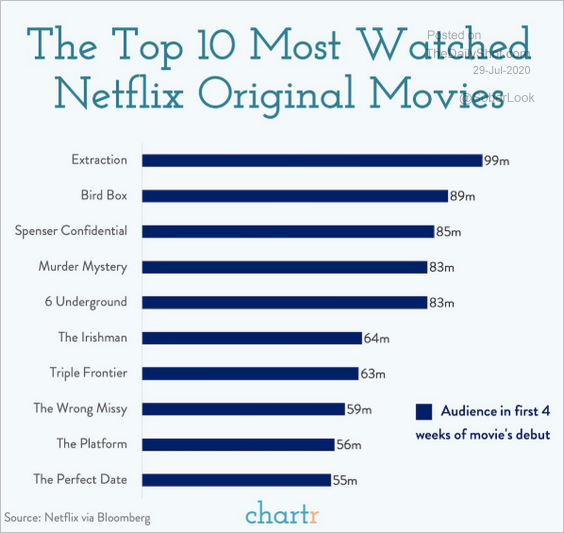 Source: @chartrdaily
——————–
Please note that The Daily Shot will no longer be published by The Wall Street Journal beginning on August 1. The Daily Shot will still be available as an independent publication. If you would like to continue to receive The Daily Shot, you can get more information on how to subscribe here.