
The Daily Shot: 30-Jul-20
• The United States
• The United Kingdom
• The Eurozone
• Europe
• Asia – Pacific
• China
• Emerging Markets
• Cryptocurrency
• Commodities
• Energy
• Equities
• Rates
• Global Developments
• Food for Thought
The United States
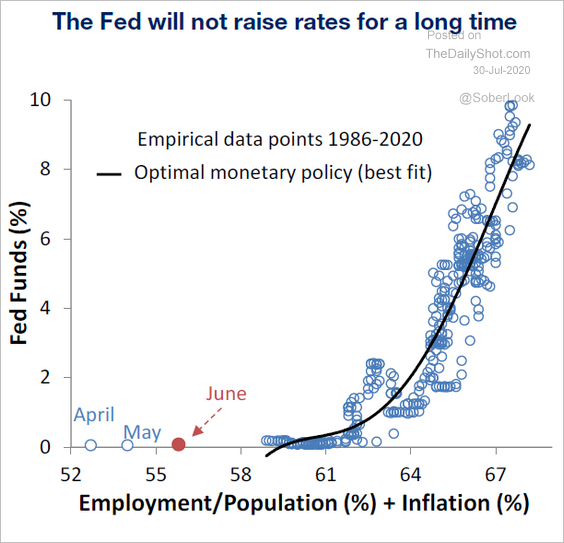
1. The Federal Reserve left policy unchanged as it monitors the virus spread. It will be some time before the labor market recovery warrants a rate hike.
 Source: Piper Sandler
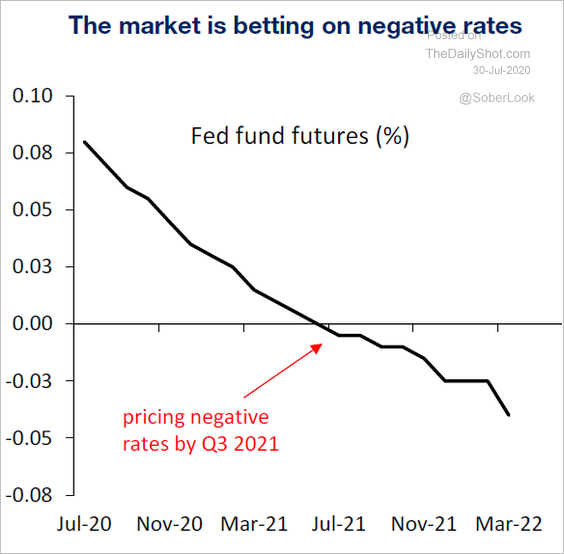
In fact, the market continues to price in the possibility of negative rates next year.
 Source: Piper Sandler
The US dollar declined further in response to the Fed’s cautious stance.
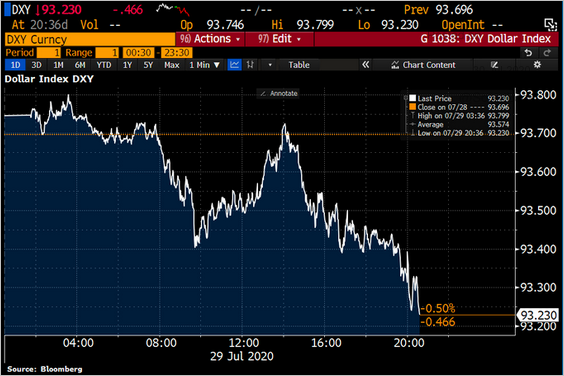 Source: @TheTerminal, @Schuldensuehner
——————–
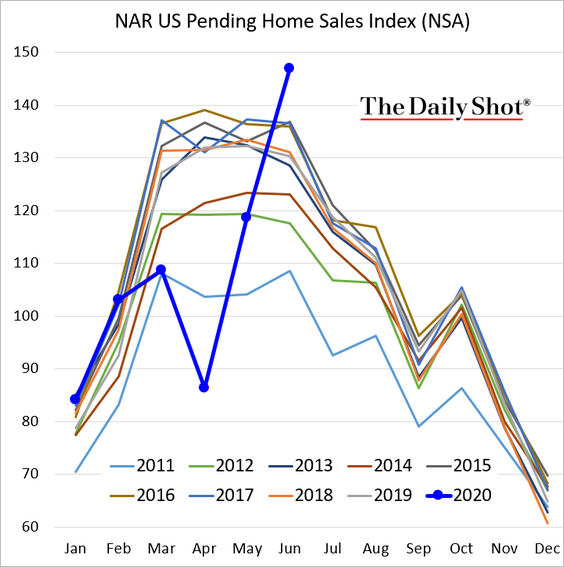
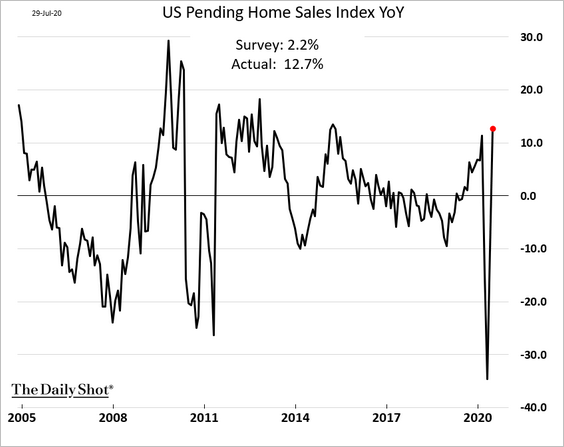
2. June pending home sales surprised to the upside, climbing to multi-year highs.
 Source: CNBC Read full article
Here is the year-over-year change.
We should see a similar rebound in existing home sales (EHS).
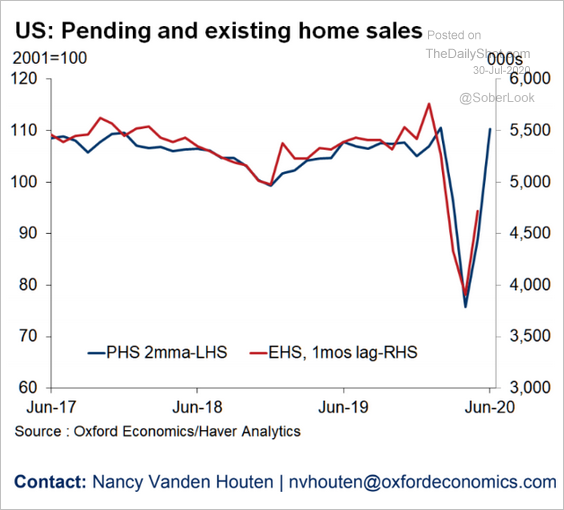 Source: Oxford Economics
——————–
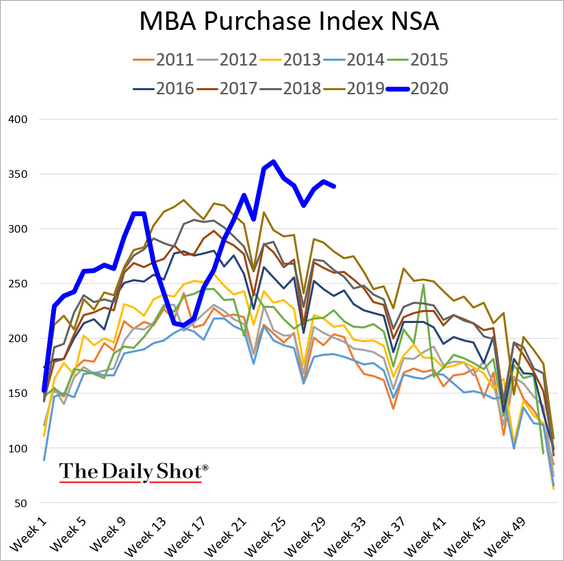
3. Mortgage applications remain robust.
• Applications to purchase a home:
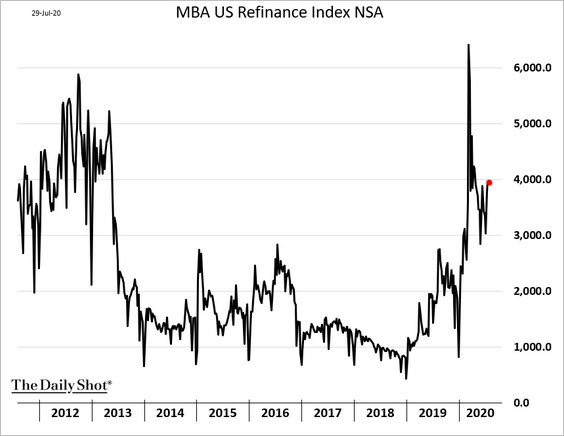
• Refi applications:
——————–
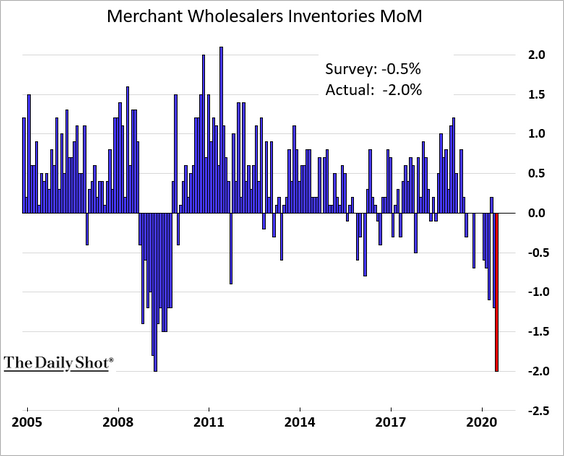
4. Wholesalers’ inventories continue to shrink (which has been a drag on the GDP).
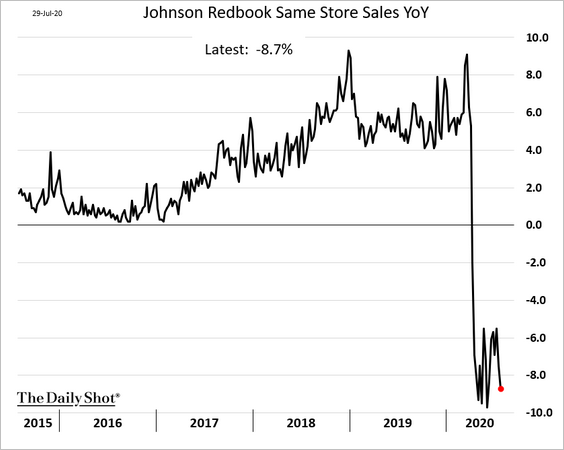
5. The Johnson Redbook index of same-store sales remains depressed.
6. The Household Pulse Survey employment index climbed last week but remained well below the mid-June peak.
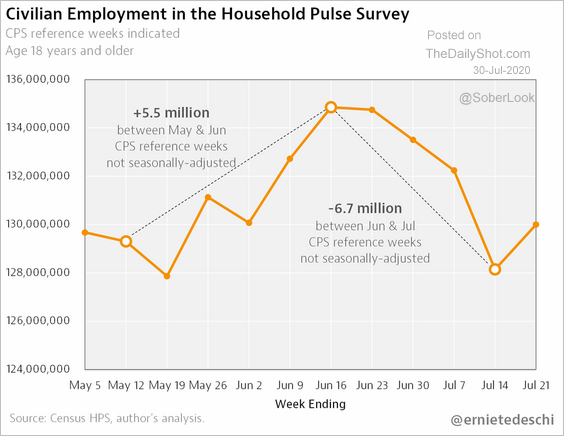 Source: @ernietedeschi Read full article
7. Here is the timeline of expiring government support.
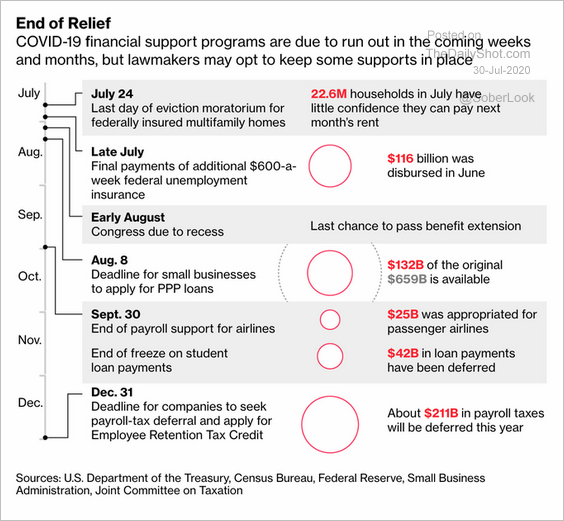 Source: @bopinion Read full article
• Most of the focus is on the unemployment insurance benefits, which have replaced lost income.
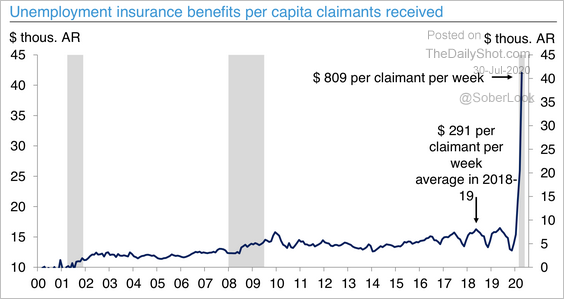 Source: Deutsche Bank Research
• This map shows where the loss of the extra $600 in unemployment benefits will hurt the most.
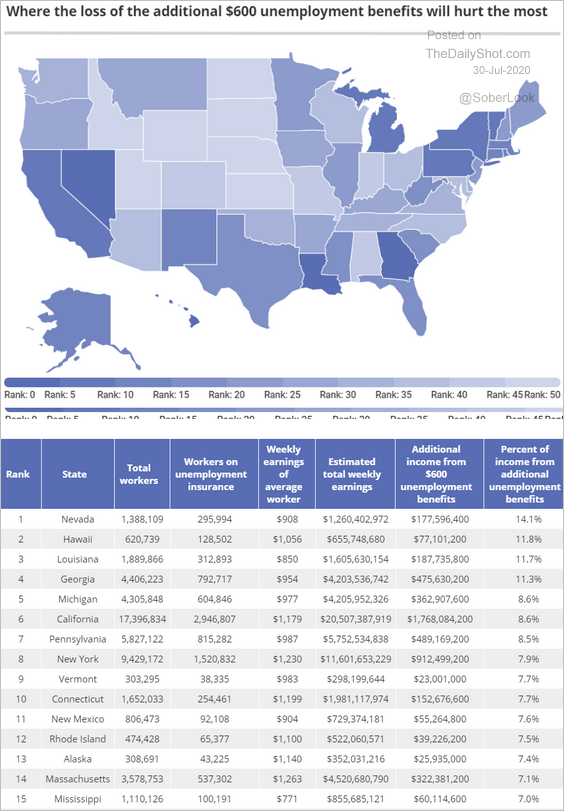 Source: MagnifyMoney
——————–
8. The Phillips Curve has been distorted because the outsize job losses among low-wage employees resulted in higher average pay for remaining workers.
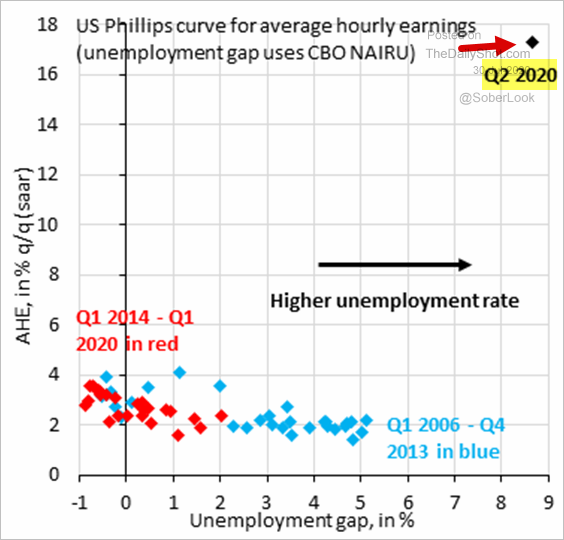 Source: @RobinBrooksIIF, @adam_tooze
9. Next, we have a couple of trends in credit.
• Business vs. household liabilities:
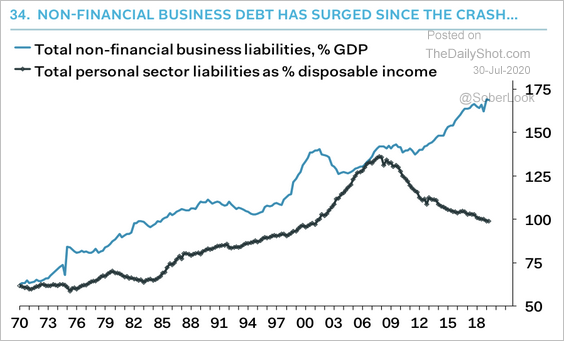 Source: Pantheon Macroeconomics
• Revolving vs. non-revolving consumer credit (Americans cut back on credit card debt):
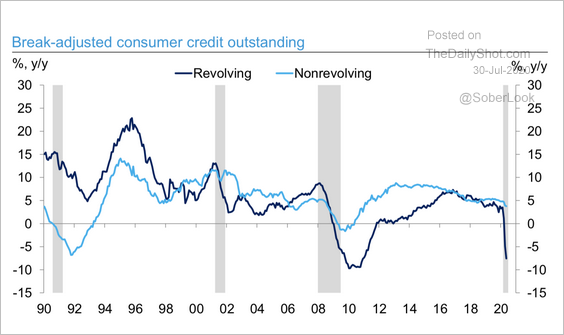 Source: Deutsche Bank Research
——————–
10. Signs continue to point to the pandemic peaking.
• Daily cases (blue) and the first derivative (red):
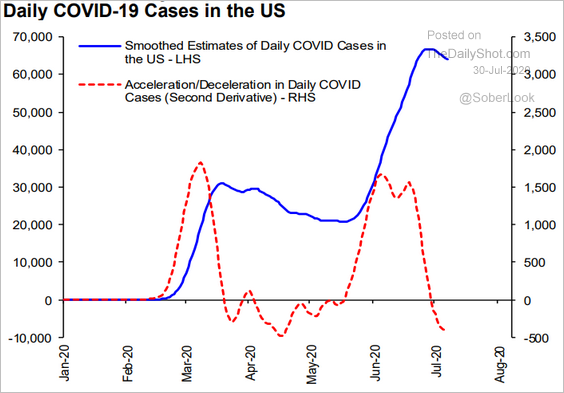 Source: Hugo Ste-Marie, Portfolio & Quantitative Strategy Global Equity Research, Scotia Capital
• Daily cases and deaths:
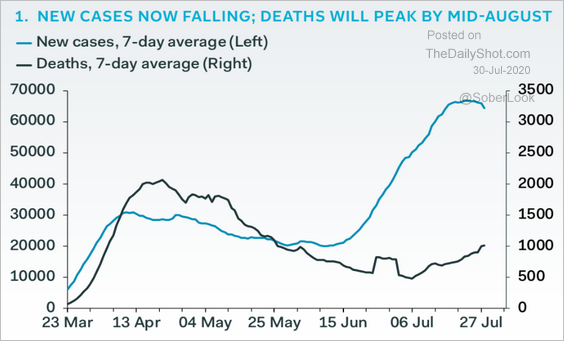 Source: Pantheon Macroeconomics
• Hospitalizations:
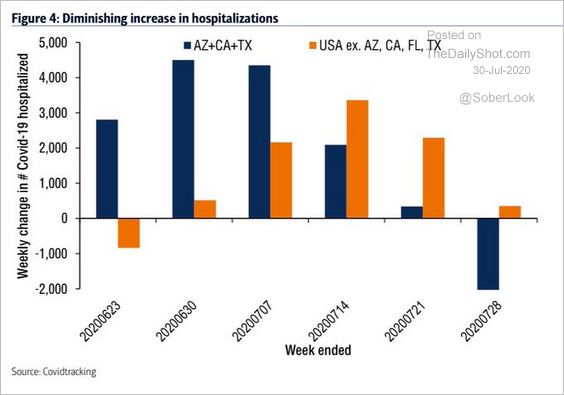 Source: BofA Merrill Lynch Global Research, @WallStJesus
The United Kingdom
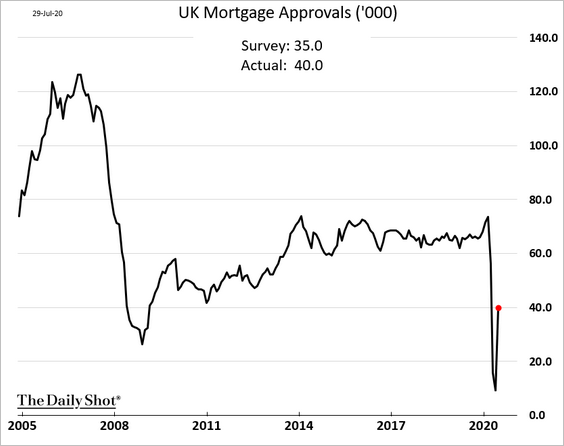
1. Last month’s mortgage applications bounced from extreme lows.
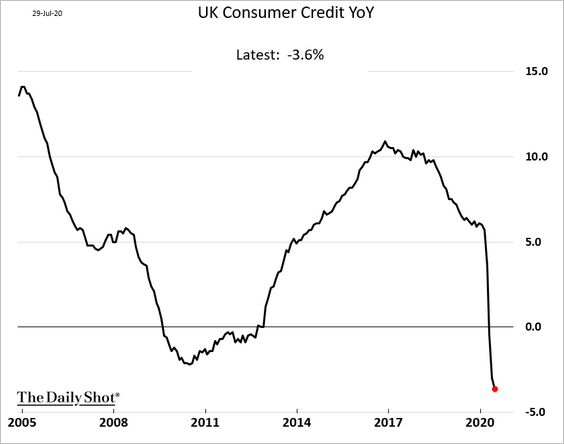
The overall consumer credit contracted further.
——————–
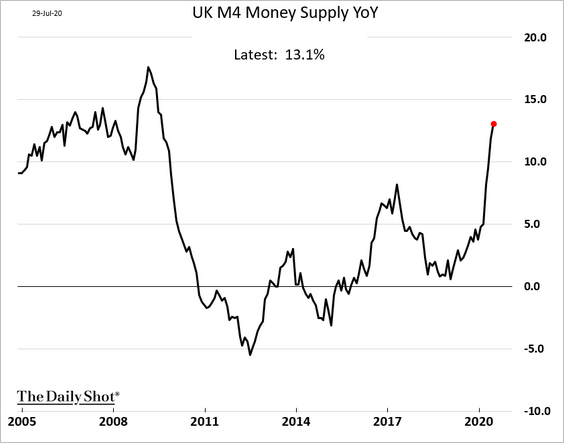
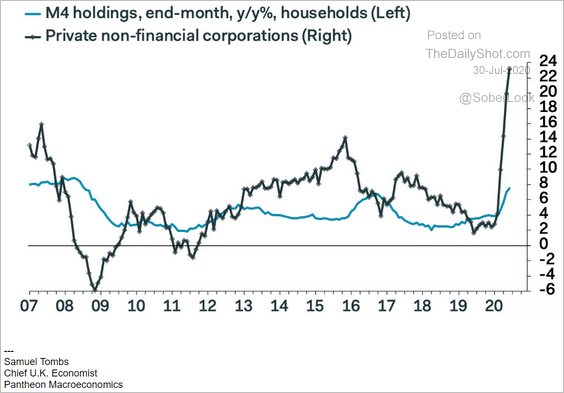
2. The broad money supply is up 13% from a year ago, driven by corporate demand for liquidity.
 Source: Pantheon Macroeconomics
——————–
3. Foot traffic at retail establishments points to a pause in the recovery.
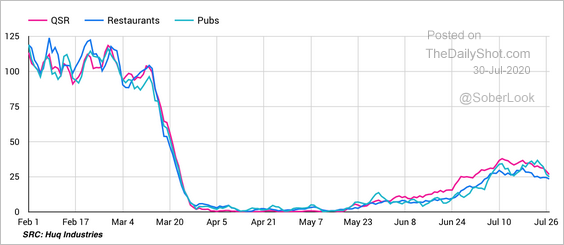 Source: @huq_industries Read full article
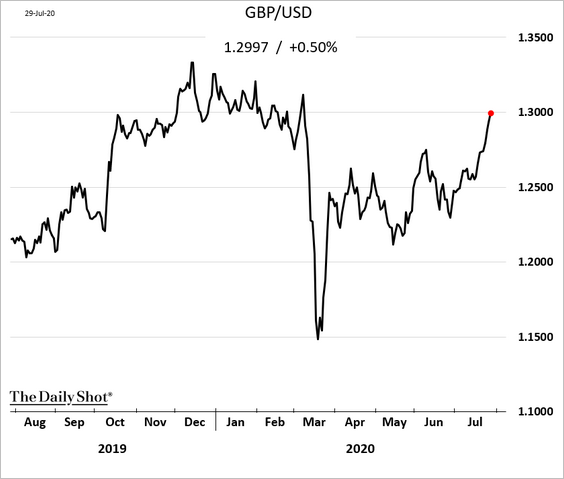
4. The pound is back to pre-crisis levels. However, this is more of a “weak dollar” story.
The Eurozone
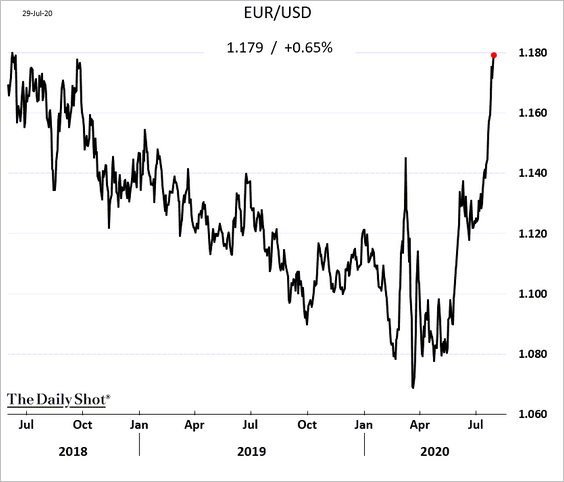
1. The euro hit a 2-year high.
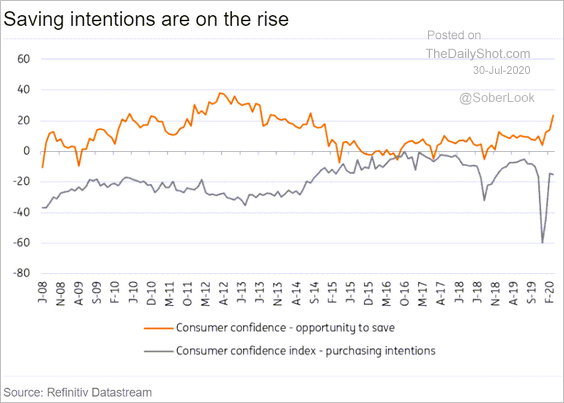
2. French consumer confidence is stuck in low gear.
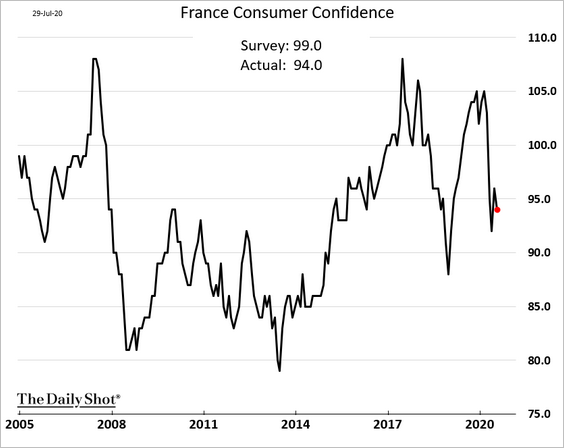
Saving intentions have been on the rise among French households.
 Source: ING
——————–
3. Spain’s retail sales rebounded sharply in June.

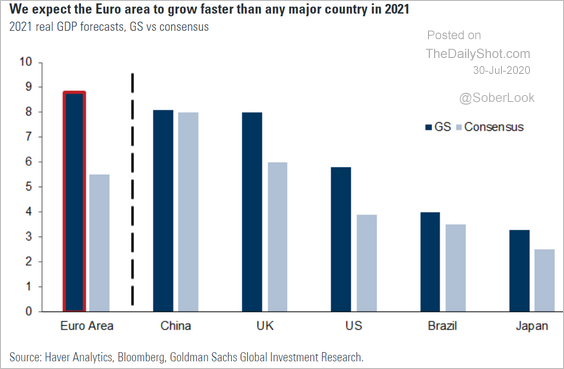
4. Goldman Sachs expects the Eurozone’s economy to outperform next year.
 Source: Goldman Sachs
5. Next, we have some updates on the euro-area labor markets (as of Q2).
• Employment growth (hours vs. workers):
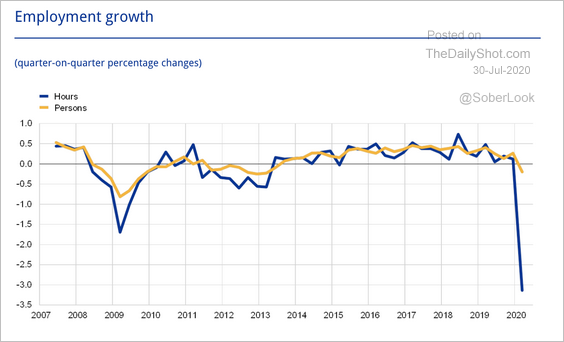 Source: ECB Read full article
• Unemployment and “short-time” workers with zero hours:
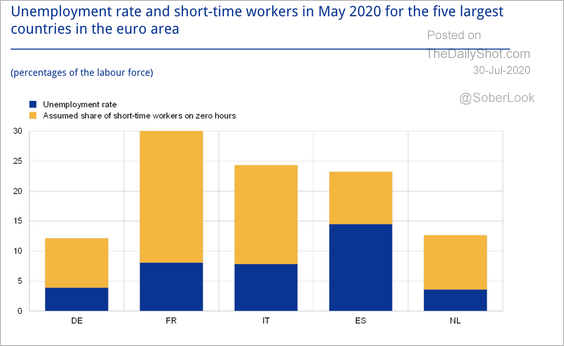 Source: ECB Read full article
• High-frequency indicators showing hiring and job postings:
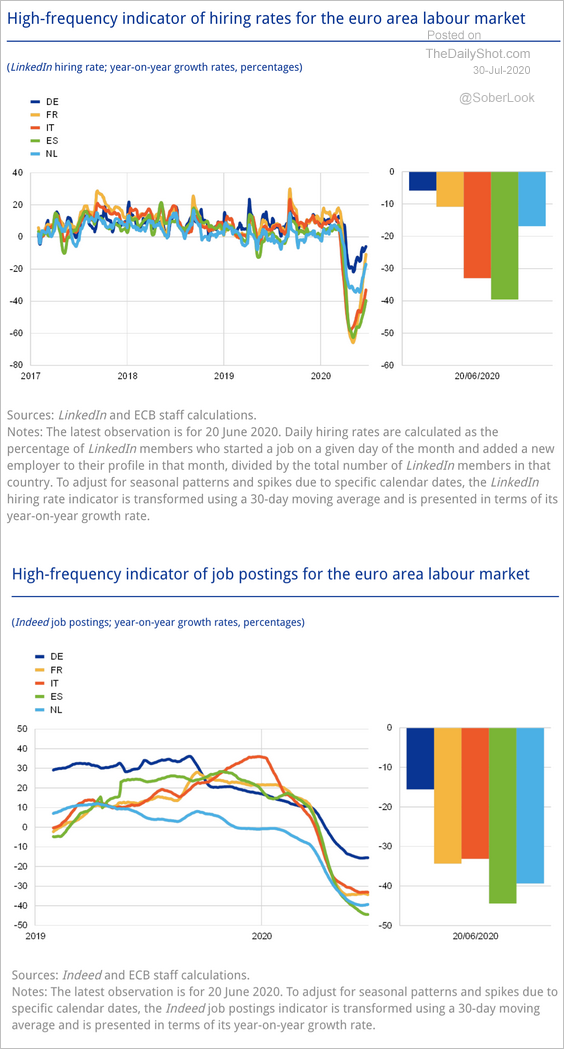 Source: ECB Read full article
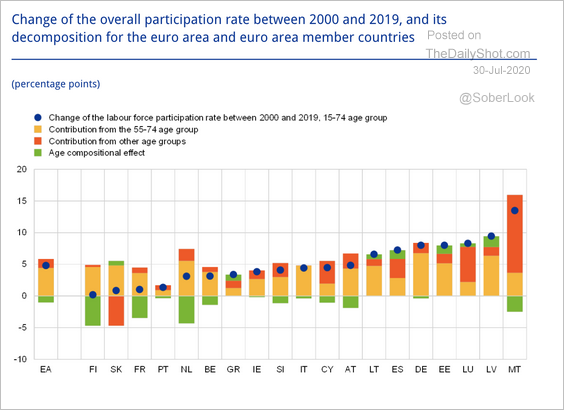
• Labor force participation (2 charts):
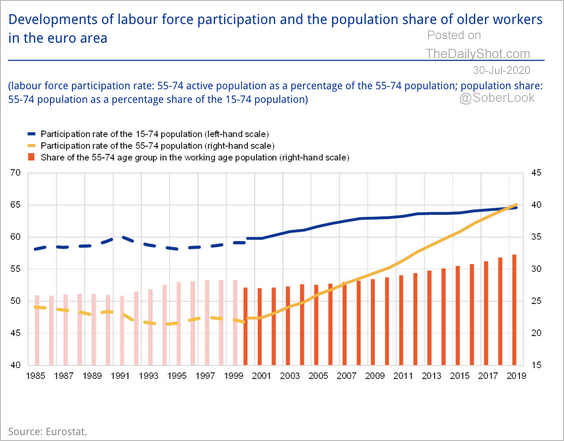 Source: ECB Read full article
 Source: ECB Read full article
Europe
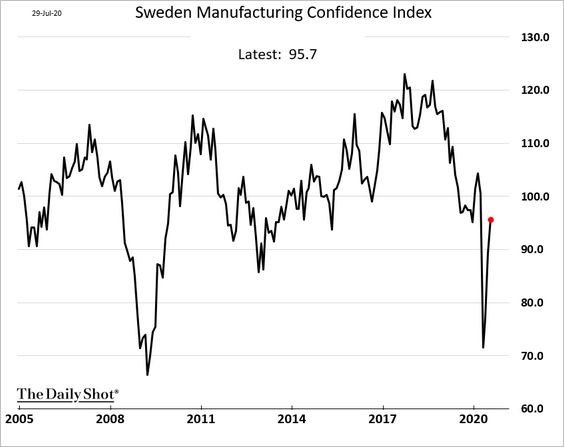
1. Sweden’s consumer sentiment recovery stalled this month:
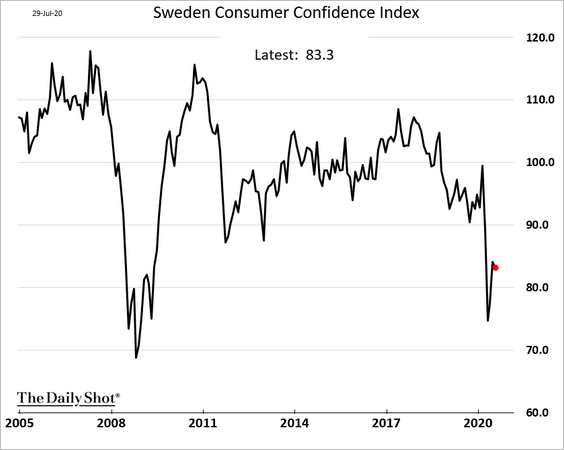
However, industrial confidence continues to improve.
Sweden’s coronavirus-related deaths have been trending lower.
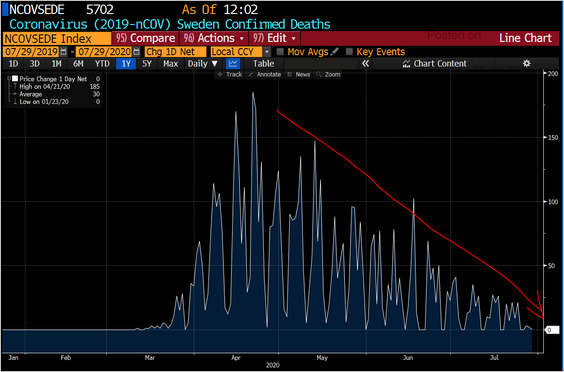 Source: @Trinhnomics
——————–
2. The second wave, especially in Spain, is worrisome.
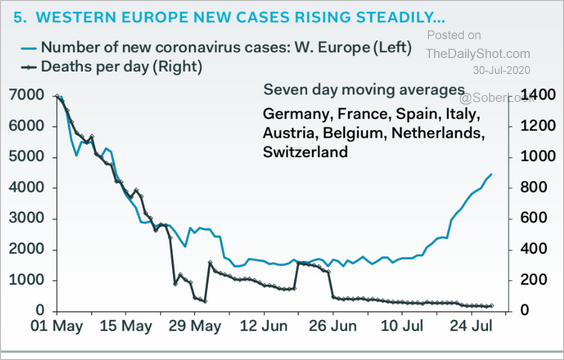 Source: Pantheon Macroeconomics
Asia – Pacific
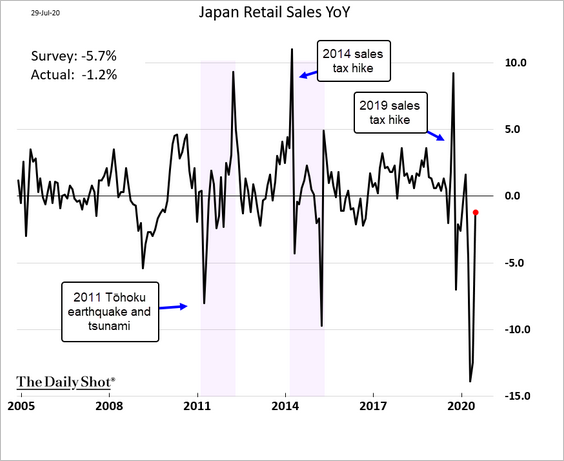
1. Japan’s June retail sales topped economists’ forecasts.
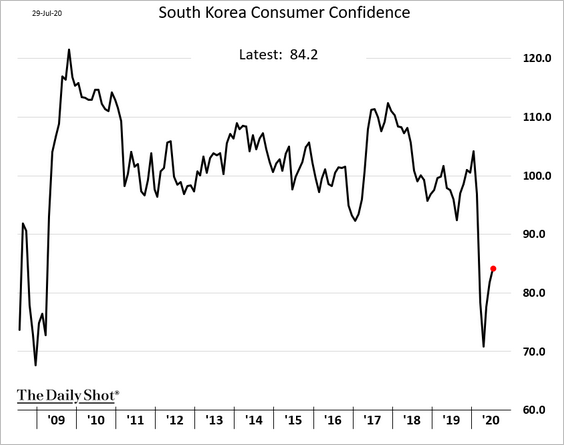
2. South Korea’s consumer confidence showed a modest improvement this month.
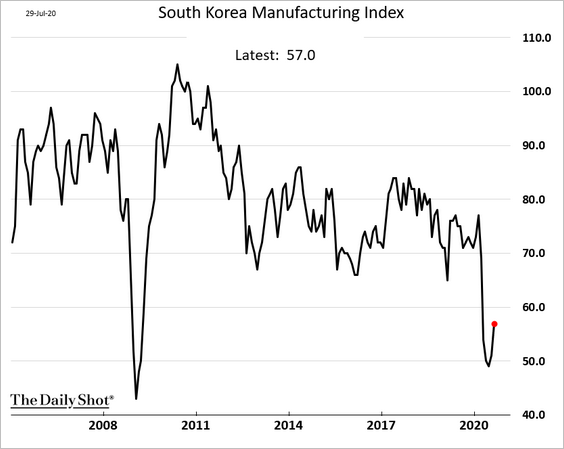
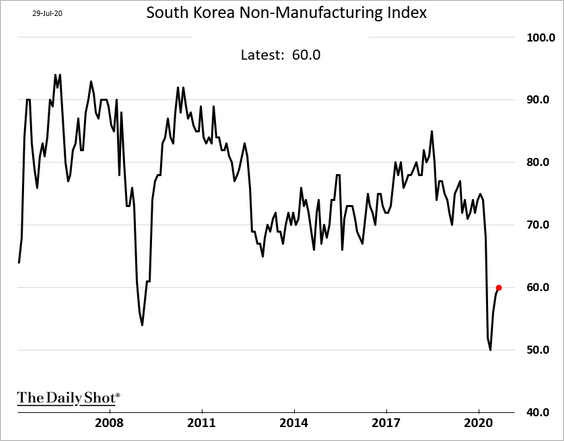
Business activity remains soft (per BoK).
• Manufacturing:
• Non-manufacturing:
——————–
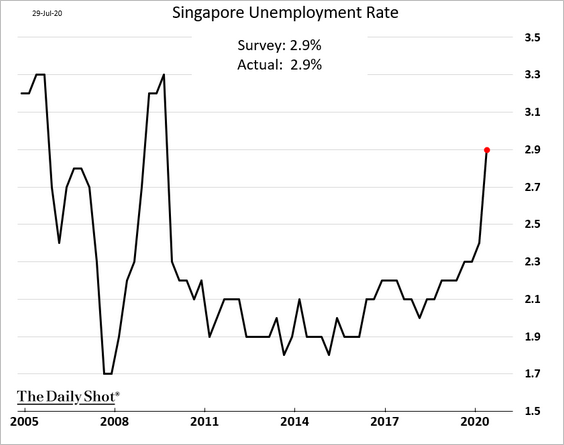
3. Singapore’s unemployment rate rose sharply in Q2.
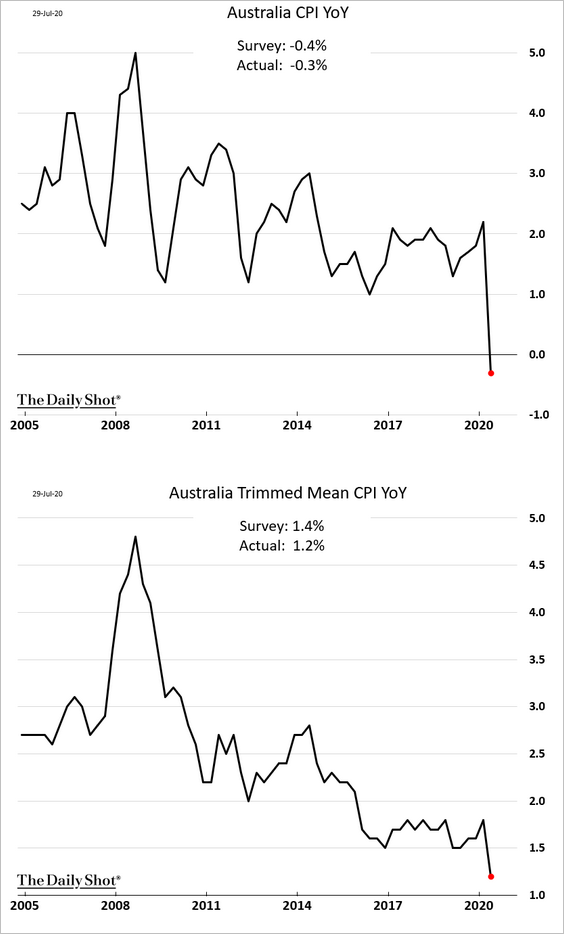
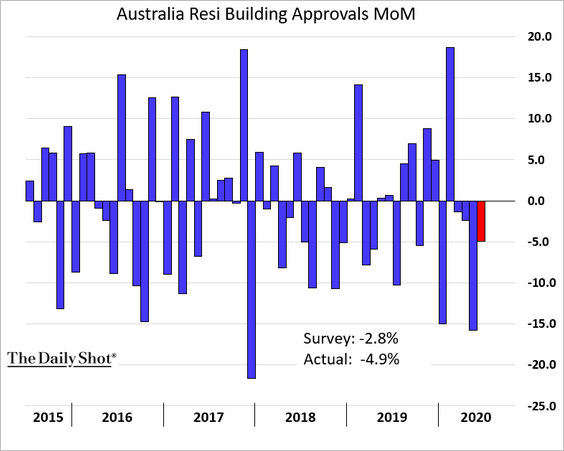
4. Next, we have a couple of updates on Australia.
• Inflation was subdued in Q2.
• Residential building approvals declined for the fourth month in a row in June.
China
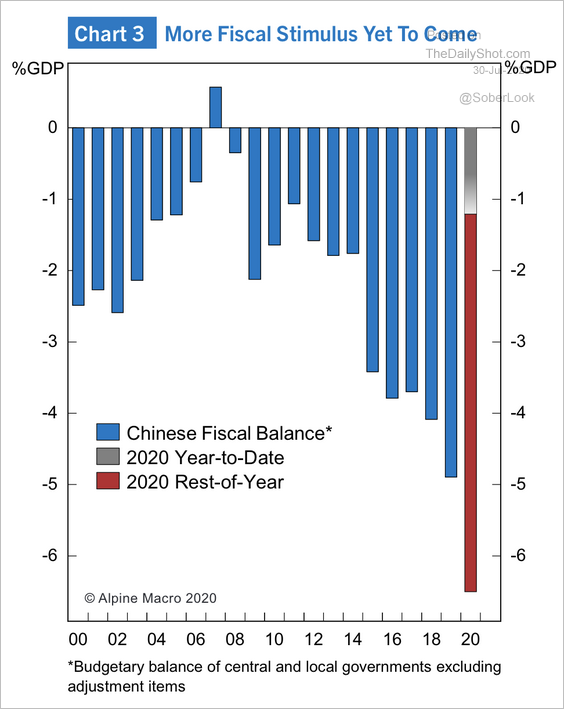
1. A majority of China’s fiscal boost will come in the second half of the year, according to Alpine Macro.
 Source: Alpine Macro
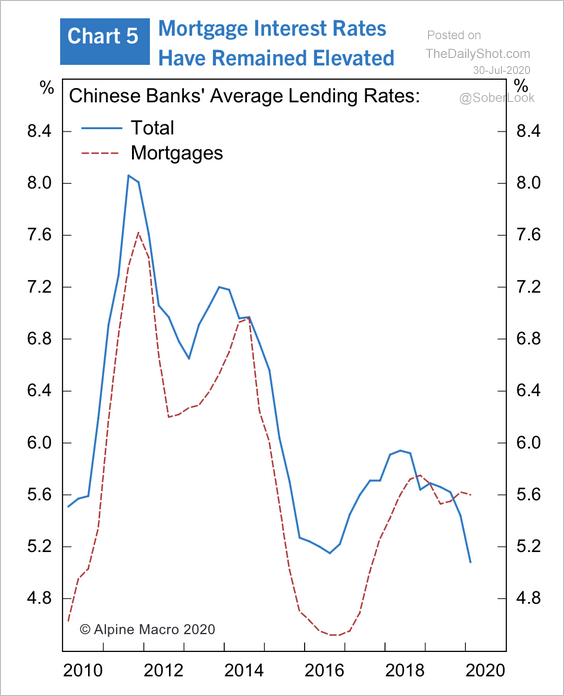
2. Mortgage rates remain elevated.
 Source: Alpine Macro
Nonetheless, borrowing in Tier-II cities has accelerated.
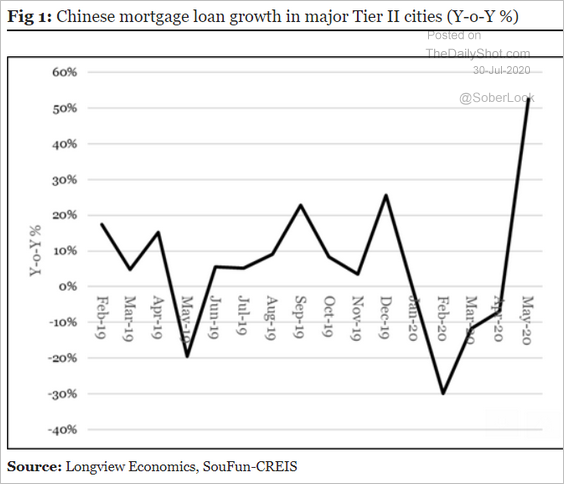 Source: Longview Economics
——————–
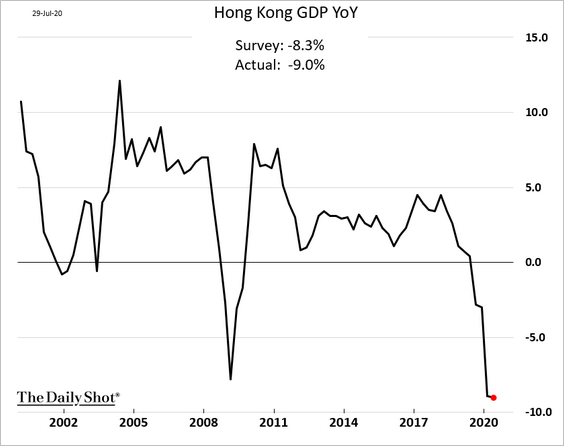
3. Hong Kong’s economy weakened further in the second quarter – now down 9% from a year ago.
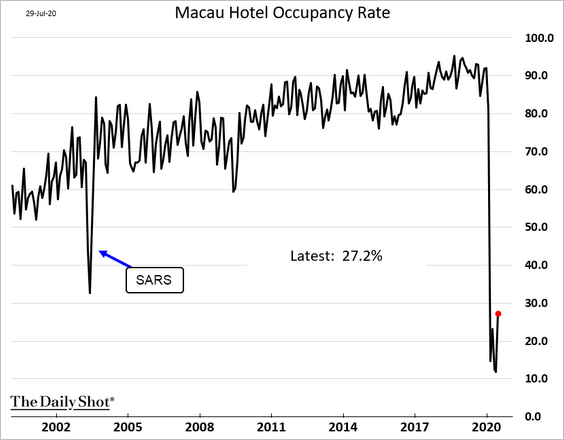
4. Macau hotel occupancy bounced from extreme lows, but levels are still well below what we saw during the SARS outbreak.
Emerging Markets
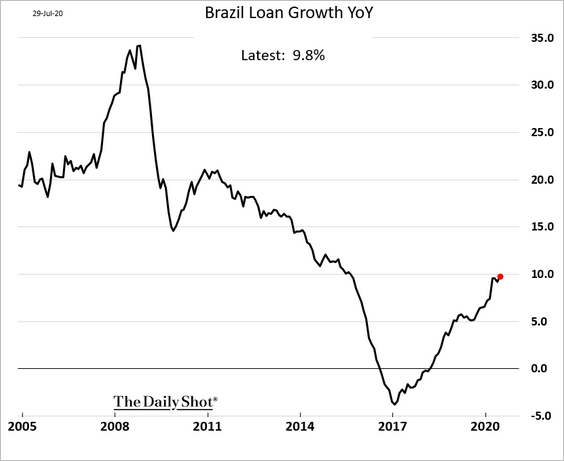
1. Brazil’s loan growth continues to strengthen.
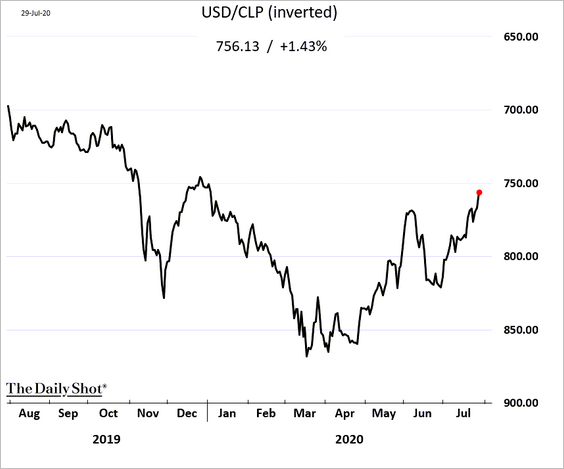
2. The Chilean peso is approaching this year’s high amid a rebound in industrial metals.
3. The LatAm economic sentiment index remains depressed.
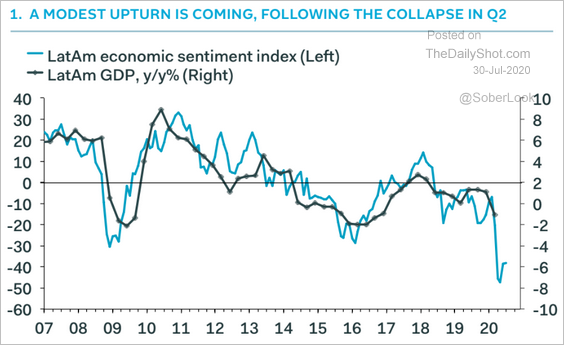 Source: Pantheon Macroeconomics
4. Slowing demand has caused imports to plunge across EM.
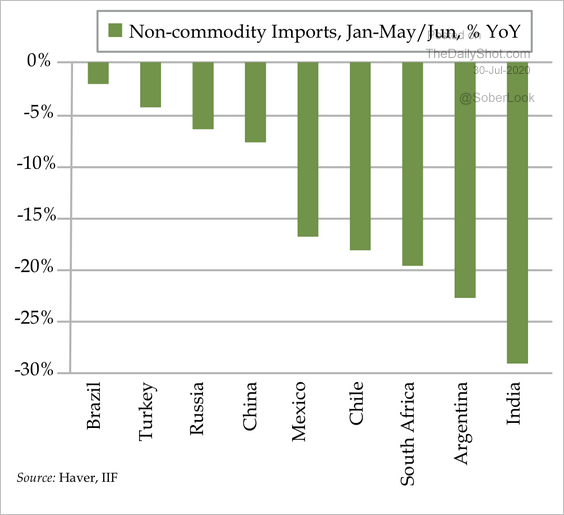 Source: Quill Intelligence
5. EM stocks formed a golden cross.
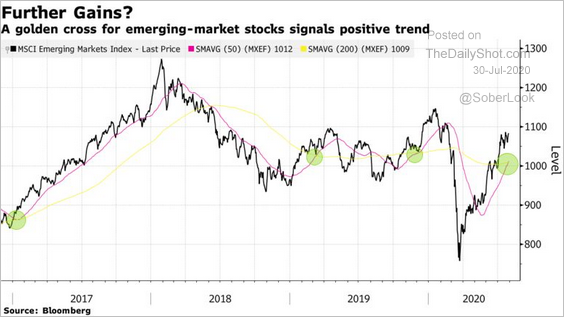 Source: @markets Read full article
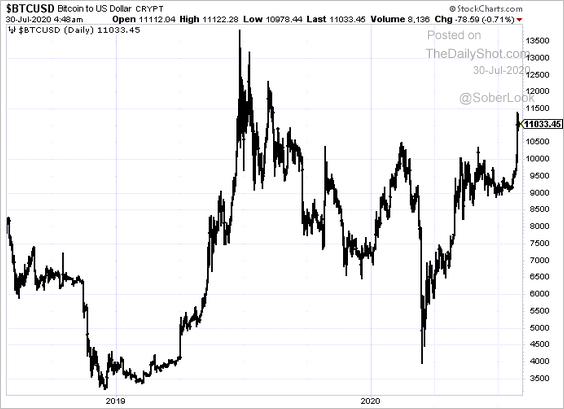
Cryptocurrency
1. Bitcoin blasted past $11k.
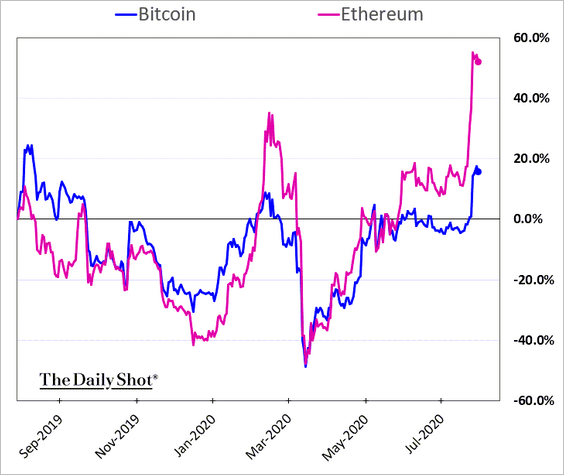
2. Ethereum has outperformed Bitcoin by some 40% since May.
Commodities
1. Gold has decoupled from real rates.
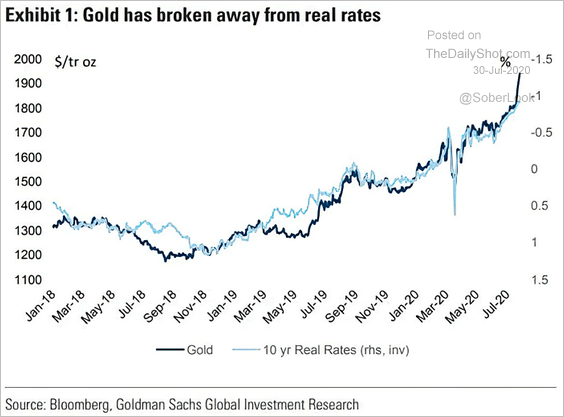 Source: @ISABELNET_SA, @GoldmanSachs
Gold’s correlation to risk-on and risk-off assets has declined this year.
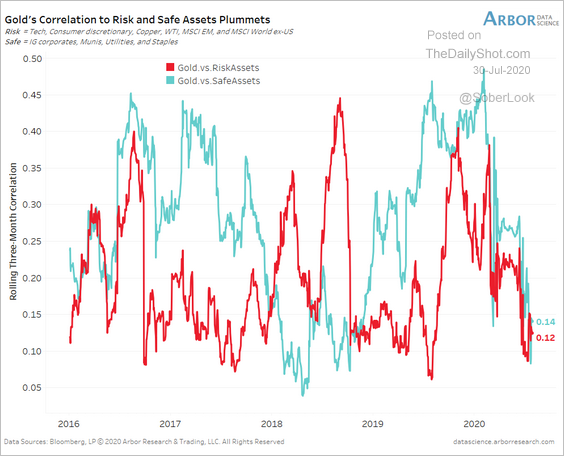 Source: Arbor Research & Trading
——————–
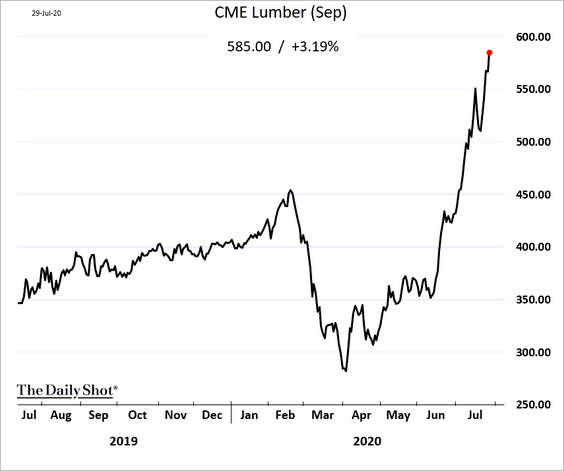
2. The rally in US lumber futures has been impressive.
Energy
1. Brent crude 20-day realized volatility is at the lowest level of the year.
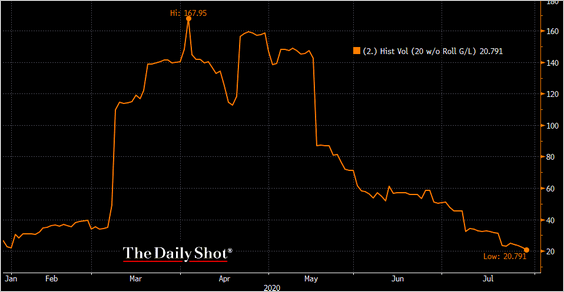 Source: @TheTerminal
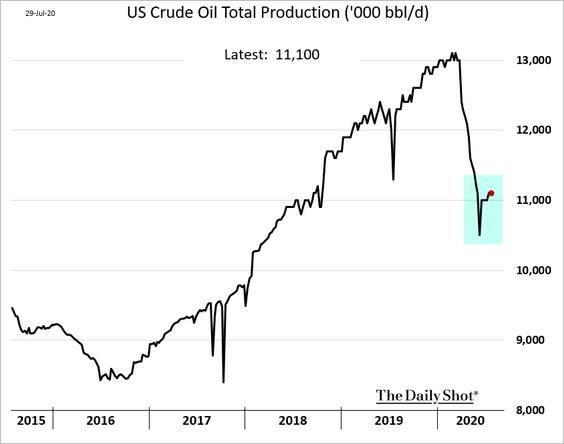
2. Will US oil production continue to recover?
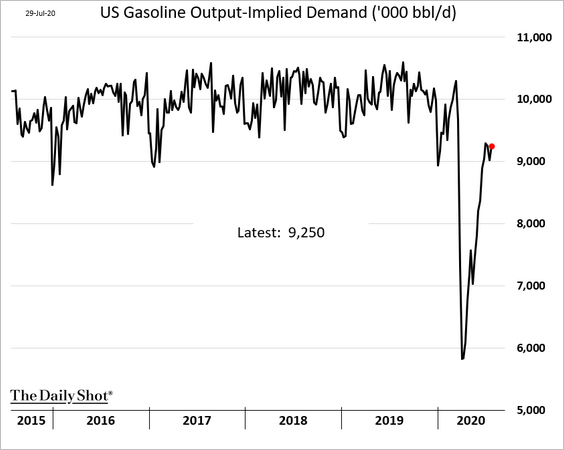
3. US gasoline demand is still relatively soft for this time of the year.
• Jet fuel consumption remains extremely weak.
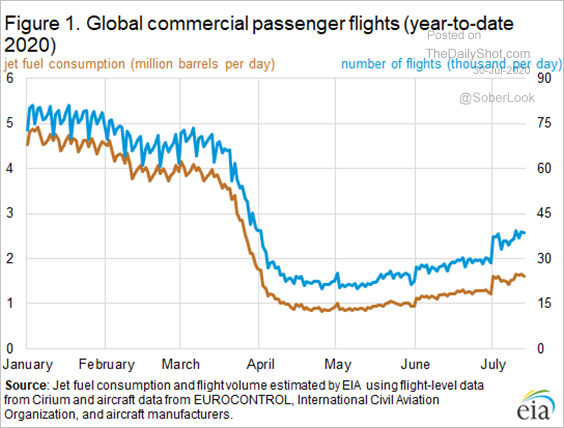 Source: EIA Read full article
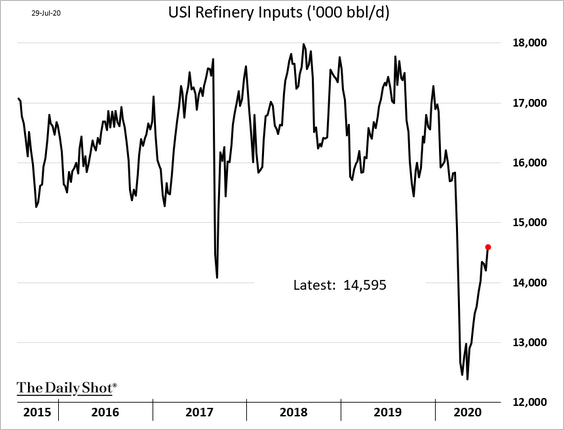
• Refinery inputs continue to recover.
——————–
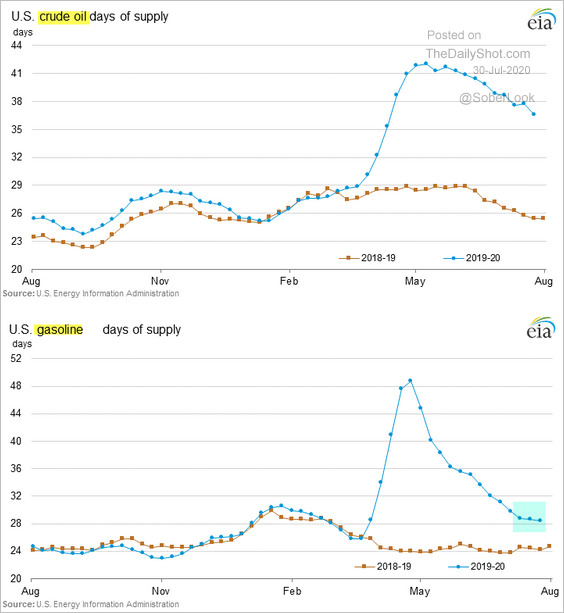
4. The reduction in gasoline stockpiles has stalled (2nd panel).
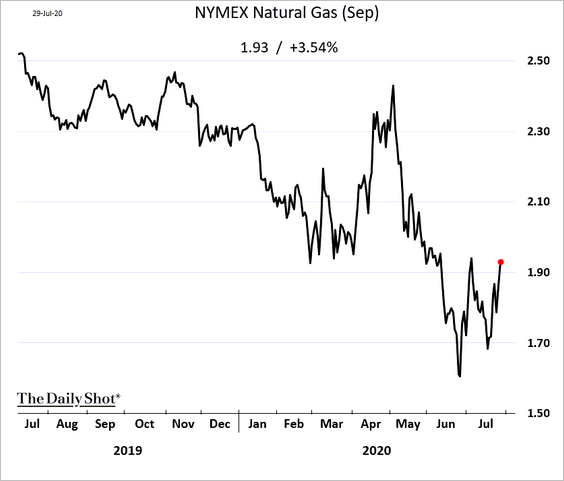
5. US natural gas futures are holding up despite rising inventories.
Equities
1. Let’s start with another look at tech and the mega-cap shares.
• The spread between tech capitalization (% of S&P 500) and sales (% of GDP) is not as extreme as it was during the dot-com bubble.
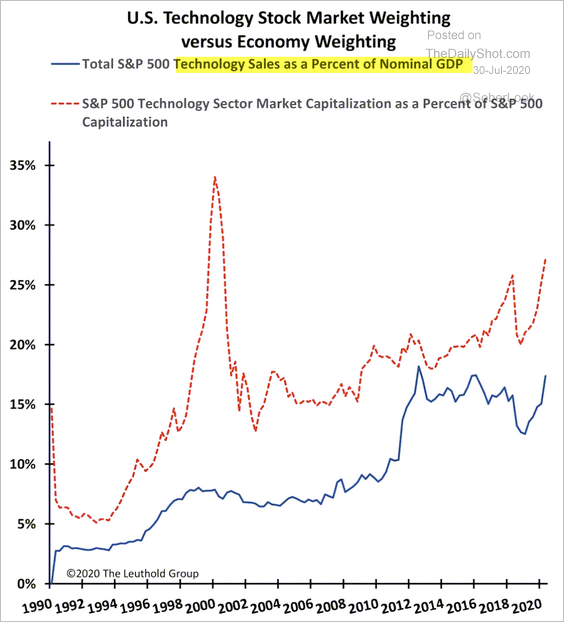 Source: @LeutholdGroup, Business Insider Read full article
• Nonetheless, here is the Nasdaq 100/S&P 500 ratio.
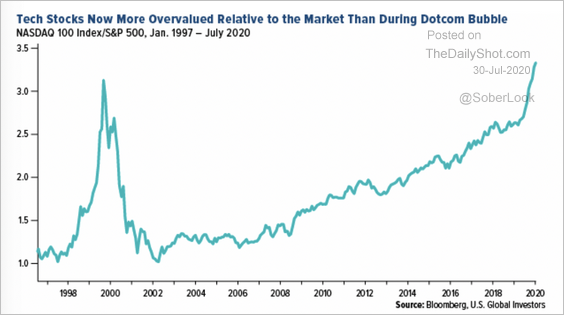 Source: US Global Investors Read full article
• Upside options bets on the tech mega-caps are at an extreme.
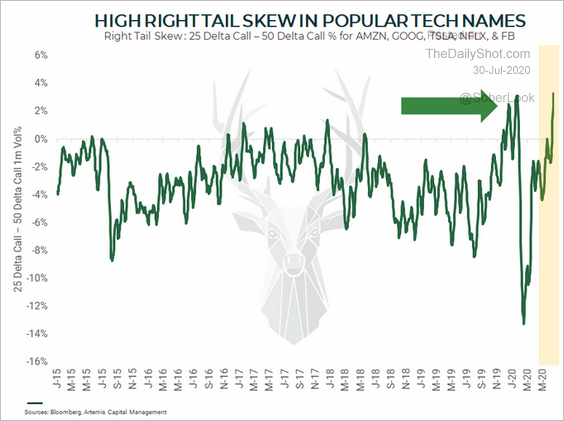 Source: @vol_christopher
• Active mutual funds’ exposure to mega-cap growth stocks has been declining from very elevated levels.
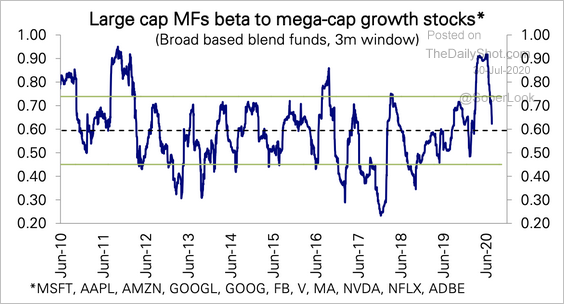 Source: Deutsche Bank Research
• Next, we have the contribution of the top five S&P 500 stocks to the S&P 500 earnings (EPS), valuation (P/E), and returns.
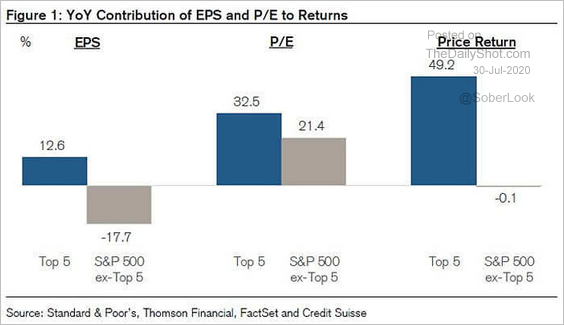 Source: @ISABELNET_SA, @csresearch
• How is the contribution of the top five stocks different now vs. in 2000?
– Sales growth:
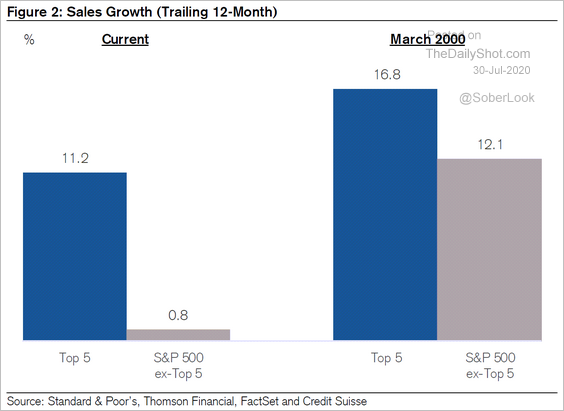 Source: @johnauthers, @CreditSuisse
– Margins:
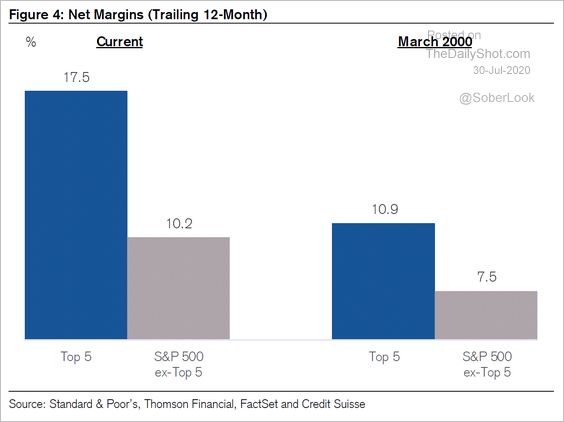 Source: @johnauthers, @CreditSuisse
– Leverage:
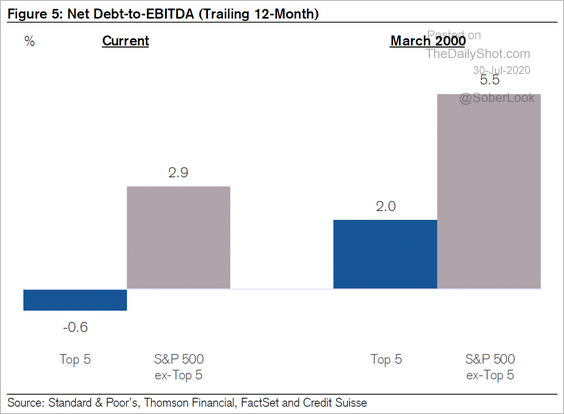 Source: @johnauthers, @CreditSuisse
——————–
2. Earnings and sales estimates have been too gloomy (2 charts).
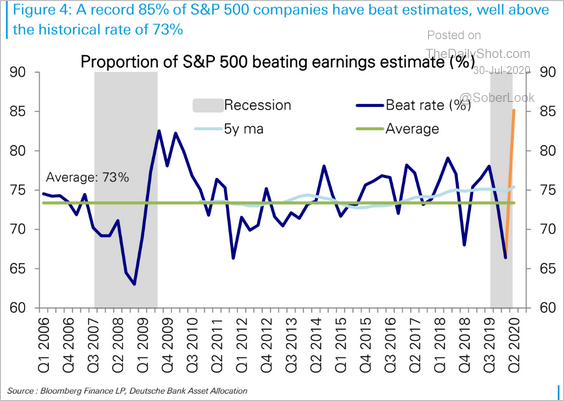 Source: Deutsche Bank Research
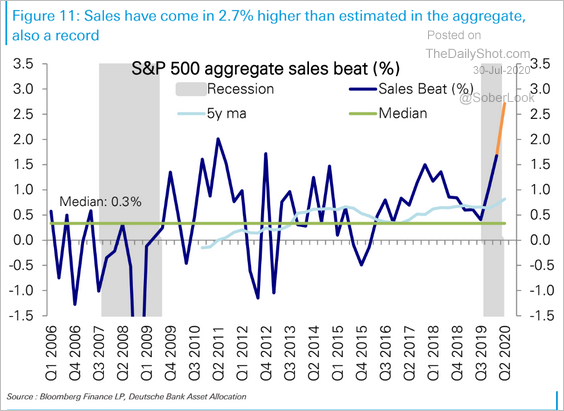 Source: Deutsche Bank Research
But analysts got it wrong on both sides (an indication of extreme uncertainty).
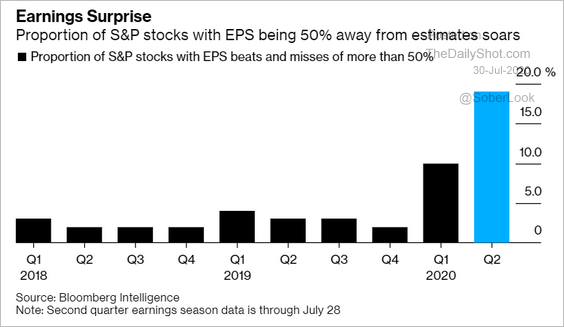 Source: @markets Read full article
——————–
3. US firms have been raising outlook (2 charts).
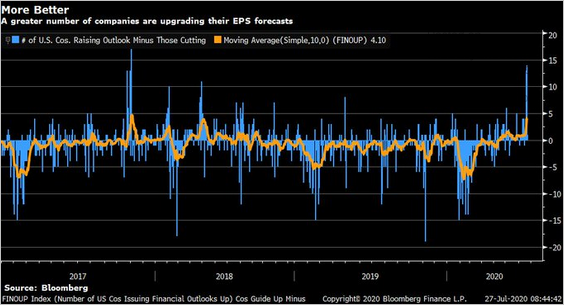 Source: @LizAnnSonders, @Bloomberg
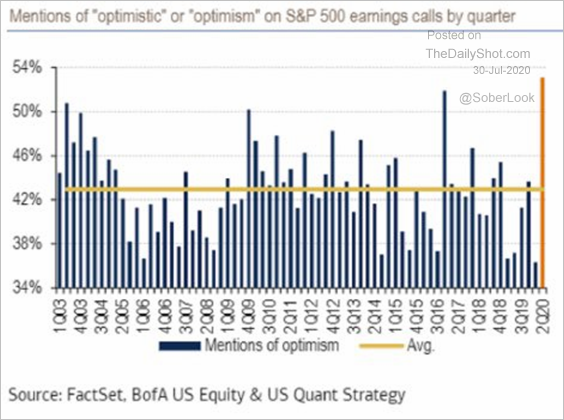 Source: @LizAnnSonders, @BankofAmerica
——————–
4. Joe Biden’s recent gains in the betting markets coincide with underperformance in pharma and bank stocks.
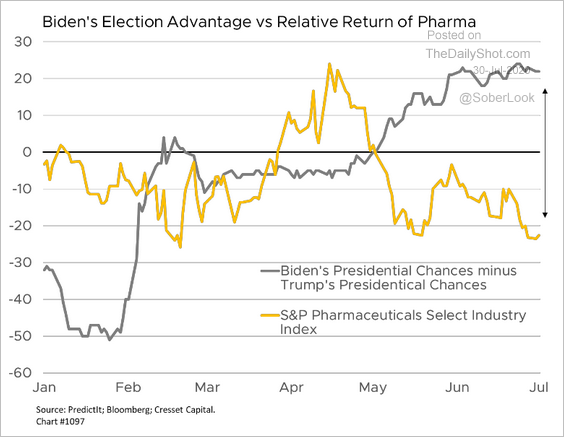 Source: Jack Ablin, Cresset Wealth Advisors
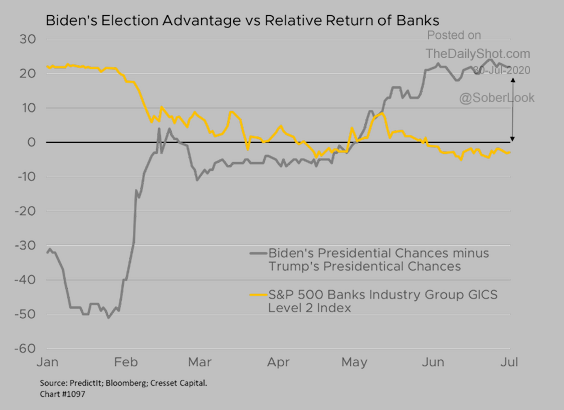 Source: Jack Ablin, Cresset Wealth Advisors
——————–
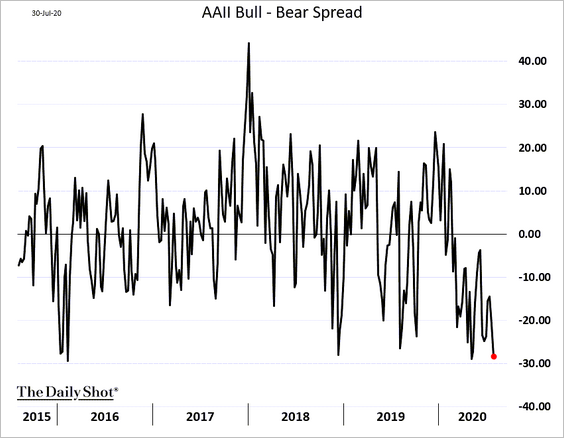
5. Retail trading activity remains elevated.
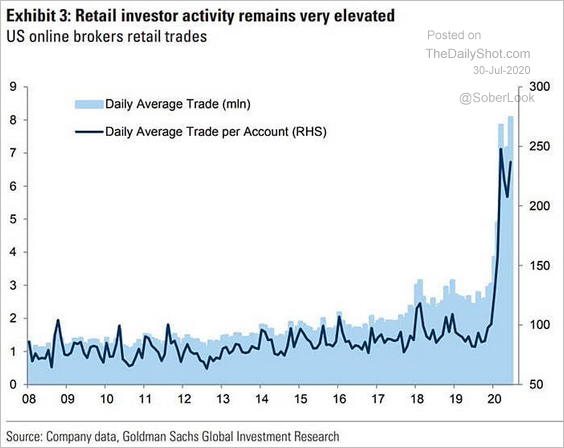 Source: @ISABELNET_SA, @GoldmanSachs
However, the AAII bull-bear spread shows caution among investors.
——————–
6. Value has outperformed growth for a brief period in June, which coincided with high short interest, according to SPDR Americas Research,
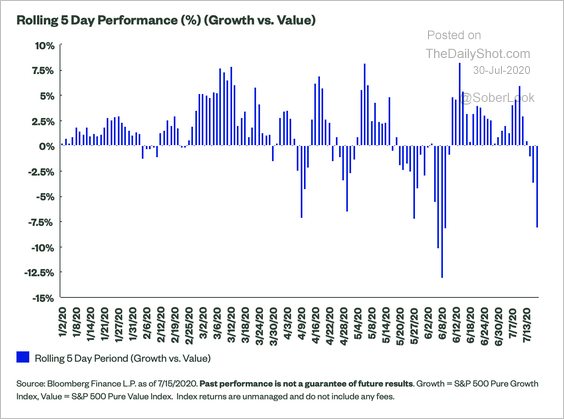 Source: SPDR Americas Research, @mattbartolini Read full article
7. According to Arbor Data Science, online search activity shows a growing interest in correlations and diversification.
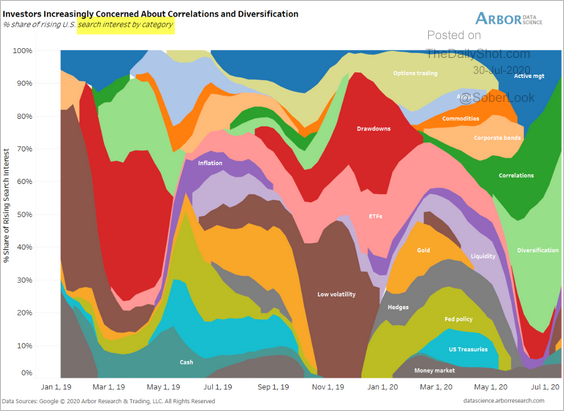 Source: Arbor Research & Trading
Rates
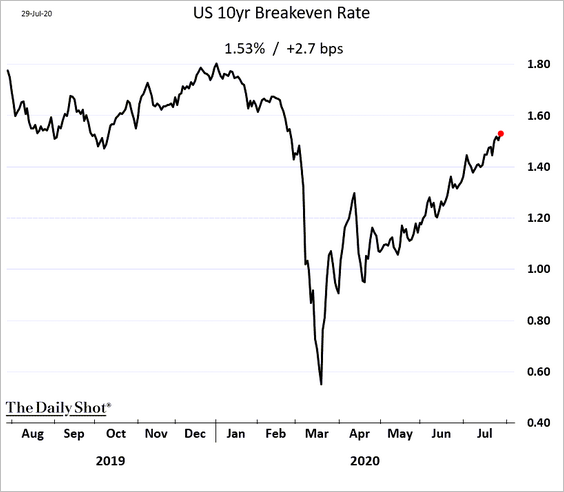
1. Long-term market-based inflation expectations continue to climb.
2. Below is the evolution of the Fed’s crisis programs.
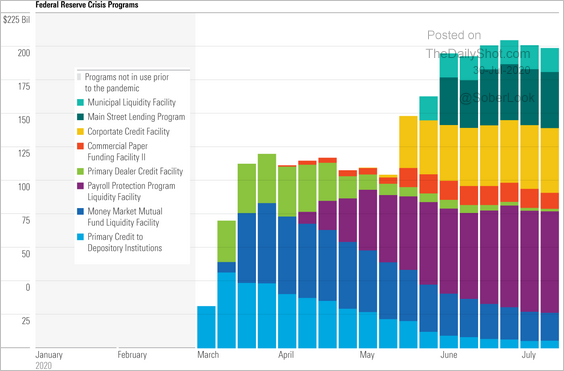 Source: Morningstar Read full article
3. Finally, here is the relative size and composition of the Fed’s and ECB’s balance sheets.
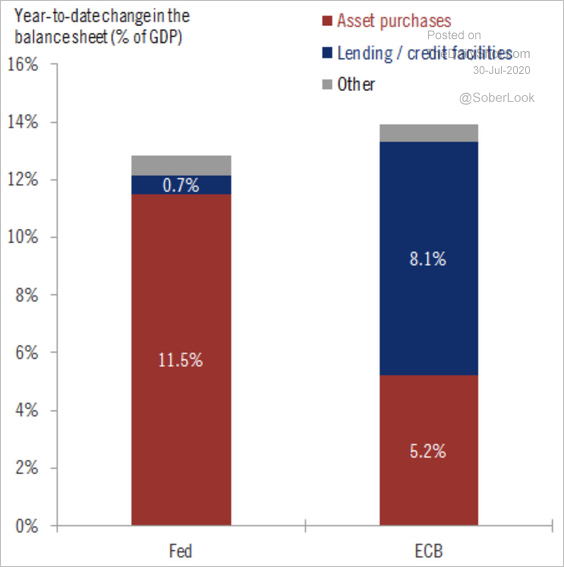 Source: @fwred
Global Developments
1. This chart shows returns by asset class year-to-date. So far, only sovereign debt is up across the board.
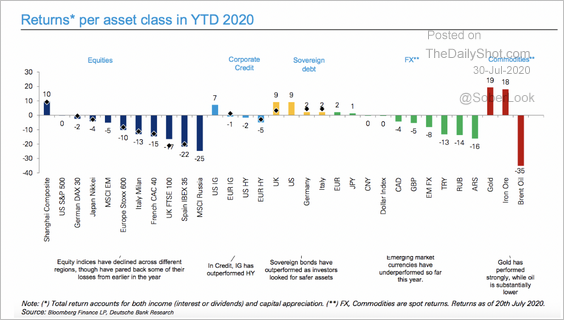 Source: Deutsche Bank Research
2. The US dollar is testing its long-term uptrend support.
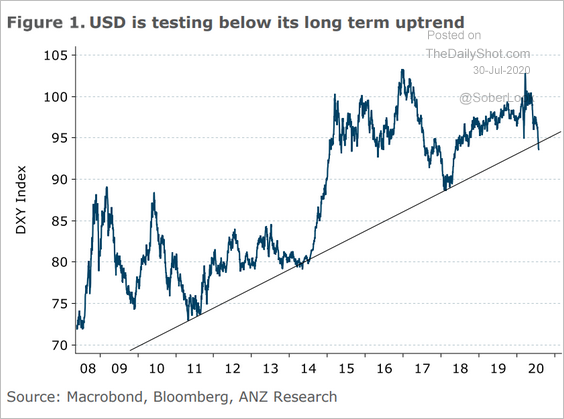 Source: ANZ Research
3. Yield compression has been unprecedented.
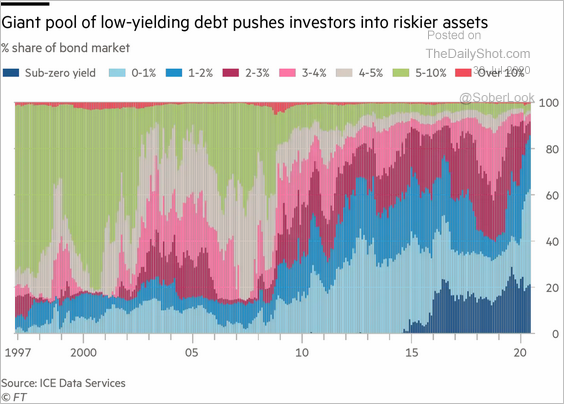 Source: @financialtimes Read full article
4. Finally, we have the correlations between consumer confidence and new coronavirus cases for select economies.
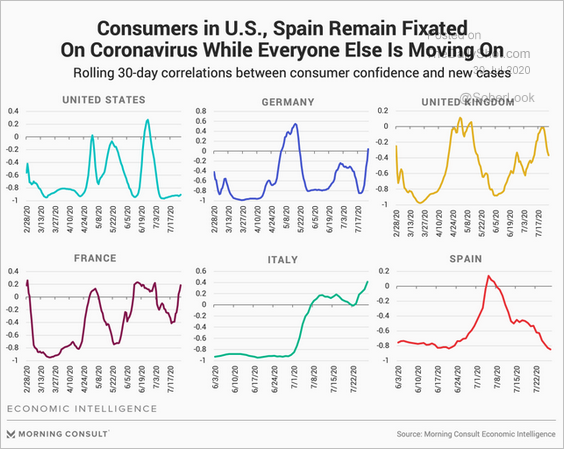 Source: @JohnCLeer, @MorningConsult Read full article
——————–
Food for Thought
1. Reopening plans at US colleges:
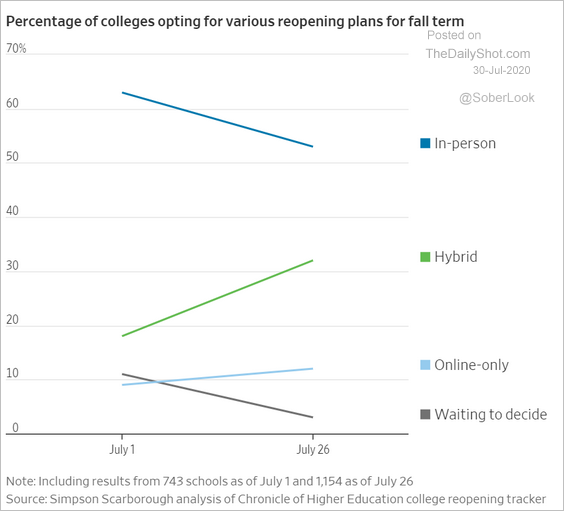 Source: @WSJ Read full article
2. US cannabis sales vs. other industries and goods:
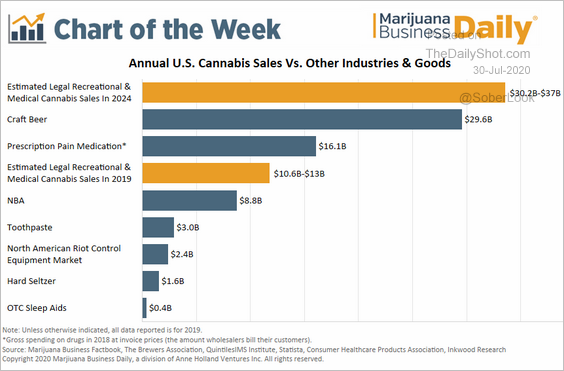 Source: Marijuana Business Factbook (Marijuana Business Daily) Read full article
3. Most valuable brands in 2020:
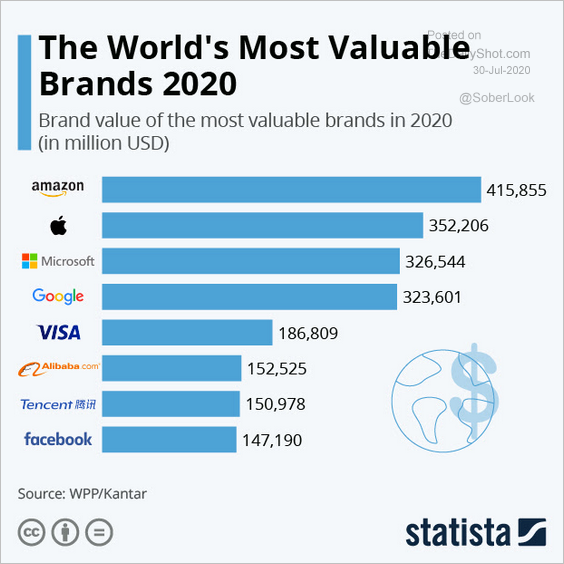 Source: Statista
4. Textile exports by country:
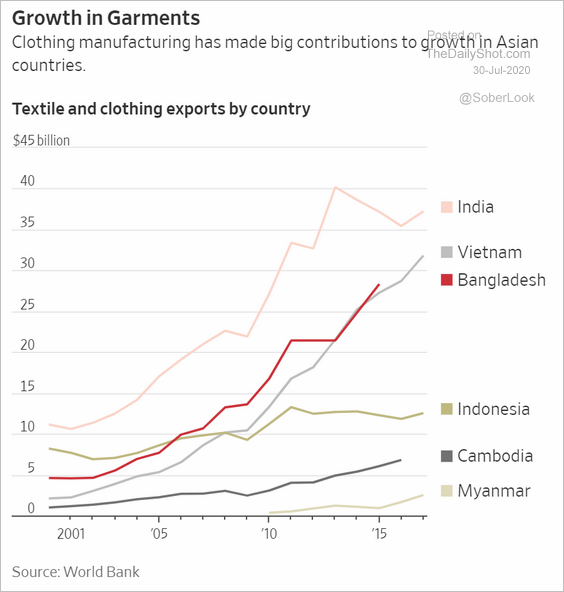 Source: @WSJ Read full article
5. Food insecurity in the US:
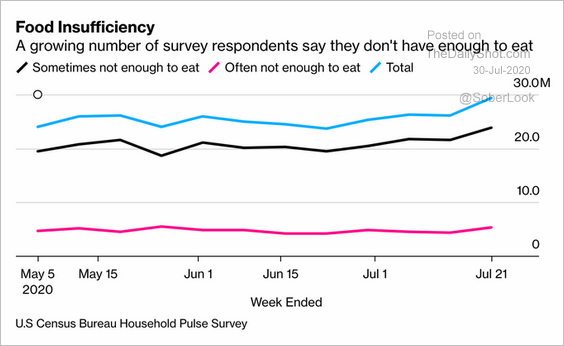 Source: @adam_tooze, @business Read full article
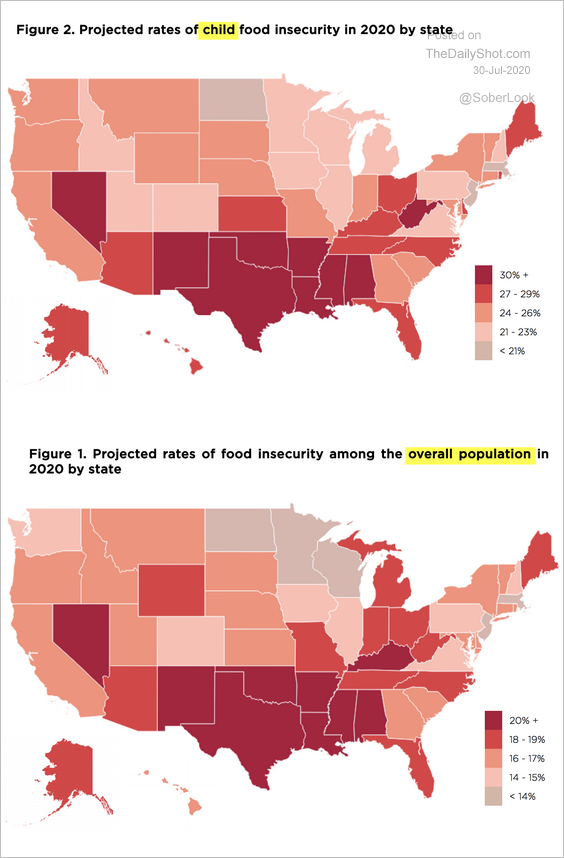 Source: Feeding America Read full article
——————–
6. Data on Democrats’ VP pick:
• National prominence:
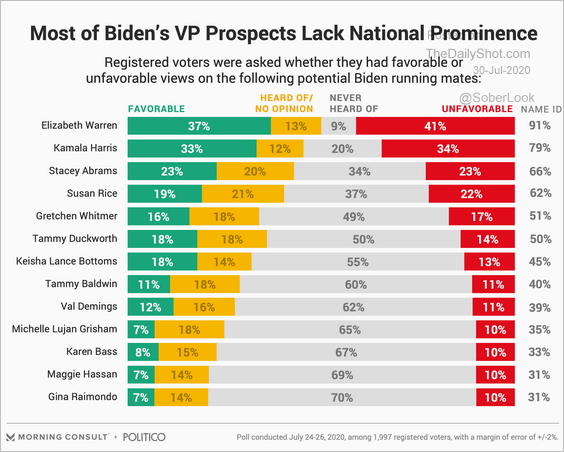 Source: Morning Consult Read full article
• The betting markets:
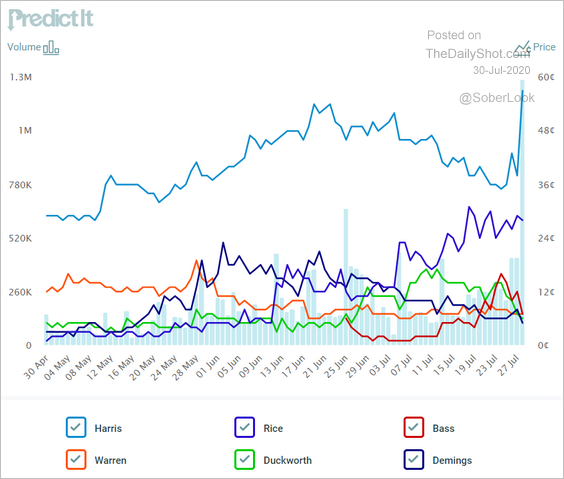 Source: @PredictIt
——————–
7. Threats facing the US:
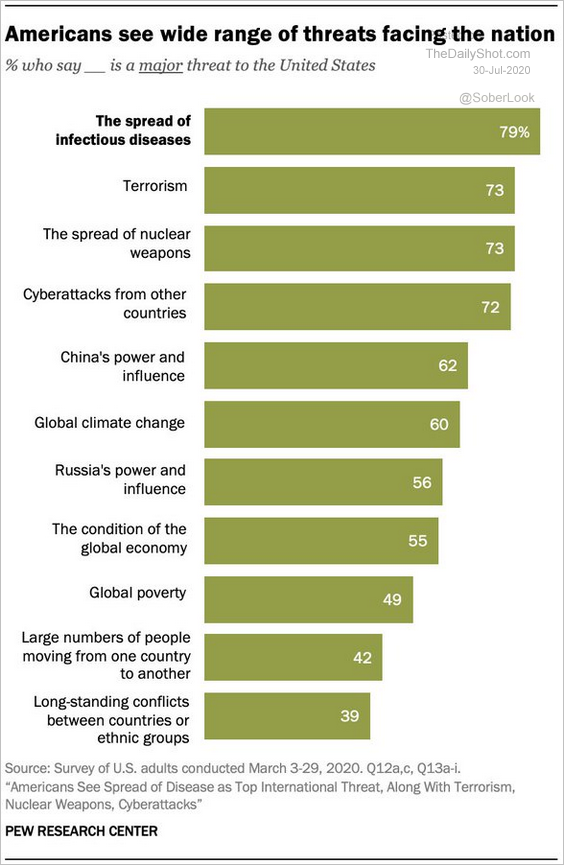 Source: @pewglobal Read full article
8. Sales tax by state:
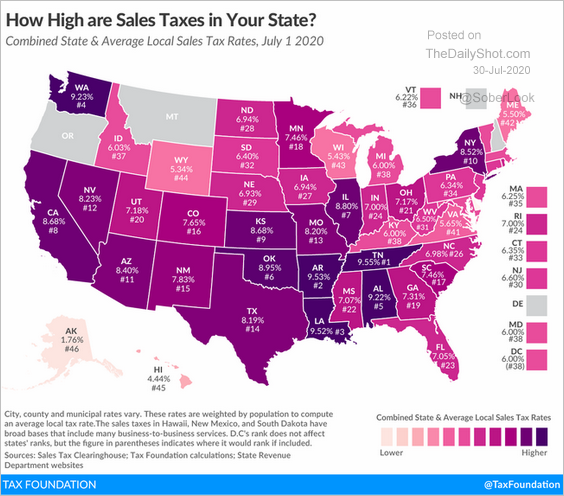 Source: @TaxFoundation Read full article
9. The world’s longest electric cable:
 Source: @wef Read full article
——————–
Please note that The Daily Shot will no longer be published by The Wall Street Journal beginning on August 1. The Daily Shot will still be available as an independent publication. If you would like to continue to receive The Daily Shot, you can get more information on how to subscribe here.