The Daily Shot: 04-Aug-20
• The United States
• The Eurozone
• Europe
• Japan
• Asia – Pacific
• China
• Emerging Markets
• Cryptocurrency
• Energy
• Equities
• Credit
• Rates
• Global Developments
• Food for Thought
The United States
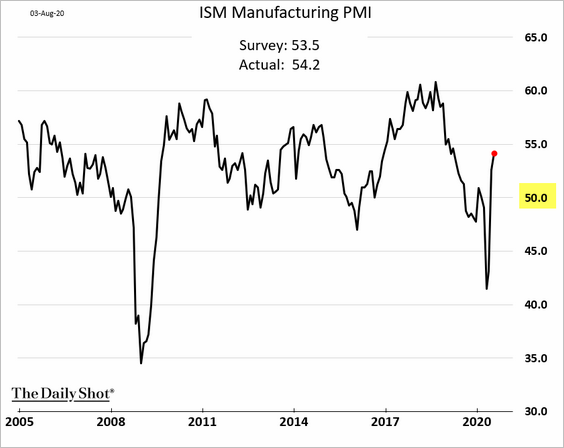
1. The ISM manufacturing PMI report showed US factory activity expanding at a faster pace in July.
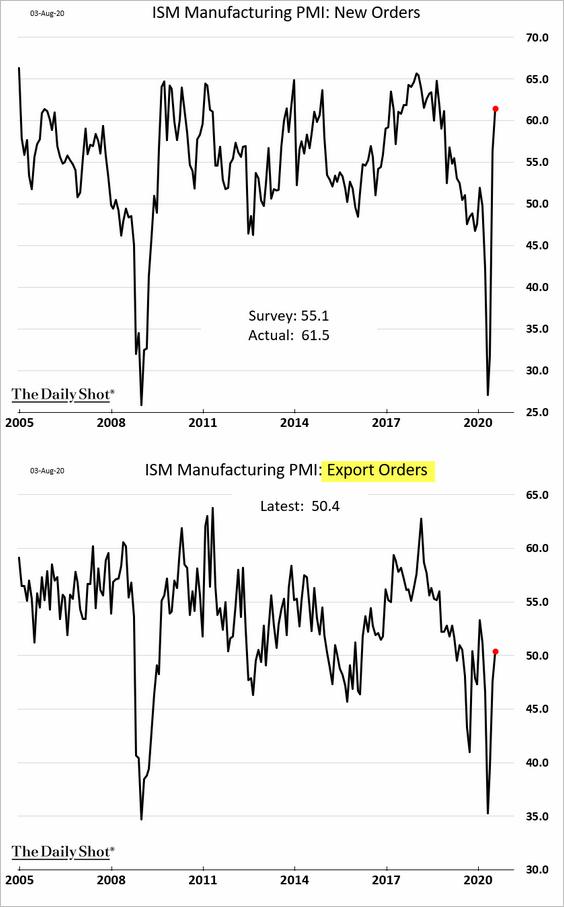
• New orders accelerated, while export orders returned to growth (PMI > 50).
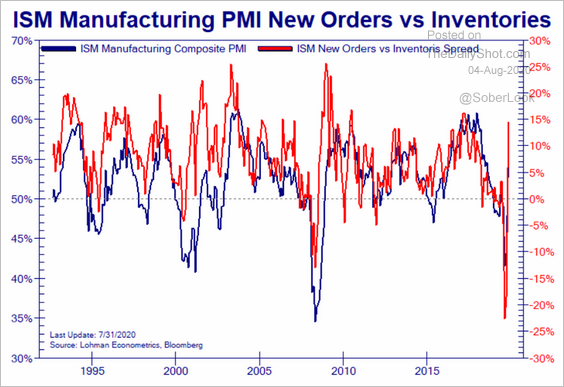
Factory orders point to further gains in the headline ISM index ahead.
 Source: @Not_Jim_Cramer
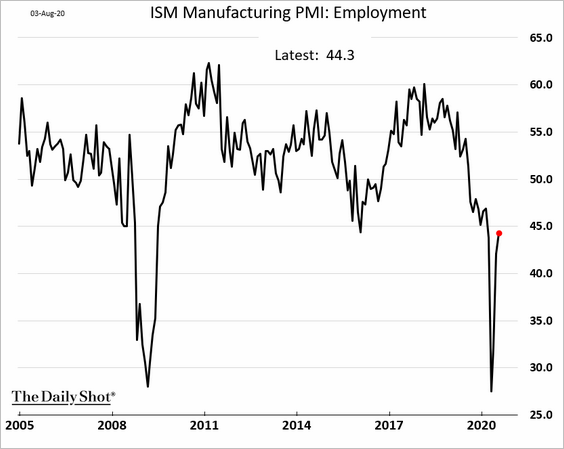
• However, manufacturing employment remains in contraction territory (2 charts).
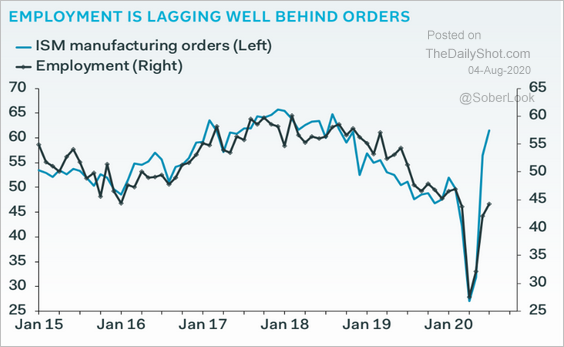 Source: Pantheon Macroeconomics
• Prices paid by factories are no longer declining.
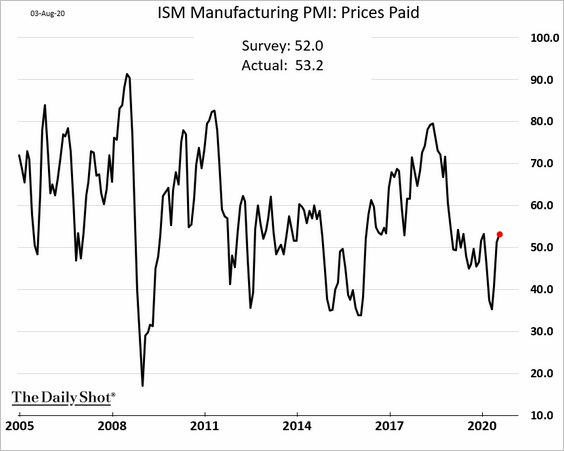
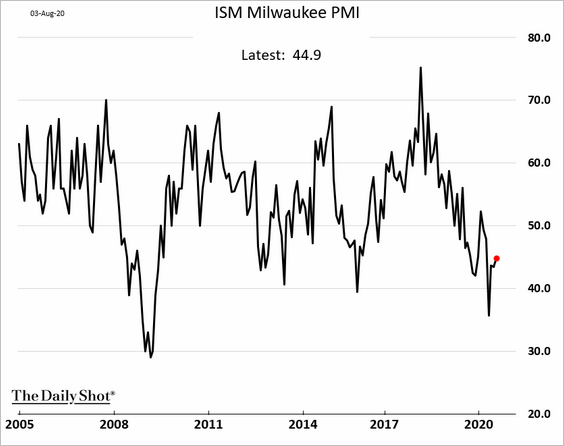
• Separately, the Milwaukee (regional) PMI has not yet returned to growth.
——————–
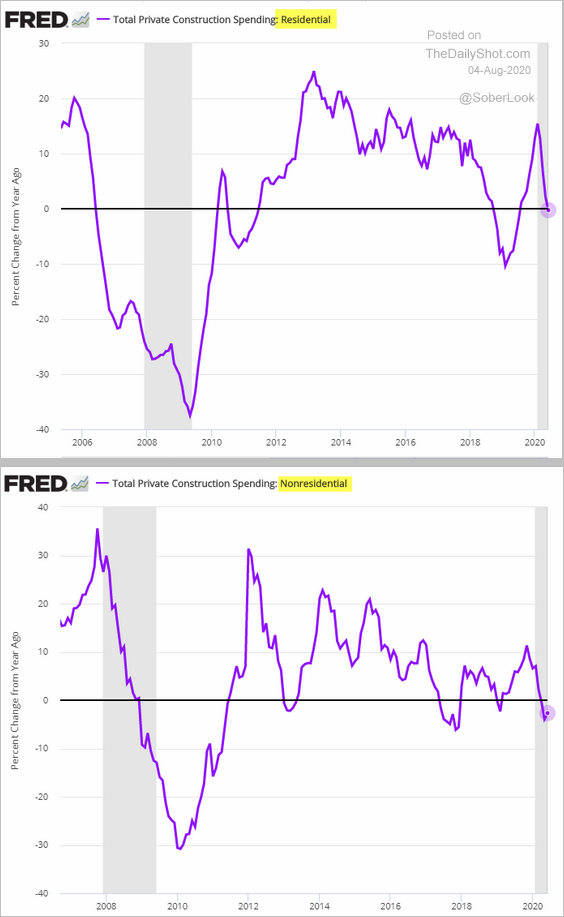
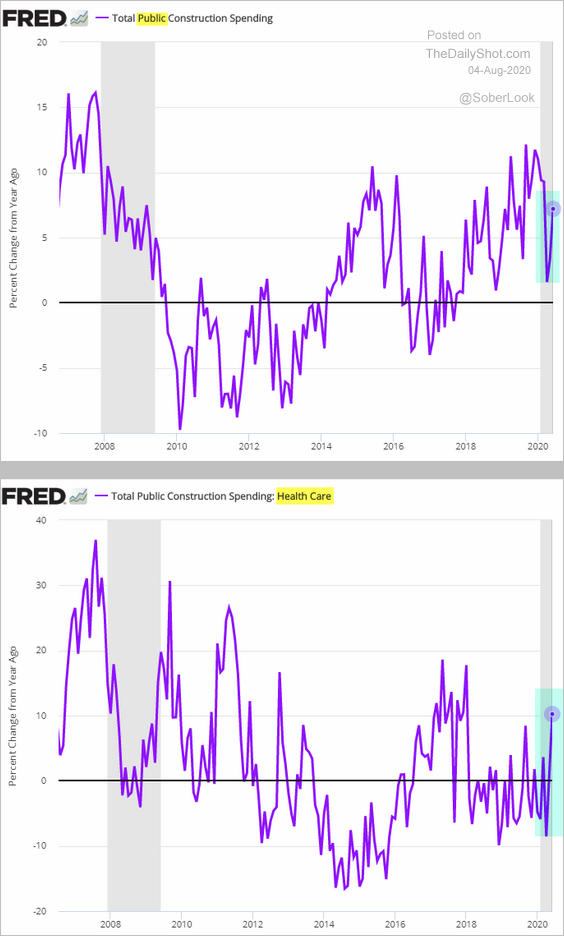
2. US construction spending declined for the fourth month in a row in June.
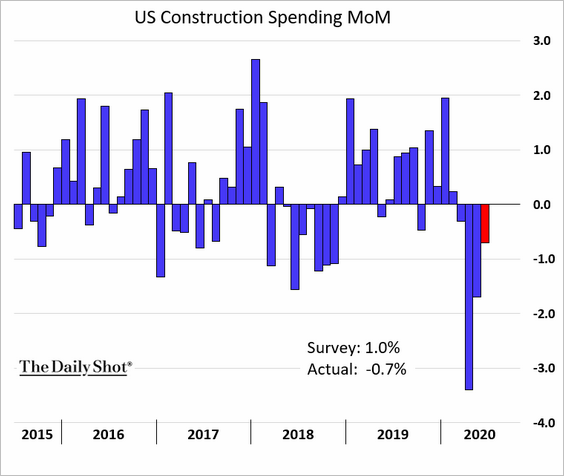
• Year-over-year growth in private construction spending has stalled.
• However, public construction expenditures strengthened, boosted by healthcare.
FEMA provided some of the funds.
 Source: FEMA Read full article
——————–
3. Next, we have some updates on the labor market.
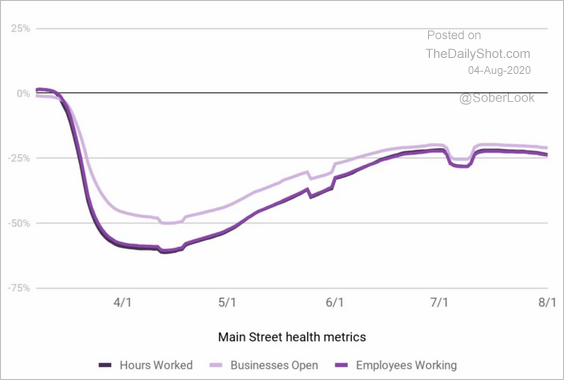
• Small business employment peaked in late June.
 Source: Homebase
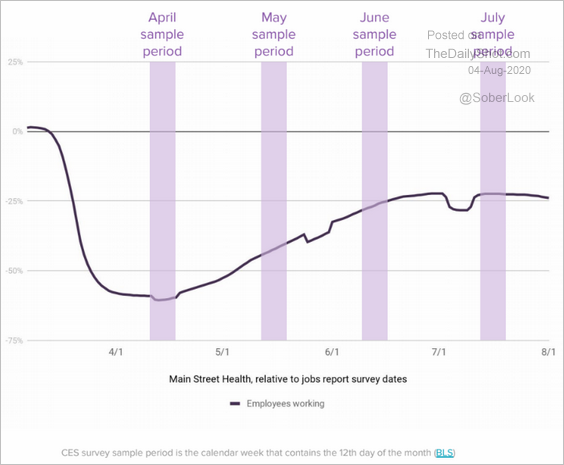
Because of the sampling periods, the July payrolls report will still incorporate gains in small business jobs.
 Source: Homebase
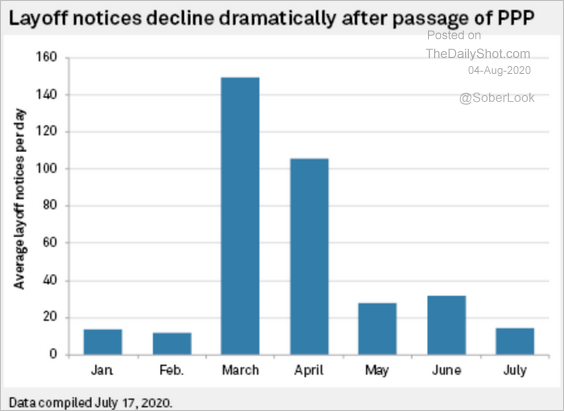
• PPP small business funding may have significantly curtailed layoffs.
 Source: S&P Global Market Intelligence
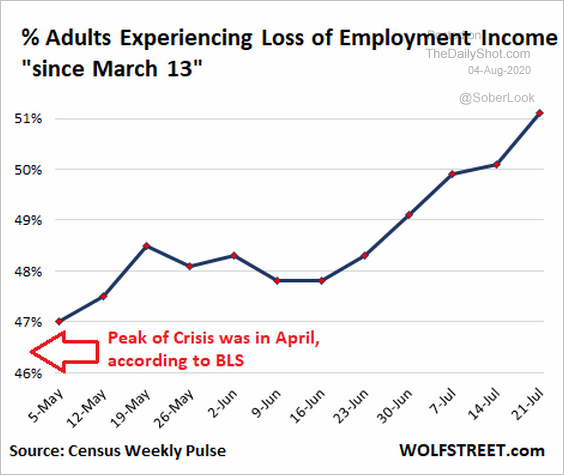
• The percentage of Americans experiencing loss of employment income keeps climbing.
 Source: @wolfofwolfst Read full article
——————–
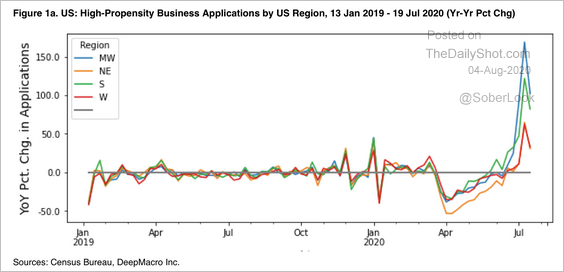
4. The Midwest registered the largest increase in business applications.
 Source: DeepMacro
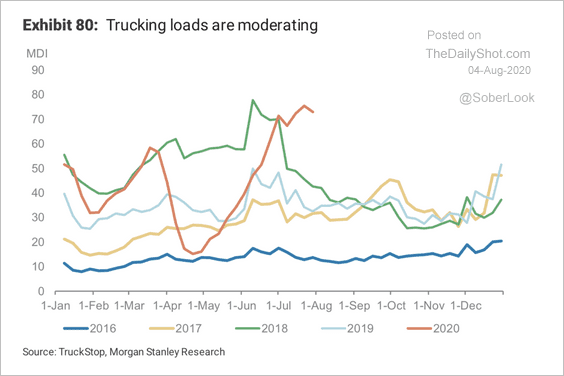
5. Trucking loads have rebounded sharply but appear to be moderating.
 Source: Morgan Stanley Research
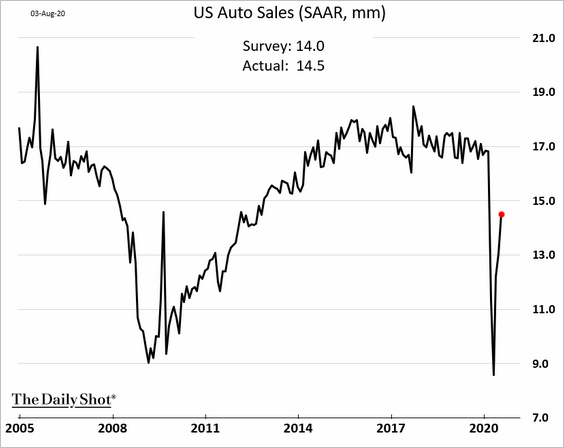
6. US vehicle sales improved further in July.
 Source: WARD’s Automotive Group
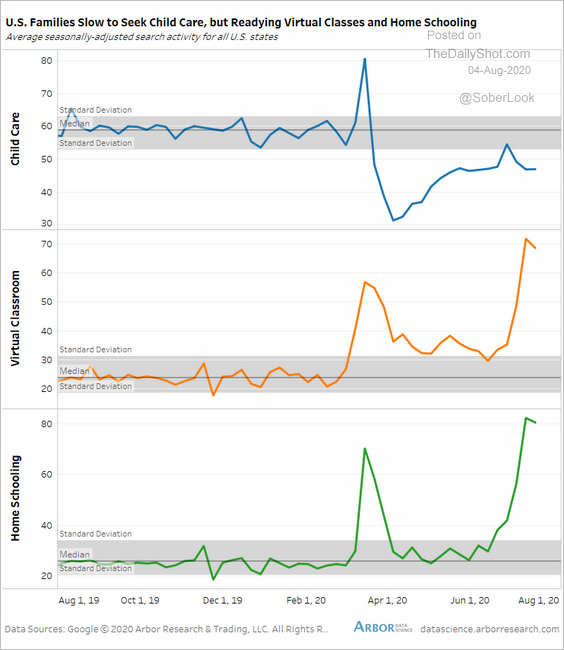
7. School and daycare closings will create a substantial drag on the nation’s GDP growth.
 Source: Arbor Research & Trading
The Eurozone
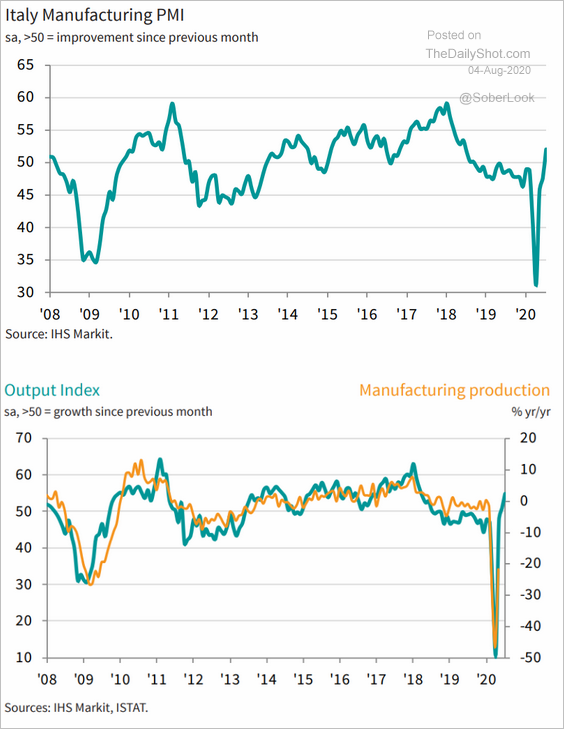
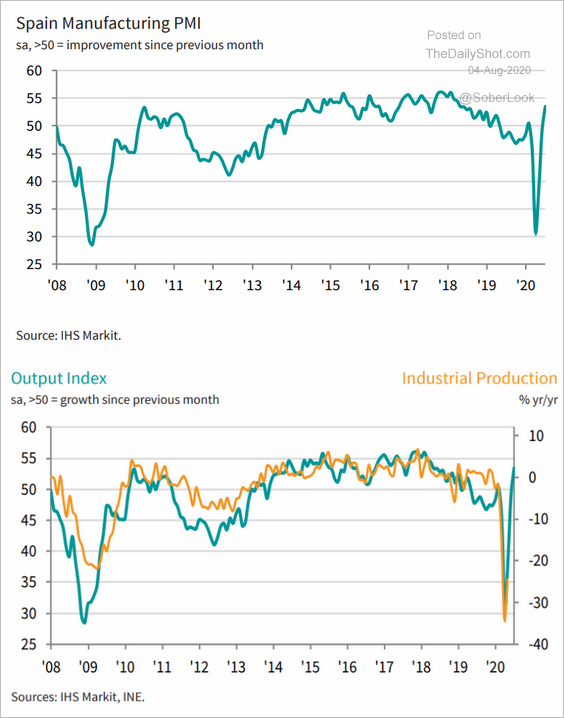
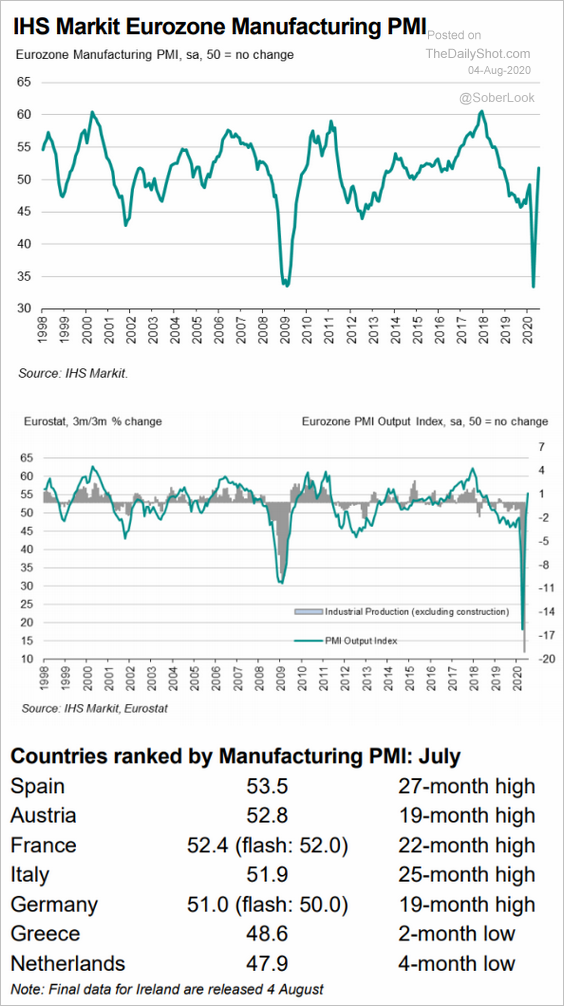
1. European manufacturing is back in growth mode. Earlier, we saw the PMI gains in Germany and France. Below, we have factory activity trends for Italy and Spain.
• Italy:
 Source: World Economics Read full article
• Spain:
 Source: World Economics Read full article
Here is the final PMI at the Eurozone level (firmly in growth territory).
 Source: World Economics Read full article
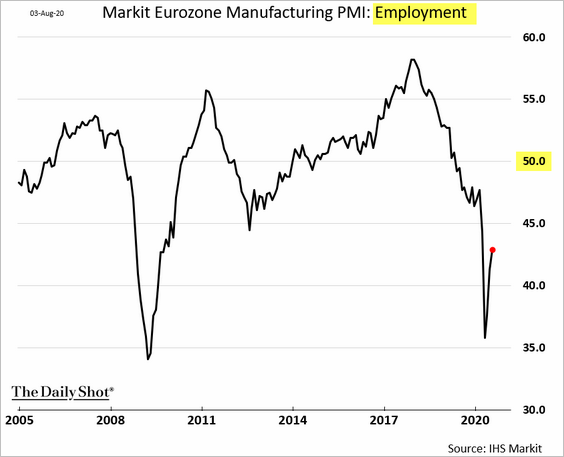
However, just like in the US, employment remains in contraction territory.
——————–
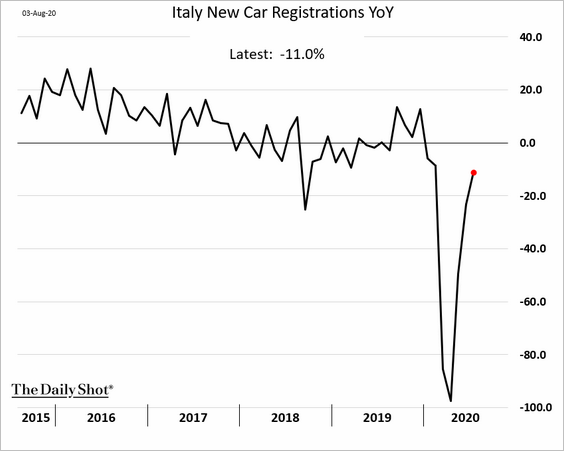
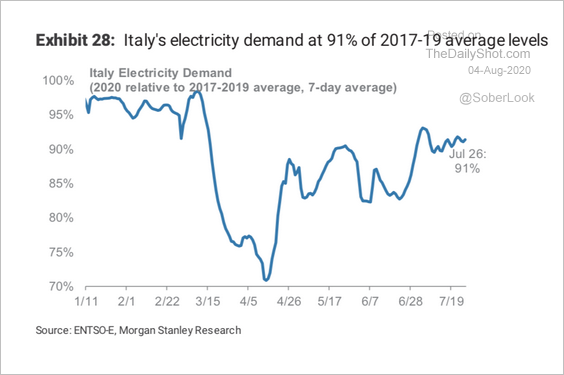
2. Here are a couple of additional charts on Italy.
• New car registrations (year-over-year):
• Electricity demand:
 Source: Morgan Stanley Research
——————–
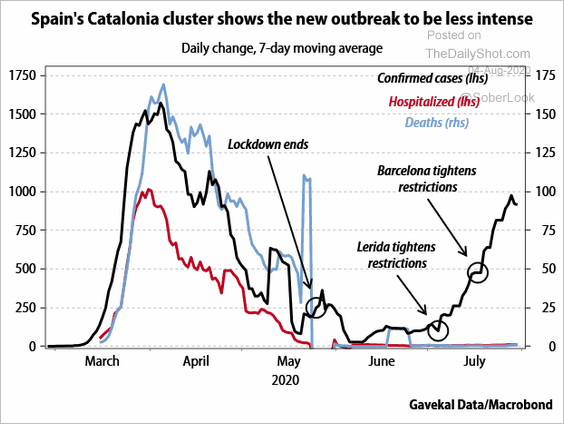
3. Spain’s second wave appears to be less deadly.
 Source: Gavekal
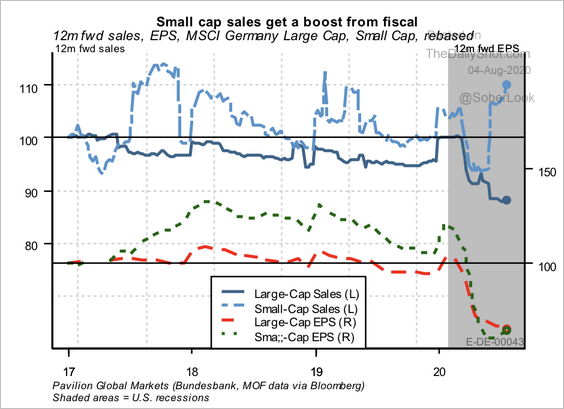
4. Sales are rising for German small-cap firms.
 Source: Pavilion Global Markets
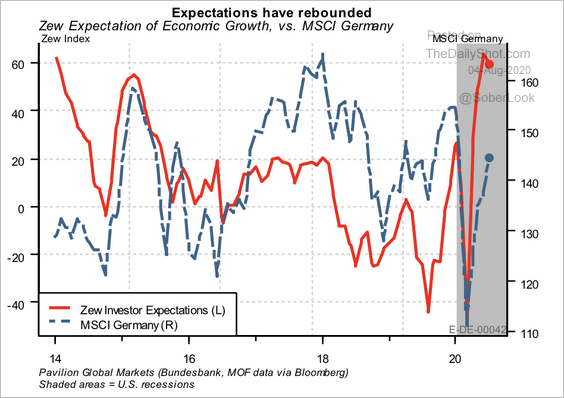
Separately, the increase in investor expectations could provide a further lift for German equities.
 Source: Pavilion Global Markets
——————–
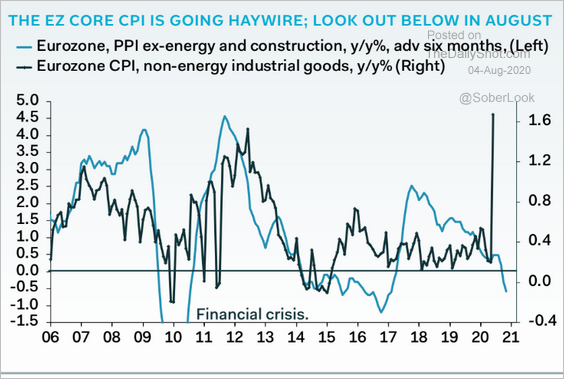
5. The July CPI bump is likely to be reversed this month.
 Source: Pantheon Macroeconomics
Europe
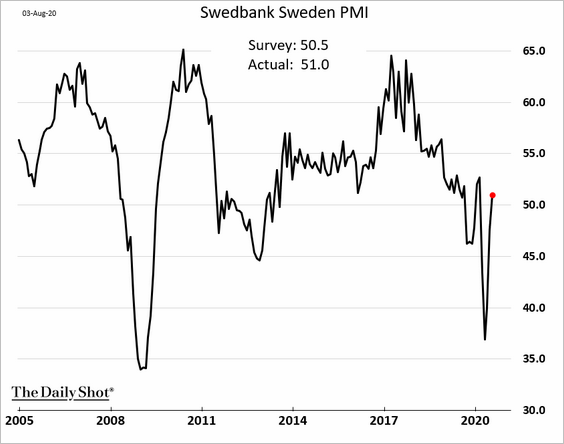
1. Sweden’s manufacturing returned to growth.
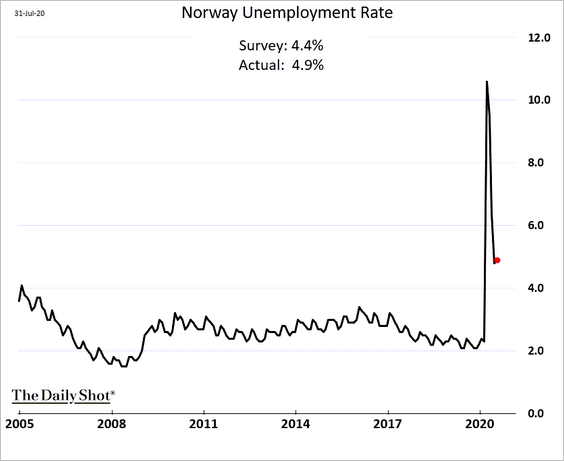
2. Norway’s unemployment rate unexpectedly paused in July.
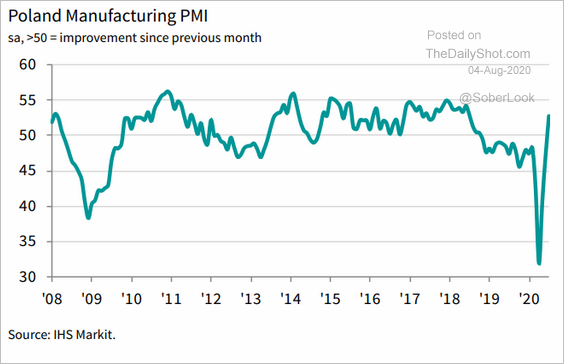
3. Poland’s factory activity accelerated with the Eurozone.
 Source: World Economics Read full article
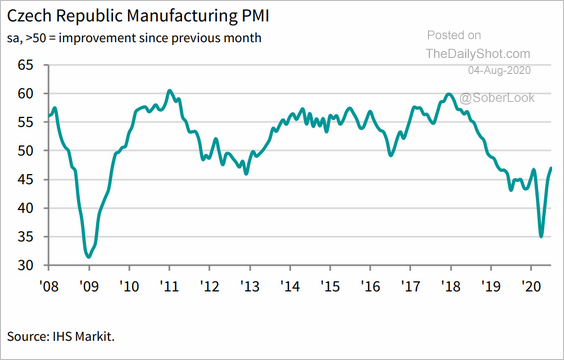
However, manufacturing in the Czech Republic remains in contraction mode.
 Source: World Economics Read full article
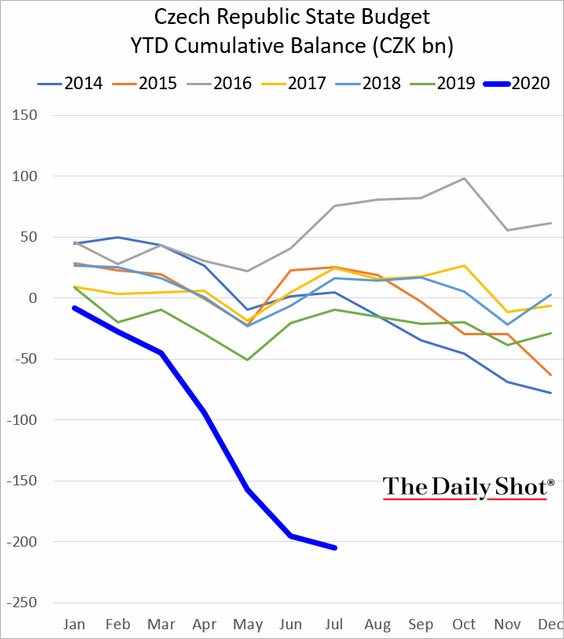
Separately, the Czech fiscal situation continues to deteriorate.
Japan
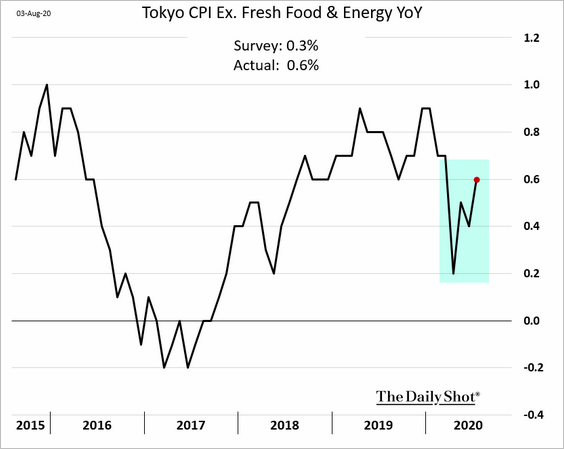
1. The Tokyo core CPI surprised to the upside.
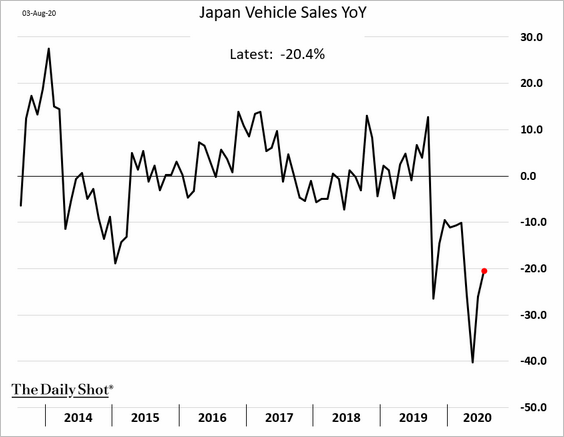
2. Last month’s vehicle sales remained 20% below 2019 levels.
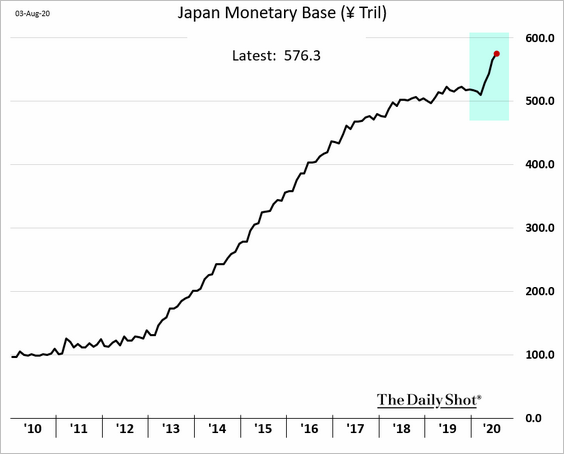
3. The monetary base has been climbing rapidly since the BoJ boosted stimulus.
Asia – Pacific
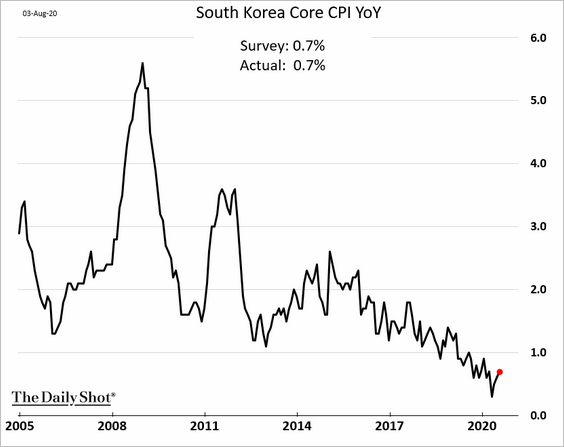
1. South Korea’s core CPI is off the lows.
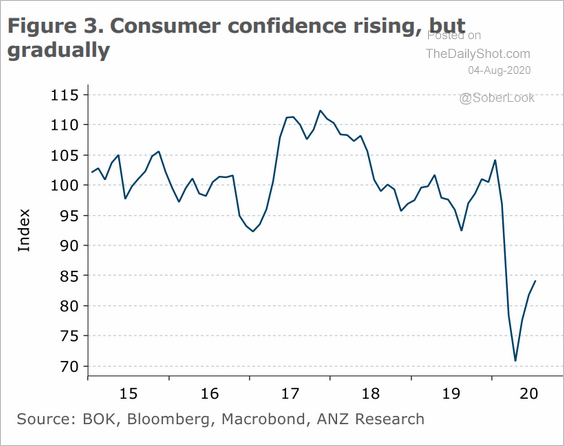
The nation’s consumer confidence is gradually recovering.
 Source: ANZ Research
——————–
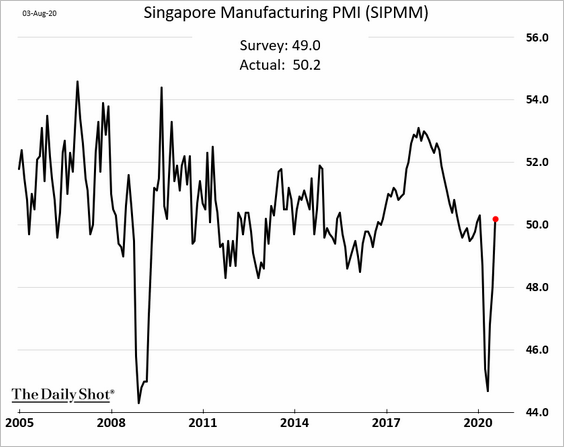
2. Singapore’s manufacturing returns to growth.
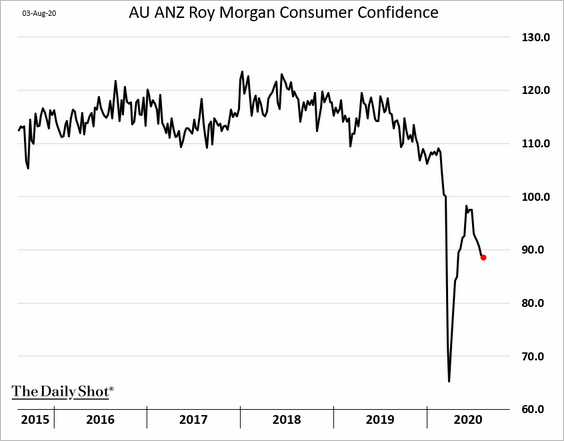
3. Next, we have some updates on Australia.
• Consumer confidence:
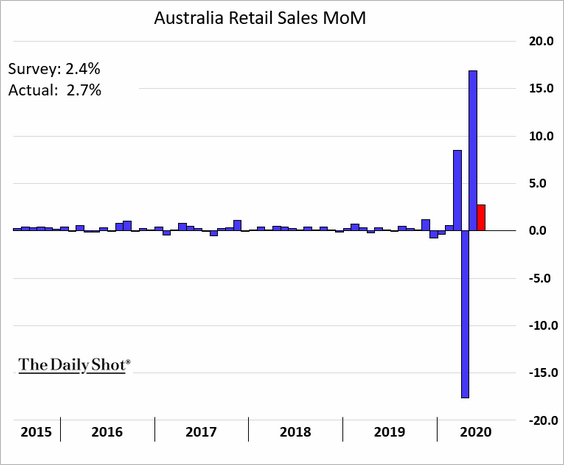
• Retail sales (upside surprise):
Retail sales volume (year-over-year):
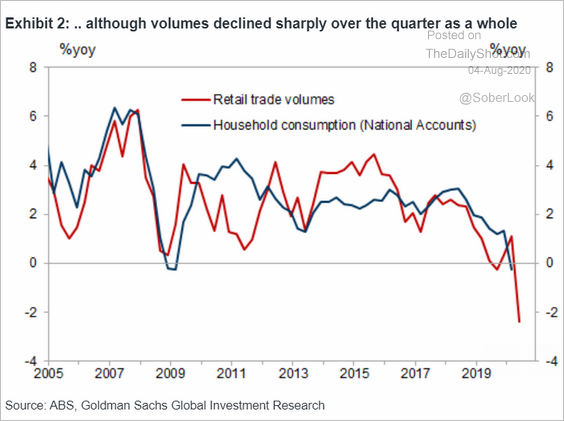 Source: Goldman Sachs
• The ASX’s performance from March lows vs. previous recoveries:
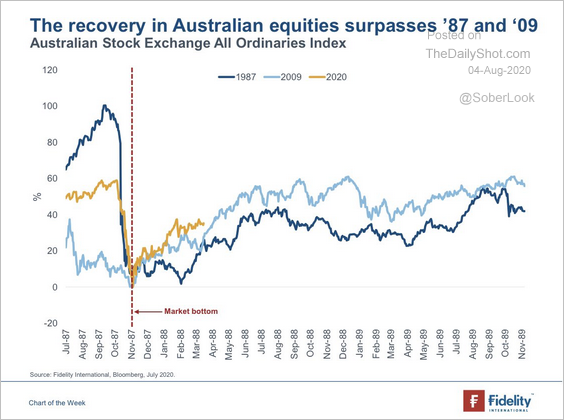 Source: @DoyleAUD
China
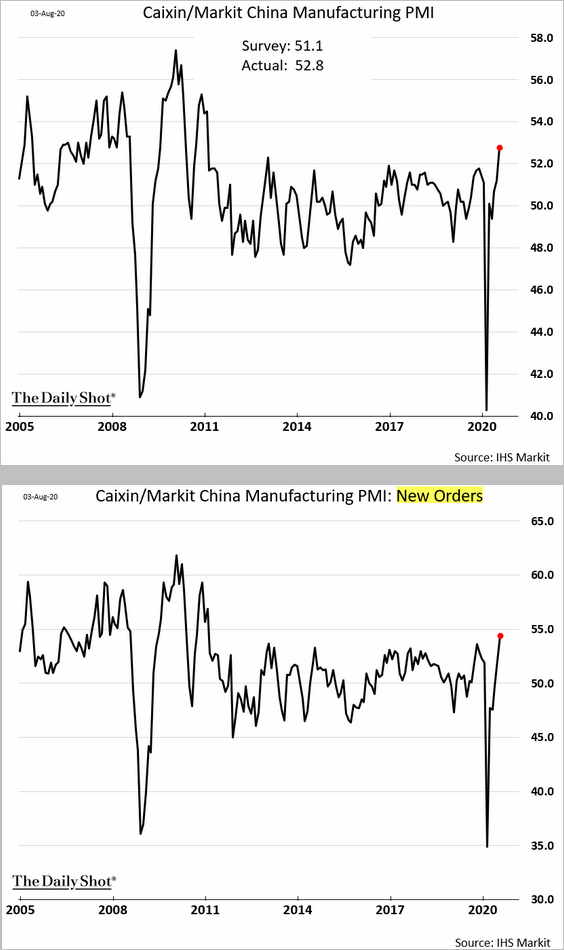
1. According to Markit, manufacturing is expanding at the fastest pace in a decade.
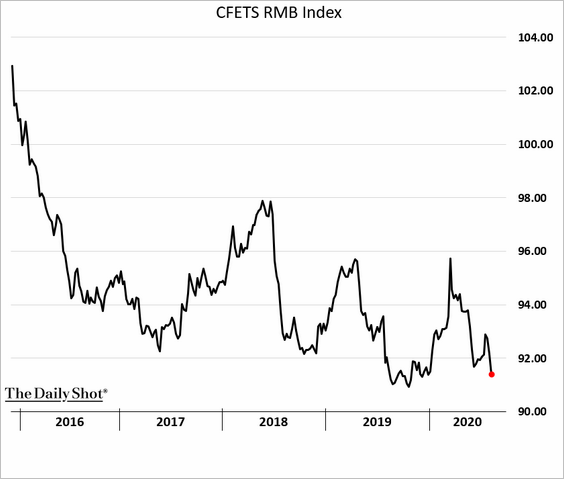
2. The renminbi has been weakening against the CFETS currency basket (following the dollar lower).
3. The ChiNext/Shanghai Composite ratio can be viewed as the relative performance of the “new” vs. “old” economy.
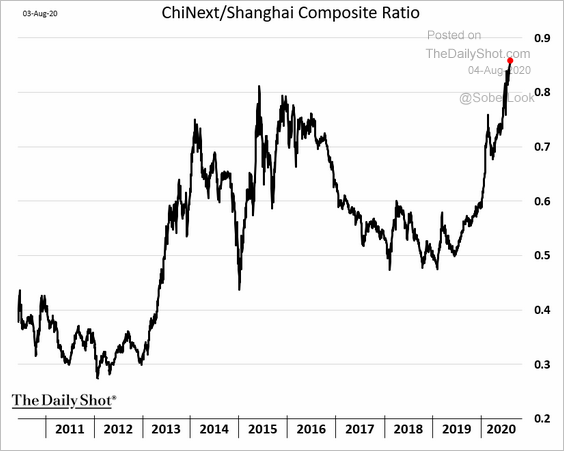 h/t @sharonchenhm
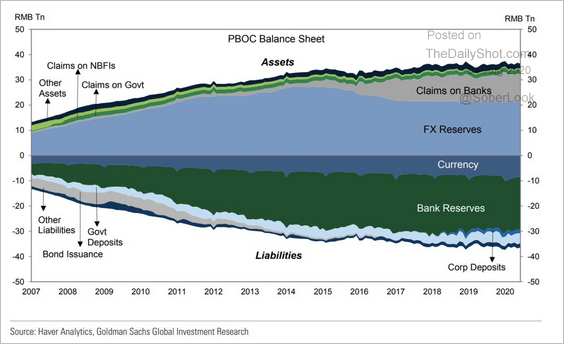
4. The size of the PBOC’s balance sheet has been relatively stable over the past few years.
 Source: Goldman Sachs
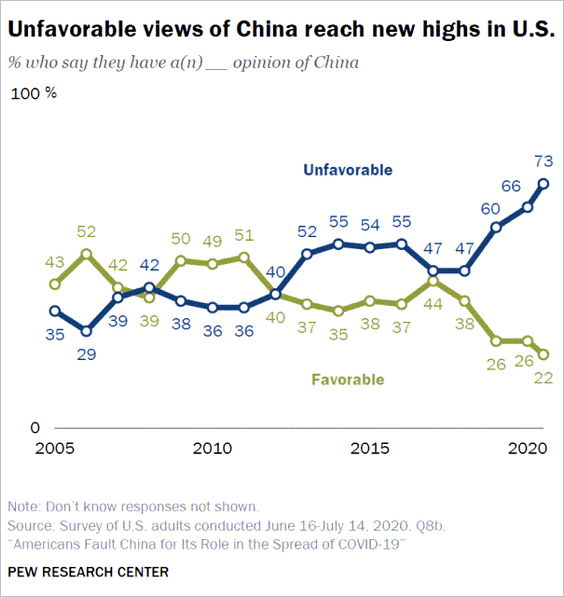
5. Americans increasingly have an unfavorable view of China.
 Source: Pew Research Center Read full article
Emerging Markets
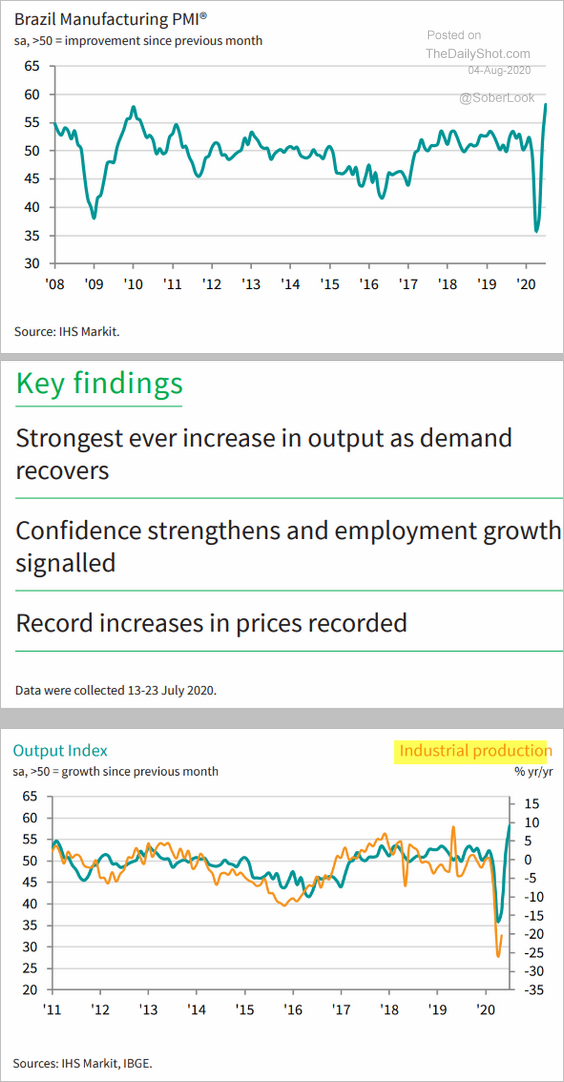
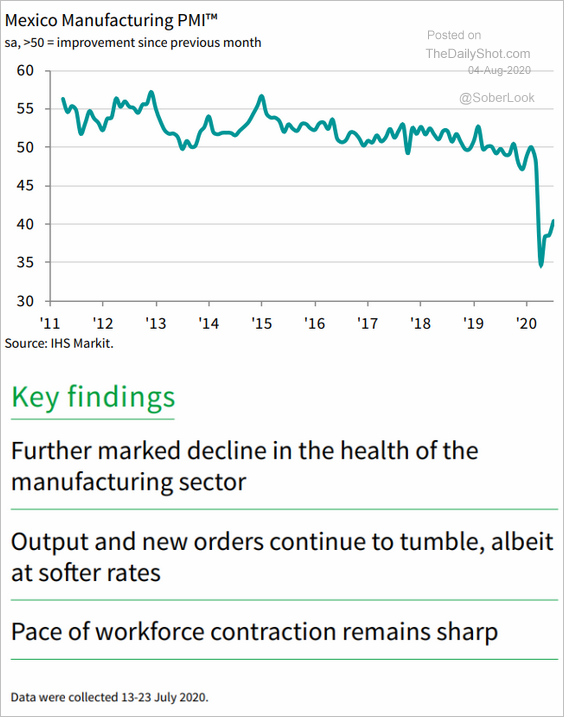
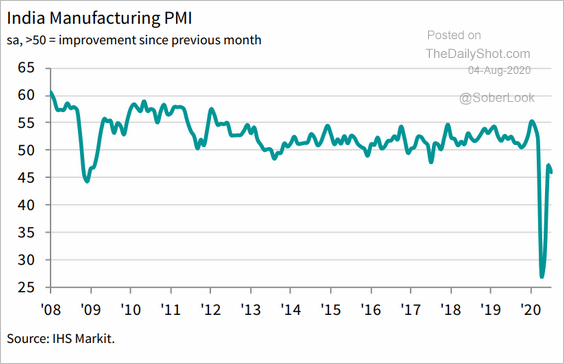
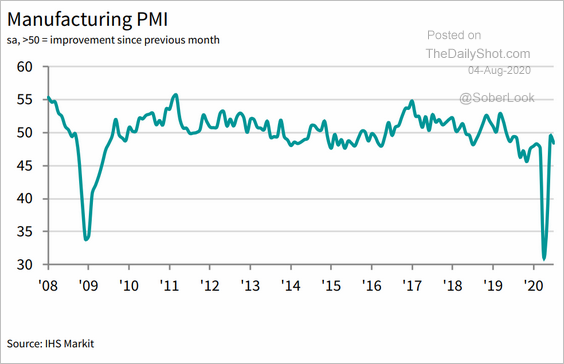
1. Let’s begin with the July manufacturing PMI updates.
• Brazil (impressive gains):
 Source: IHS Markit Read full article
• Mexico (deep in contraction mode):
 Source: World Economics Read full article
• India (still weak):
 Source: World Economics Read full article
• Russia (yet to stabilize):
 Source: World Economics Read full article
• Turkey (rapid acceleration):
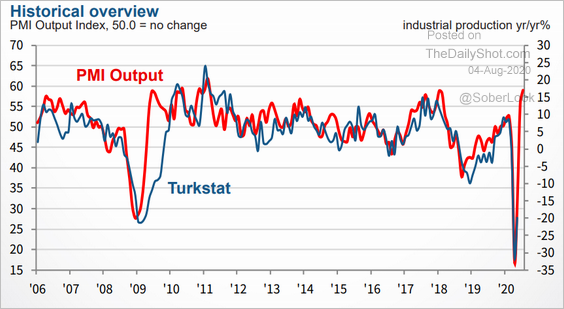 Source: IHS Markit Read full article
——————–
2. Here are a couple of other updates on Turkey.
• The lira:
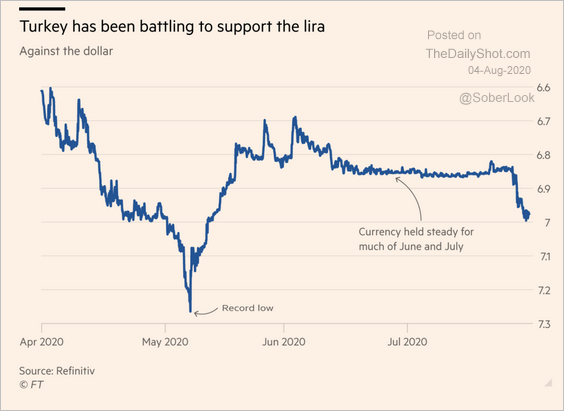 Source: @financialtimes Read full article
• Current account:
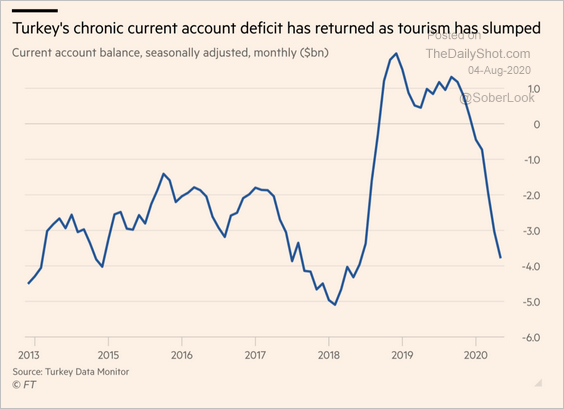 Source: @financialtimes Read full article
——————–
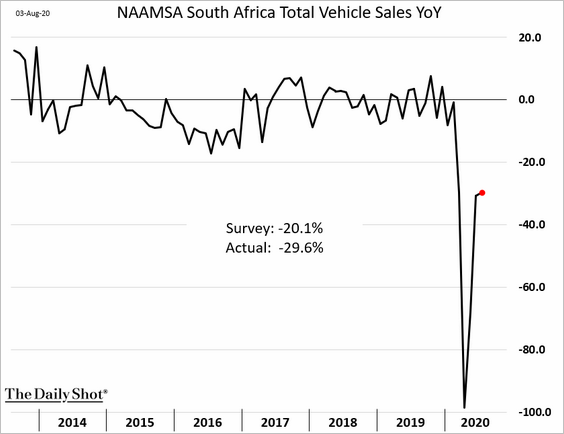
3. South Africa’s July car sales were still 30% below last year’s levels.
4. Chile’s economic activity remains depressed.
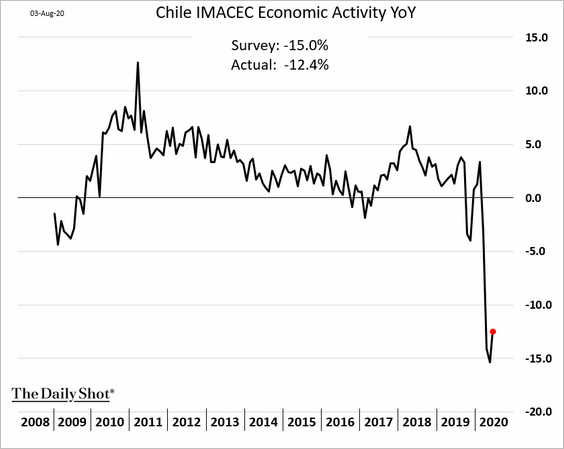
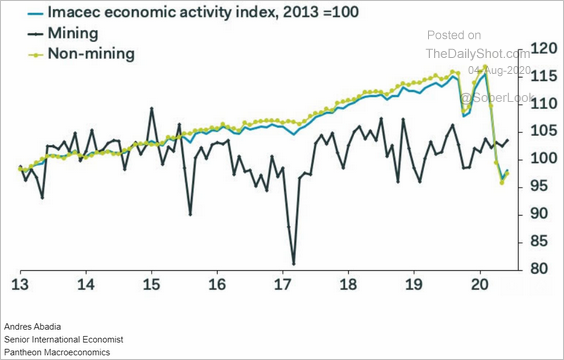 Source: Pantheon Macroeconomics
——————–
5. Argentina’s demand for the US dollar spiked.
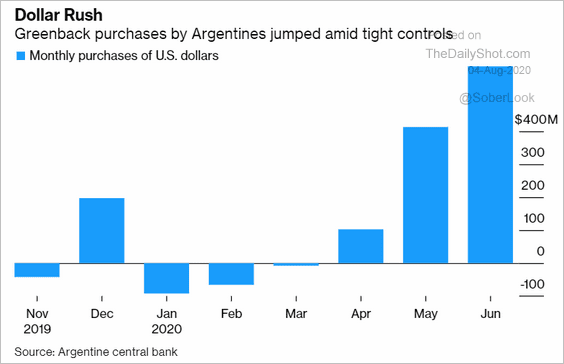 Source: @markets Read full article
Will we see a debt restructuring deal soon?
 Source: @markets Read full article
——————–
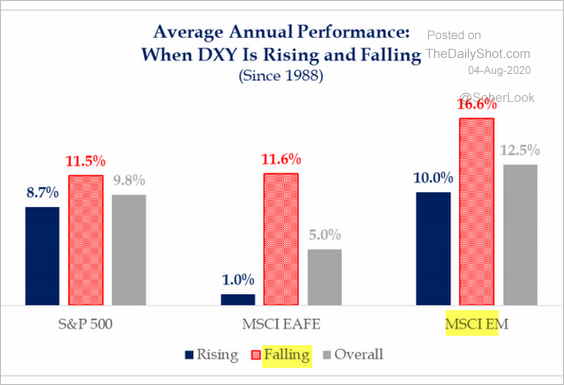
6. A weaker US dollar means outperformance for EM shares (2 charts).
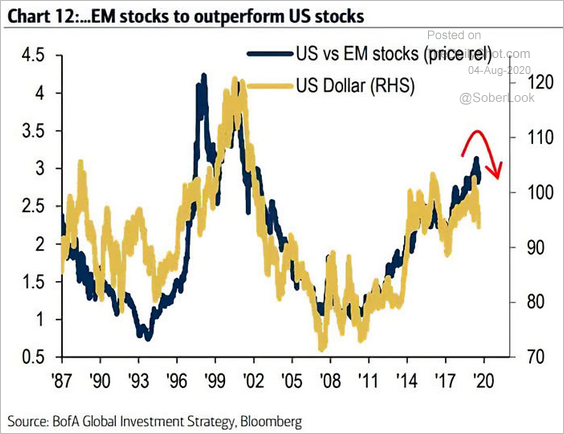 Source: @ISABELNET_SA, @BofAML Read full article
 Source: @StrategasRP
Cryptocurrency
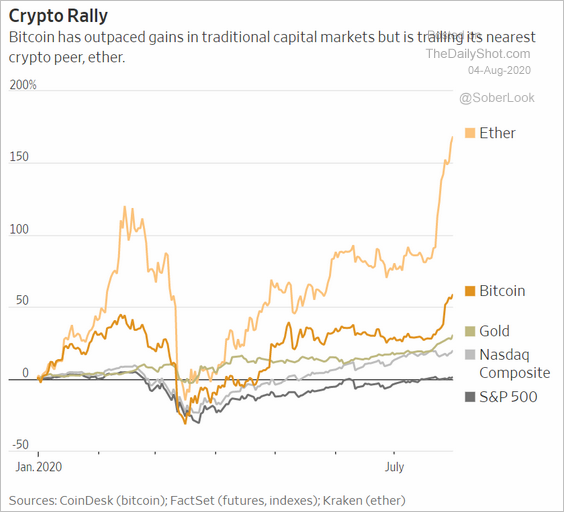
Ethereum’s outperformance has been impressive.
 Source: @WSJ Read full article
Energy
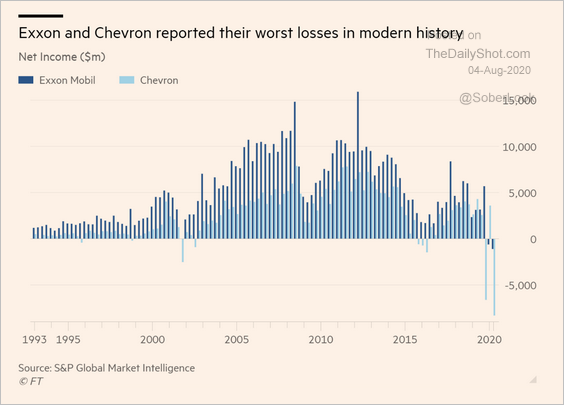
1. Exxon and Chevron reported unprecedented losses.
 Source: @financialtimes Read full article
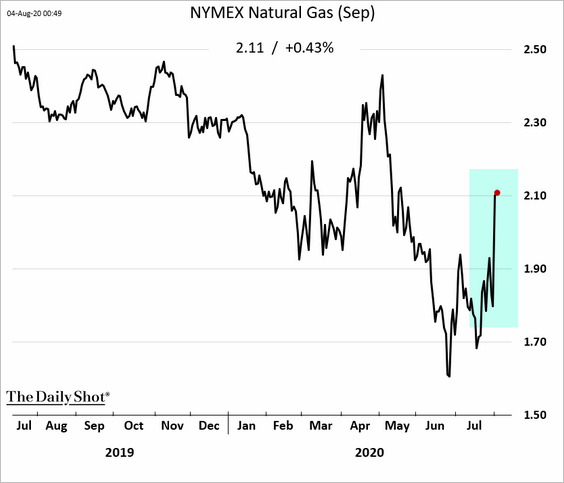
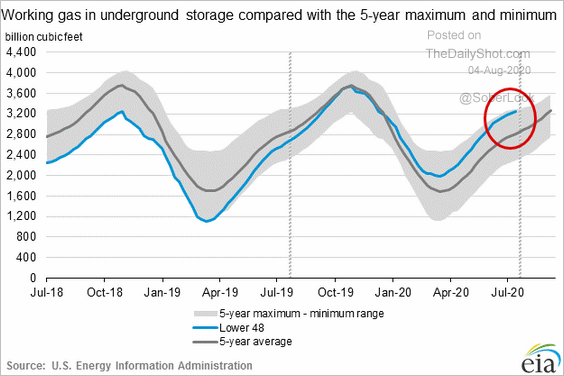
2. US natural gas futures spike despite bloated inventories (2nd chart). Foreign demand for LNG is starting to pick up.
Equities
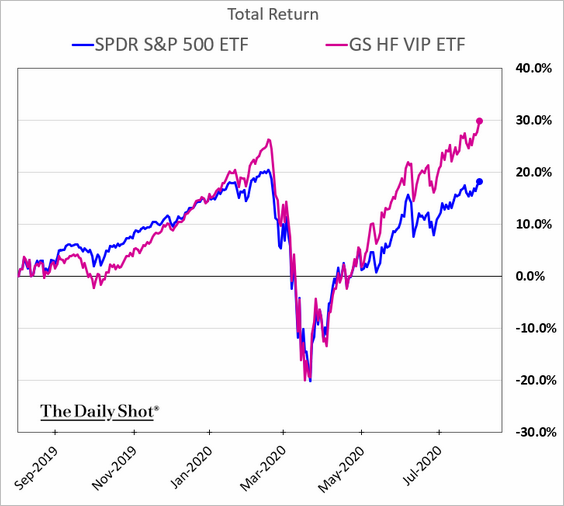
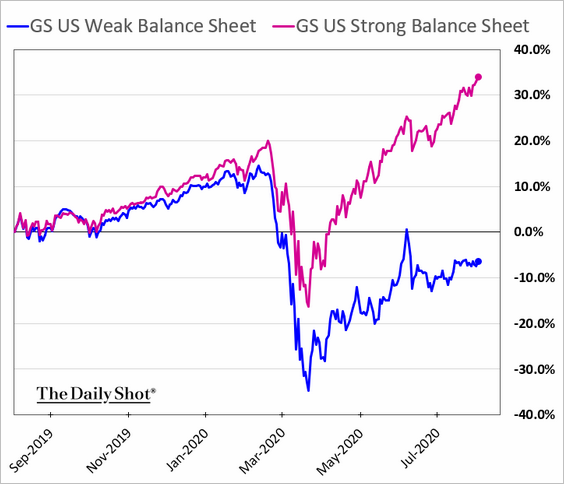
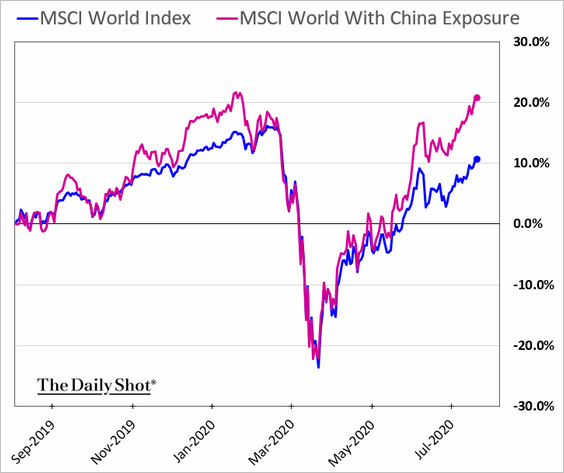
1. Some of the trends we saw earlier this summer remain intact.
• Hedge funds’ picks still in favor:
• Investor preference for companies with strong balance sheets:
• Rewarding companies with China exposure:
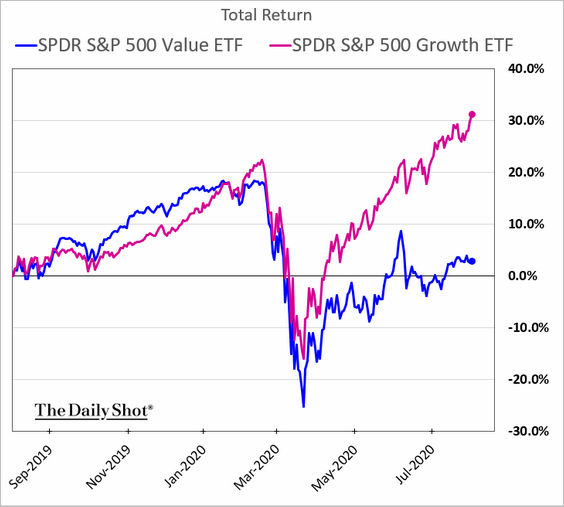
• Growth vs. value:
——————–
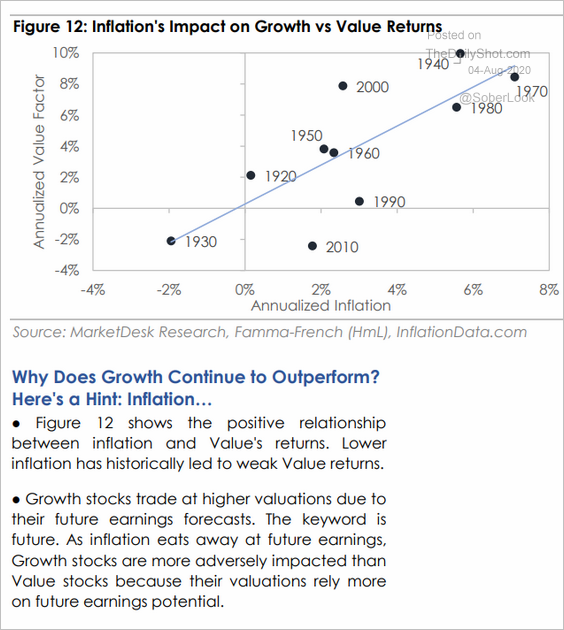
2. Lowflation has been boosting the growth/value outperformance.
 Source: MarketDesk Research
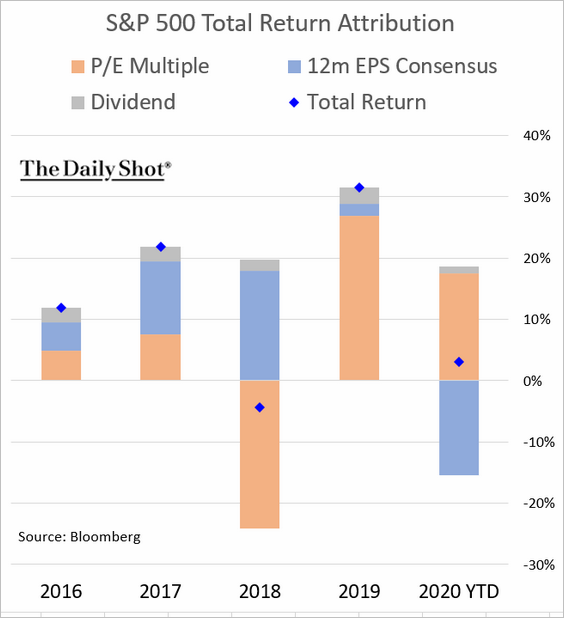
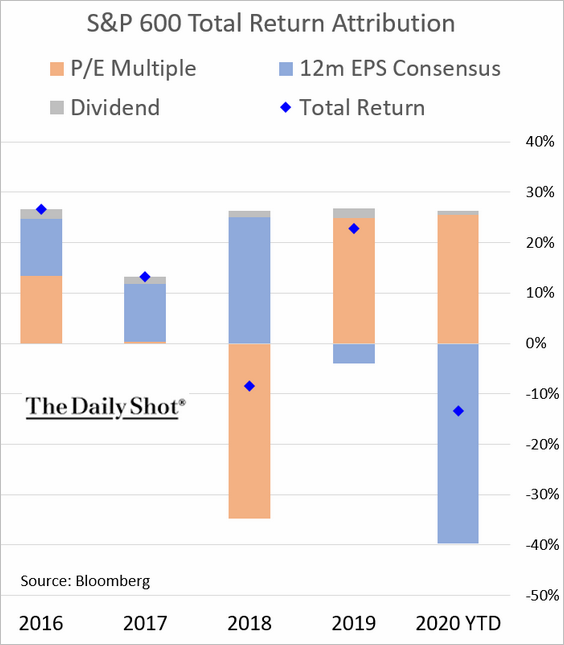
3. Here is the updated year-to-date performance attribution.
• The S&P 500:
• The S&P 600 (small caps):
——————–
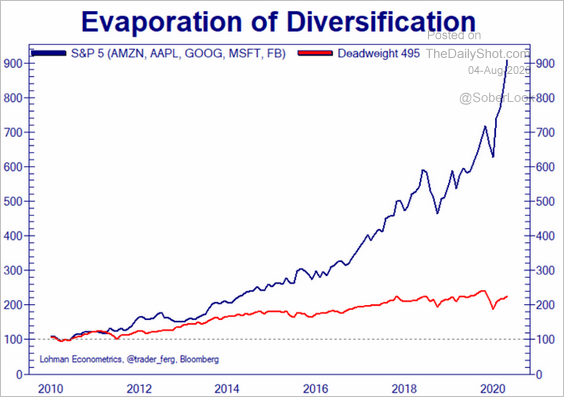
4. Analysts are concerned about rising market concentrations.
 Source: @Not_Jim_Cramer
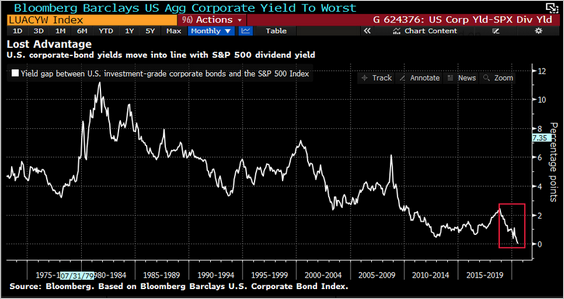
5. Investment-grade debt yield has converged with the S&P 500 dividend yield for the first time.
 Source: @lisaabramowicz1, @TheOneDave
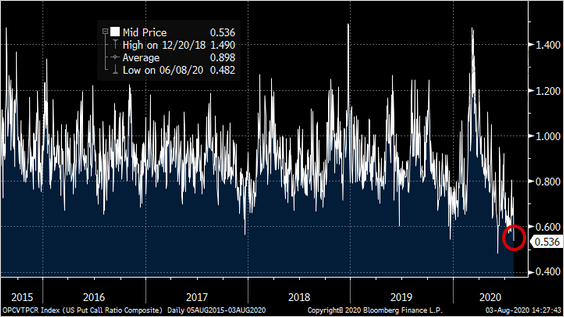
6. The put/call ratio continues to show elevated risk appetite.
 Source: @danny_kirsch
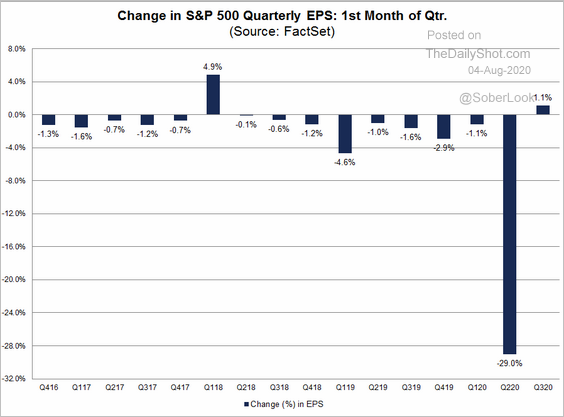
7. Analysts are boosting S&P 500 quarterly EPS estimates for the first time since Q1 2018.
 Source: @FactSet Read full article
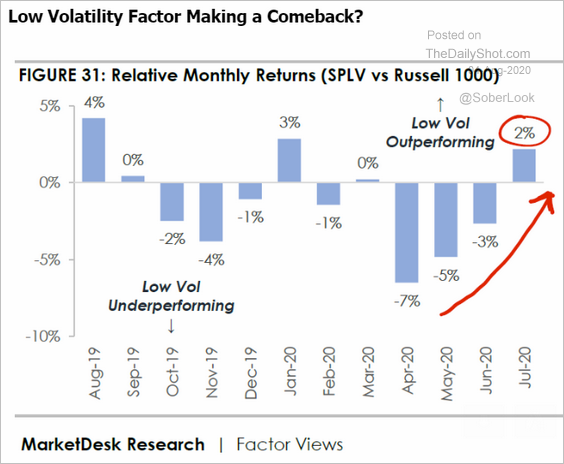
8. Is the low-vol factor making a comeback?
 Source: MarketDesk Research
Credit
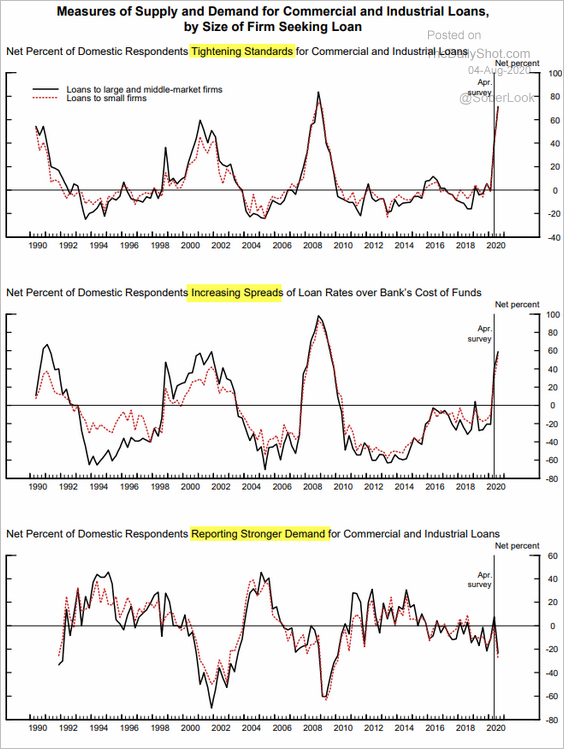
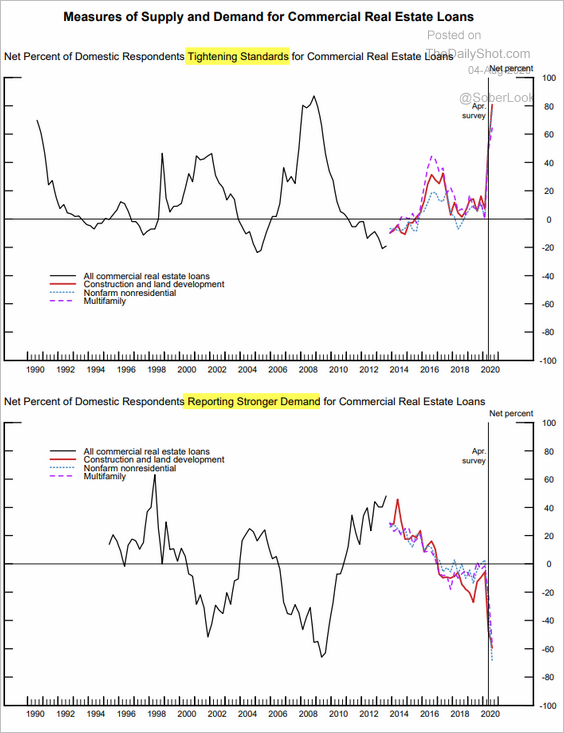
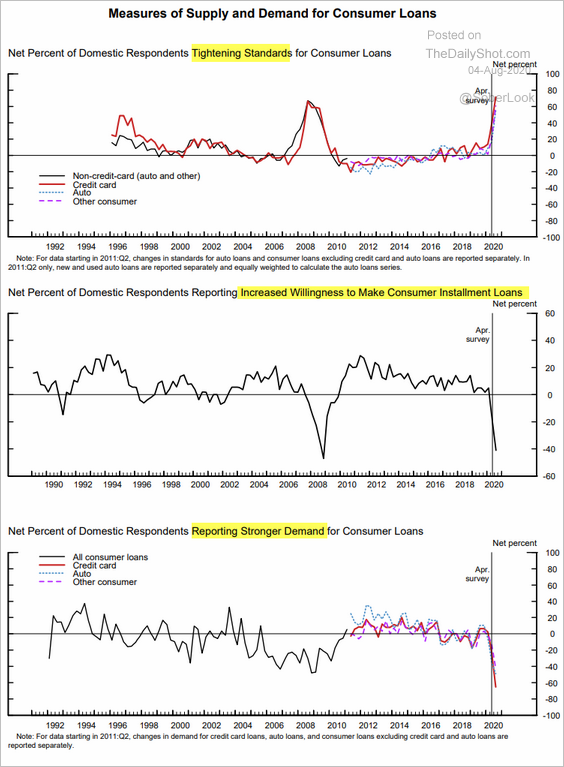
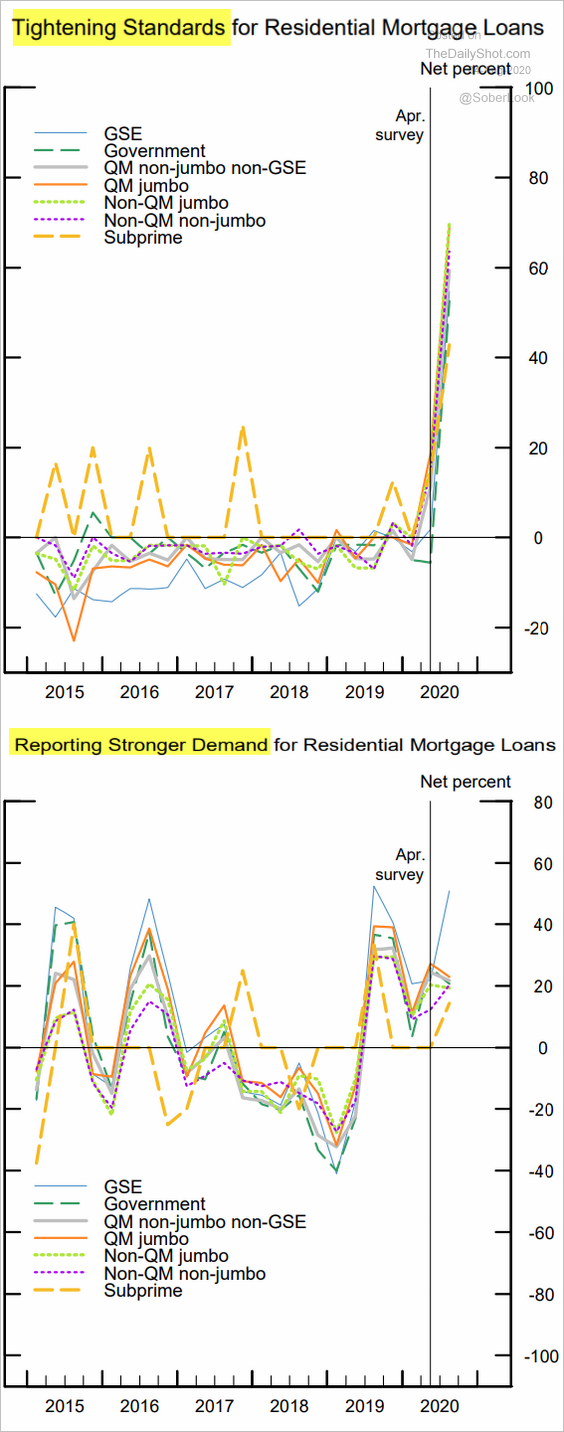
1. Banks have tightened credit standards across the board. Demand for credit weakened last quarter except in residential mortgages.
• Business loans:
 Source: Federal Reserve Board of Governors
• Commercial real estate loans:
 Source: Federal Reserve Board of Governors
• Consumer loans:
 Source: Federal Reserve Board of Governors
• Mortgages:
 Source: Federal Reserve Board of Governors
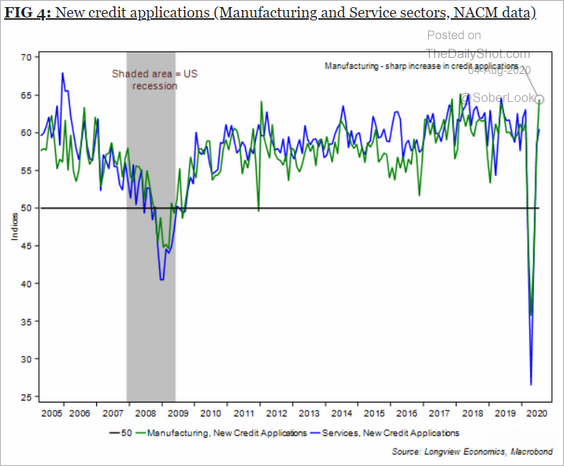
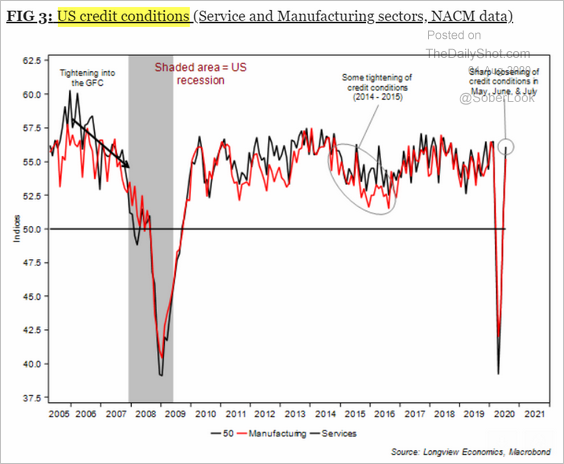
However, the latest NACM data shows improved credit demand and credit conditions in the corporate sector.
 Source: Longview Economics
 Source: Longview Economics
——————–
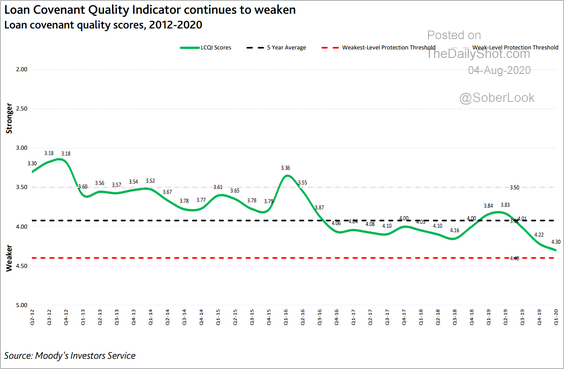
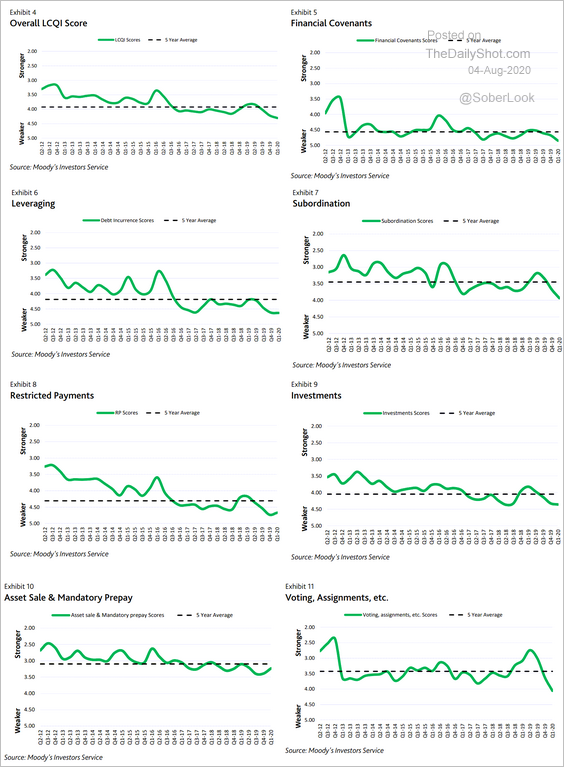
2. The leveraged loan market covenant quality (lender protections) has deteriorated further.
 Source: Moody’s Investors Service
Here are the components.
 Source: Moody’s Investors Service
——————–
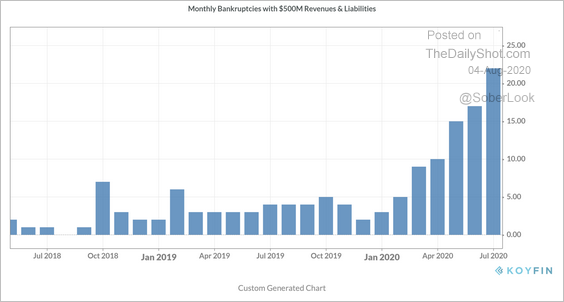
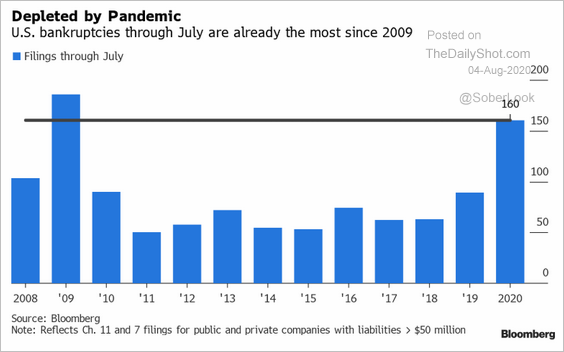
3. Large-company bankruptcies have accelerated.
• Monthly:
 Source: Koyfin Read full article
• Yearly:
 Source: Nancy Moran, Bloomberg Further reading
Rates
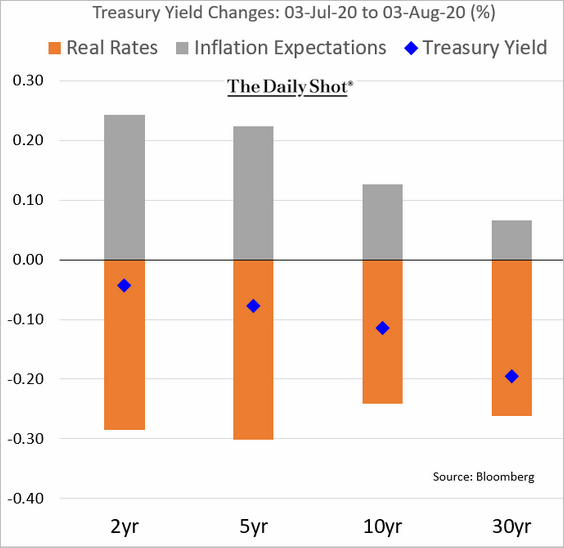
1. Here is the attribution of Treasury yield declines over the past month.
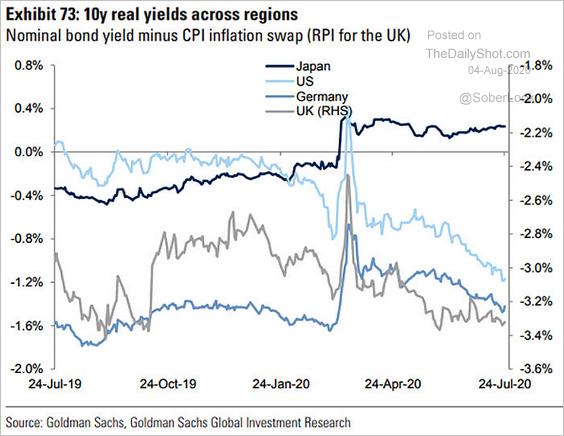
2. This chart shows real yields in Japan, the US, Germany, and the UK.
 Source: @ISABELNET_SA, @GoldmanSachs
Global Developments
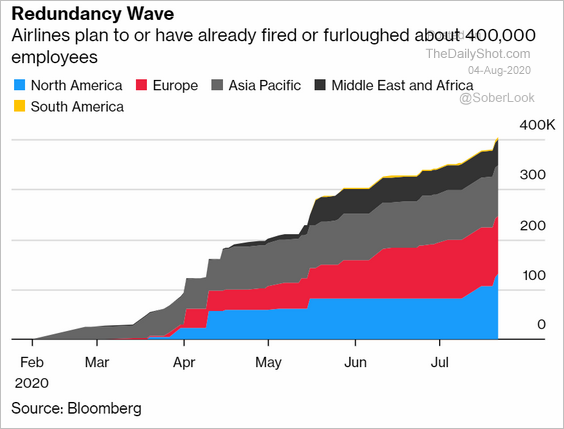
1. Airlines continue to lay off or furlough employees.
 Source: @business Read full article
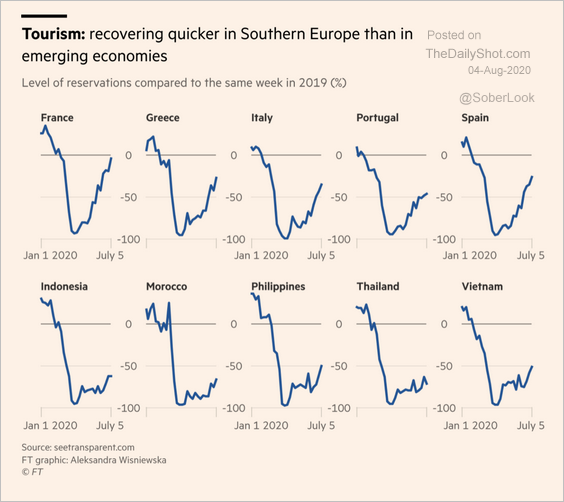
2. Tourism recovery has been uneven.
 Source: @financialtimes Read full article
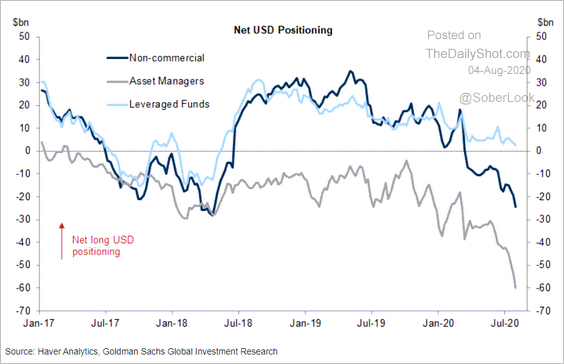
3. Asset managers continue to press their bets against the US dollar.
 Source: Goldman Sachs
——————–
Food for Thought
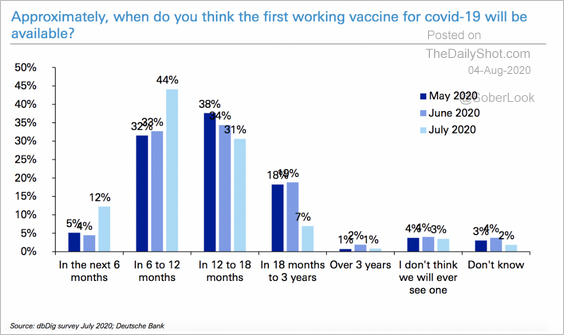
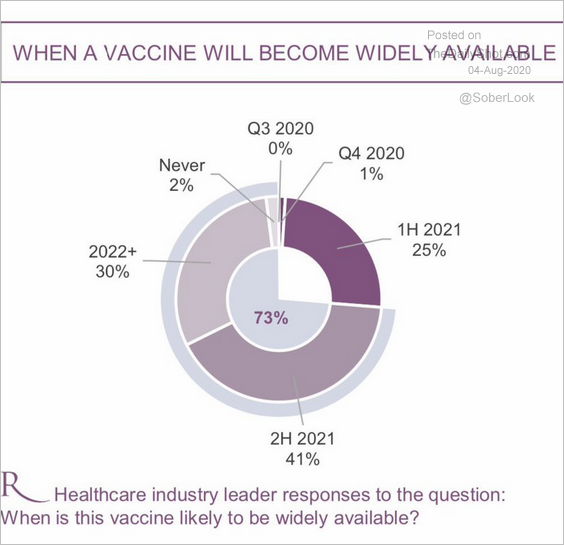
1. When will a vaccine become widely available?
• Market experts:
 Source: Deutsche Bank Research
• Healthcare industry leaders:
 Source: @LizAnnSonders, @Lazard
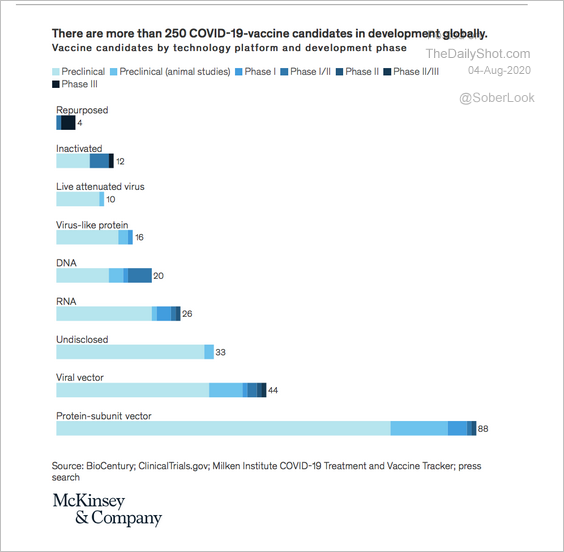
2. Vaccine candidates by technology platform and development phase:
 Source: McKinsey & Company Read full article
Here is one approach.
 Source: BBC Read full article
——————–
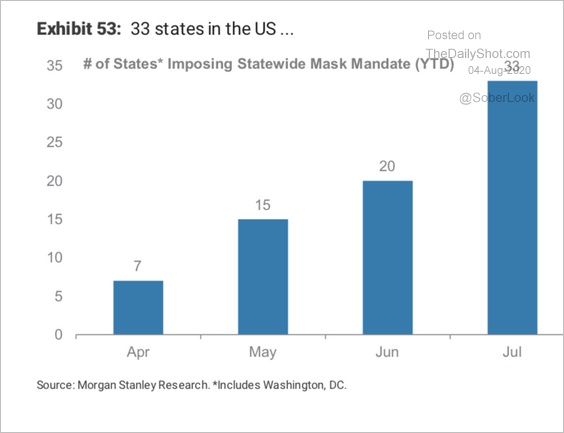
3. Face mask mandates:
 Source: Morgan Stanley Research
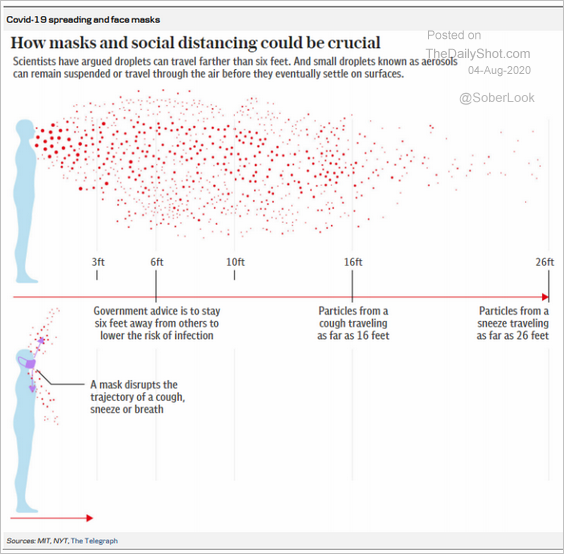
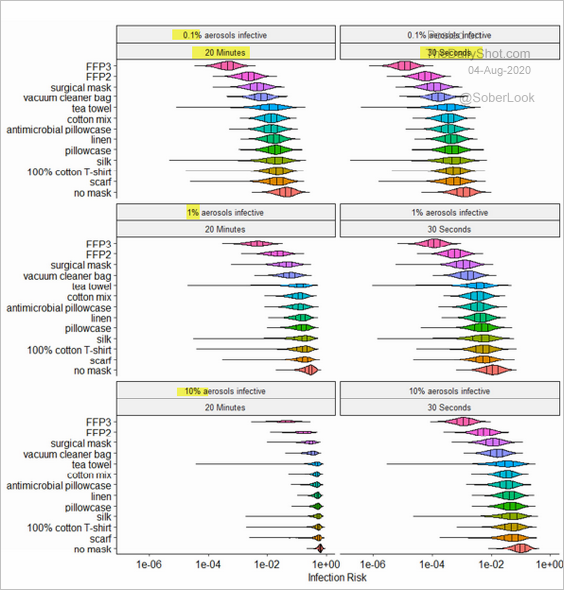
• Mask effectiveness (2 charts):
 Source: Danske Bank
 Source: Journal of Hospital Infection, @wef Read full article
——————–
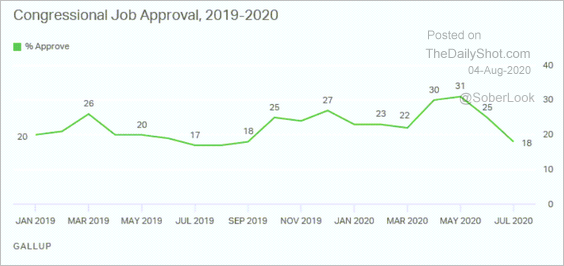
4. Congressional job approval:
 Source: Gallup Read full article
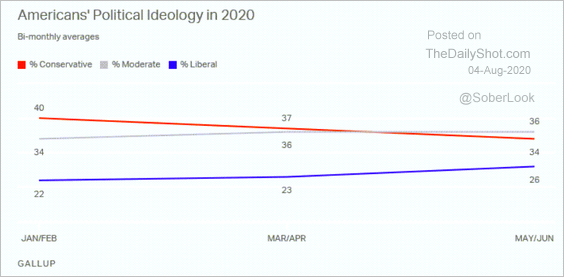
5. Americans’ political ideology:
 Source: Gallup Read full article
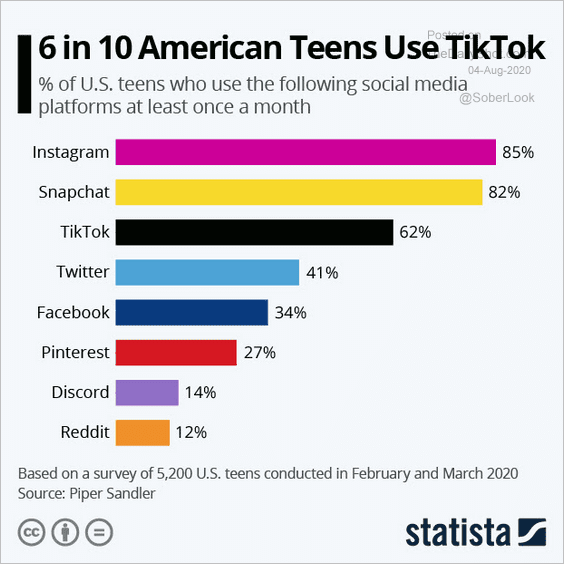
6. Teens’ use of social media platforms:
 Source: Statista
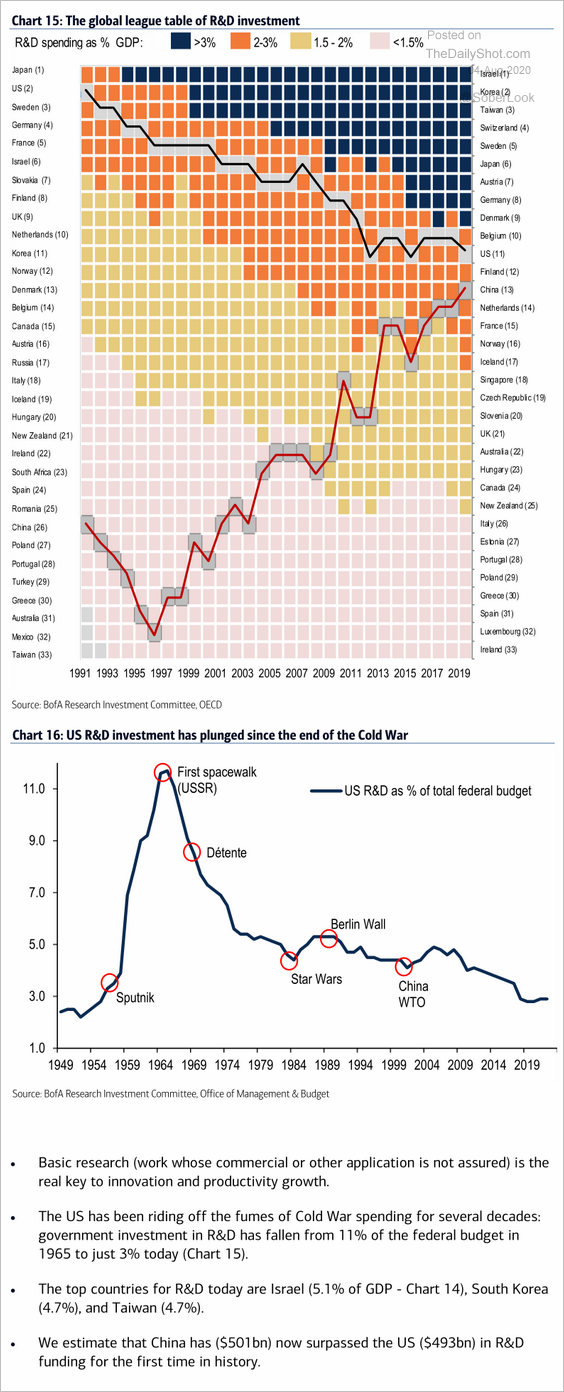
7. R&D investment league table:
 Source: BofA Merrill Lynch Global Research, @TayTayLLP
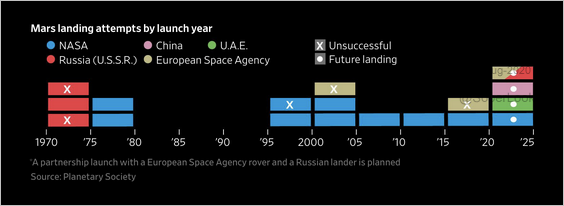
8. Attempts to land on Mars:
 Source: @WSJ Read full article
——————–
