The Daily Shot: 06-Aug-20
• The United States
• The United Kingdom
• The Eurozone
• Europe
• Japan
• China
• Emerging Markets
• Commodities
• Energy
• Equities
• Credit
• Global Developments
• Food for Thought
The United States
1. Service-sector growth accelerated in July, with the ISM Services index topping economists’ forecasts.
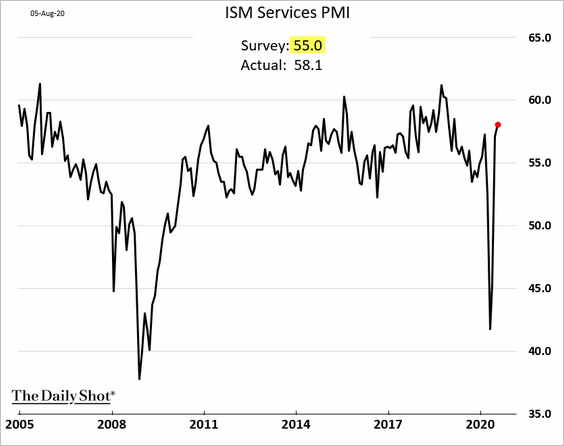
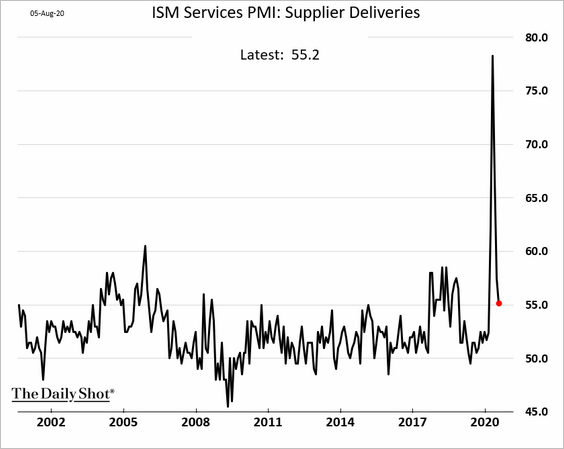
• Lockdown-driven supplier bottlenecks have eased.
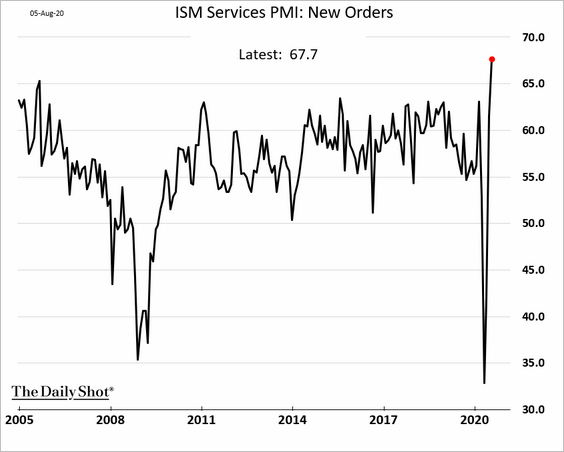
• The index of new orders hit a record high.
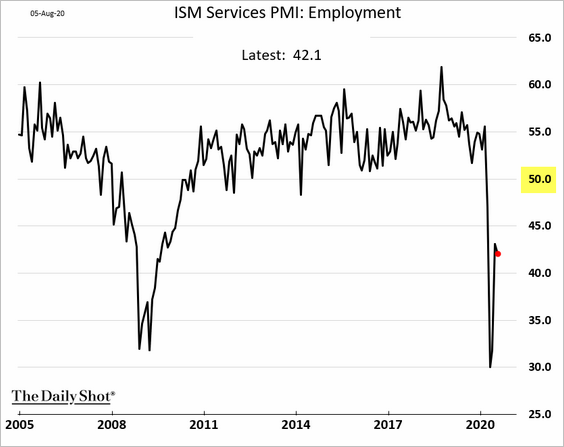
• However, service-sector businesses continue to shed jobs.
——————–
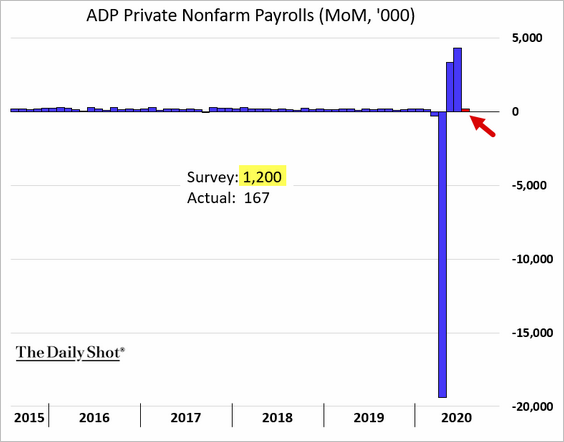
2. The ADP private payrolls report surprised to the downside. Economists expected to see 1.2 million jobs created in July, but we got 167k.
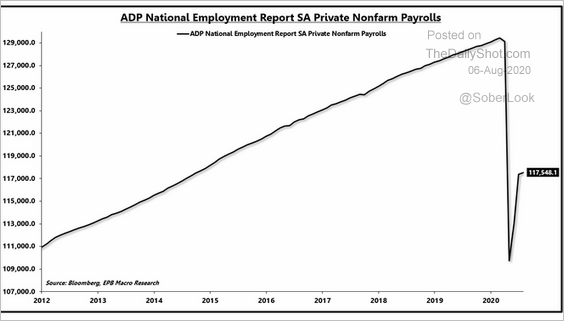
• This chart shows the absolute level of private payrolls.
 Source: @EPBResearch
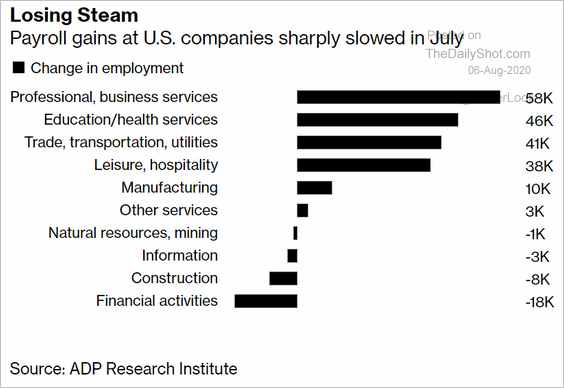
• Here is the breakdown by sector.
 Source: @markets Read full article
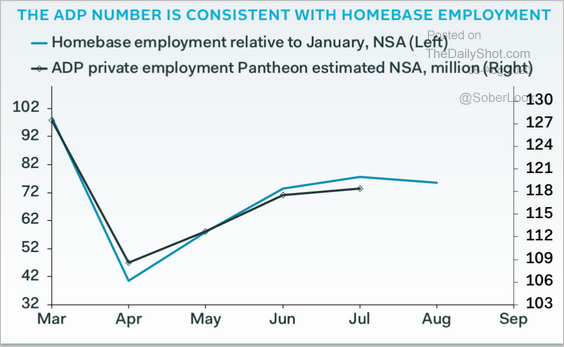
• The ADP trajectory is consistent with the small-business employment trend tracked by Homebase (see #3 here).
 Source: Pantheon Macroeconomics
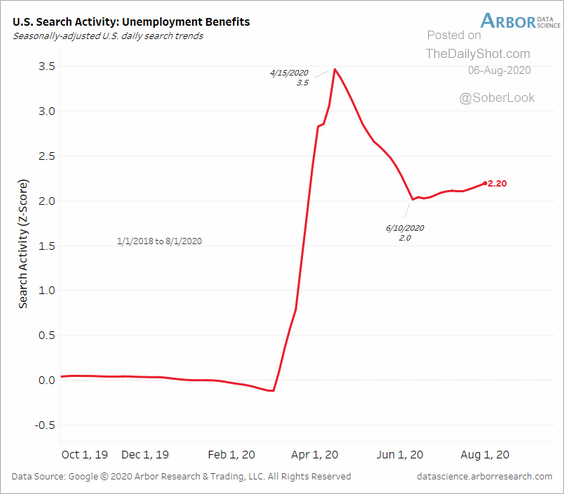
• Another indicator pointing to a pause in the labor market recovery is the online search activity for unemployment benefits.
 Source: Arbor Research & Trading
——————–
3. Next, we have some updates on inflation.
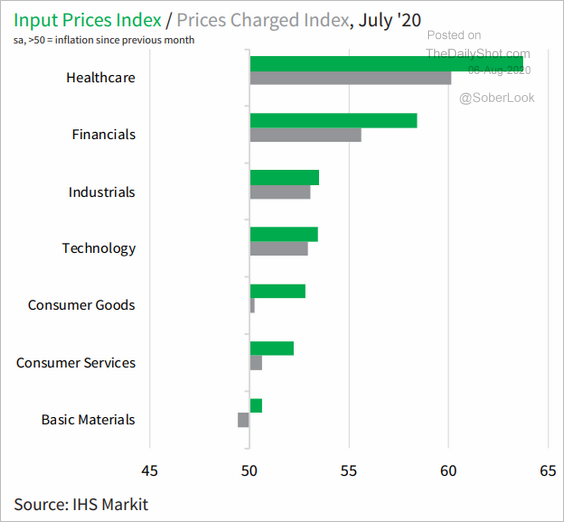
• Most sectors have been reporting rising input and output prices (PMI > 50).
 Source: IHS Markit Read full article
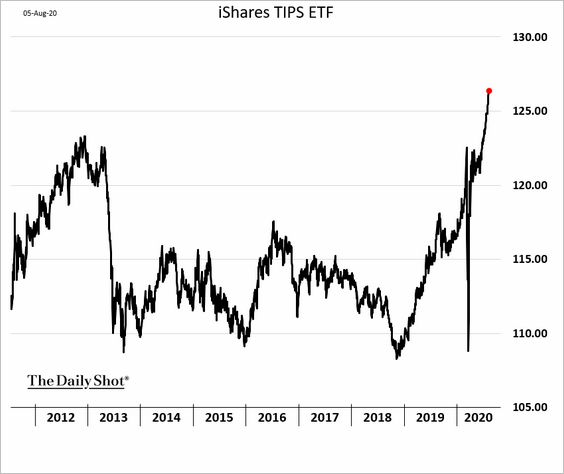
• Despite weak inflation readings in recent months, investors are chasing Treasury Inflation-Protected Securities (TIPS). The iShares TIPS ETF is hitting new highs.
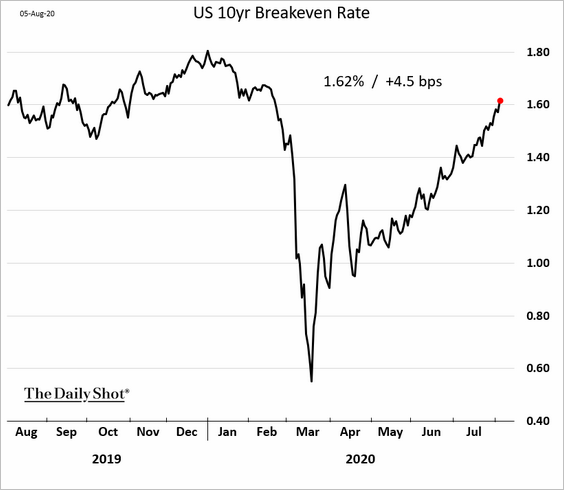
• Market-based inflation expectations continue to climb.
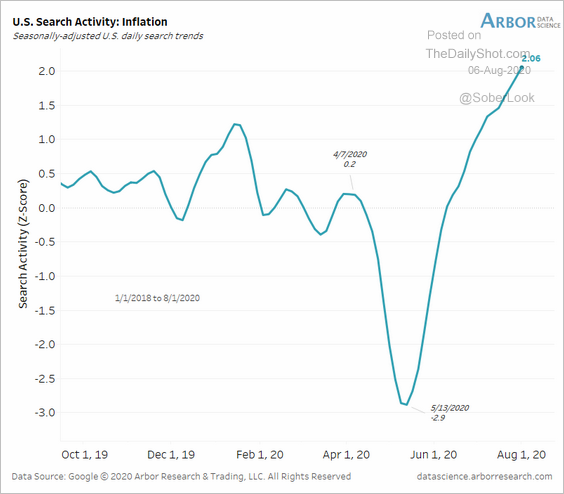
• Google search activity for “inflation” is soaring.
 Source: Arbor Research & Trading
——————–
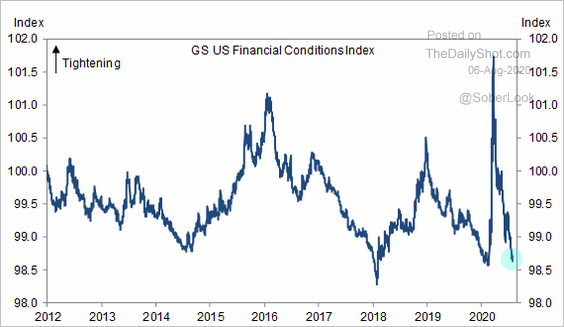
4. US financial conditions have eased to pre-crisis levels.
 Source: Goldman Sachs
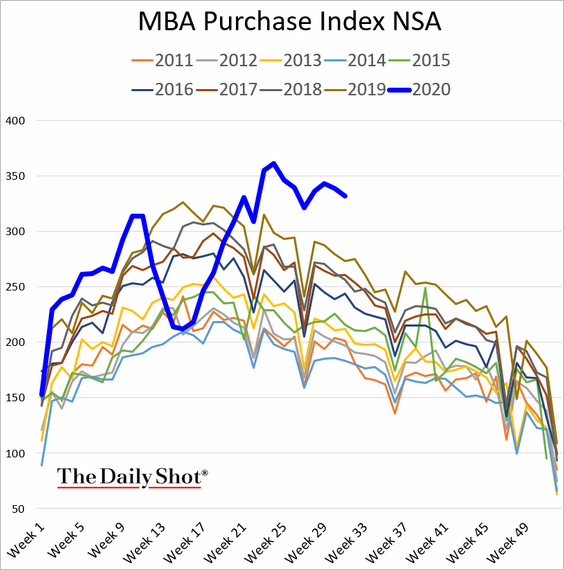
5. Mortgage applications for house purchase remain elevated.
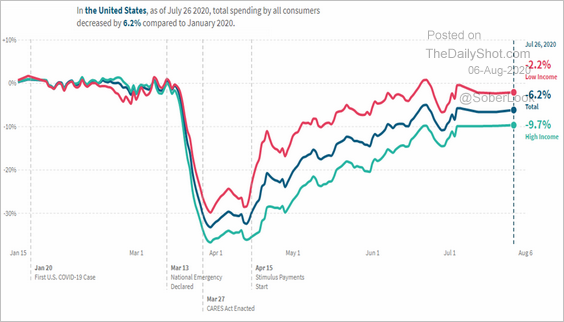
6. Higher-income household expenditures continue to lag the overall spending recovery.
 Source: Opportunity Insights
The United Kingdom
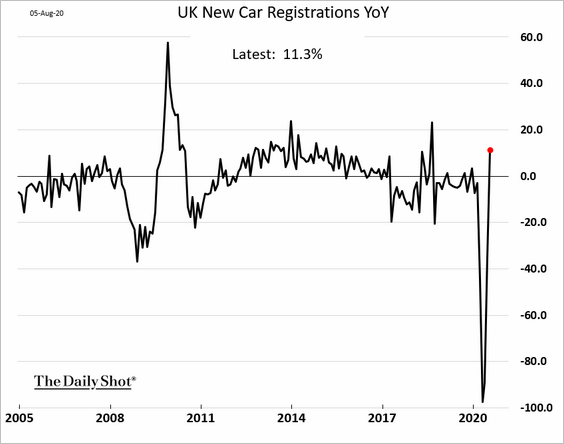
1. New car registrations have rebounded sharply.
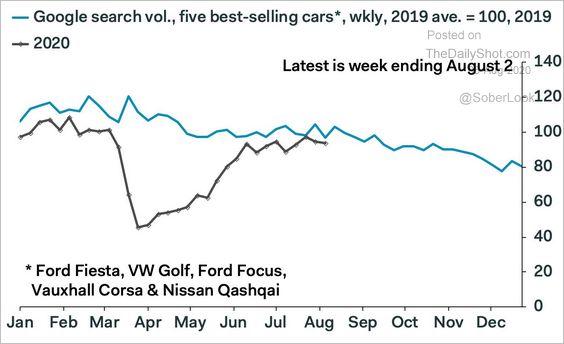
Here is the online search activity for the best selling cars.
 Source: Pantheon Macroeconomics
——————–
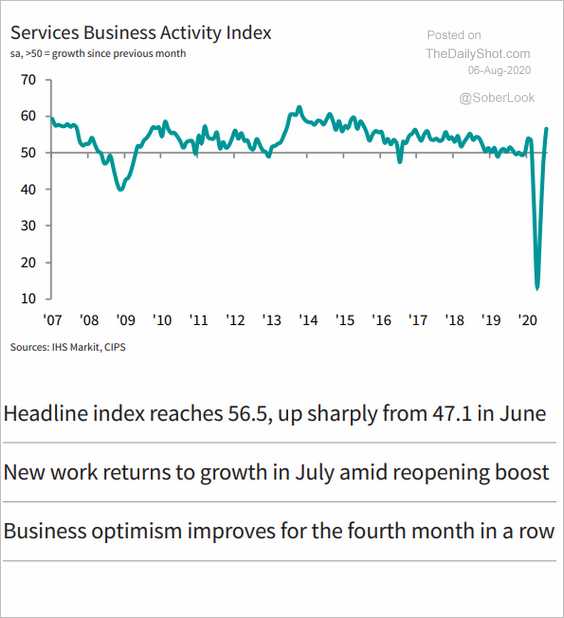
2. UK service-sector activity is now firmly in growth mode.
 Source: IHS Markit Read full article
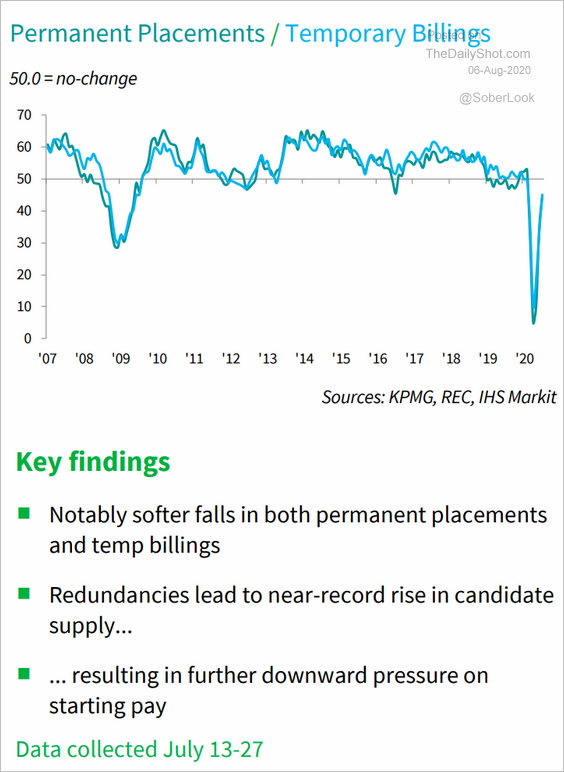
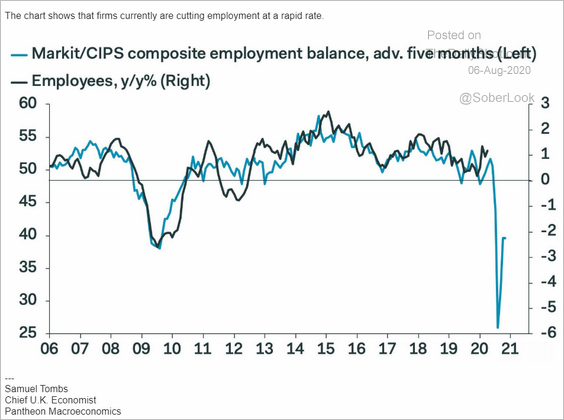
3. Job placements are yet to stabilize.
 Source: IHS Markit Read full article
And downside risks to the labor market persist.
 Source: Pantheon Macroeconomics
——————–
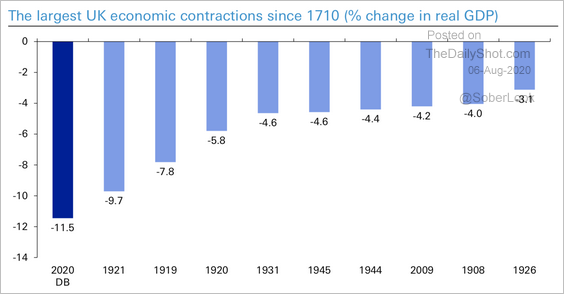
4. Deutsche Bank expects the 2020 economic contraction to be the worst since 1710.
 Source: Deutsche Bank Research
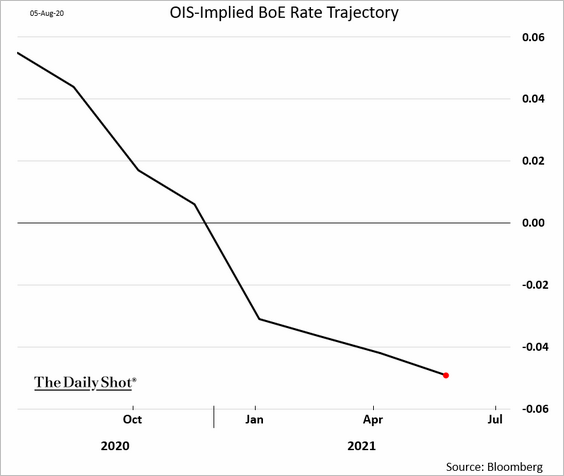
5. The market continues to price in the possibility of negative rates in the UK.
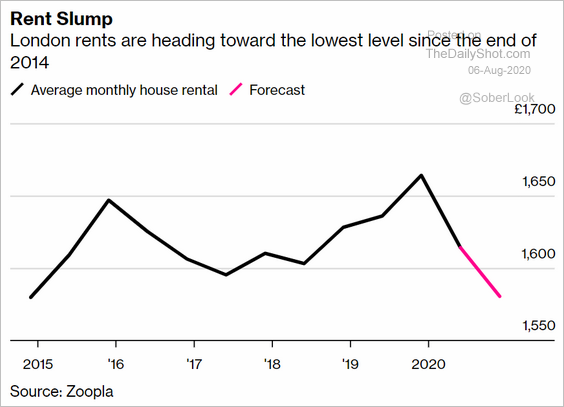
6. London rents are declining.
 Source: @markets Read full article
7. Finally, this chart shows COVID-related fatalities by age.
 Source: Deutsche Bank Research
The Eurozone
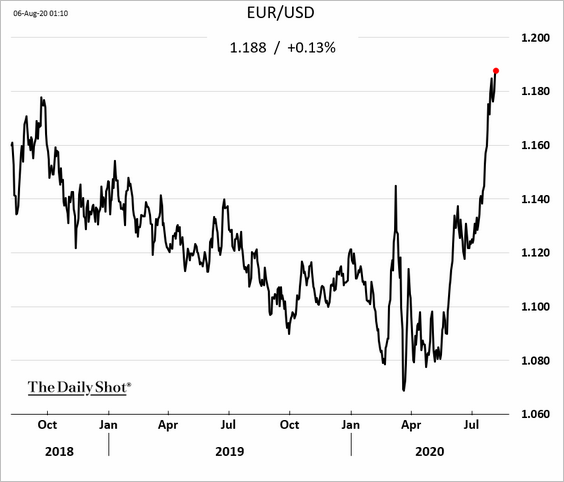
1. The euro continues to grind higher.
• Interest rate differentials suggest further upside for EUR/USD.
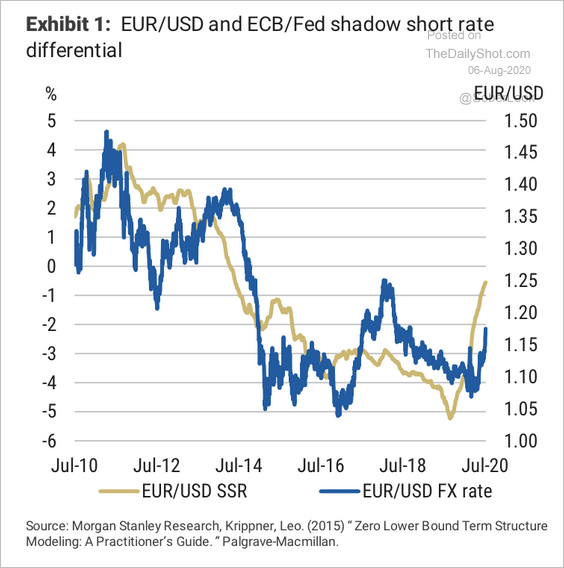 Source: Morgan Stanley Research
• Some of the gains are due to the overall US dollar weakness. The euro trade-weighted index hasn’t risen as much as EUR/USD.
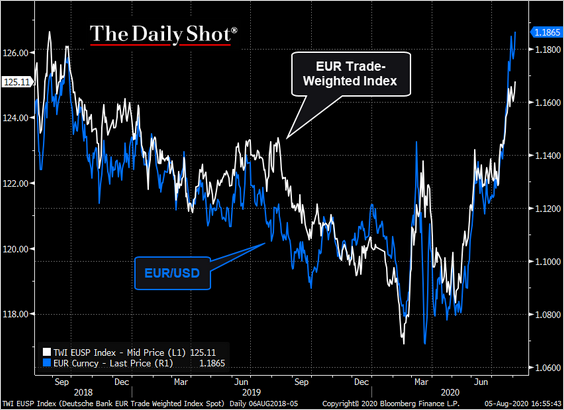 Source: @TheTerminal
——————–
2. The 10-year Bund yield is holding support.
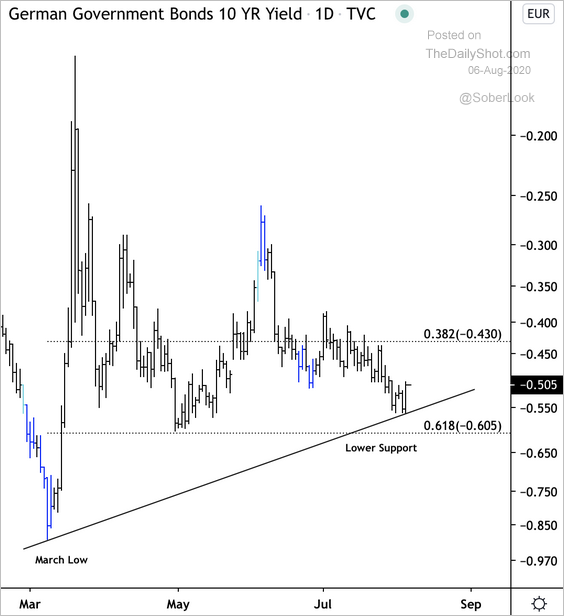 Source: @DantesOutlook
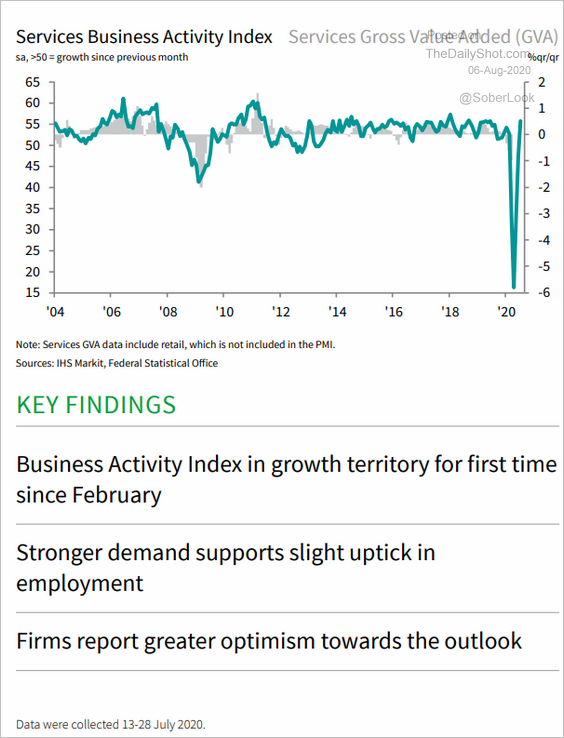
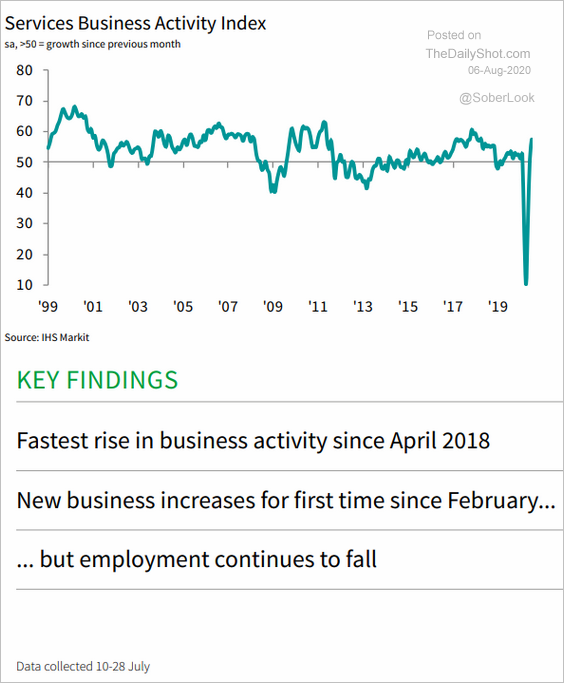
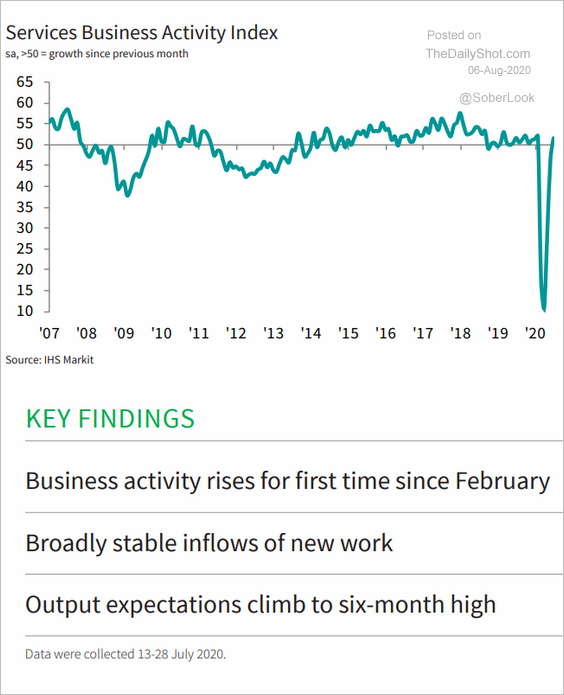
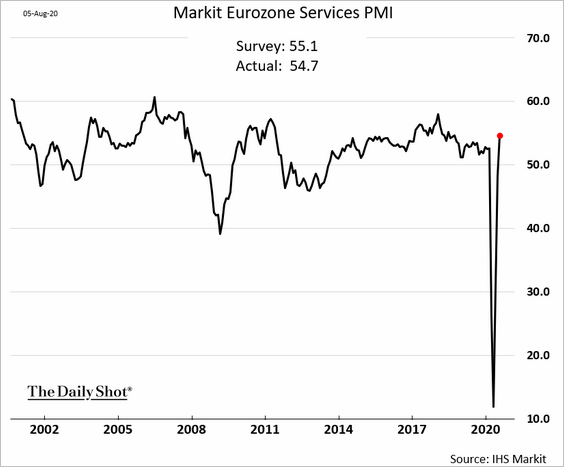
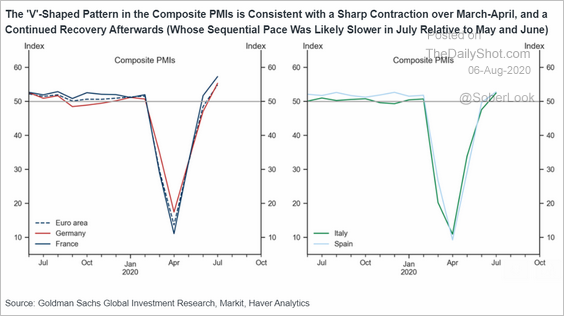
3. PMI reports show service-sector activity back in growth mode.
• Germany:
 Source: IHS Markit Read full article
• France:
 Source: IHS Markit Read full article
• Italy:
 Source: IHS Markit Read full article
• The Eurozone:
Here are the composite PMI indicators (manufacturing + services).
 Source: Goldman Sachs
——————–
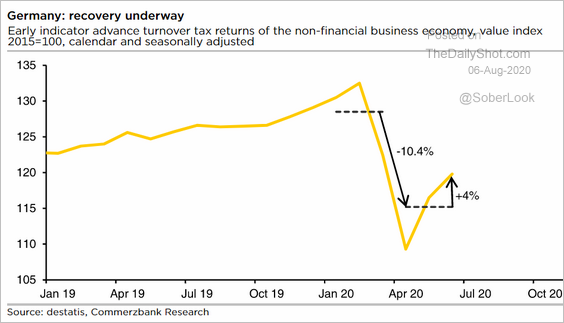
4. Germany’s advance notifications for VAT (sales tax) submitted by companies are recovering, indicating firmer sales.
 Source: Commerzbank Research
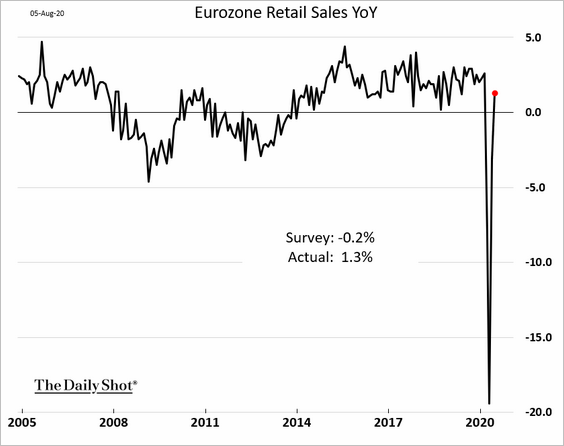
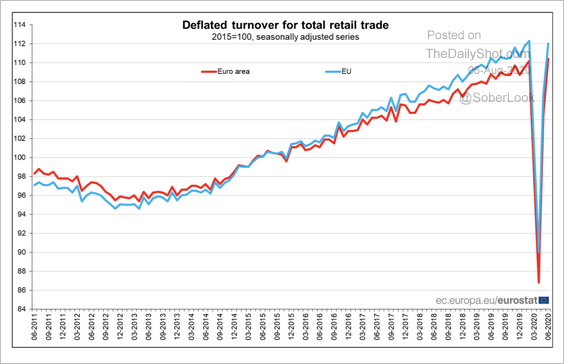
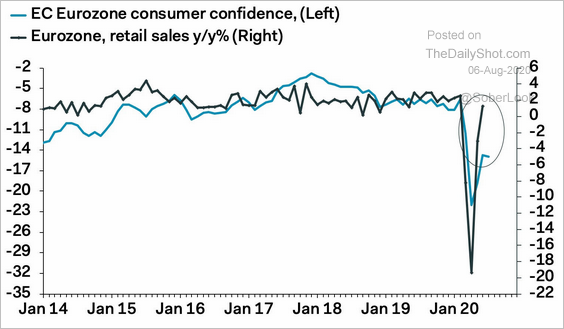
5. Retail sales rebounded in June, exceeding forecasts.
• Year-over-year % changes:
• Sales level:
 Source: Eurostat Read full article
But weak sentiment could drag sales lower in the months ahead.
 Source: Pantheon Macroeconomics
Europe
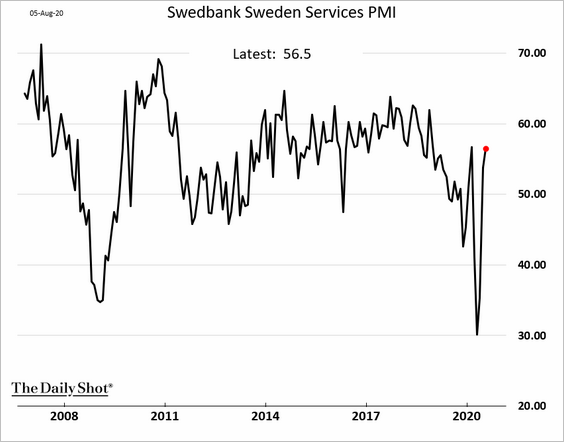
1. Sweden’s services PMI shows strengthening growth.
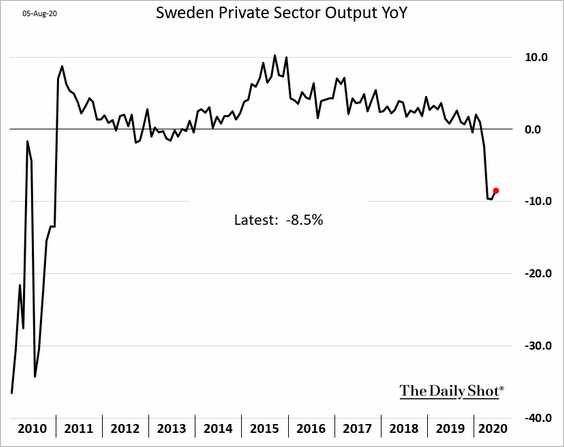
On the other hand, private sector output barely budged in June.
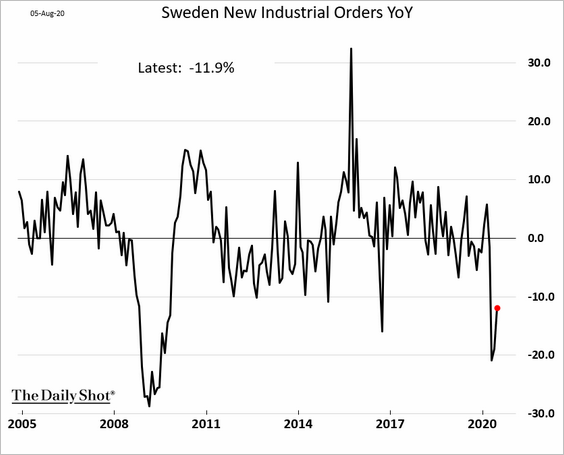
New industrial orders remained soft.
——————–
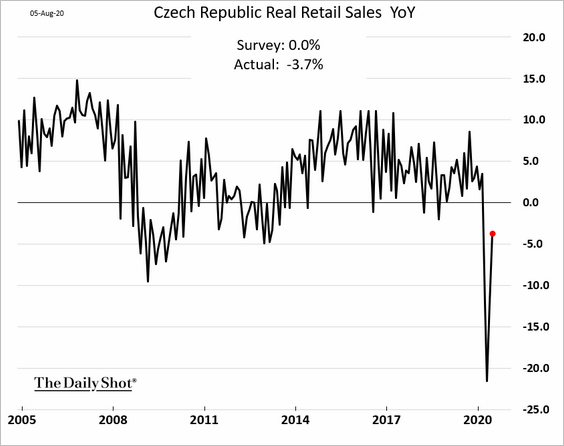
2. Czech retail sales are still fragile.
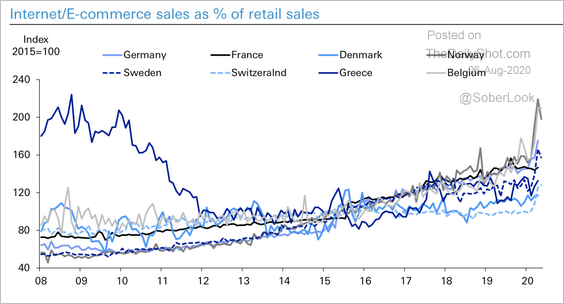
3. This chart compares online retail sales trends across several European economies.
 Source: Deutsche Bank Research
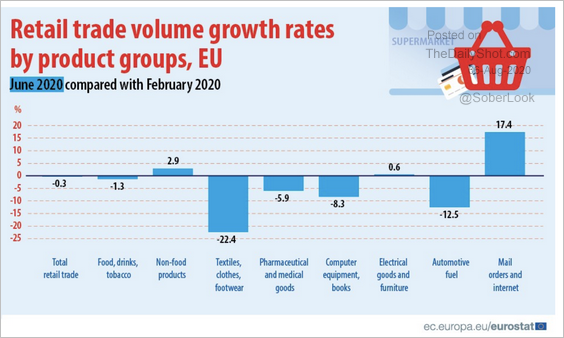
4. Finally, we have retail sales growth by product group, between February and June.
 Source: Eurostat Read full article
Japan
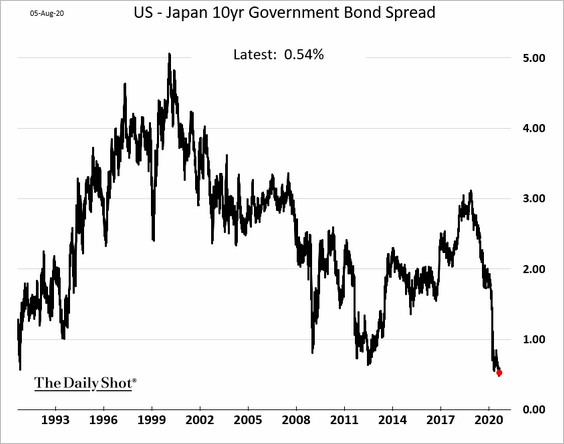
1. The US-Japan 10yr bond spread hit a multi-year low.
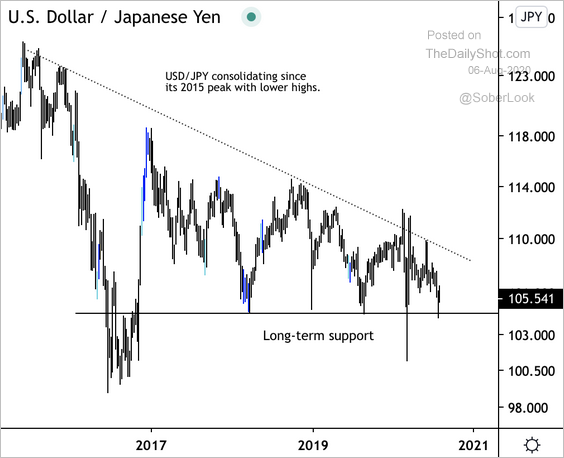
2. For now, USD/JPY is holding long-term support above 103.
 Source: @DantesOutlook
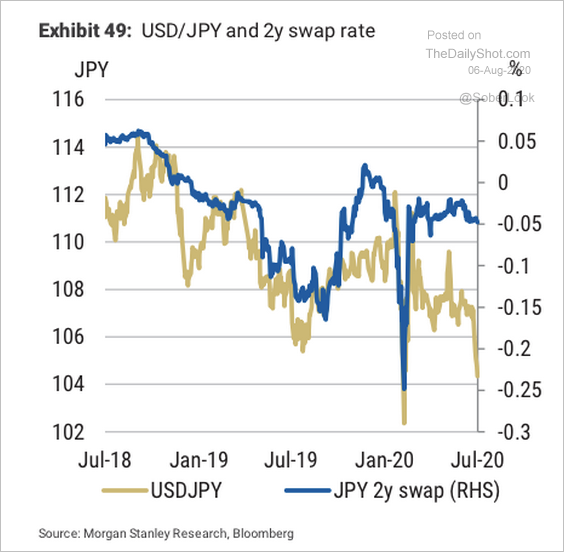
Short-end Japanese government bond yields have been closely correlated with USD/JPY and have tended to rally with strong yen. That has fueled speculation of a possible BoJ rate cut, according to Morgan Stanley.
 Source: Morgan Stanley Research
——————–
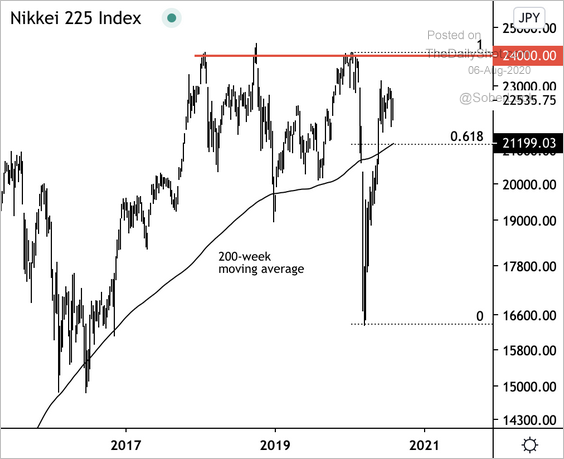
3. The Nikkei 225 is holding support from its 200-week moving average.
 Source: @DantesOutlook
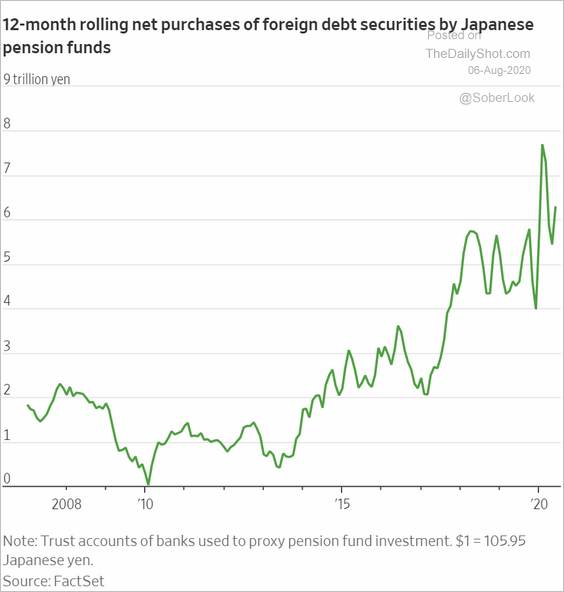
4. Japanese pension funds continue to boost their foreign debt holdings.
 Source: @WSJ Read full article
China
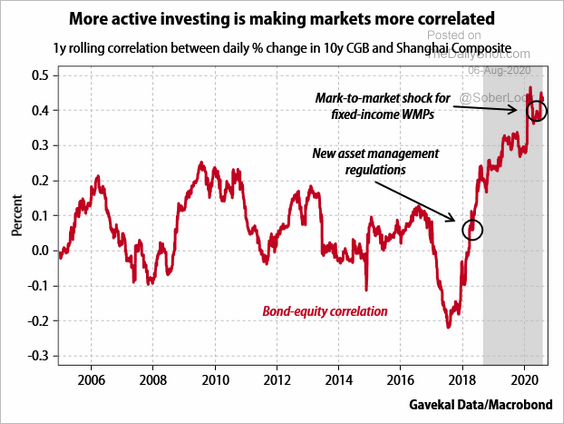
1. The bond-equity correlation has been climbing.
 Source: Gavekal
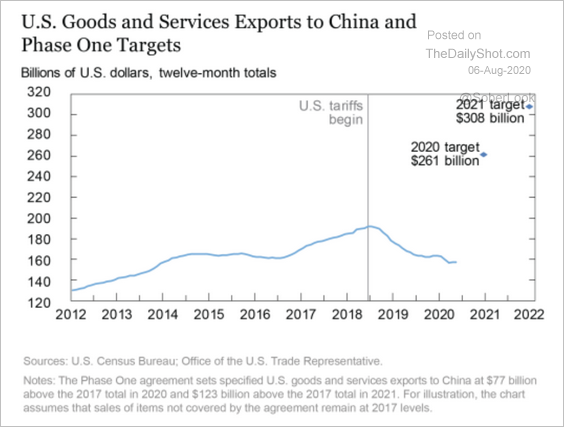
2. This chart shows US exports to China on a rolling 12-month basis, along with the implied Phase-1 targets for 2020 and 2021.
 Source: NY Fed
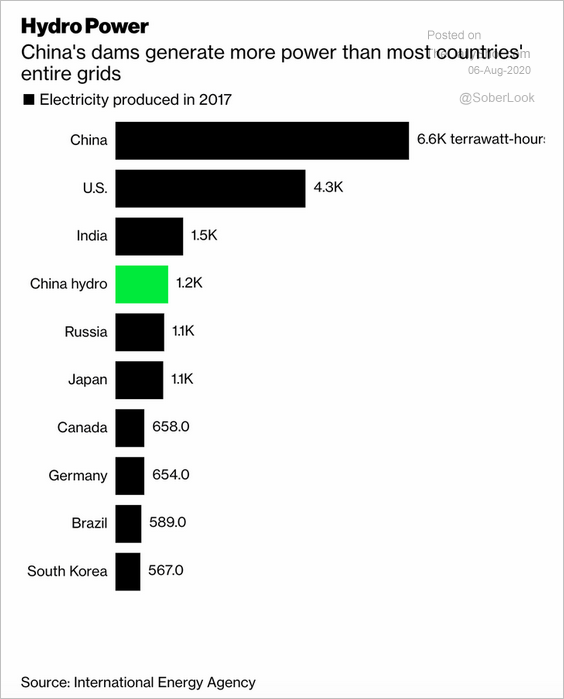
3. China’s hydroelectric power generation is massive.
 Source: @adam_tooze, @business Read full article
Emerging Markets
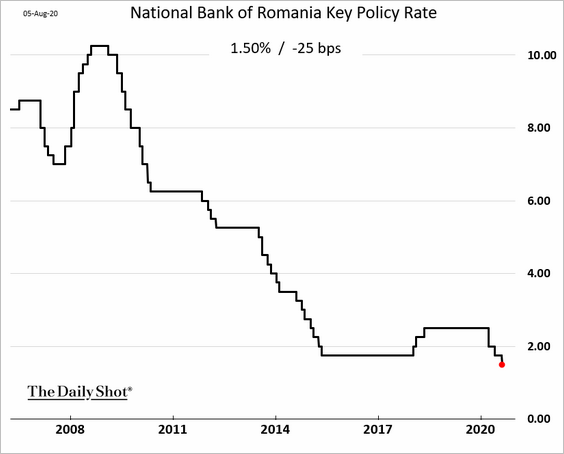
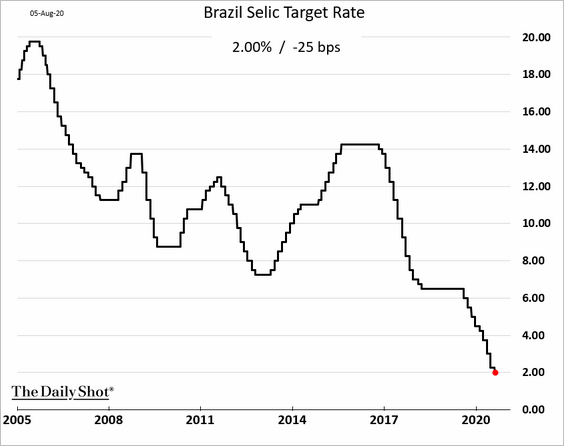
1. EM central banks continue to ease.
• Romania:
• Brazil:
——————–
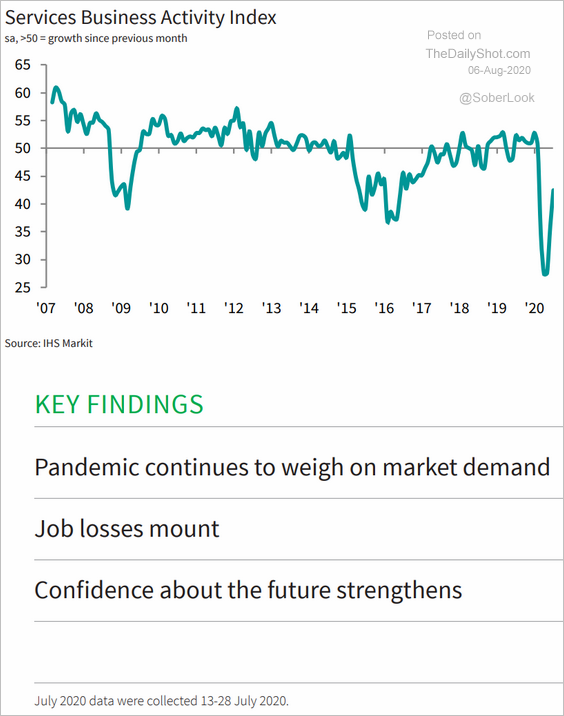
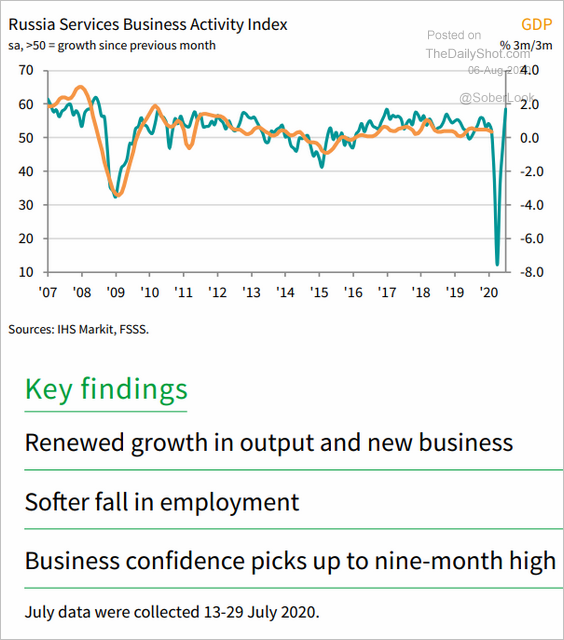
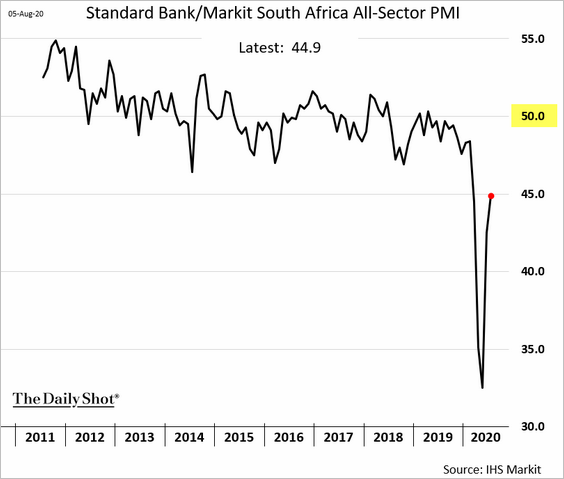
2. Now let’s take a look at some service-sector PMI trends.
• Brazil (still in contraction territory):
 Source: IHS Markit Read full article
• Russia (back in growth):
 Source: IHS Markit Read full article
• South Africa:
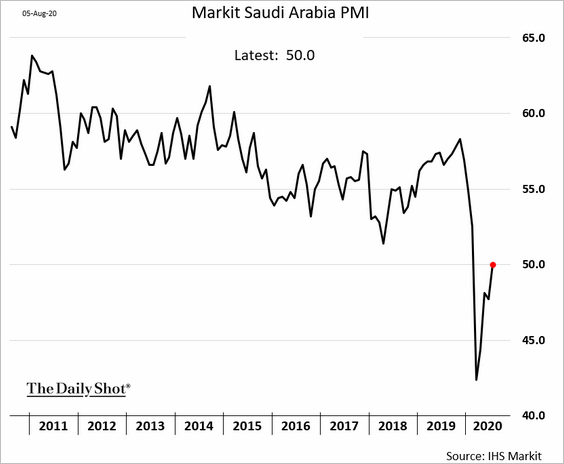
• Saudi Arabia:
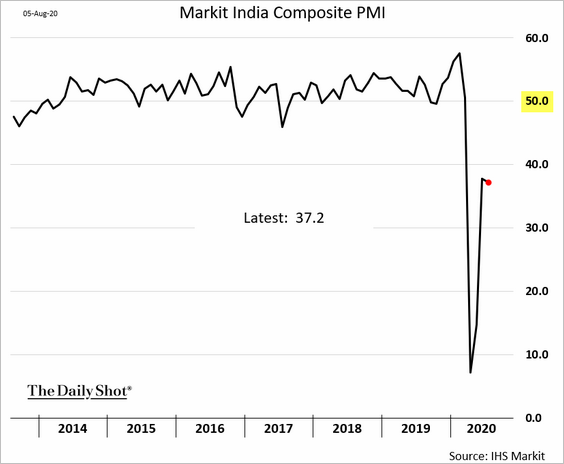
India’s composite PMI shows persistent weakness in business activity.
——————–
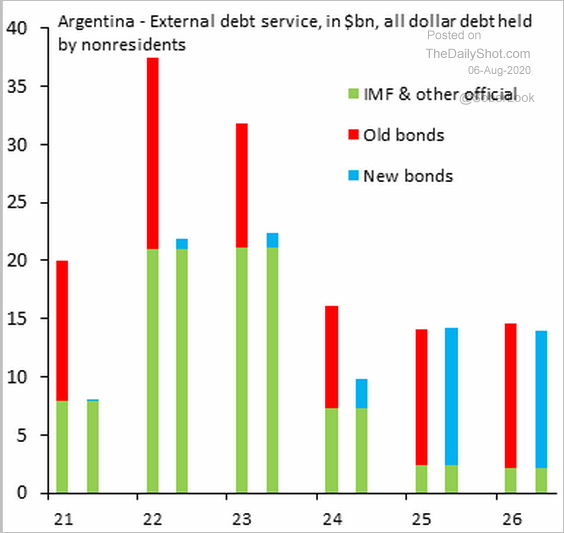
3. Here is Argentina’s sovereign debt profile.
 Source: @SergiLanauIIF
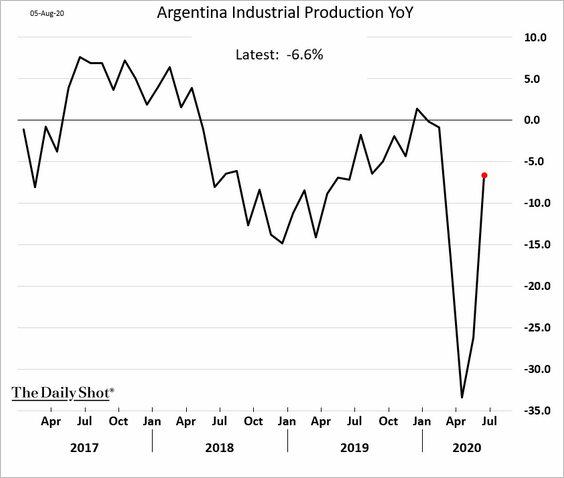
Separately, Argentina’s industrial production is recovering.
——————–
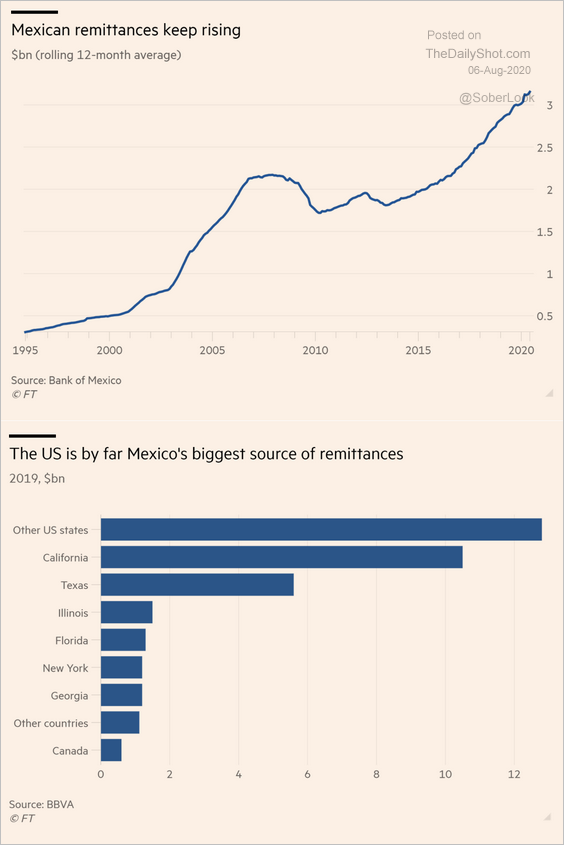
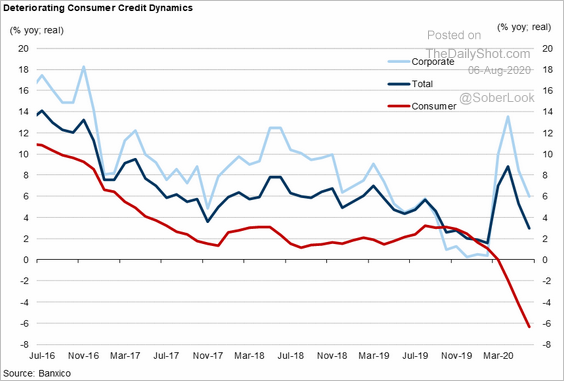
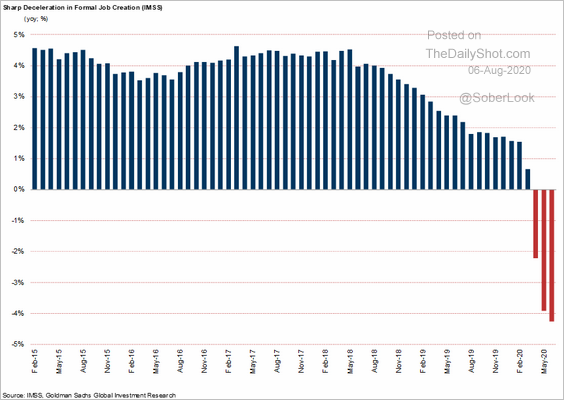
4. Next, we have some updates on Mexico.
• Remittances:
 Source: @financialtimes Read full article
• Credit growth:
 Source: Goldman Sachs
• Formal job creation (year-over-year):
 Source: Goldman Sachs
——————–
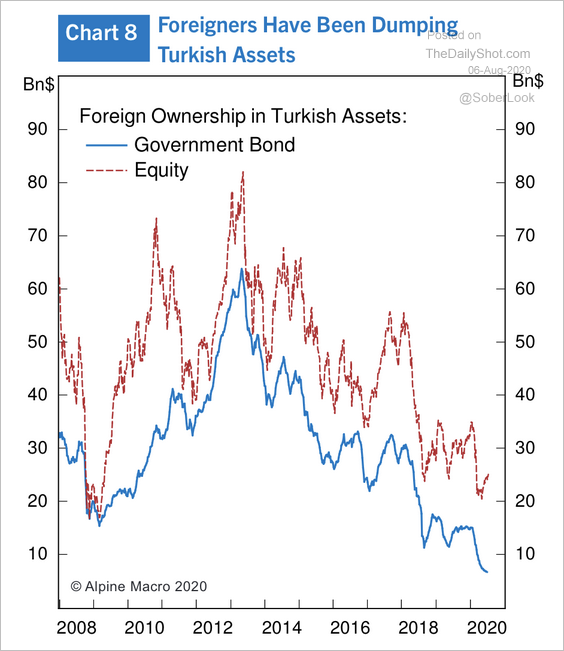
5. The Turkish lira is struggling.
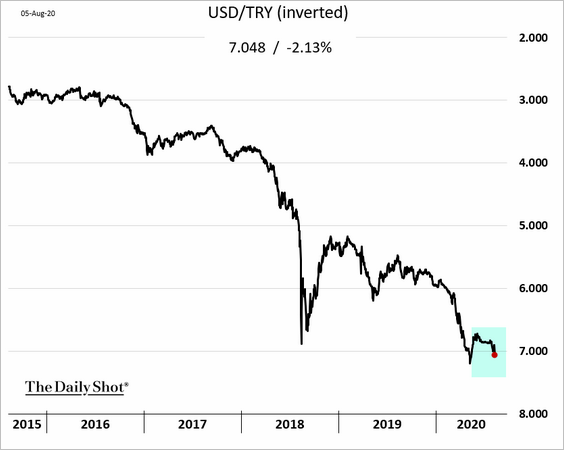
Foreign holdings of Turkish assets have fallen sharply.
 Source: Alpine Macro
Commodities
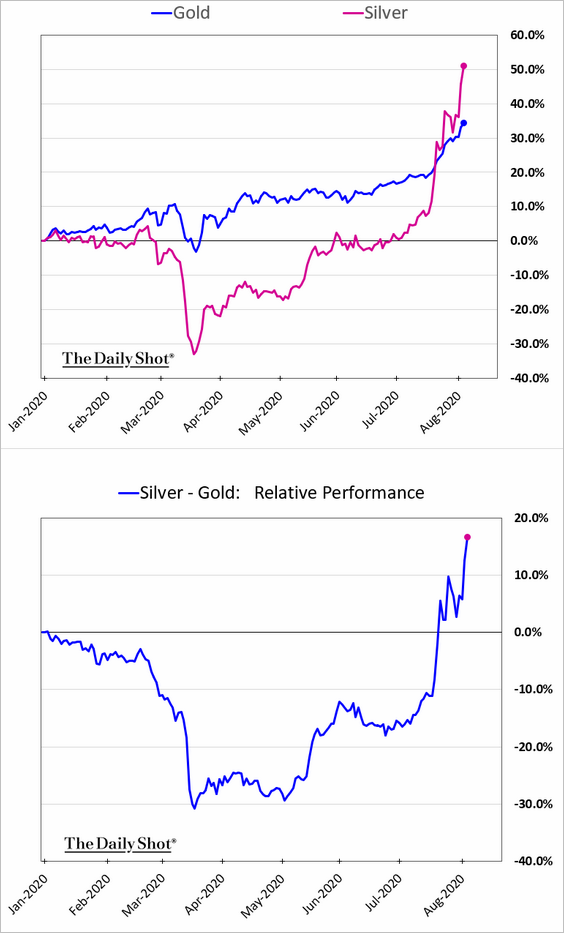
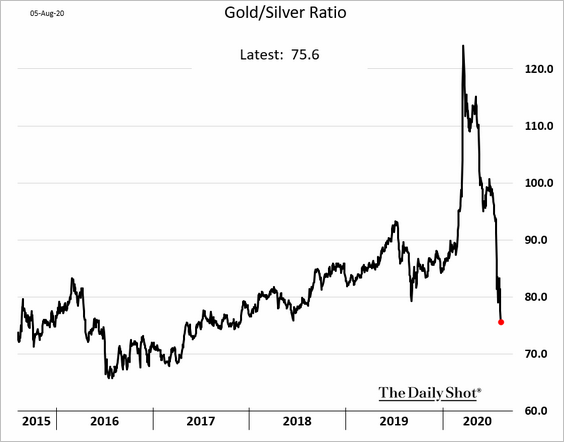
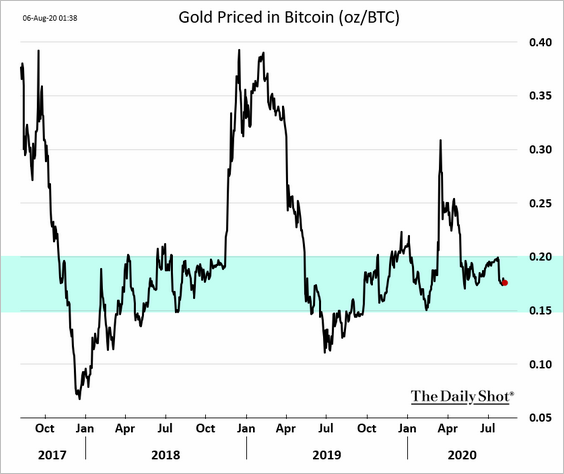
1. Once again, let’s begin with precious metals.
• Gold vs. silver:
• Gold priced in bitcoin:
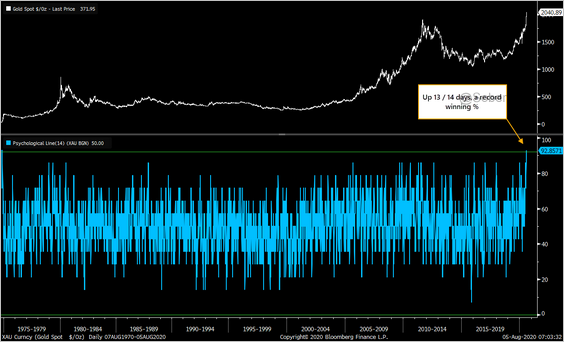
• Gold has been up 13 out of 14 days.
 Source: @sentimenttrader
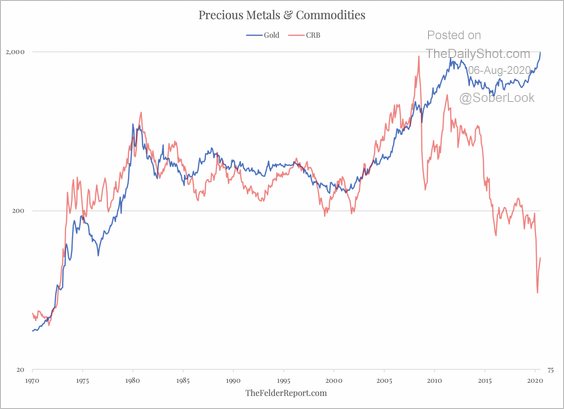
• Gold vs. the CRB commodities index (since 1970):
 Source: @jessefelder Read full article
——————–
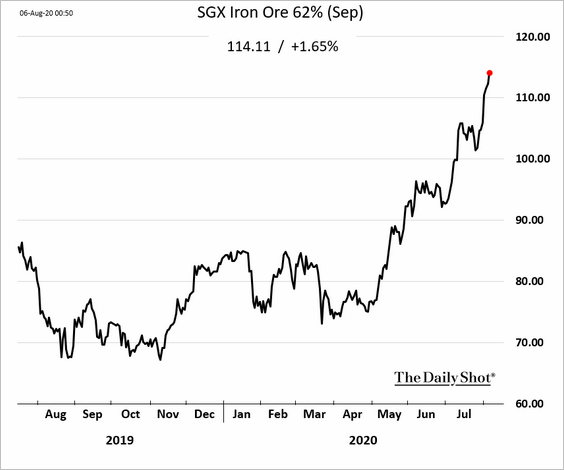
2. Iron ore futures continue to rally on strengthening demand from China.
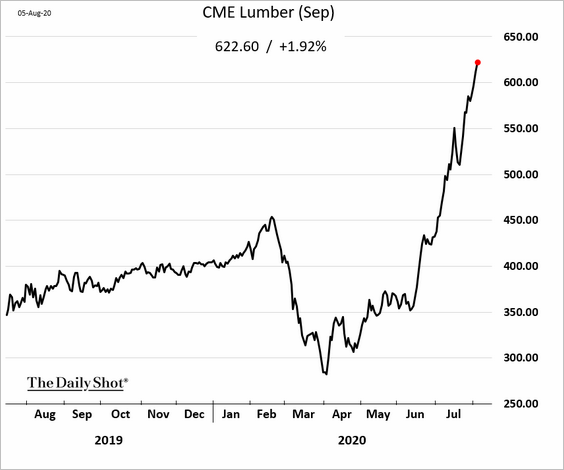
3. US lumber futures are soaring.
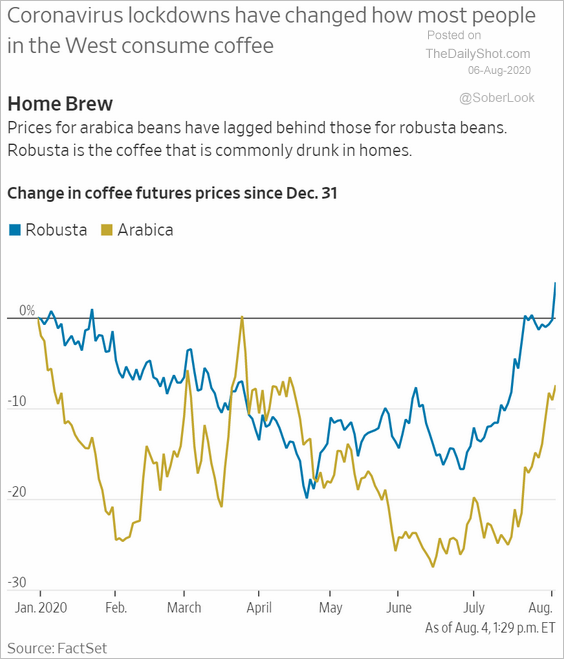
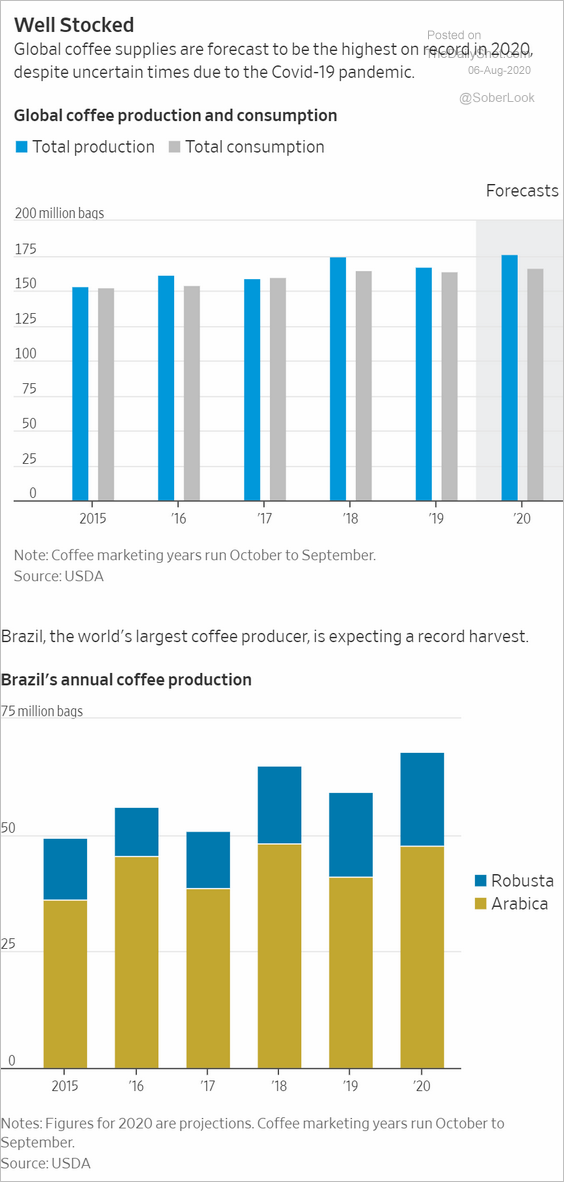
4. Coffee prices have been recovering, despite ample supplies (chart 2 and 3 below).
 Source: @WSJ Read full article
 Source: @WSJ Read full article
Energy
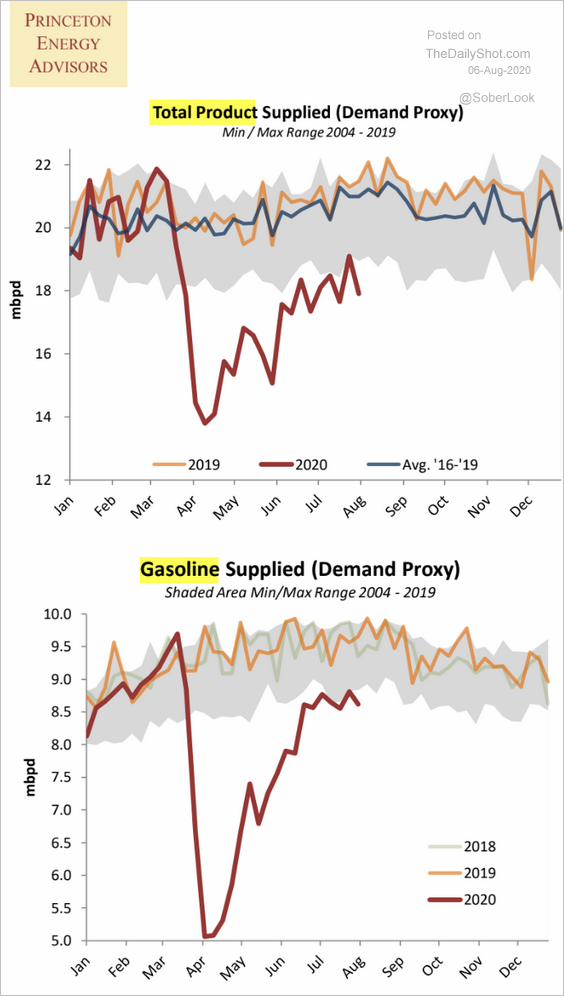
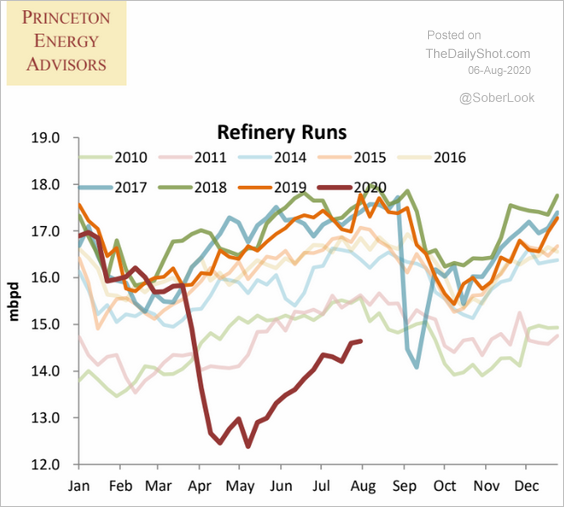
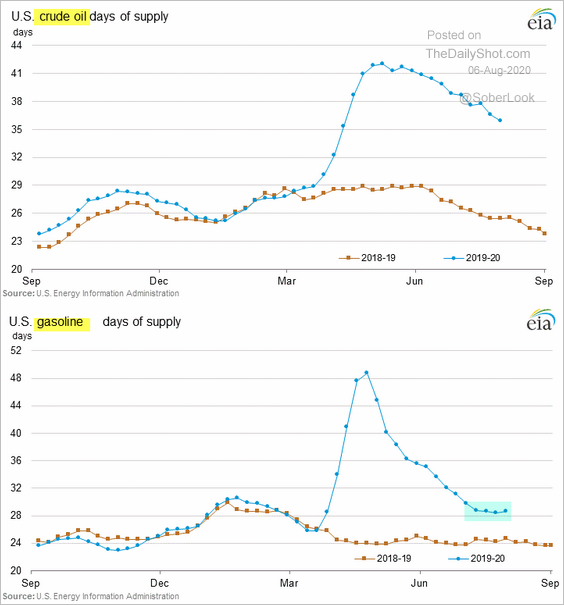
1. US demand for gasoline and refined products remains below the 5-year range.
 Source: Princeton Energy Advisors
Refinery inputs continue to recover.
 Source: Princeton Energy Advisors
——————–
2. Gasoline inventories have leveled off.
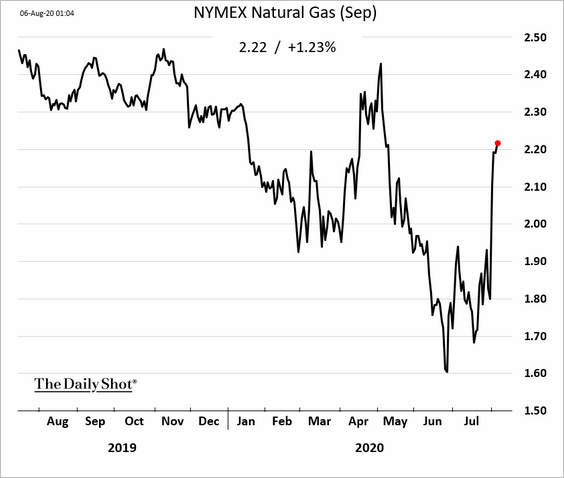
3. US natural gas price rebound has been impressive.
Equities
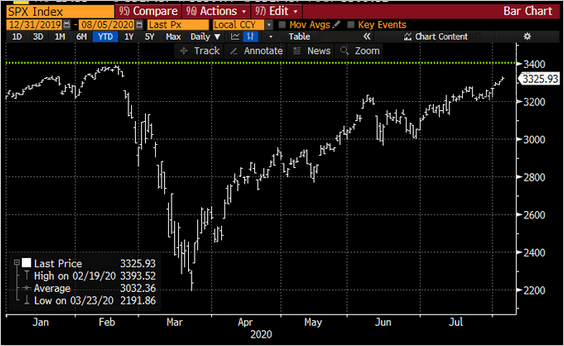
1. The S&P 500 is 2% away from its record high.
 Source: @kgreifeld
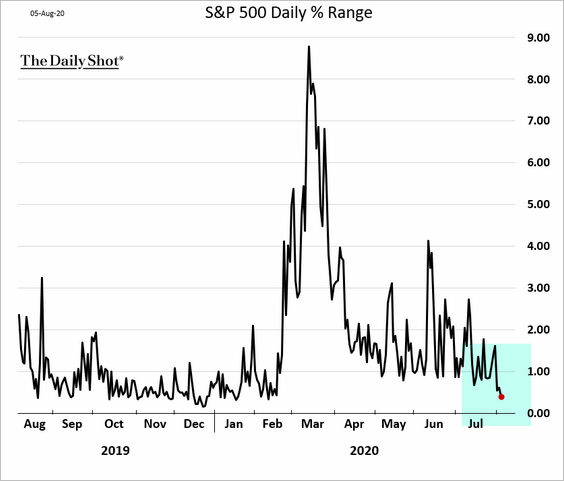
2. Volatility has collapsed.
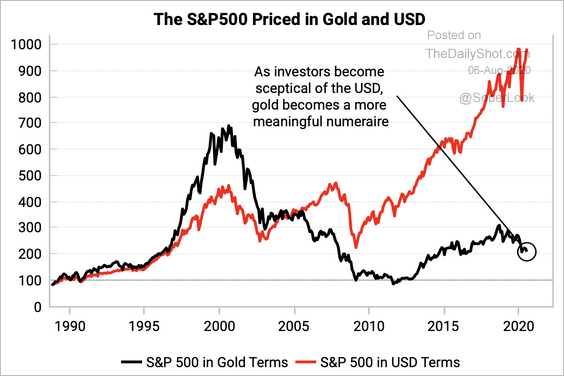
3. Here is the S&P 500 priced in gold.
 Source: Variant Perception
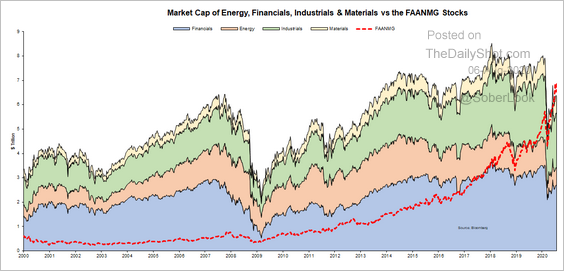
4. FAANMG stocks are now worth $7 trillion – more than the financial, energy, industrial, and material sectors combined.
 Source: @VincentDeluard
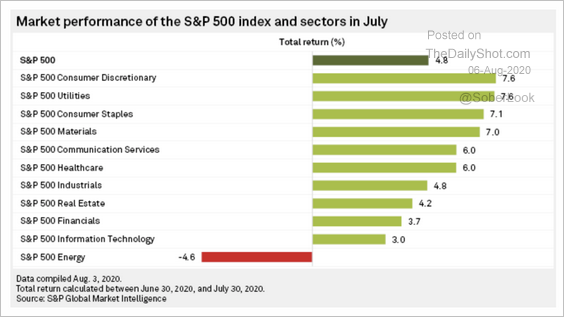
5. Here is the sector performance for July.
 Source: S&P Global Market Intelligence Read full article
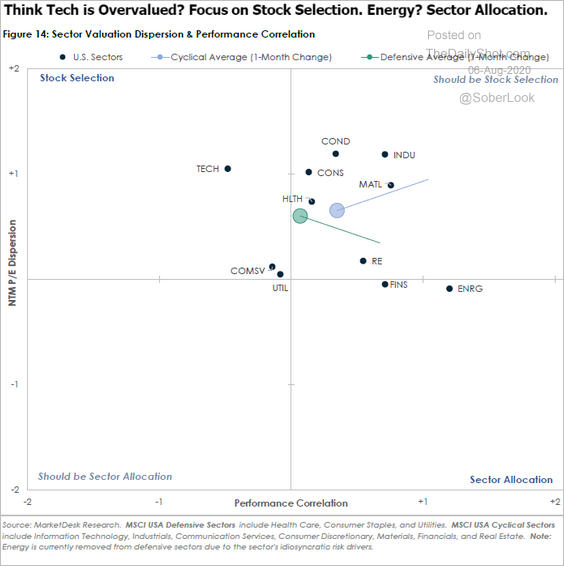
6. When valuation dispersion is elevated and the correlation within the sector is relatively low, stock picking makes sense. On the other hand, lower P/E dispersion and higher correlation suggest that using a sector ETF will do the job.
 Source: MarketDesk Research
Credit
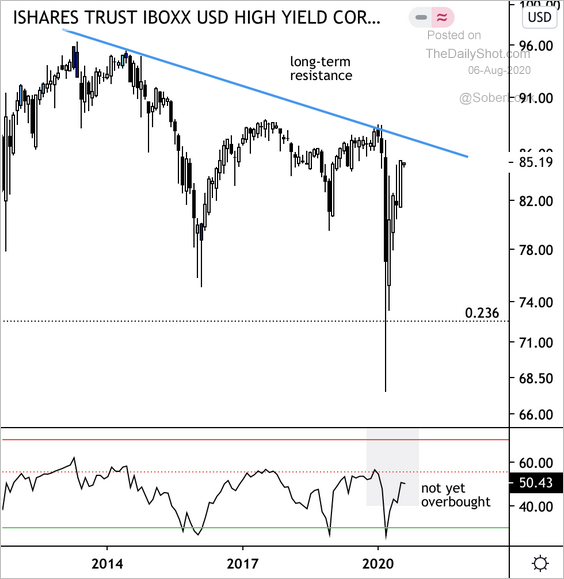
1. The iShares high-yield ETF (HYG) is approaching long-term resistance.
 Source: @DantesOutlook
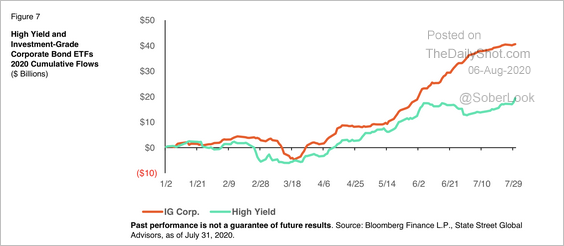
2. High-yield ETF flows have outpaced investment-grade ETF flows this year.
 Source: SPDR Americas Research, @mattbartolini
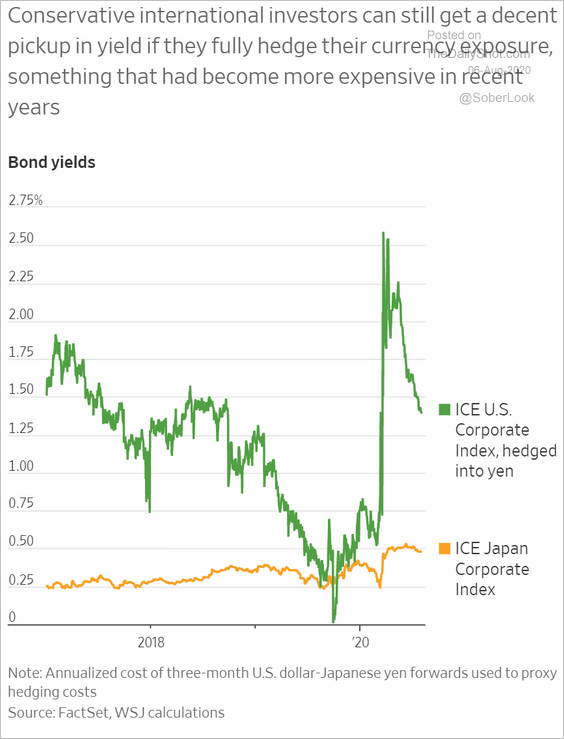
3. US corporate bonds are attractive when hedged into yen.
 Source: @WSJ Read full article
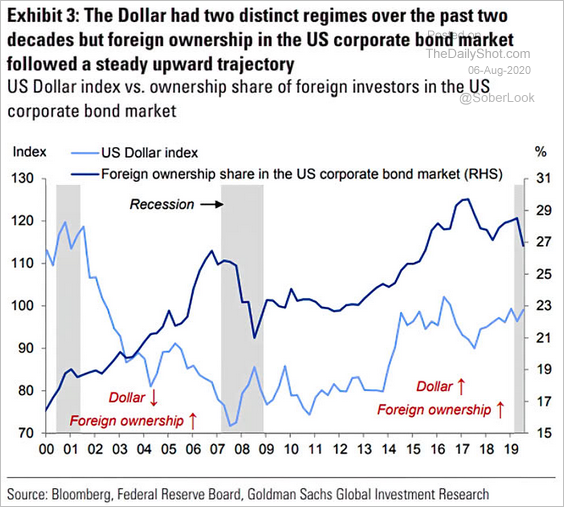
4. Foreign investors in US corporate bonds have not been sensitive to longer-term movements in the dollar.
 Source: Goldman Sachs, @ISABELNET_SA
5. Yields on high-rated US muni bonds are hitting new lows.
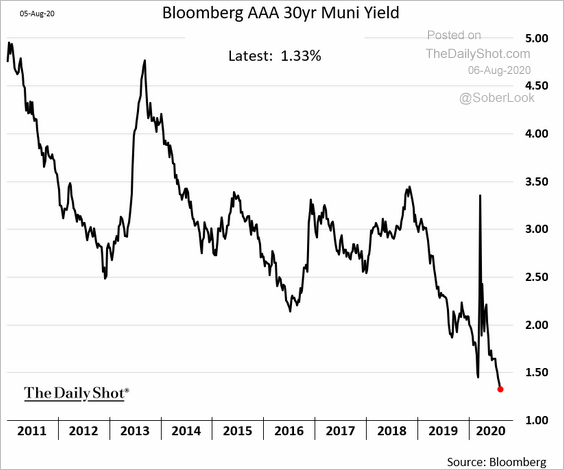 h/t @amanda_albright
Global Developments
1. How do parents around the world feel about sending kids back to school/daycare?
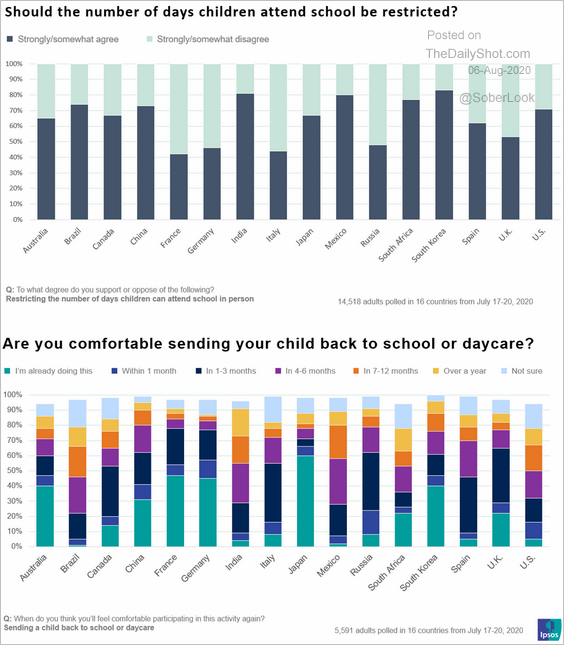 Source: Ipsos
2. This heatmap shows mobility trends by country.
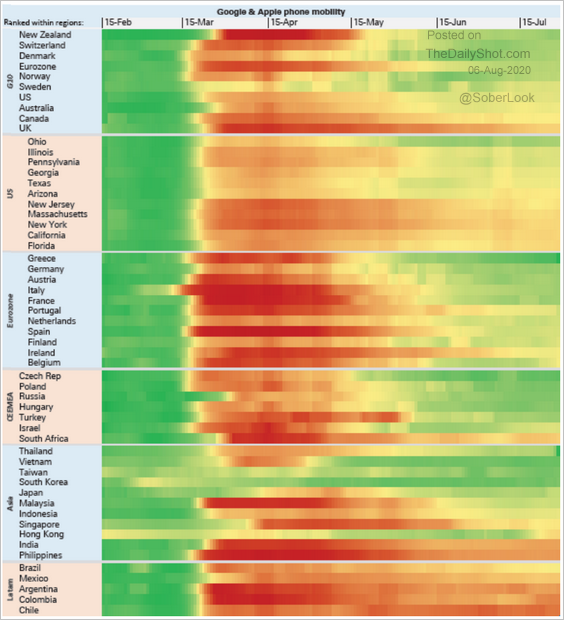 Source: Deutsche Bank Research
• The Q2 GDP change is correlated with the Google mobility index.
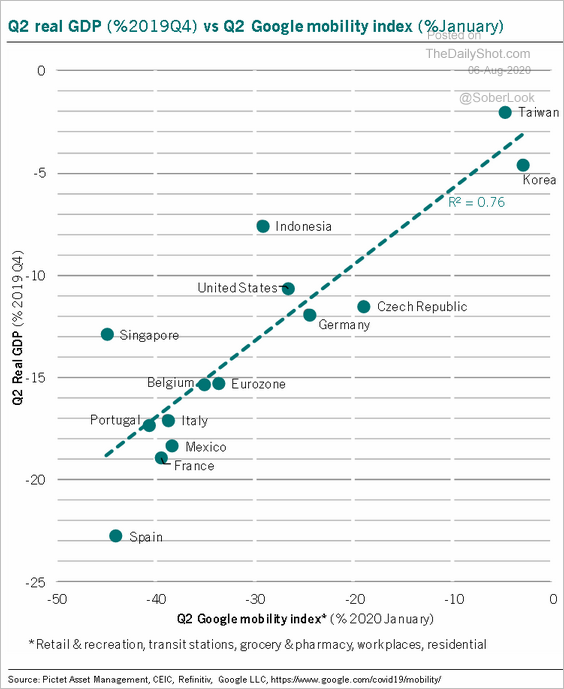 Source: @PkZweifel
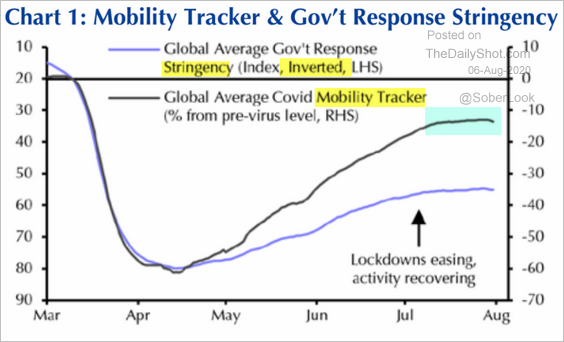
• Mobility has leveled off and so has the easing of lockdowns globally.
 Source: Capital Economics
——————–
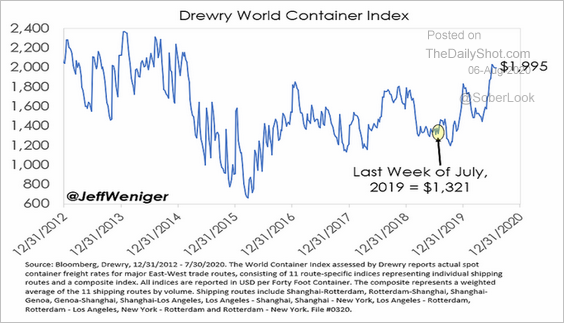
3. Container shipping costs have risen recently.
 Source: @JeffWeniger
——————–
Food for Thought
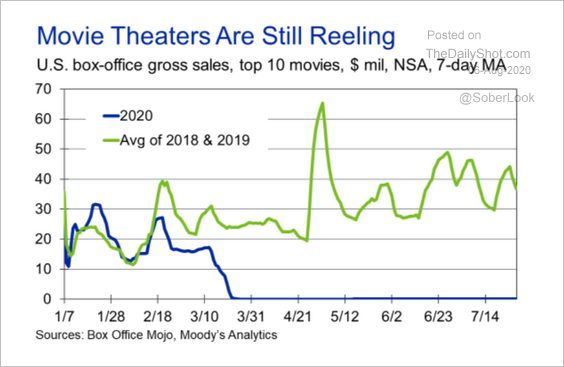
1. US box-office sales:
 Source: Moody’s Analytics
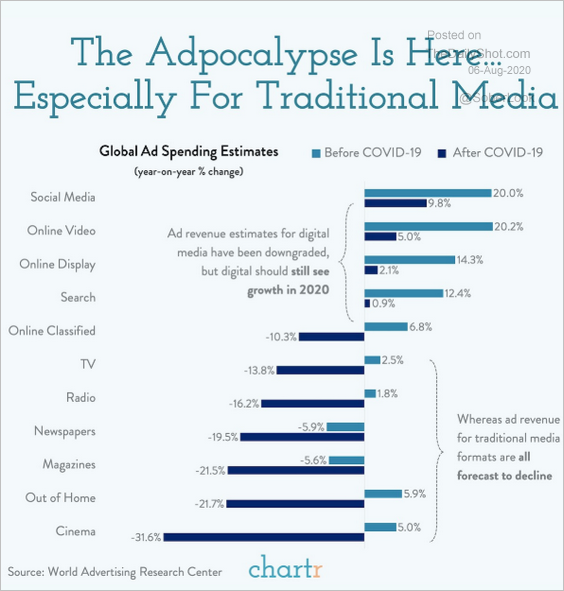
2. Traditional media is under pressure:
 Source: @chartrdaily
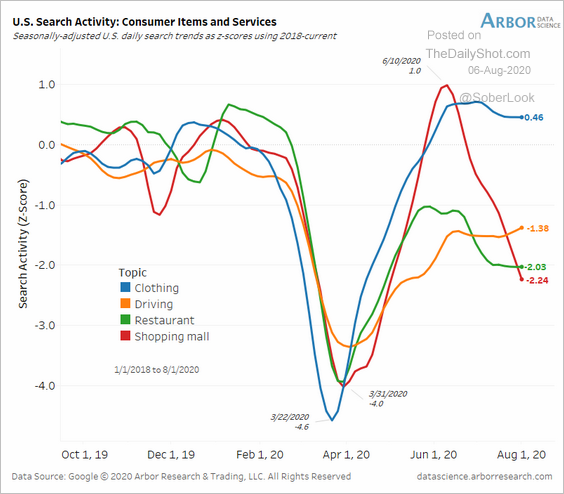
3. Online search activity for consumer items and services:
 Source: Arbor Research & Trading
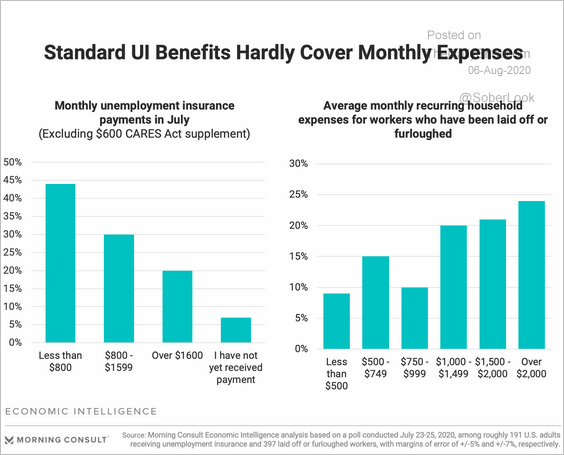
4. Unemployment insurance (excl. the $600 boost) vs. household expenses:
 Source: Morning Consult Read full article
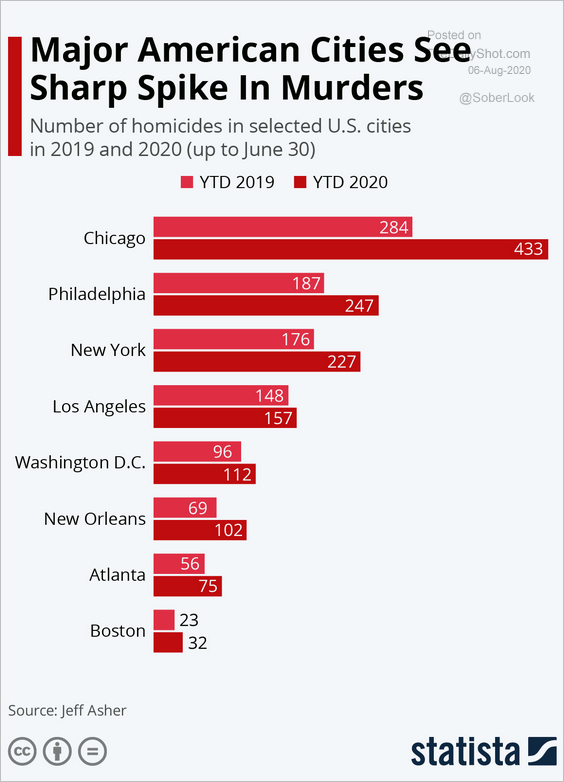
5. Homicides in US cities:
 Source: Statista
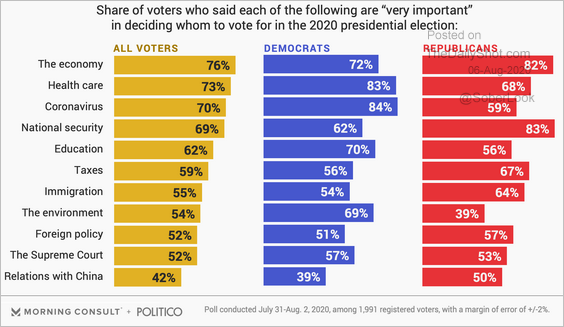
6. Key issues for the US 2020 election:
 Source: Morning Consult Read full article
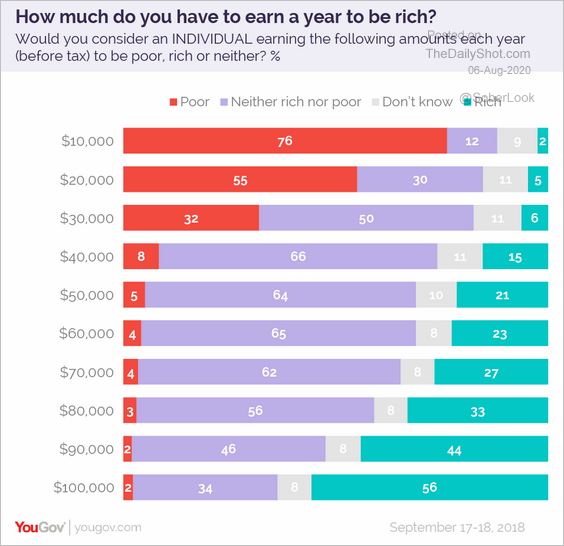
7. How much do you have to earn to be rich?
 Source: YouGov Read full article
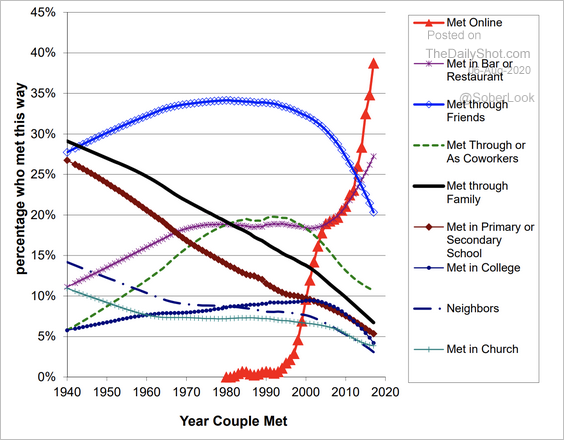
8. How heterosexual couples have met:
 Source: Rosenfeld, Thomas, Hausen (Proceedings of the National Academy of Sciences)
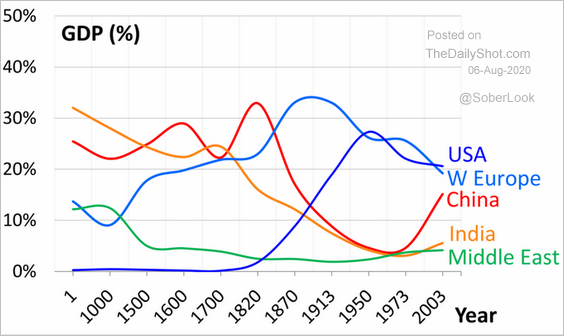
9. The share of global GDP since AD 1:
 Source: @adam_tooze, @TheEconomist Read full article
——————–
