
The Daily Shot: 17-Aug-20
• The United States
• The United Kingdom
• The Eurozone
• Asia – Pacific
• China
• Emerging Markets
• Cryptocurrency
• Commodities
• Energy
• Equities
• Rates
• Food for Thought
The United States
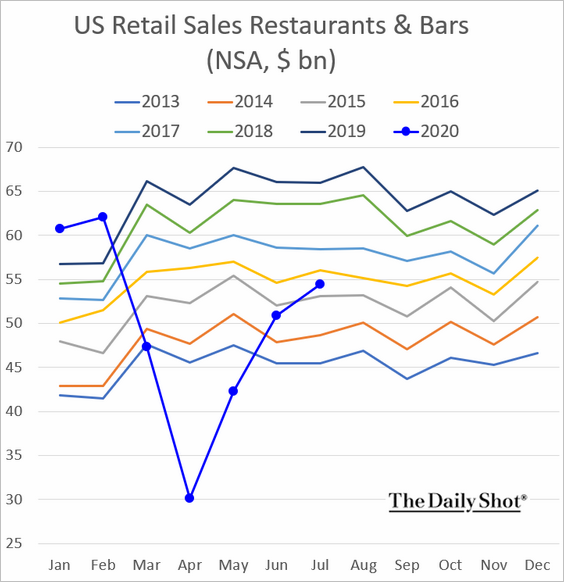
1. Retail sales climbed again last month, …
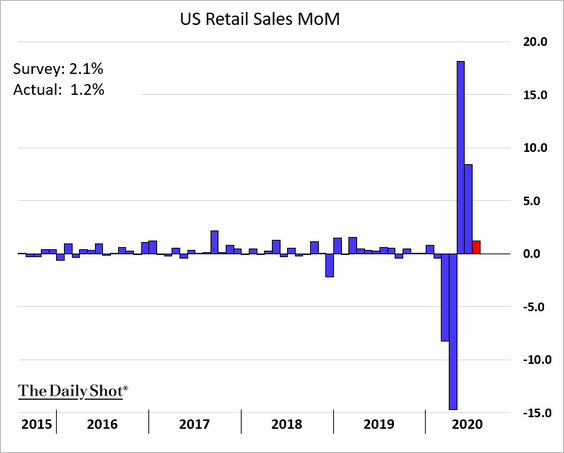
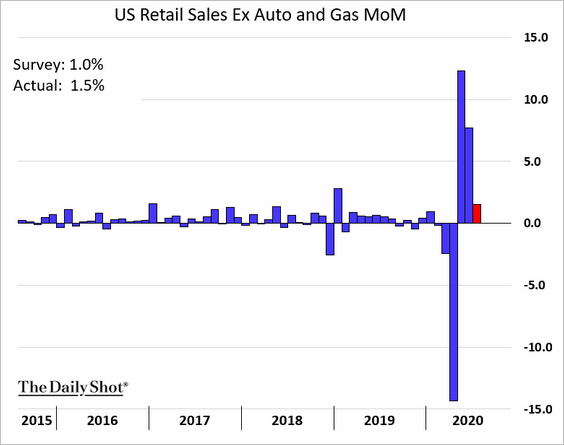
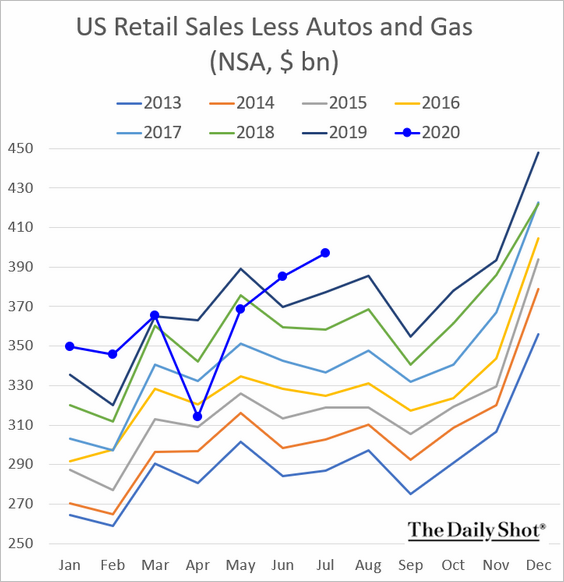
… recovering all of the pandemic losses. This chart shows the rebound in retail sales without seasonal adjustments.
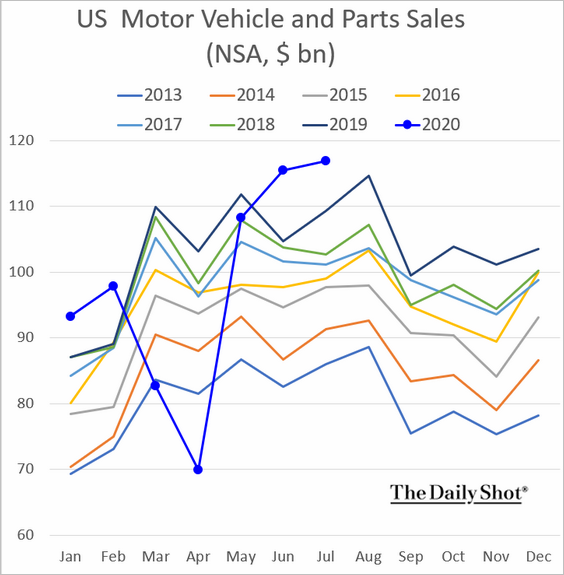
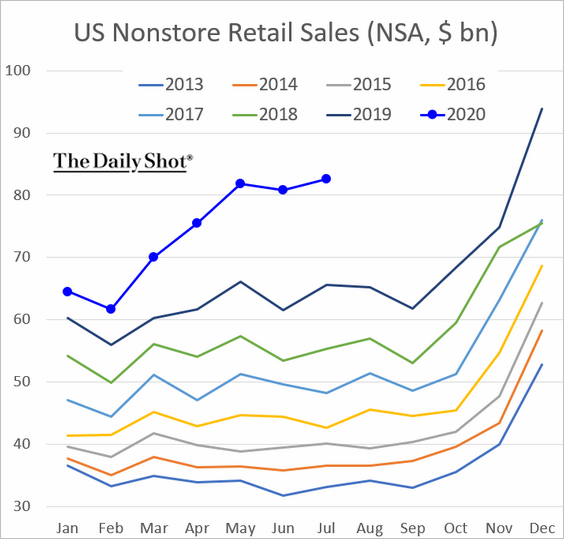
Here are some trends by sector.
• Vehicle sales:
• Restaurants and bars:
• Nonstore (mostly online) retail sales:
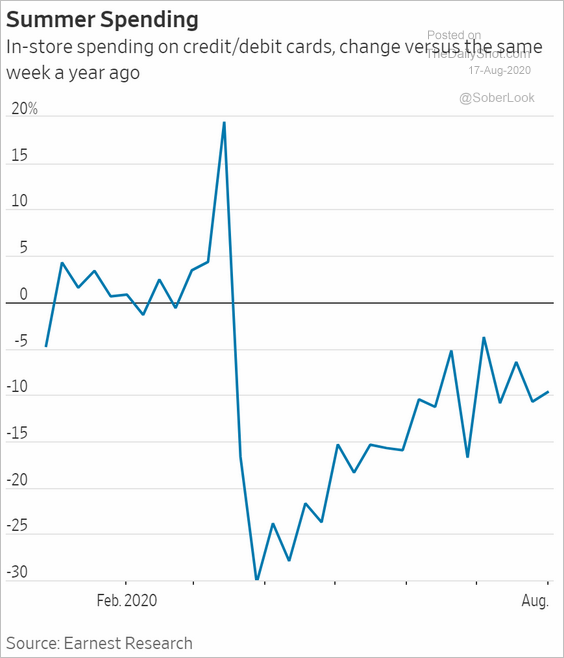
• In-store sales (year-over-year):
 Source: @WSJ Read full article
——————–
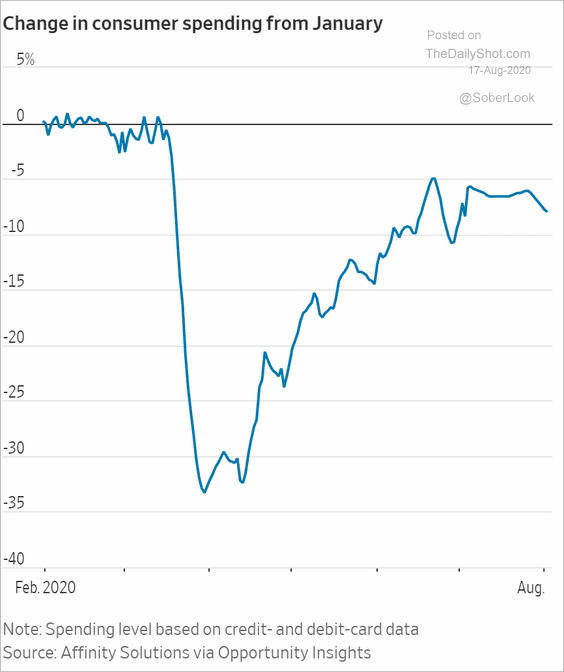
2. The rebound in retail sales has been impressive, but economists are concerned about the overall consumption growth. The charts below show high-frequency spending data.
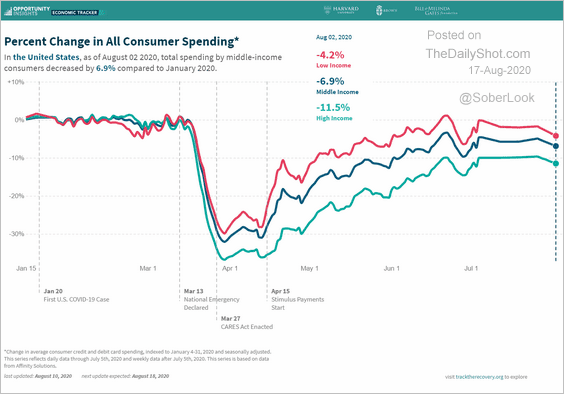 Source: Opportunity Insights, Harvard
 Source: @WSJ Read full article
——————–
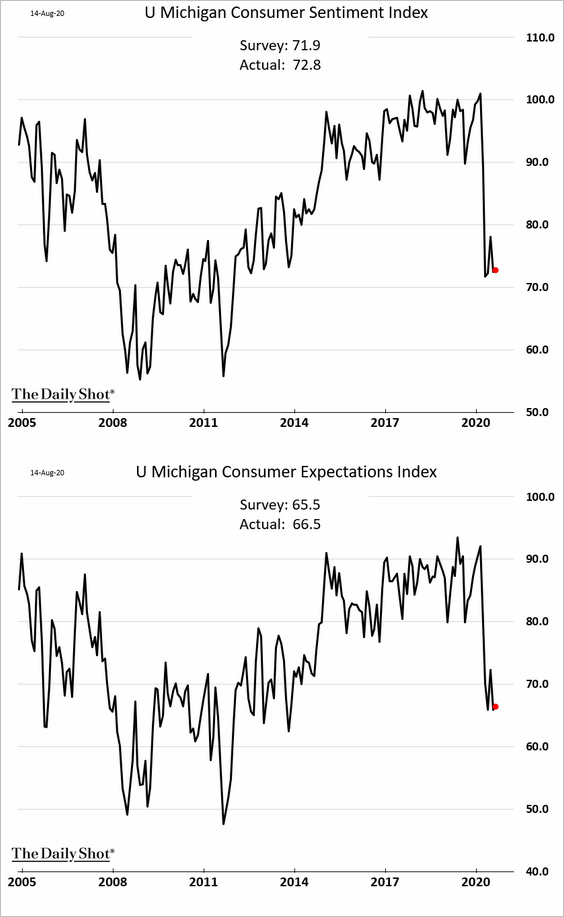
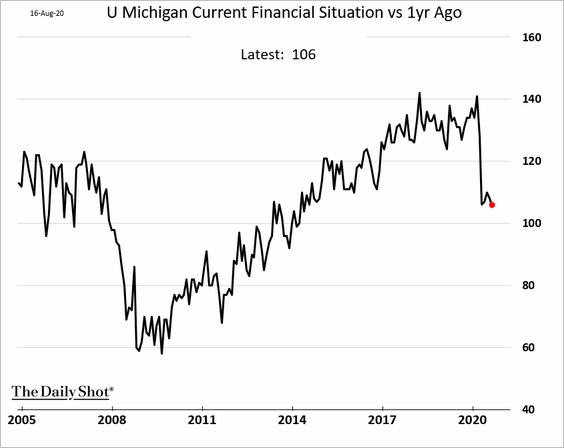
3. Consumer confidence ticked up in the first half of August, but it remains near pandemic lows.
• Current financial situation vs. one year ago:
• Buying conditions for large household items:
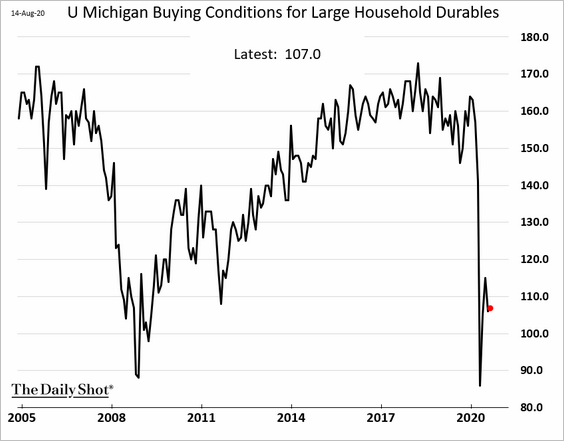
Separately, auto buying conditions for the bottom two-thirds of wage earners, who comprise 43% of car sales, are at multi-year lows, according to Quill Intelligence.
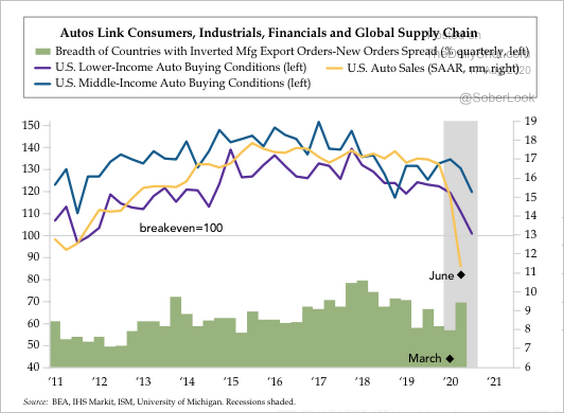 Source: The Daily Feather
• And here is the consumer expectations index by political affiliation.
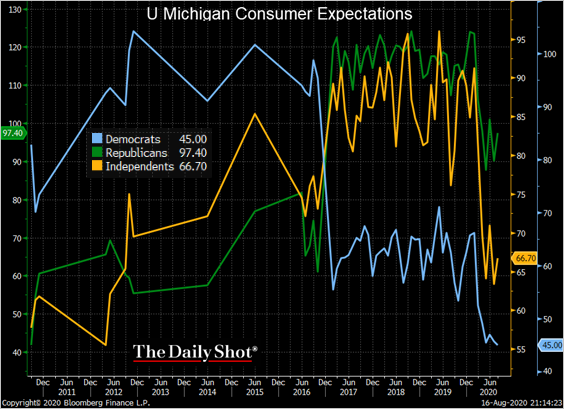 Source: @TheTerminal
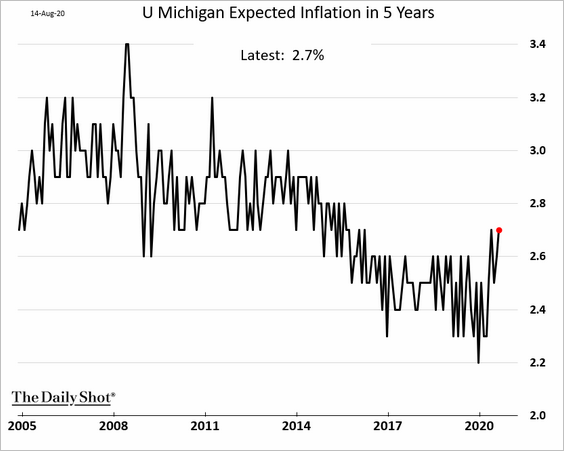
• Inflation expectations remain elevated relative to the past few years.
——————–
4. Next, we have some household survey data from the New York Fed.
• Income growth expectations by income category:
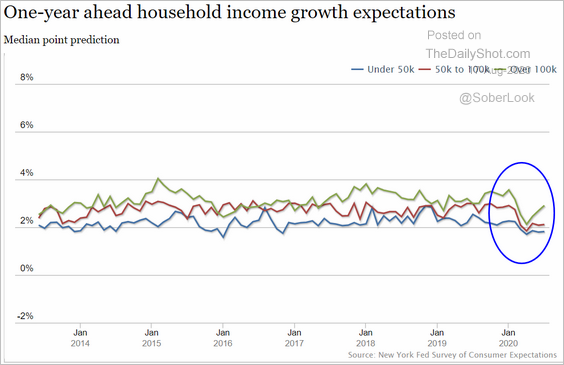 Source: New York Fed
• Job finding expectations:
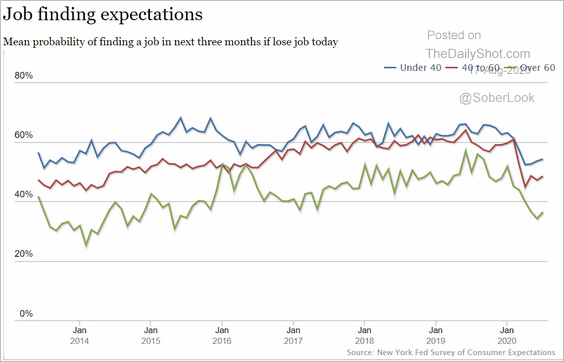 Source: New York Fed
——————–
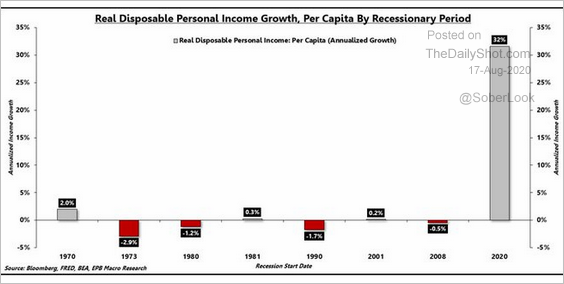
5. Massive government support made the current recession very different from previous downturns. Below are the changes in disposable income during each recession.
 Source: @jsblokland
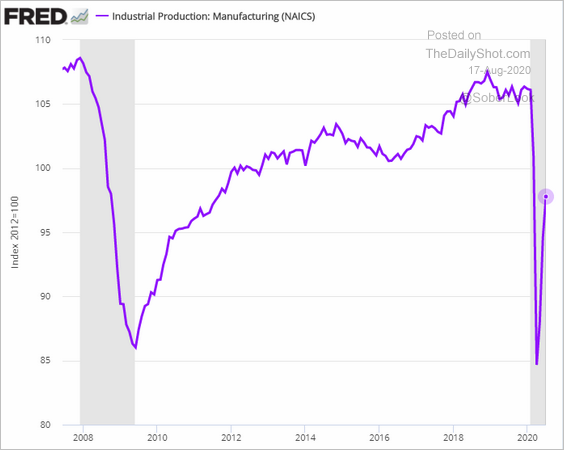
6. Industrial production continued to recover last month, with factory output strengthening.
• Month-over-month:

• Manufacturing output (level):
• Capacity utilization:

——————–
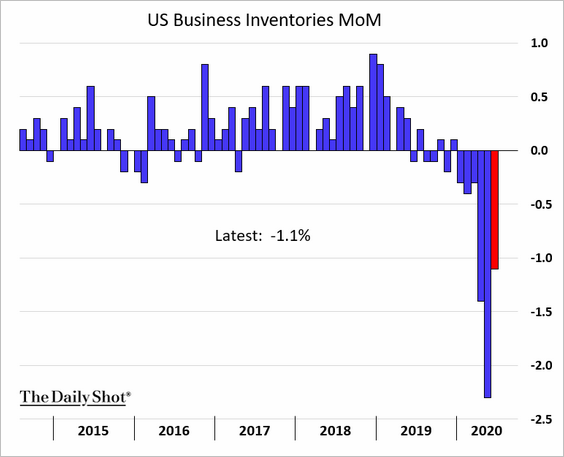
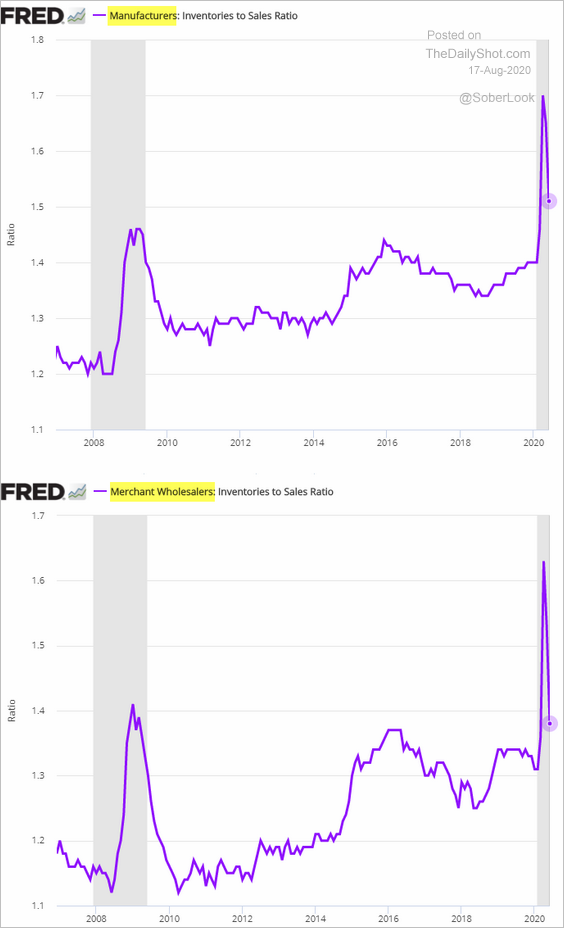
7. Inventories were down for the sixth month in a row in June.
Inventory-to-sales ratios are coming off the highs.
——————–
8. Productivity rose sharply in the second quarter as hours worked collapsed.
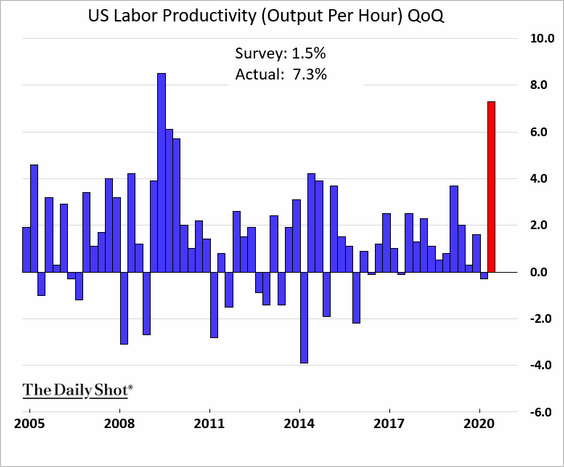
 Source: AP Read full article
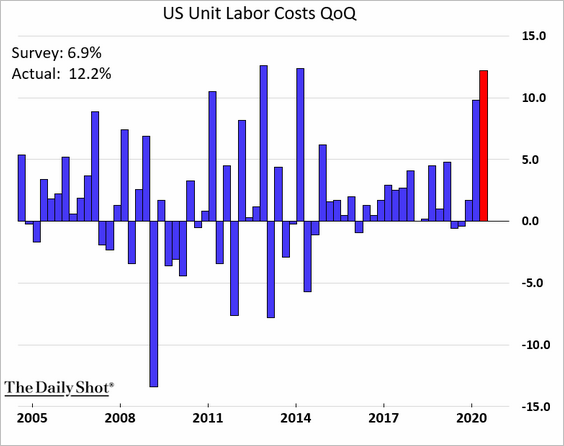
Reduced hours also pushed up unit labor costs.
The United Kingdom
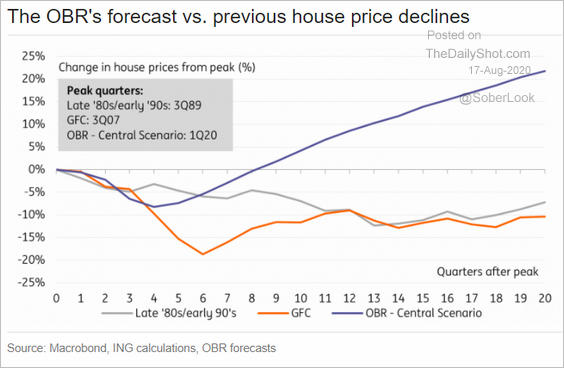
1. Home price appreciation continues to strengthen.
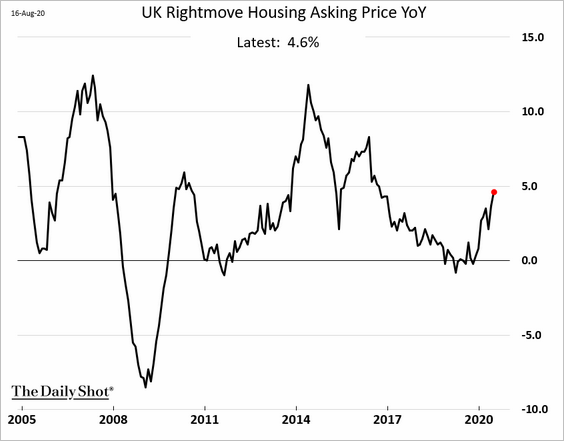
The Office for Budget Responsibility expects housing prices to keep climbing.
 Source: ING
——————–
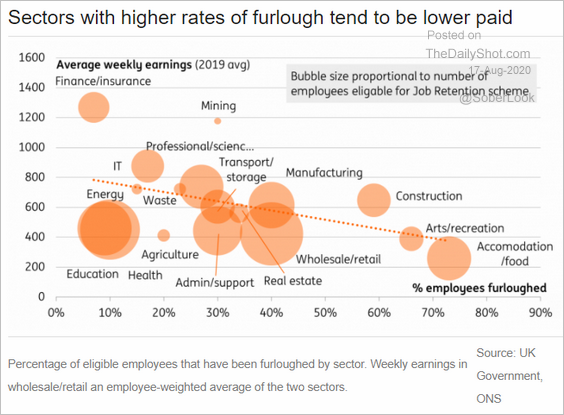
2. This scatterplot shows earnings vs. the percentage of employees furloughed, by sector.
 Source: ING
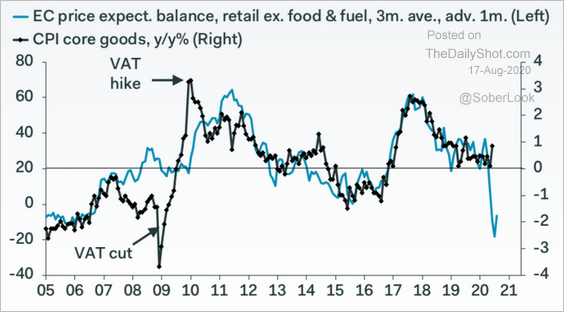
3. The risks to the UK core CPI are currently to the downside.
 Source: Pantheon Macroeconomics
The Eurozone
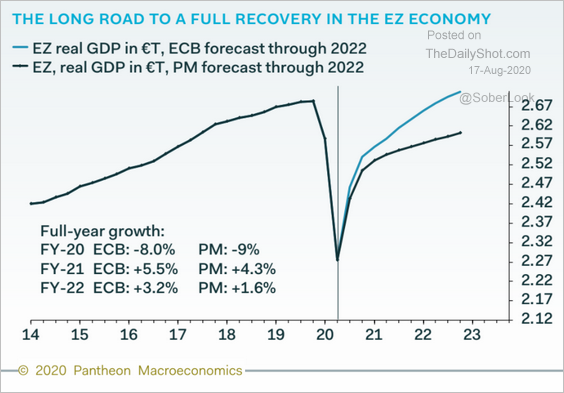
1. The Q2 GDP contraction was unprecedented in recent history.
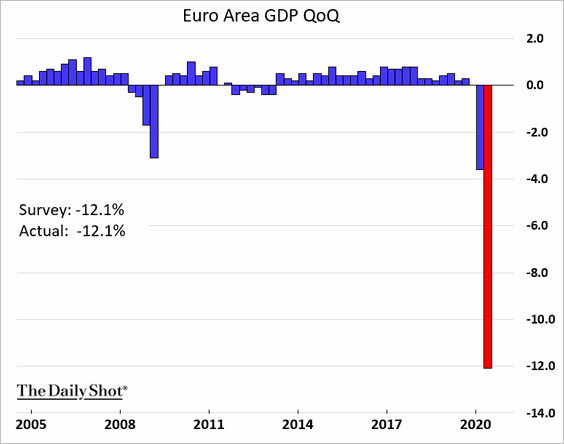
Pantheon Macroeconomics and other economists expect a much slower recovery than the ECB’s estimates.
 Source: Pantheon Macroeconomics
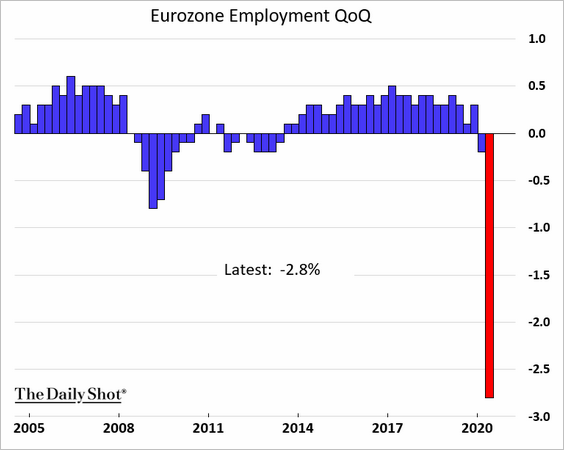
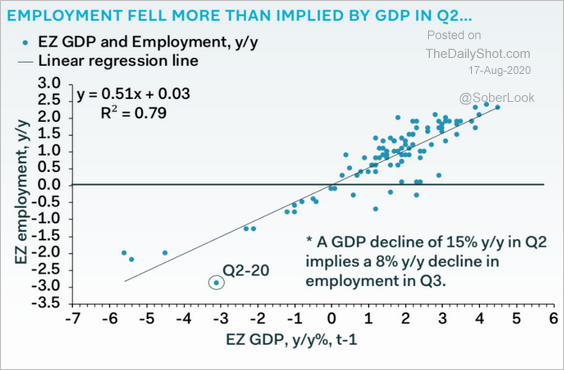
Employment contracted sharply last quarter, a larger decline than implied by the GDP (2nd chart).
 Source: Pantheon Macroeconomics
——————–
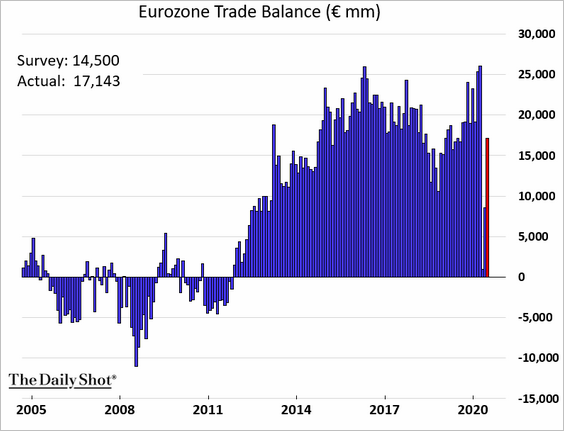
2. The euro-area trade surplus rose more than expected in June.
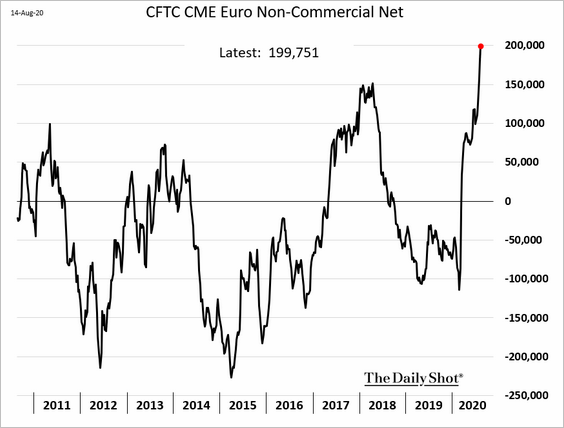
3. Speculative accounts continue to increase their bets on the euro, with the latest increase boosted by leveraged funds.
Asia – Pacific
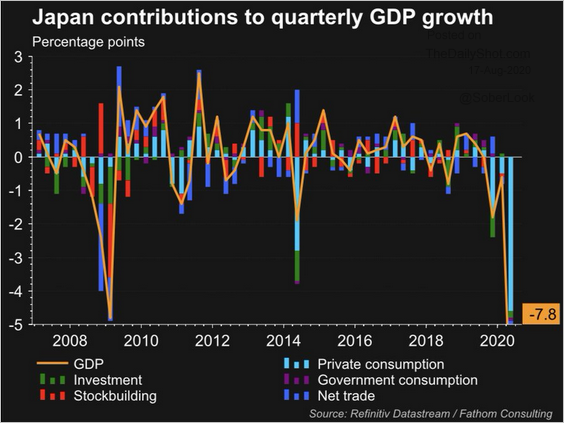
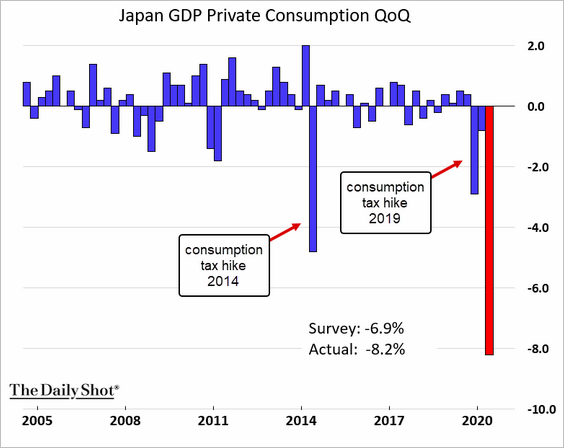
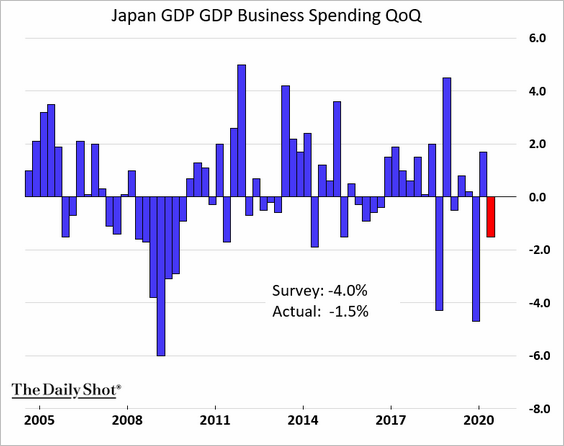
1. Japan’s GDP contracted sharply in Q2, driven by private consumption (three charts).
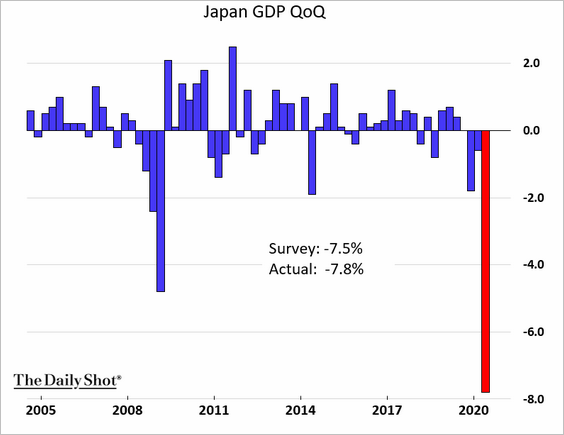
 Source: @jsblokland
But business spending was stronger than expected.
——————–
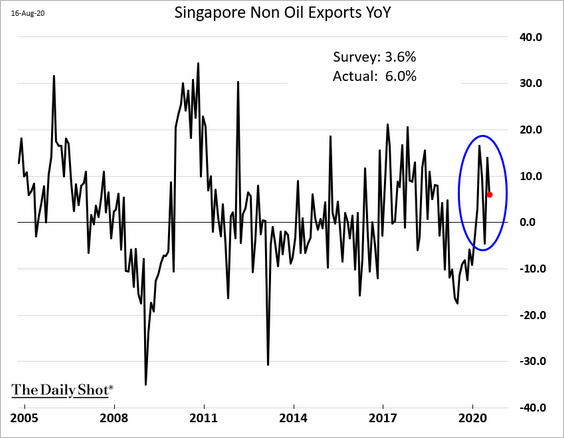
2. Singapore’s exports have been surprising to the upside.
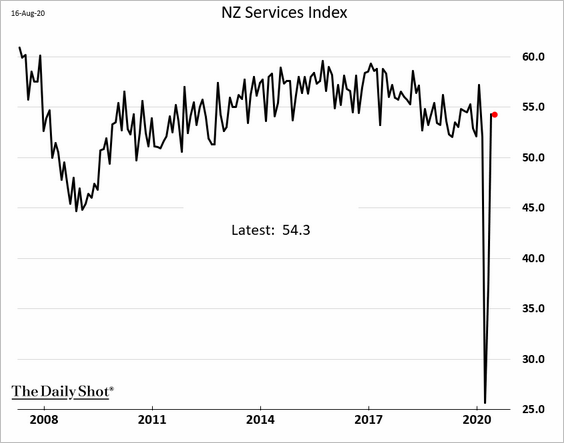
3. New Zealand’s service sector continues to expand.
China
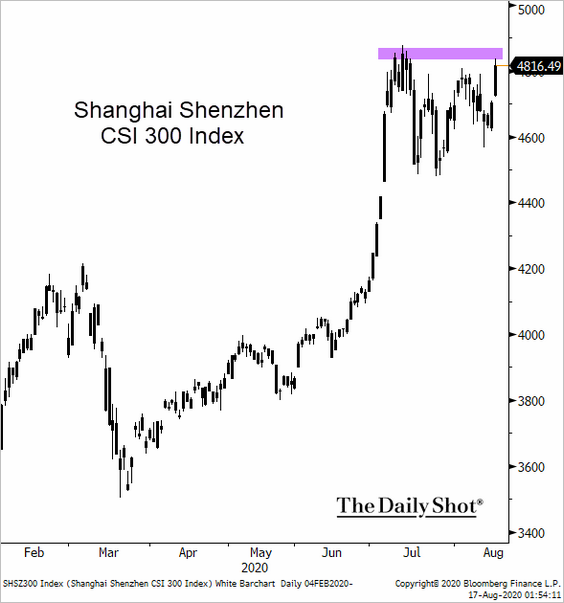
1. Let’s begin with the stock market.
• The market is testing resistance.
 Source: @TheTerminal
• Here are the one-year returns by sector:
 Source: S&P Global Market Intelligence
• Foreigners have increased their purchases of China’s stocks, preferring consumer and healthcare names.
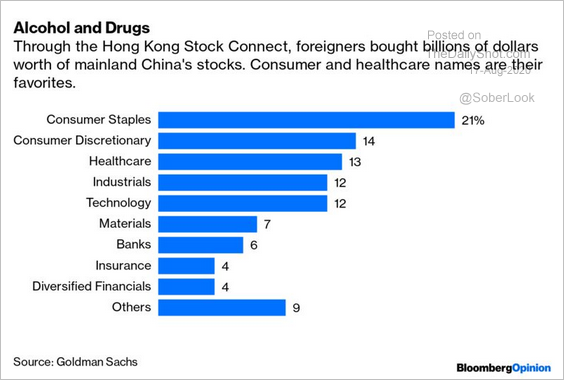 Source: @shuli_ren, @bopinion Read full article
——————–
2. Manufacturing is still the engine of growth.
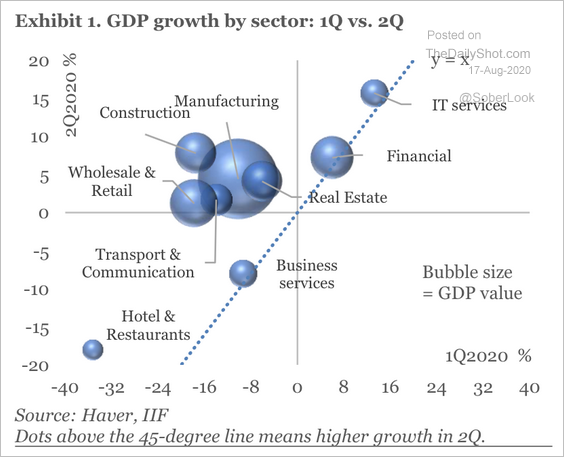 Source: IIF
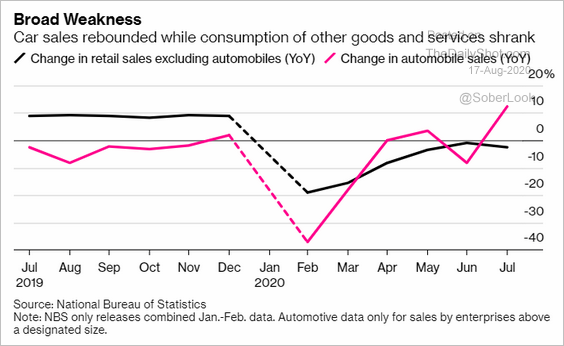
However, fixed asset investments in heavy industrial sectors such as autos and machinery remain weak. Overcapacity and deflationary pressures are weighing on profits in these industries, according to IIF.
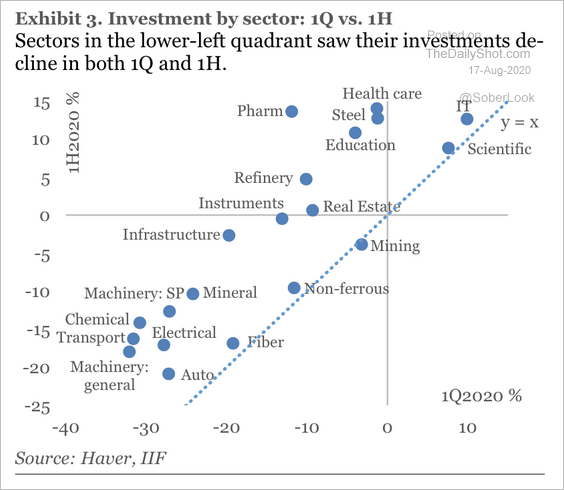 Source: IIF
The auto sector experienced the sharpest rebound in industrial value-add so far this year, …
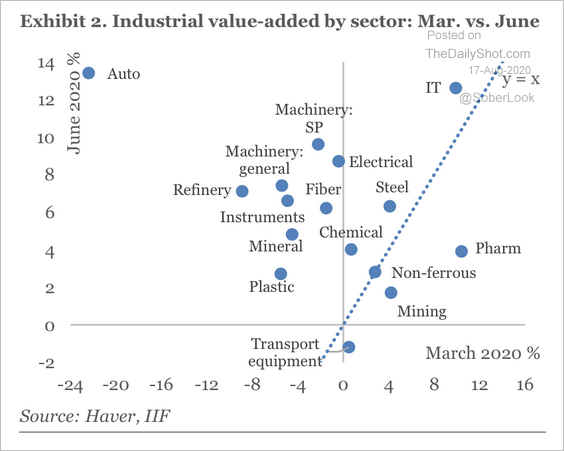 Source: IIF
… as consumer demand for cars strengthened.
 Source: @markets Read full article
——————–
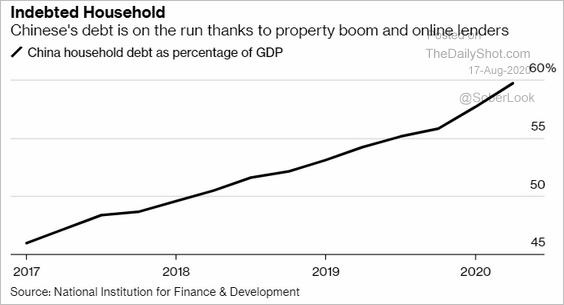
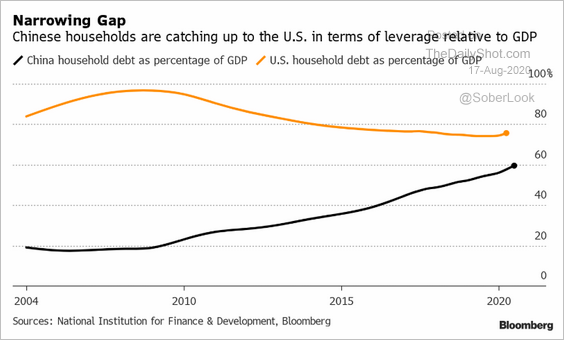
3. China’s household debt continues to climb.
 Source: @markets Read full article
 Source: Charlie Zhu
Emerging Markets
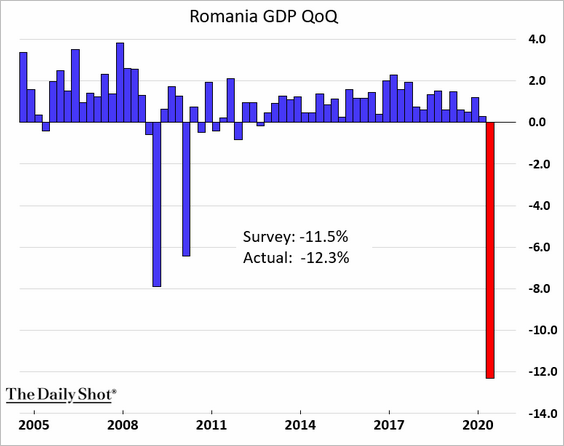
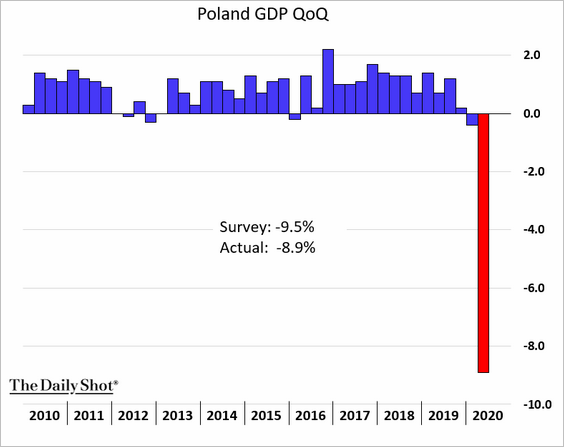
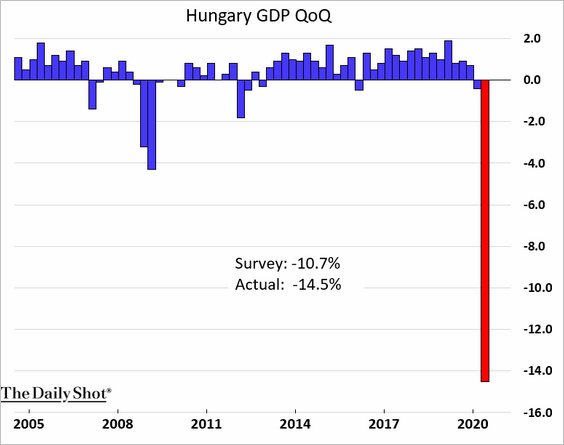
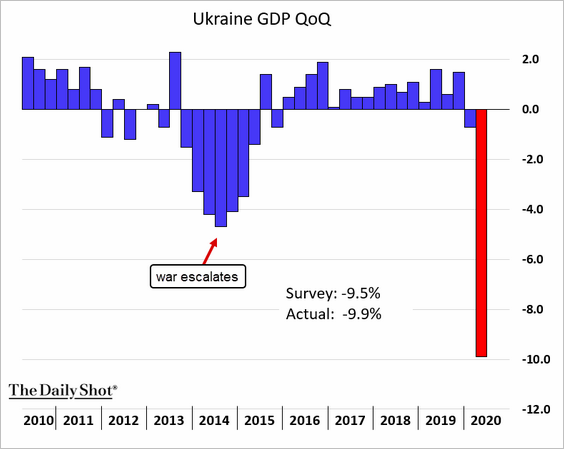
1. Central and Eastern European economies experienced extreme GDP contractions last quarter.
• Romania:
• Poland:
• Hungary:
• Ukraine:
——————–
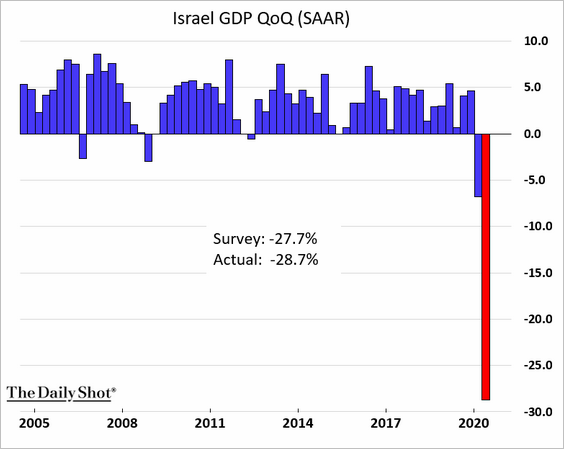
2. Israel’s GDP also tumbled in Q2.
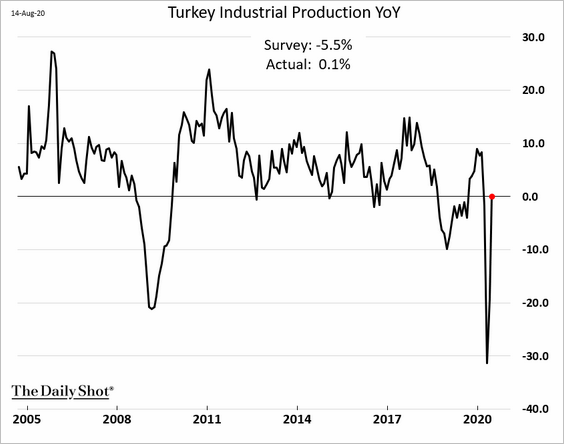
3. Next, we have some updates on Turkey.
• Industrial production (a positive surprise in June):
• Persistent portfolio outflows:
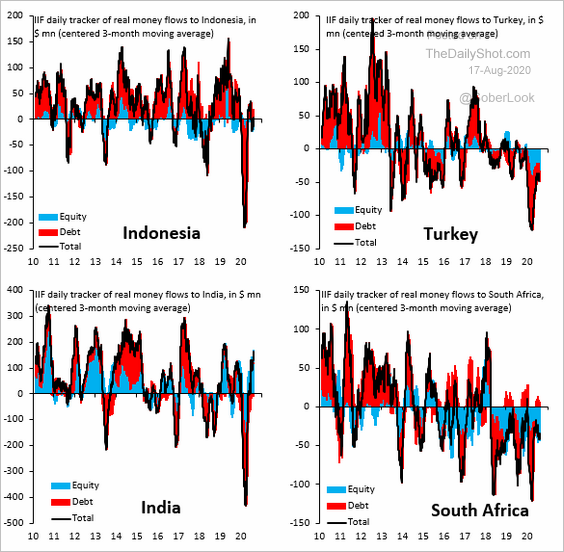 Source: @RobinBrooksIIF
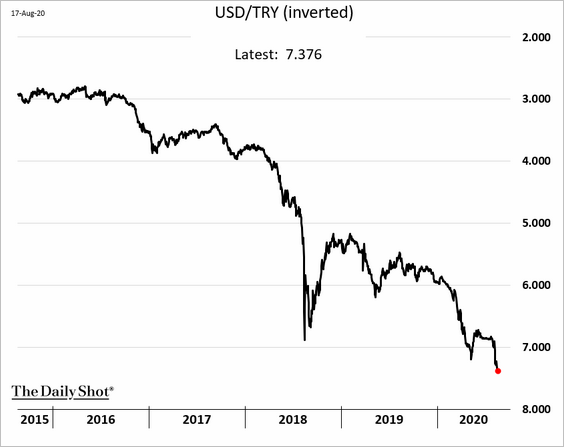
• The lira:
——————–
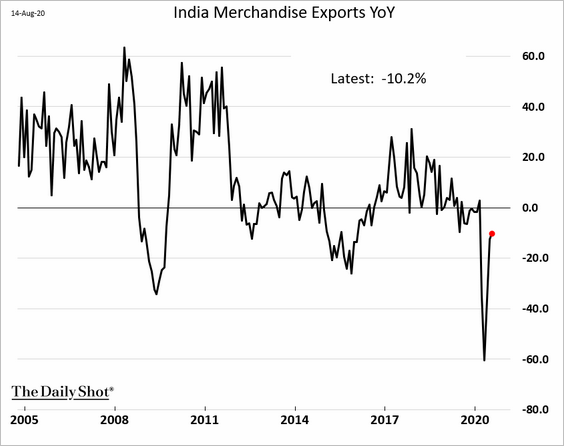
4. India’s exports are recovering:
5. Lebanon’s corruption stands out.
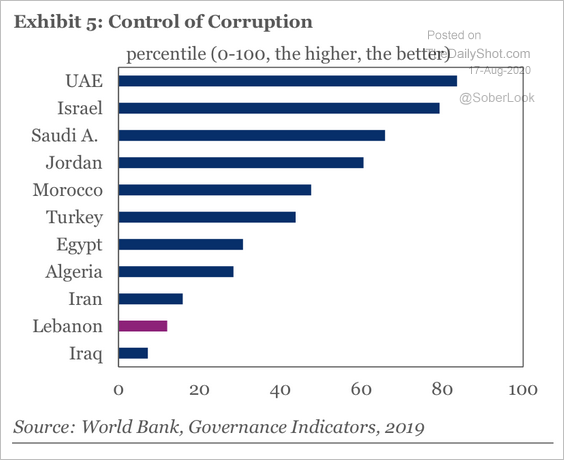 Source: IIF
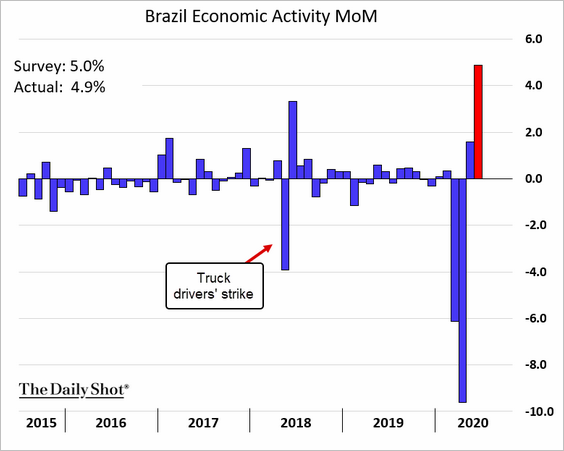
6. Brazil’s economic activity strengthened further in June.
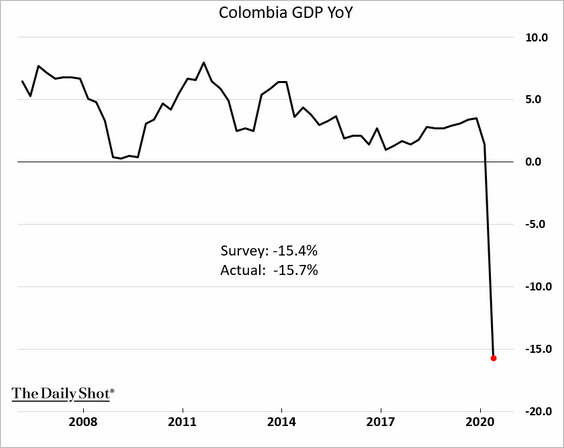
7. Colombia’s Q2 GDP contraction was unprecedented.
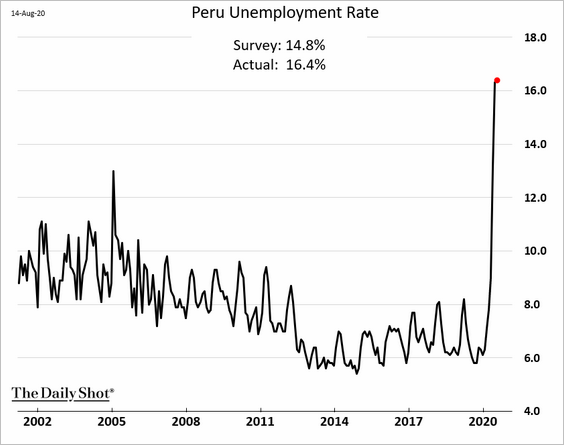
8. Here is Peru’s unemployment rate.
Cryptocurrency
1. This chart shows the total amount of Bitcoin tokenized on Ethereum.
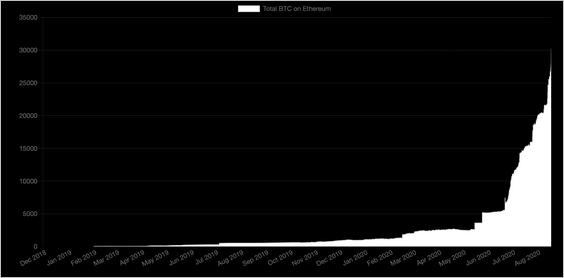 Source: @drakefjustin Read full article
2. Bitcoin is attempting to break its 2-year downtrend.
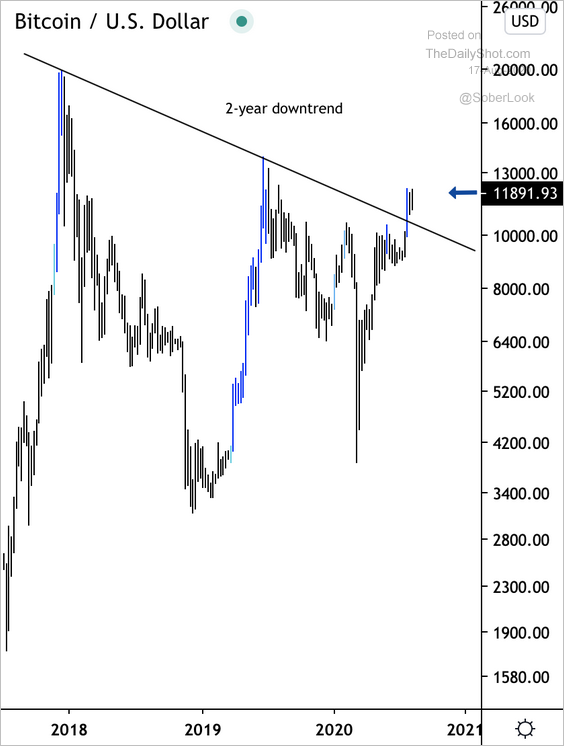 Source: @DantesOutlook
3. Ethereum has broken above its 2-year downtrend.
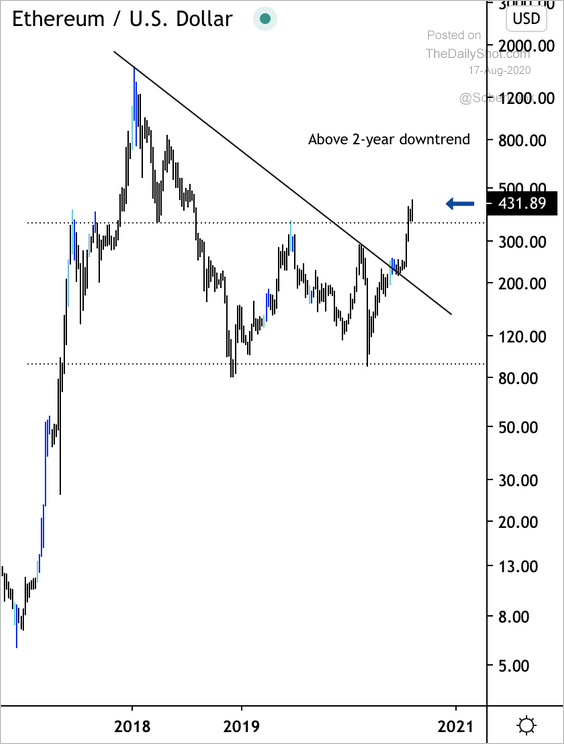 Source: @DantesOutlook
——————–
Commodities
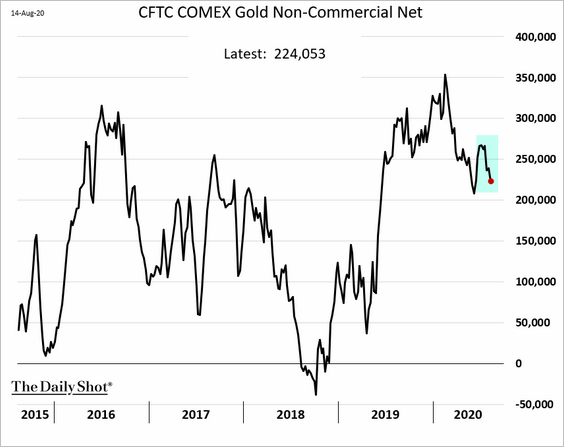
1. Speculative accounts cut back their bets on gold last week.
2. The correlation between gold and stocks remains elevated.
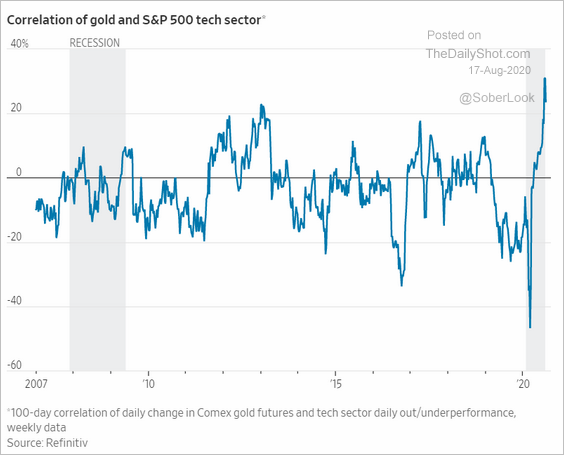 Source: @WSJ Read full article
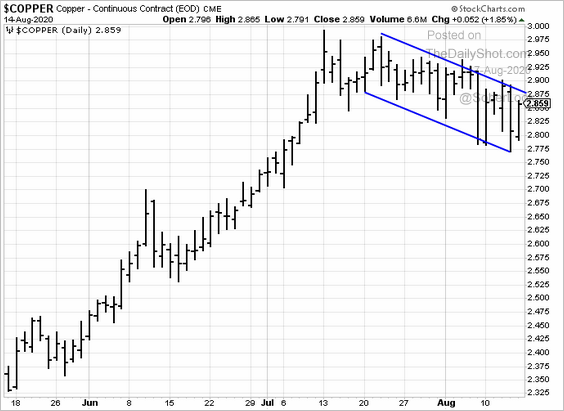
3. Copper has been trending lower in recent weeks.
Energy
1. Crude oil demand recovery is expected to be slow.
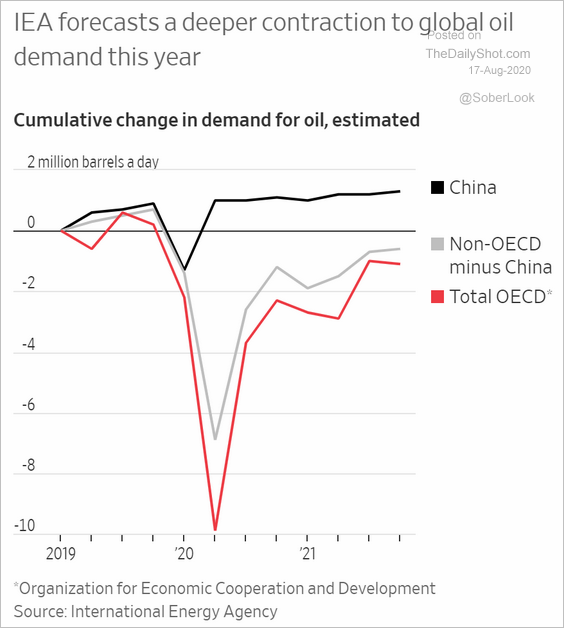 Source: @WSJ Read full article
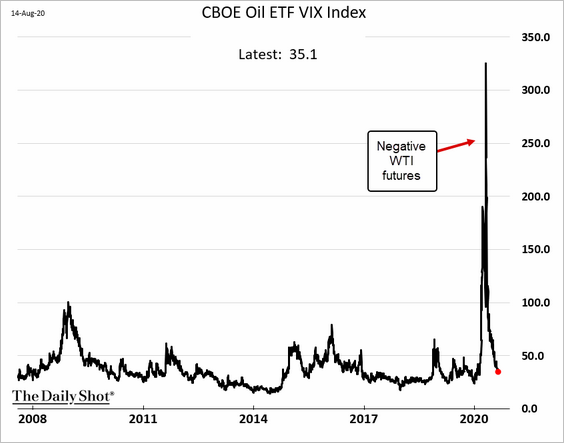
2. Here is the VIX-equivalent for oil ETFs.
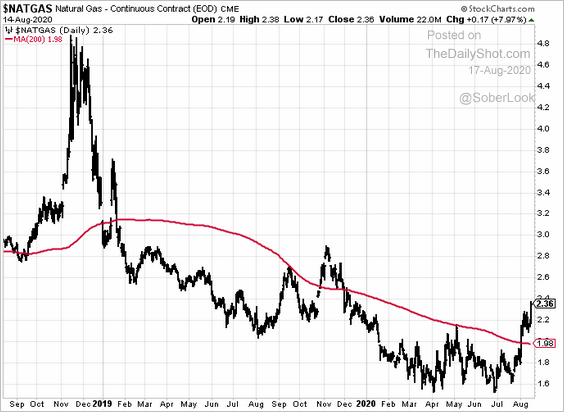
3. Next, we have some updates on natural gas.
• Natural gas futures have broken above the 200d ma resistance.
• Elevated natural gas stocks could derail the bullish short-term narrative, according to Fitch.
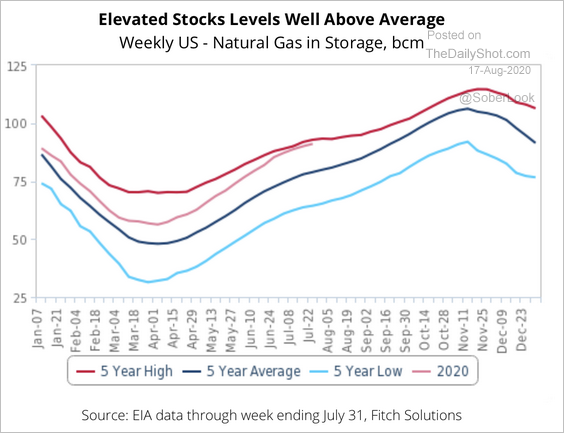 Source: Fitch Solutions Macro Research
• But the supply-demand balance is expected to tighten further.
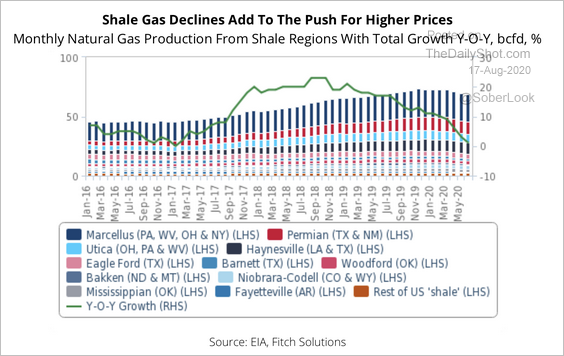 Source: Fitch Solutions Macro Research
Equities
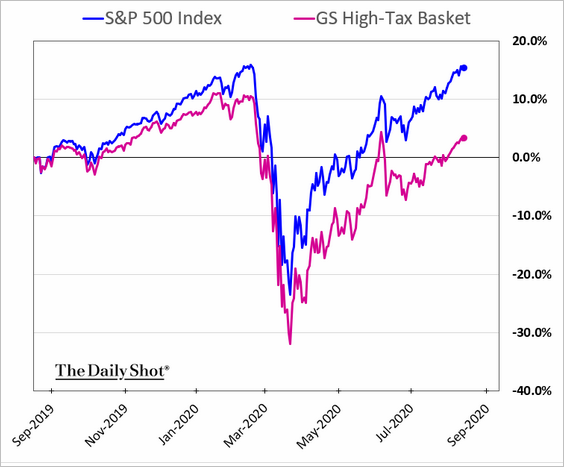
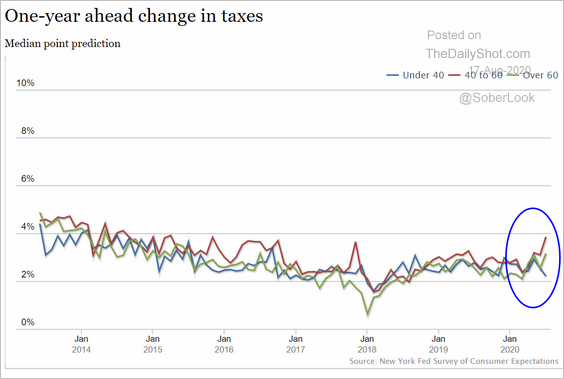
1. The market is pricing in higher corporate taxes ahead, with high-effective-tax companies underperforming.
By the way, Americans over 40 (who tend to own more stocks) expect taxes to rise.
 Source: New York Fed
——————–
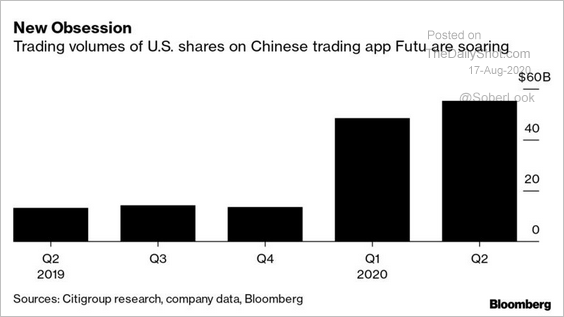
2. Young Chinese investors jumped into US stocks this year.
 Source: @business Read full article
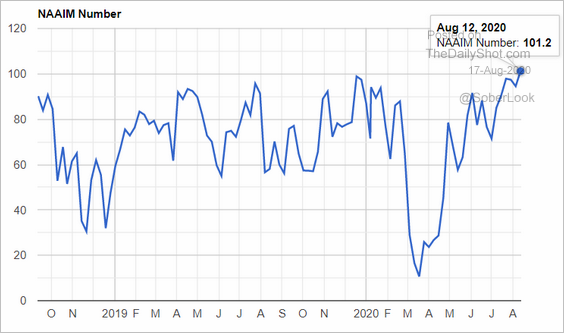
3. Investment managers are extremely bullish.
 Source: NAAIM, @ISABELNET_SA
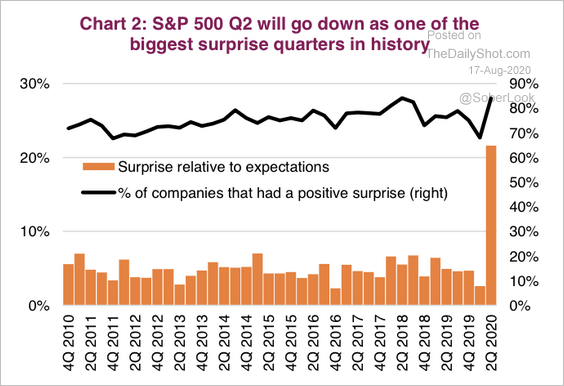
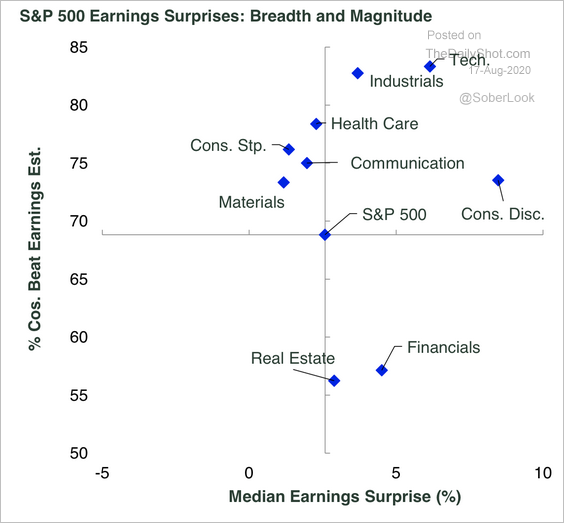
4. Q2 was one of the biggest earnings surprise quarters in history.
 Source: Market Ethos, Richardson GMP
5. Growth stocks extended their decade-long lead over value this year.
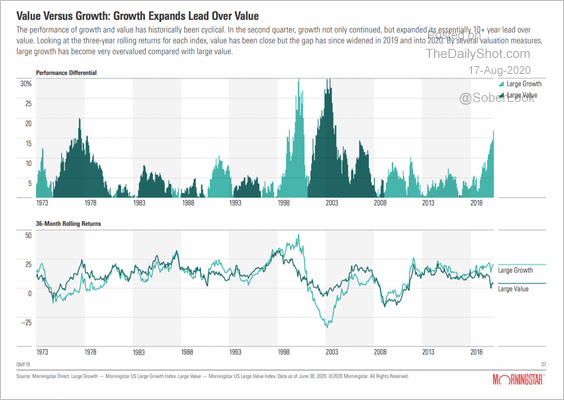 Source: Morningstar
6. Microcaps had a good month.
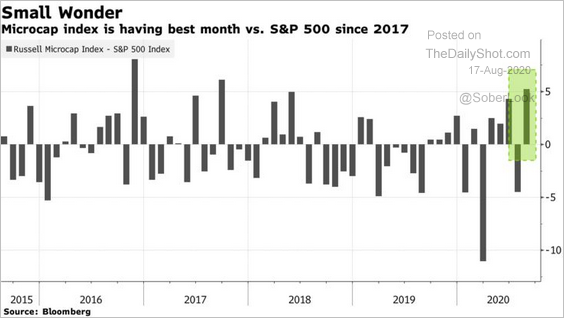 Source: @markets Read full article
7. Next, we have some sector updates.
• More upside for industrials?
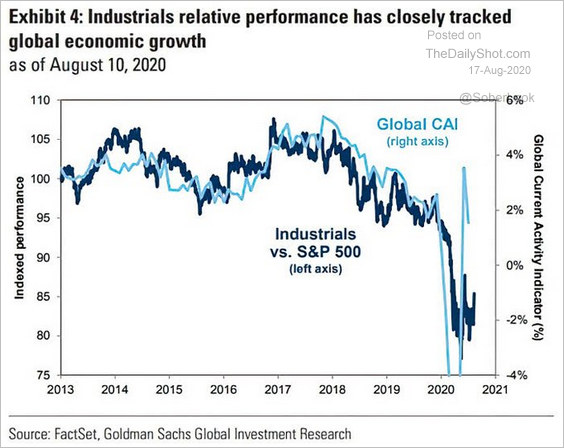 Source: @ISABELNET_SA, @GoldmanSachs
• Consumer discretionary stocks exceeded earnings expectations by a large margin, driving upside revisions in the sector, according to State Street.
 Source: SPDR Americas Research, @mattbartolini
• Utilities’ dividend yield vs. Treasuries is near a 25-year high.
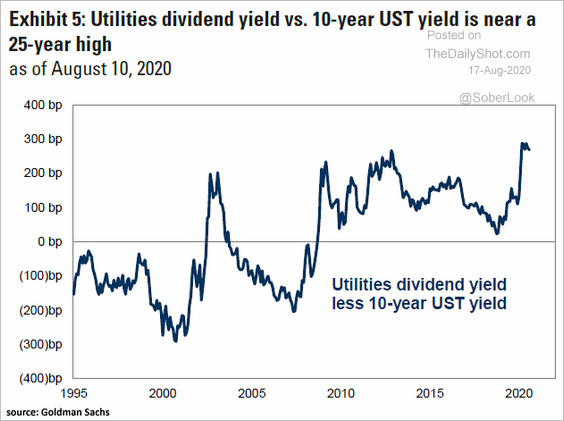 Source: @ISABELNET_SA, @GoldmanSachs
Utilities’ valuations are lagging the S&P 500.
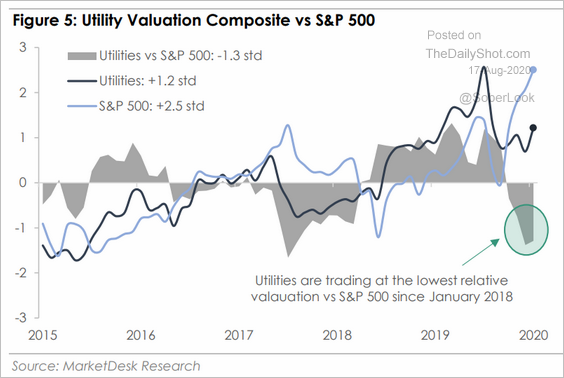 Source: MarketDesk Research
——————–
8. Finally, here are flows into ESG equity funds.
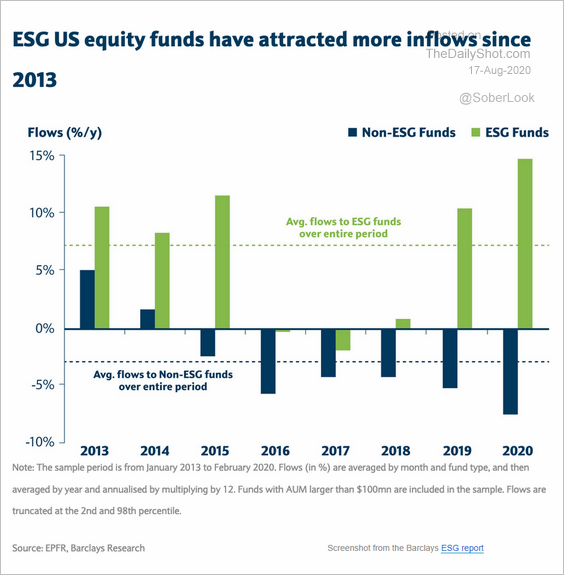 Source: Barclays Research, @axios Read full article
Rates
1. Below is the attribution of the latest jump in Treasury yields.
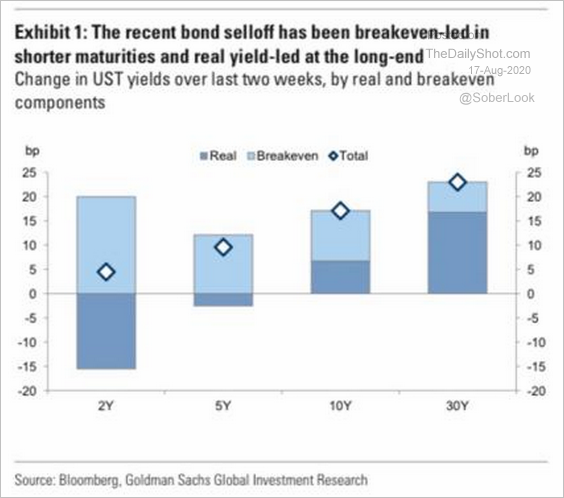 Source: Goldman Sachs
2. The Aussie dollar, a proxy for global economic activity, has sharply diverged from Treasury yields.
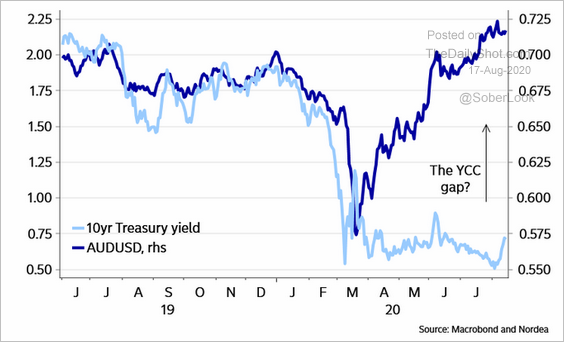 Source: @AndreasSteno Read full article
——————–
Food for Thought
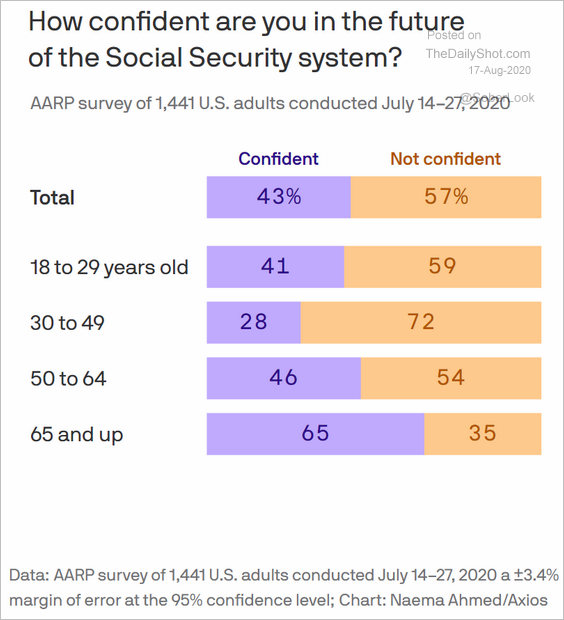
1. Concerns about the Social Security system:
 Source: @axios Read full article
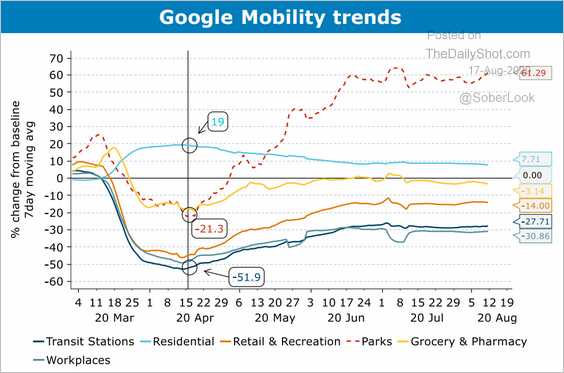
2. The “new normal” in mobility trends:
 Source: ANZ Research
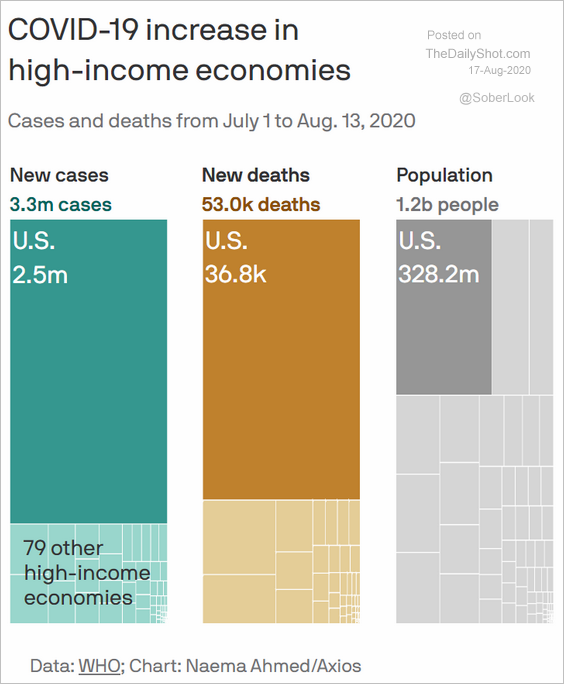
3. COVID-19 cases and deaths in the US vs. other advanced economies:
 Source: @axios Read full article
4. Missed mortgage and rent payments:
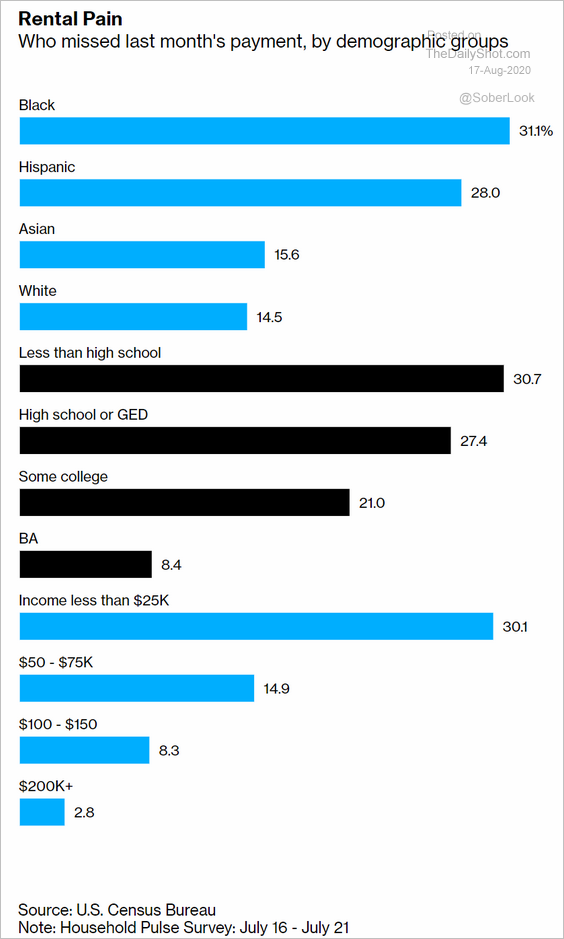 Source: @business Read full article
5. USPS reductions in sorting capacity:
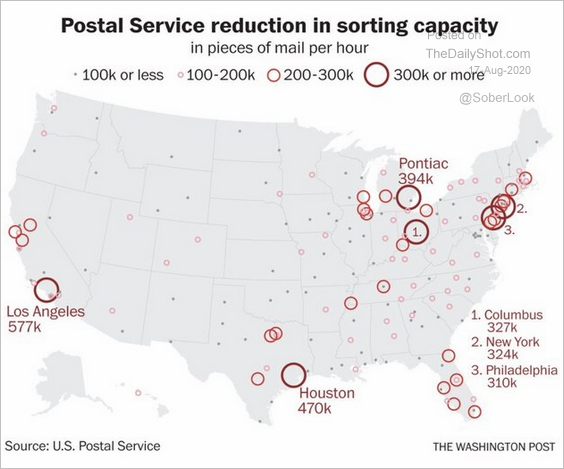 Source: @_cingraham, @jacobbogage Read full article
6. COVID-19 outlook:
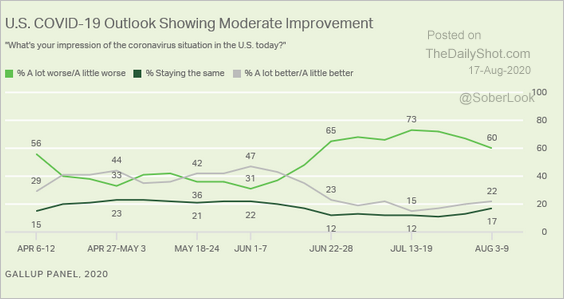 Source: Gallup Read full article
7. Amazon’s cloud business:
 Source: @adam_tooze
8. Global app spending:
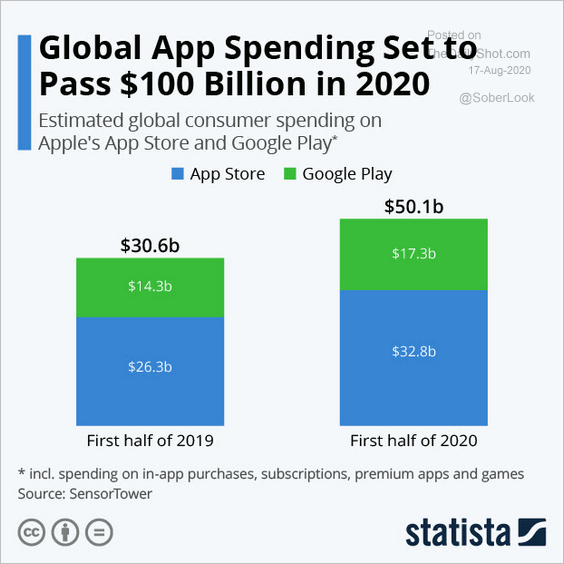 Source: Statista
9. Skyscraper construction:
 Source: Statista
——————–