The Daily Shot: 24-Aug-20
• Equities
• Credit
• Commodities
• Energy
• Emerging Markets
• China
• Asia – Pacific
• The Eurozone
• The United Kingdom
• The United States
• Food for Thought
Equities
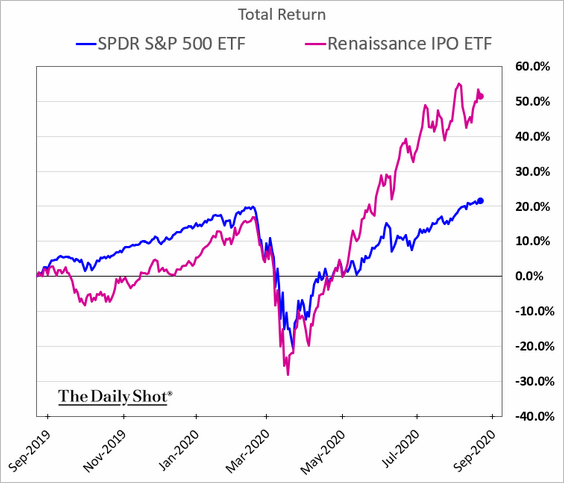
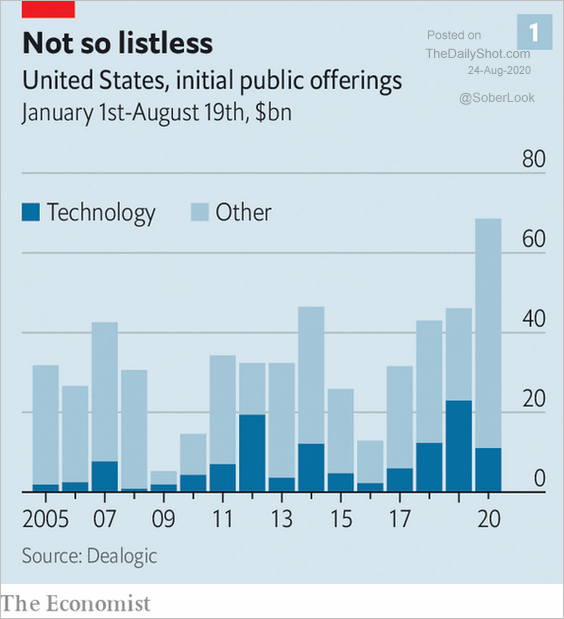
1. Post-IPO shares have outperformed sharply since the start of the crisis (chart below). Favorable market conditions have been supporting IPO activity in the US this year (second chart).
 Source: The Economist Read full article
——————–
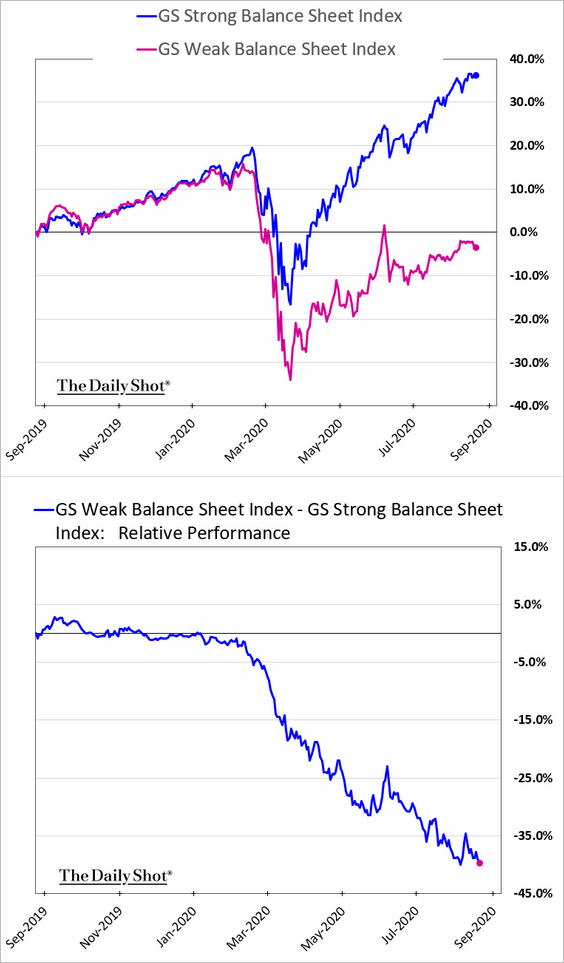
2. Investors continue to favor companies with strong balance sheets.
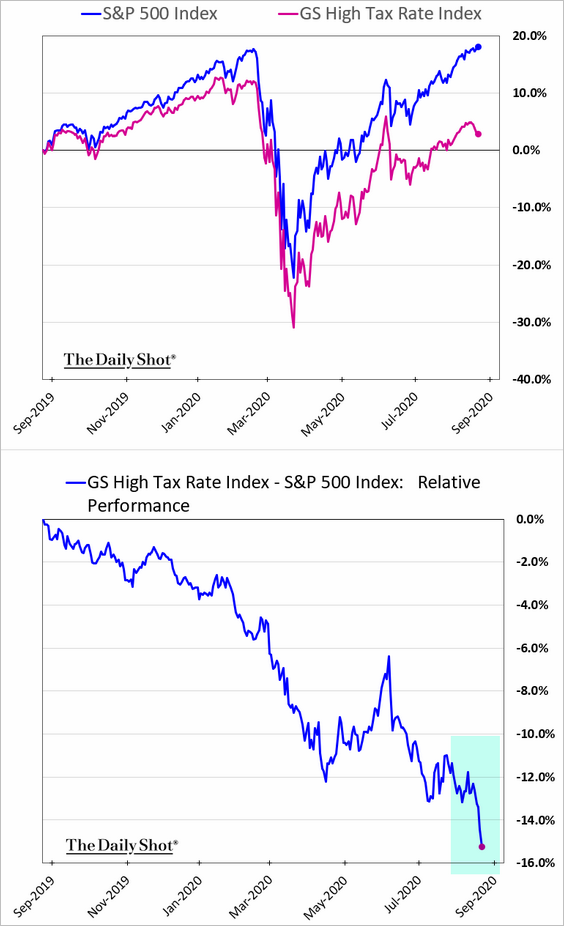
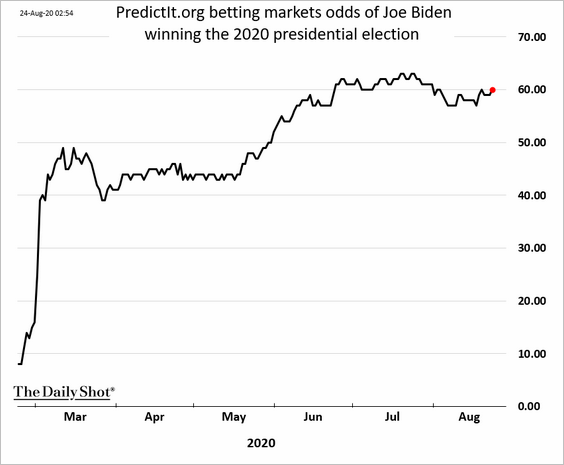
3. The stock market is increasingly pricing in higher corporate taxes as the US elections approach. The underperformance of companies with the highest median tax rates has accelerated.
——————–
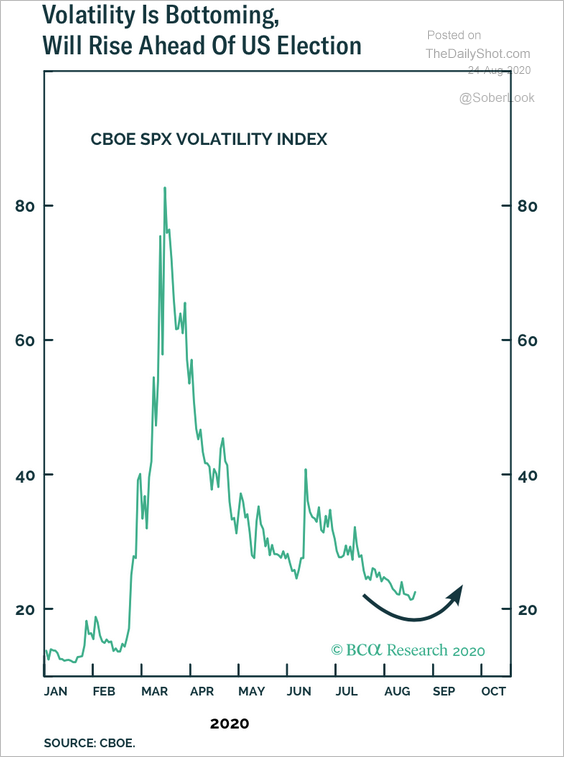
4. Will volatility start to rise ahead of the US elections?
 Source: BCA Research
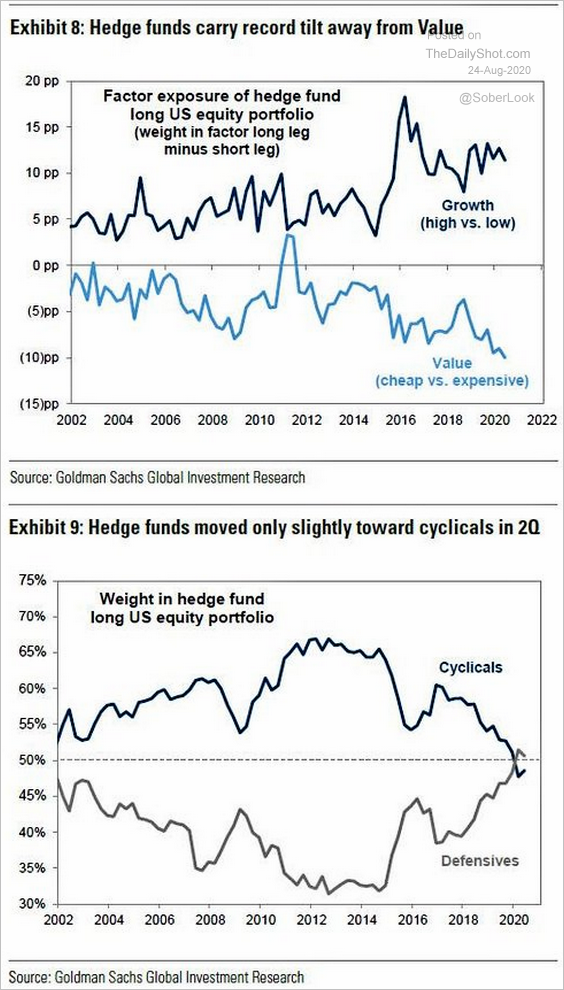
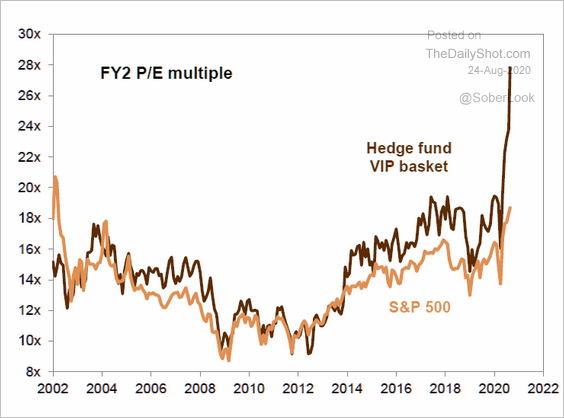
5. Next, we have some updates on hedge funds’ equity holdings.
• Exposure to growth vs. value and cyclicals vs. defensives:
 Source: Goldman Sachs, @WallStJesus
• Equity holdings forward (FY2) P/E ratio:
 Source: Goldman Sachs, @themarketear
——————–
6. Short sellers have capitulated.
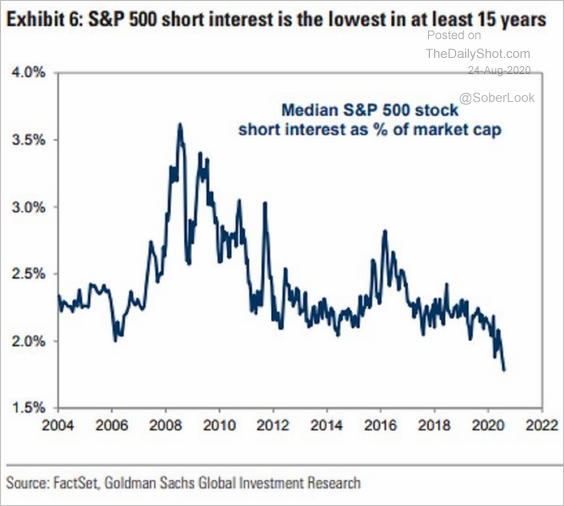 Source: Goldman Sachs
7. Almost half of US small-cap companies have lost money over the past 12 months.
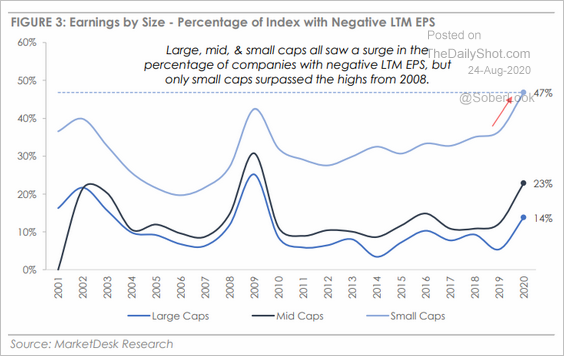 Source: MarketDesk Research
8. Small and mid-cap stocks haven’t participated in the S&P 500’s run to new highs.
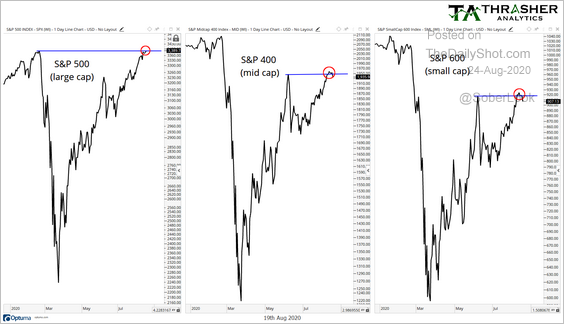 Source: Andrew Thrasher Read full article
Credit
1. Let’s start with some data on bankruptcies/defaults.
• Lare-company filings vs. high-yield spread:
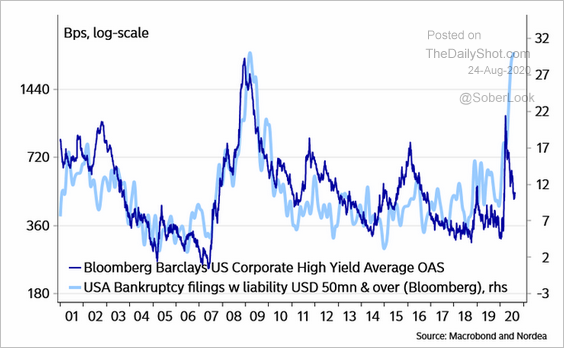 Source: @AndreasSteno Read full article
• Breakdown by sector vs. 2002 and 2009:
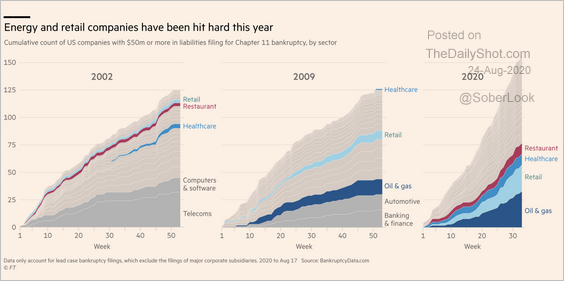 Source: @financialtimes Read full article
• The speed of bankruptcies:
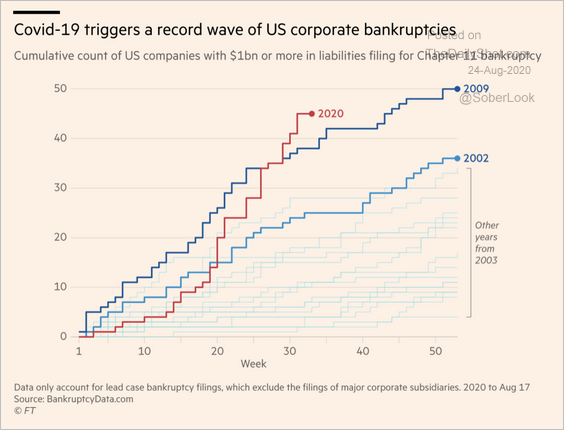 Source: @financialtimes Read full article
• High-yield debt default rates (US v. Euro and US by rating):
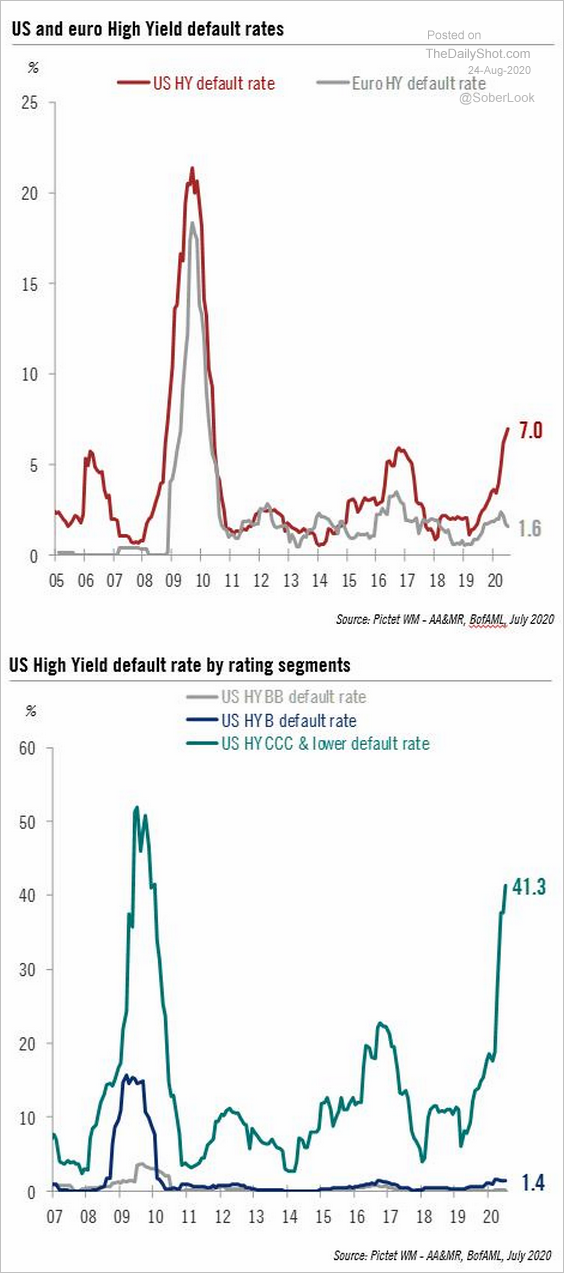 Source: Pictet Wealth Management
• For now, bankruptcies among small companies remain low (right panel).
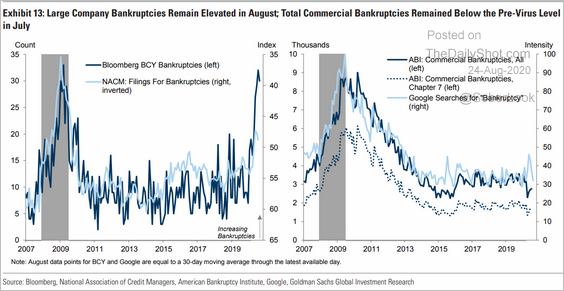 Source: Goldman Sachs
——————–
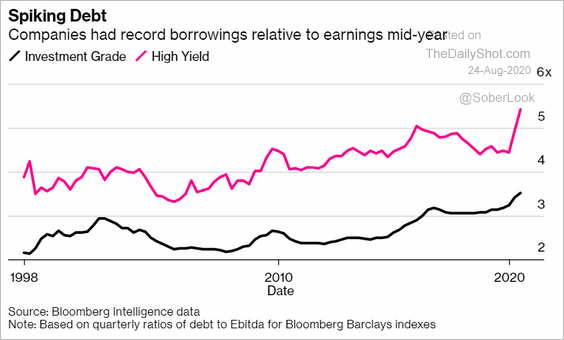
2. Leverage (debt-to-EBITDA) has risen sharply this year.
 Source: @markets Read full article
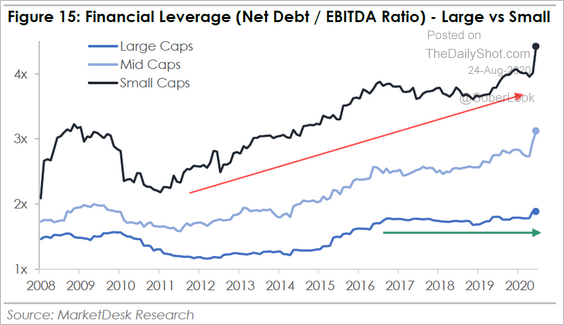
Here is leverage by company size.
 Source: MarketDesk Research
Commodities
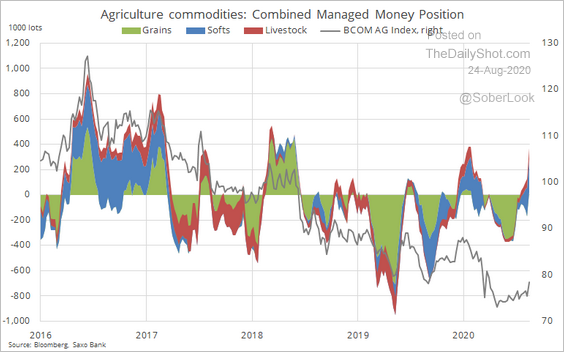
1. Funds have shifted from being net short agricultural commodities in June to now net long.
 Source: @Ole_S_Hansen
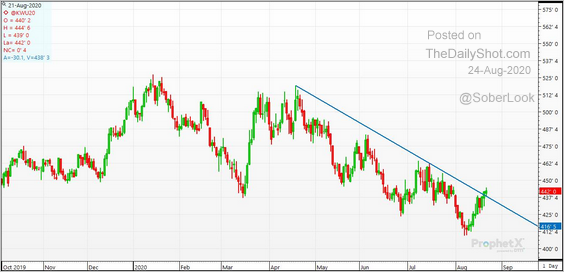
2. US hard red winter wheat futures are breaking above their 4-month downtrend.
 Source: @cer_hedge Read full article
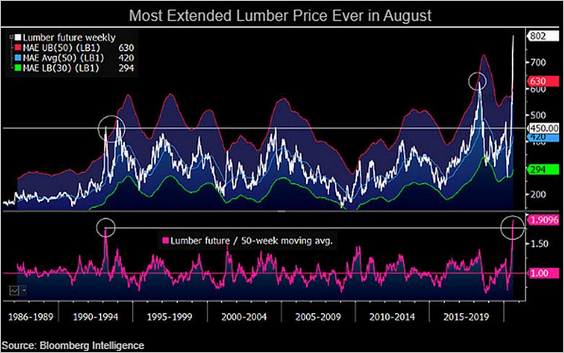
3. Lumber prices are the most extended in history.
 Source: @mikemcglone11
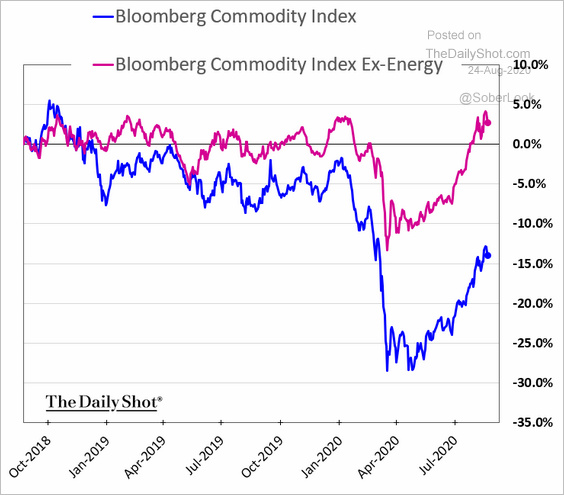
4. Outside of energy, commodities have recovered this year’s losses.
 Source: Bloomberg Finance L.P.
Energy
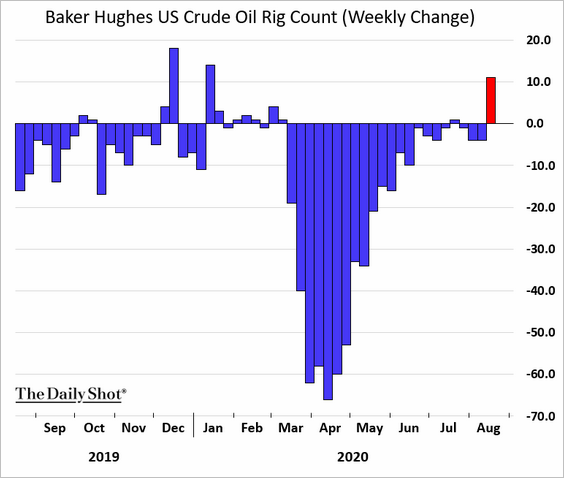
1. The US rig count rose last week.
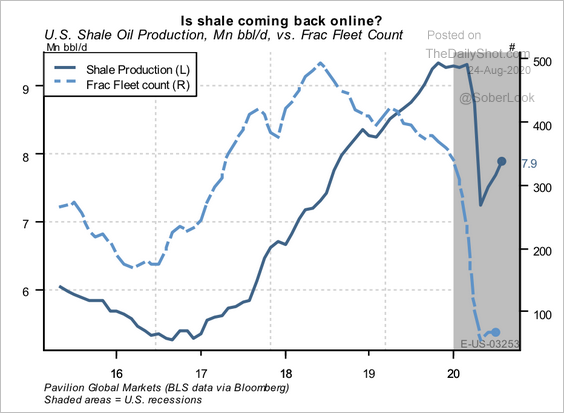
2. Shale production has been slow to come back online.
 Source: Pavilion Global Markets
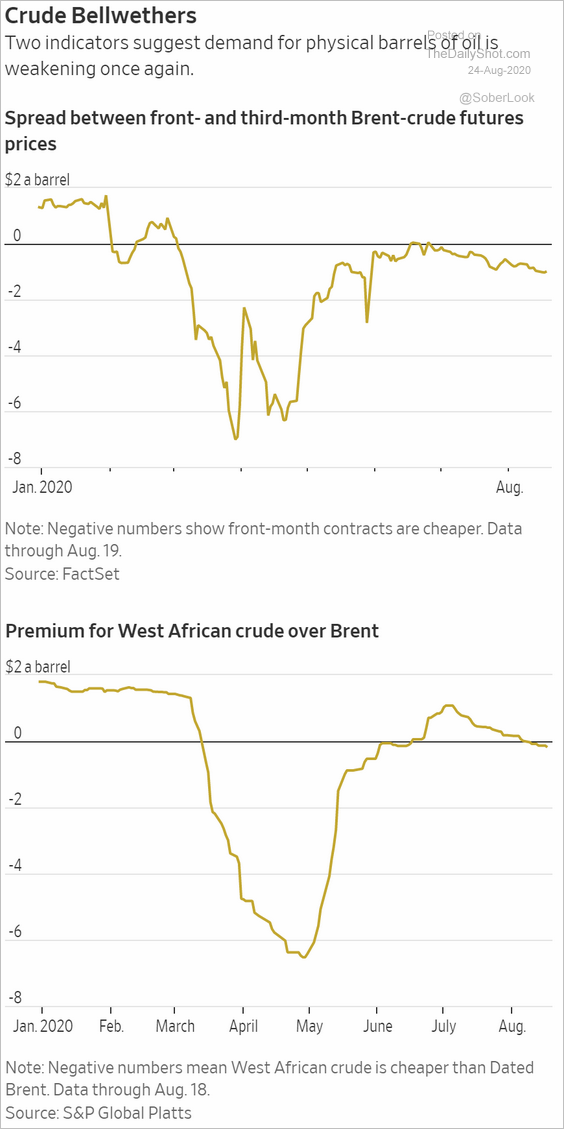
3. Brent contango (1st chart) and West African crude premium (2nd chart) point to softening oil demand.
 Source: @WSJ Read full article
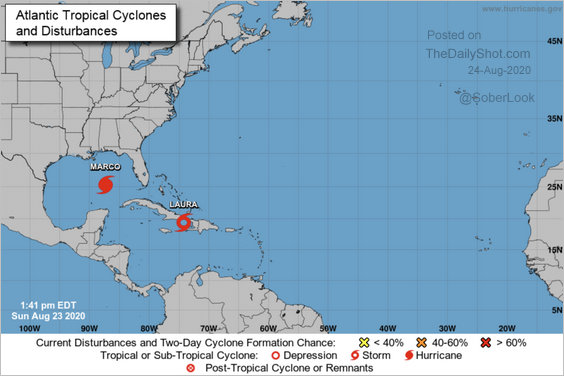
4. Tropical storms Marco and Laura are heading toward the Gulf of Mexico, and will likely become hurricanes before making landfall. This could threaten output in the region, impact refinery runs, and slowing imports/exports.
 Source: @JavierBlas Further reading
Emerging Markets
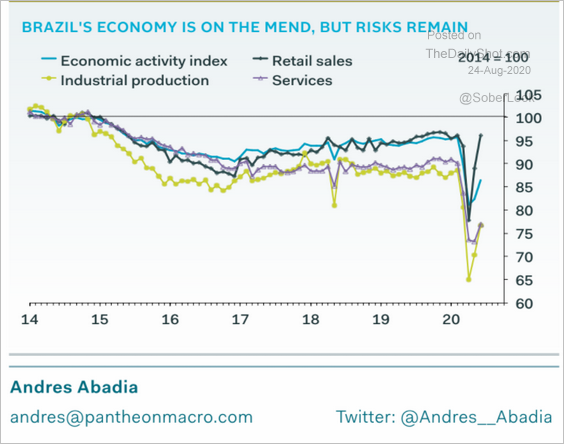
1. Brazil’s economic indicators show ongoing recovery.
 Source: Pantheon Macroeconomics
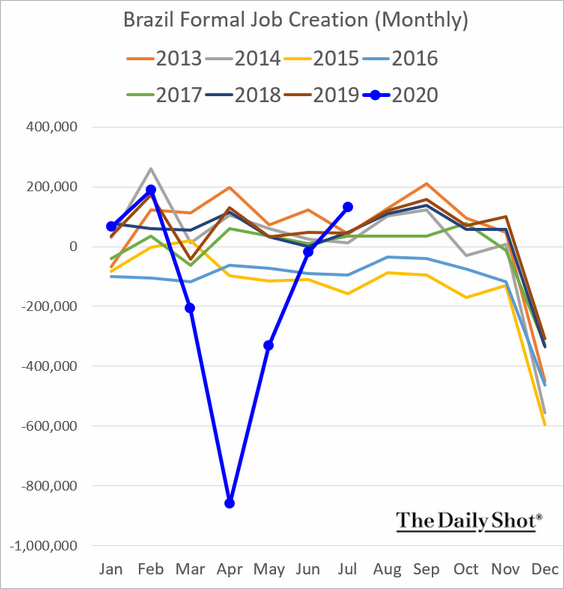
Reported job creation has rebounded.
——————–
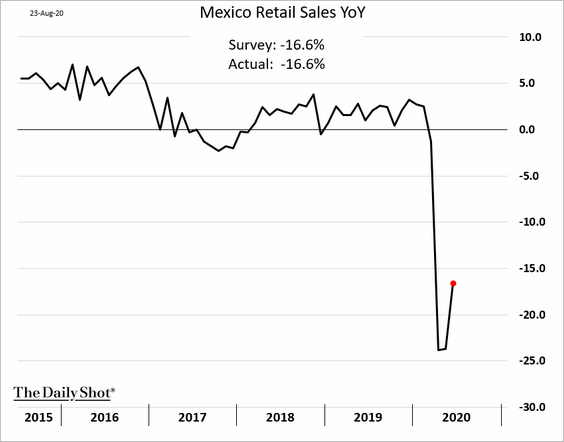
2. Mexico’s retail sales remained weak in June.
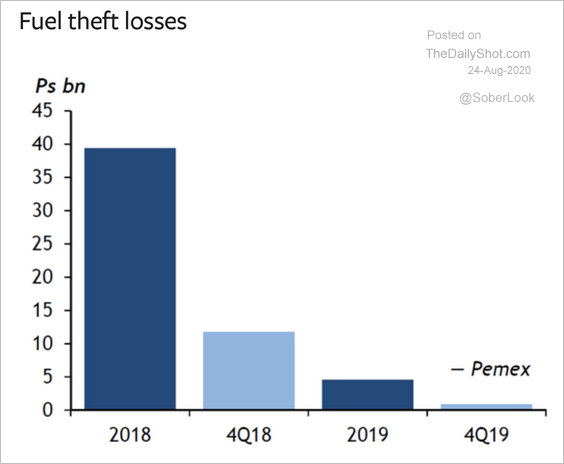
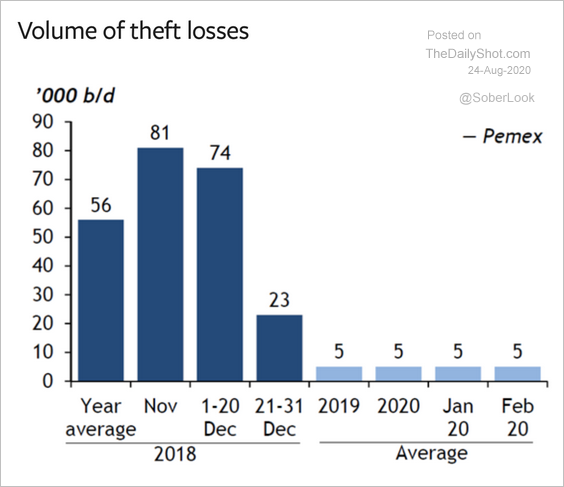
Mexico’s fuel theft losses have declined since 2018. (2 charts)
 Source: Argus Read full article
 Source: Argus Read full article
——————–
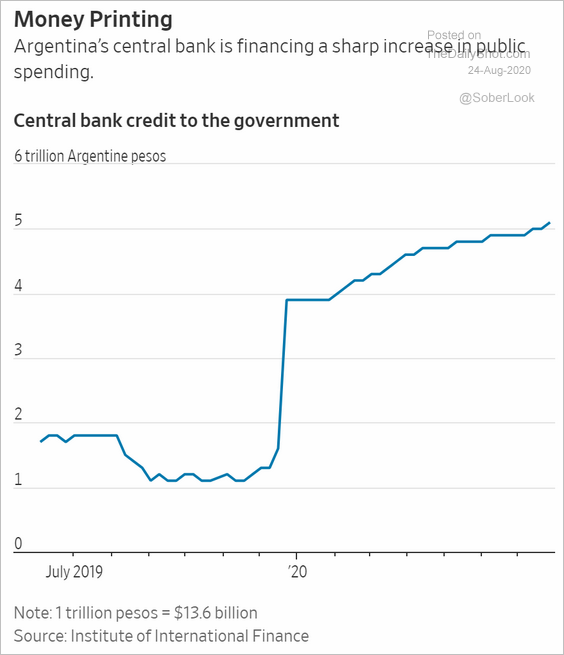
3. Argentina’s central bank has been funding the government (some would say this is not too different from the US).
 Source: @WSJ Read full article
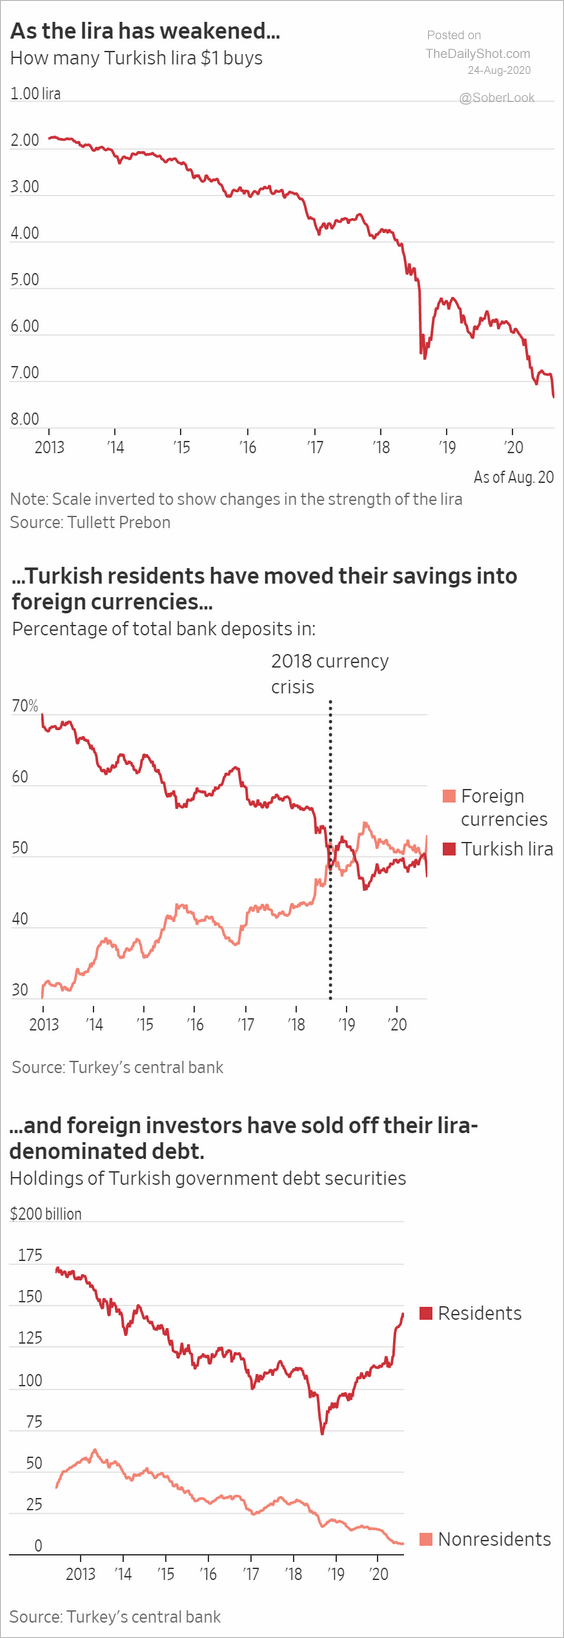
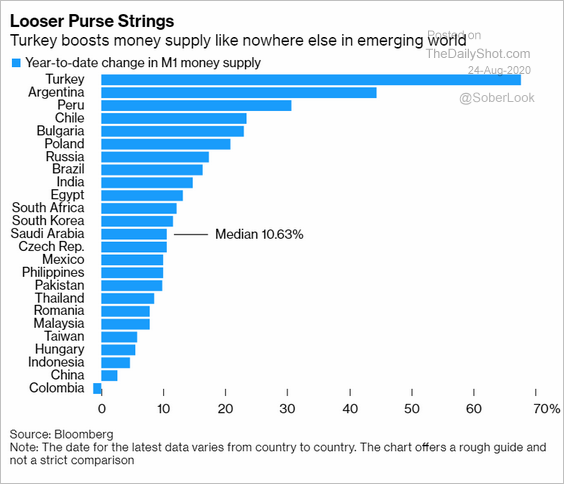
4. Next, we have some updates on Turkey.
• The lira and the capital flight:
 Source: @WSJ Read full article
• Growth in money supply vs. other EM economies:
 Source: @markets Read full article
——————–
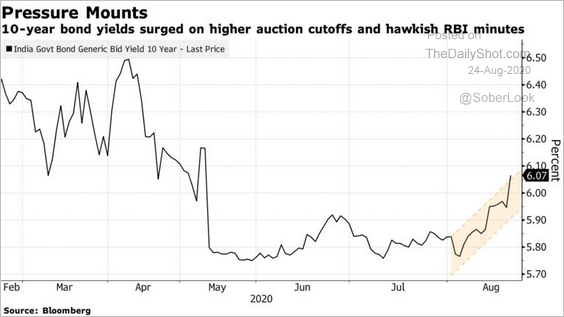
5. Indian bond yields have been climbing.
 Source: @markets Read full article
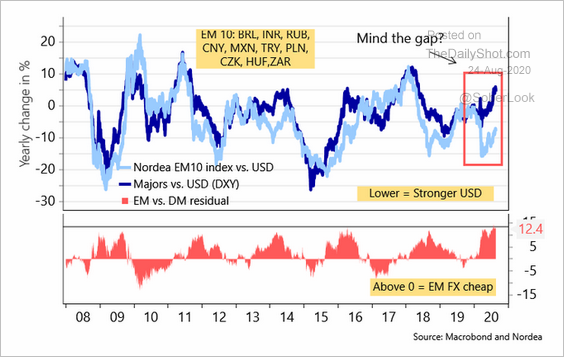
6. Here is the dollar’s performance vs. EM and DM currencies.
 Source: @AndreasSteno Read full article
China
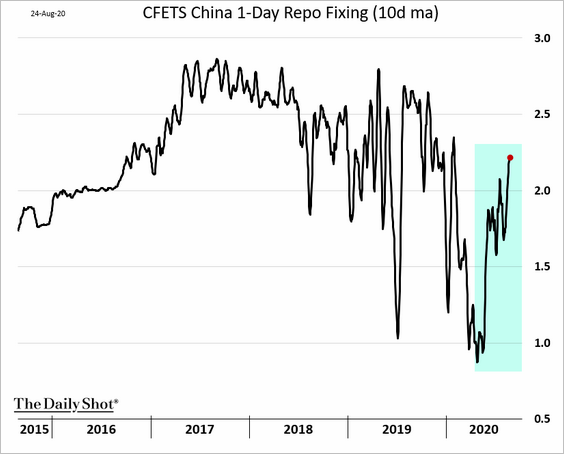
1. The overnight rate has been rising as the PBoC holds back on liquidity injections.
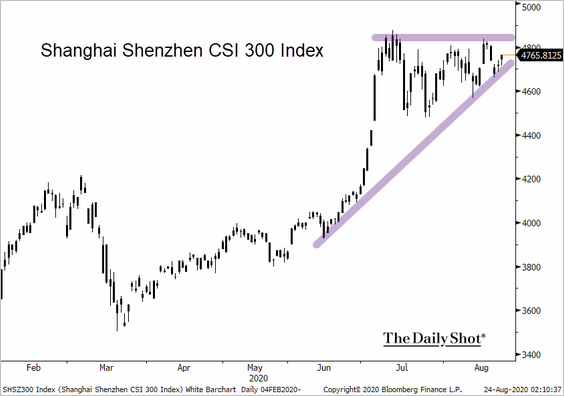
2. The stock market is consolidating.
 Source: @TheTerminal, Bloomberg Finance L.P.
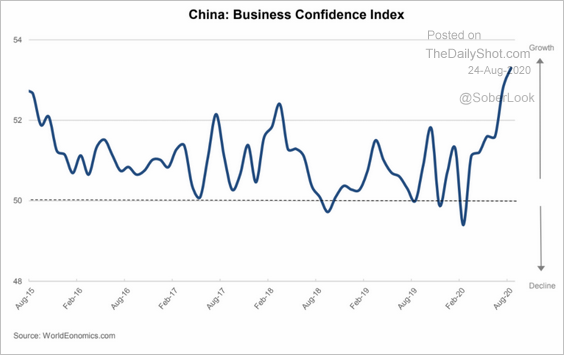
3. The World Economics SMI report shows that China’s business confidence is improving at the fastest pace in years.
 Source: World Economics
4. This chart shows the recent trends in retail sales.
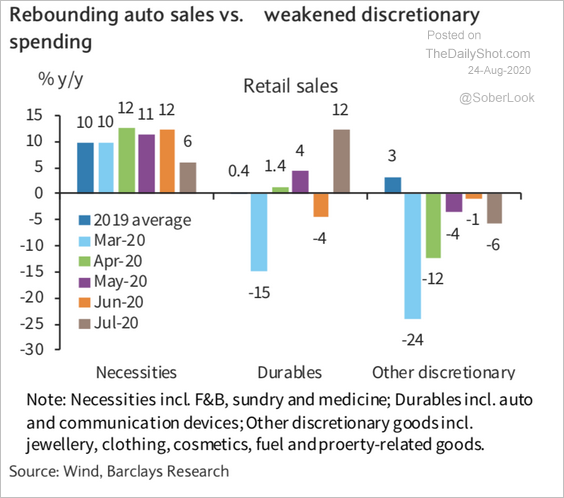 Source: Barclays Research
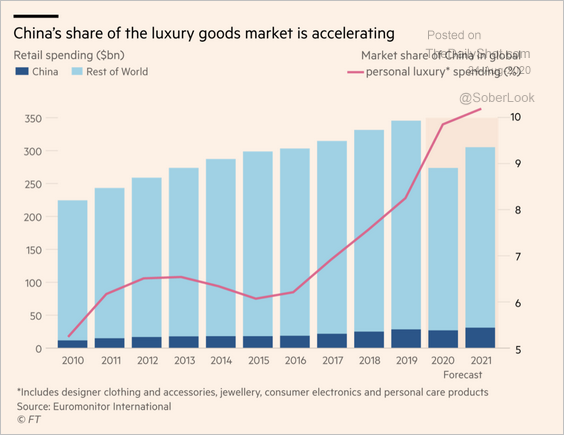
5. The share of the luxury goods market is accelerating.
 Source: @financialtimes Read full article
Asia – Pacific
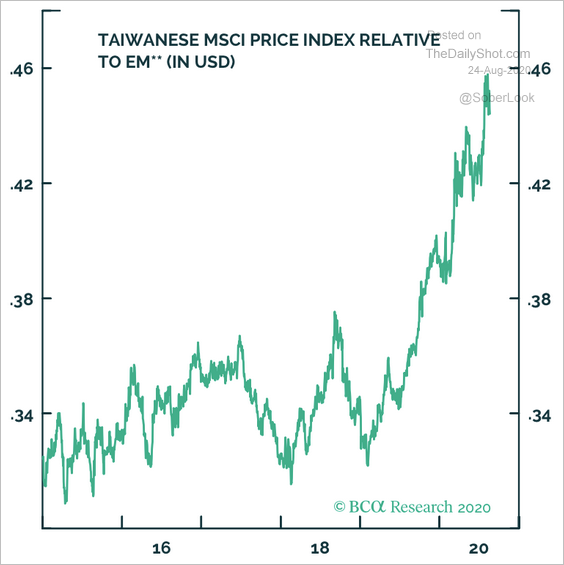
1. Taiwanese stocks have been on a tear relative to the broader EM market.
 Source: BCA Research
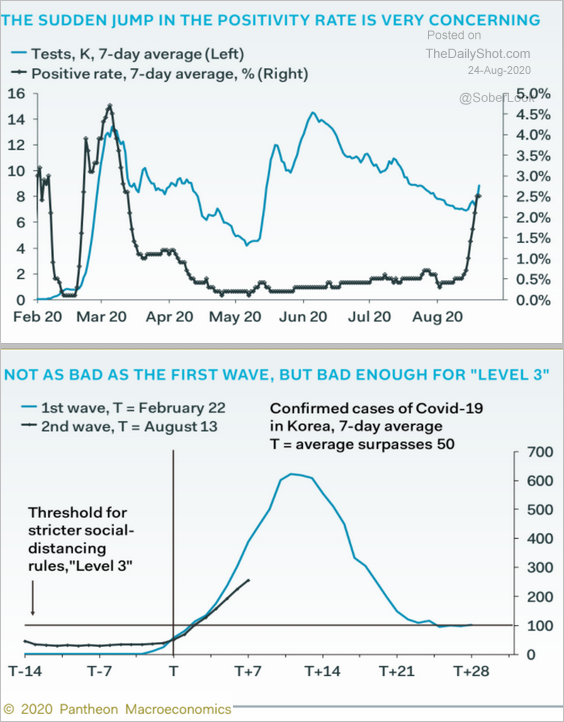
2. South Korea’s “second wave” is a concern.
 Source: Pantheon Macroeconomics
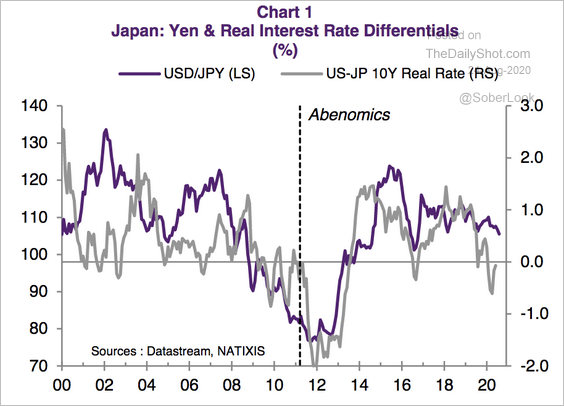
3. This chart shows dollar-yen vs. the US-Japan real rate differential.
 Source: Natixis
The Eurozone
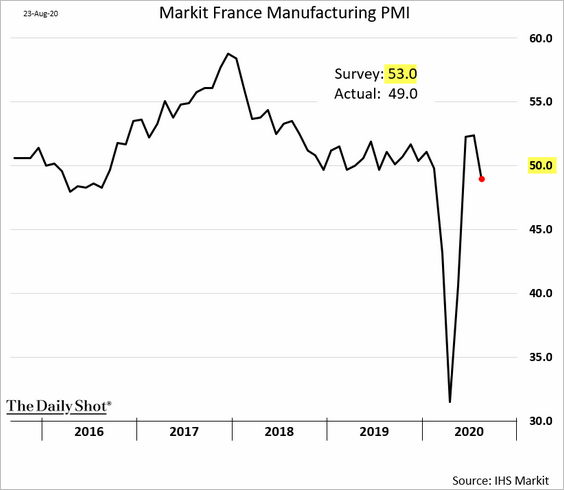
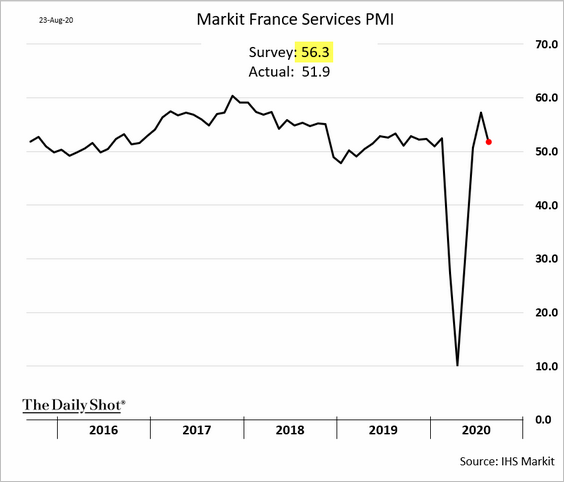
1. The preliminary French PMI report for August was disappointing, with business activity losing momentum.
• Manufacturing is back in contraction mode (PMI < 50):
• Services (slower growth):
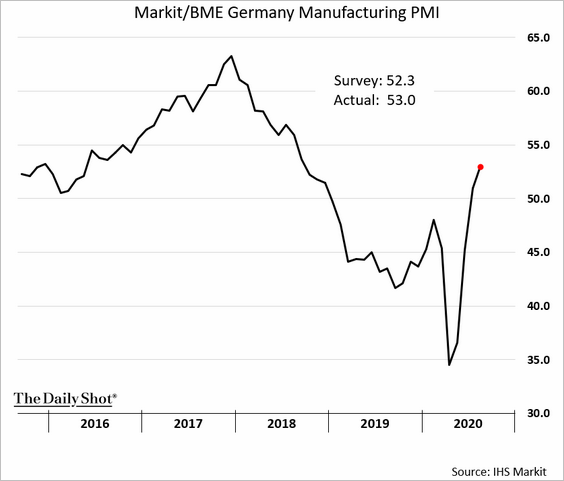
Germany’s manufacturing PMI data showed further improvement.
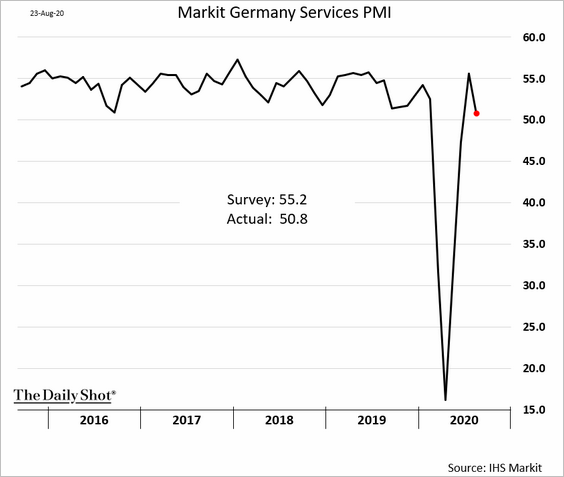
But growth in services has stalled.
Here is the situation at the Eurozone level.
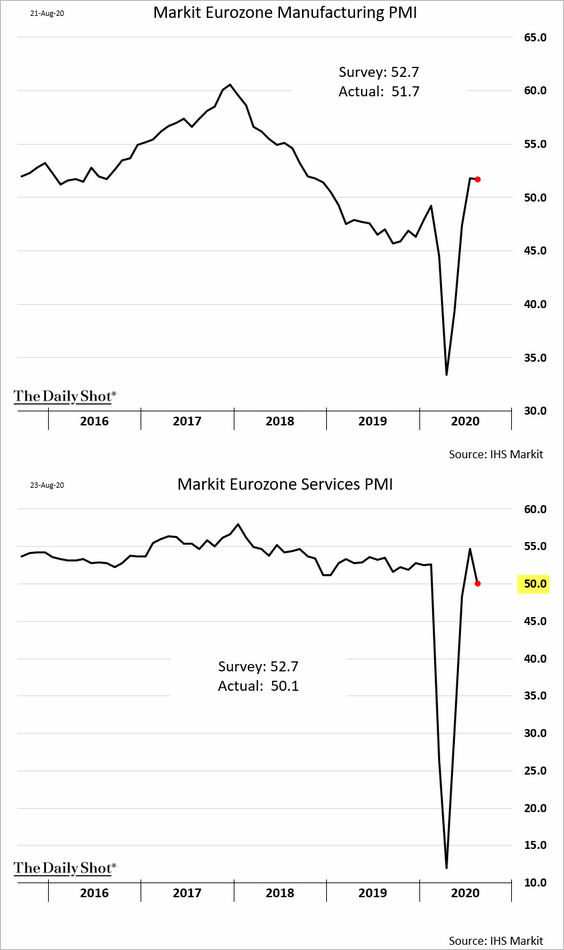
• The second wave has been pressuring service companies.
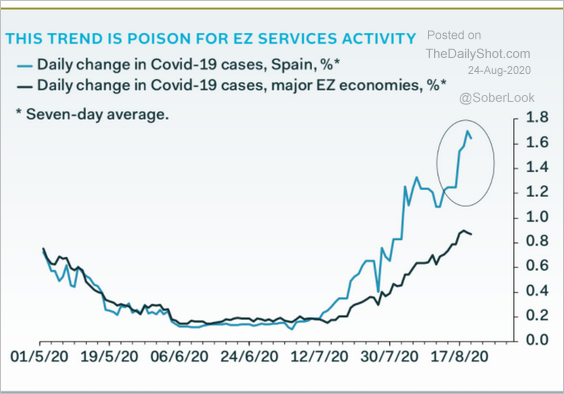 Source: Pantheon Macroeconomics
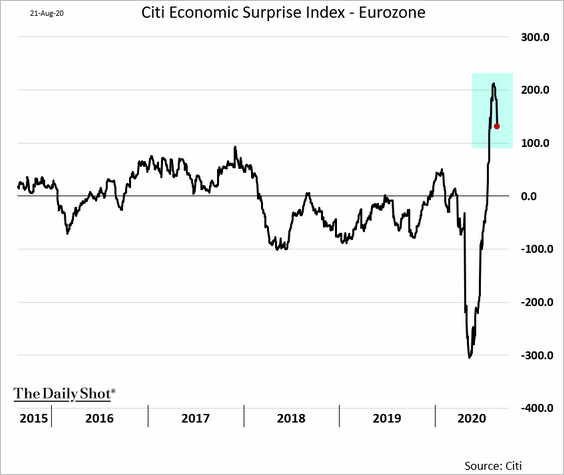
• The Citi economic surprise index declined.
——————–
2. The euro softened in response to the disappointing PMI report.
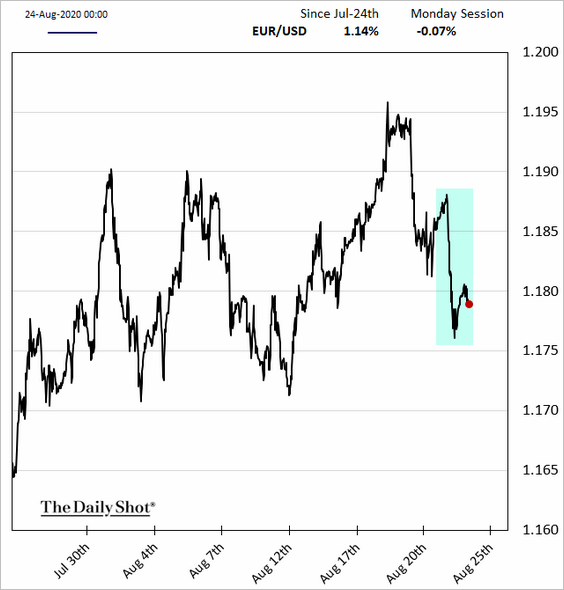
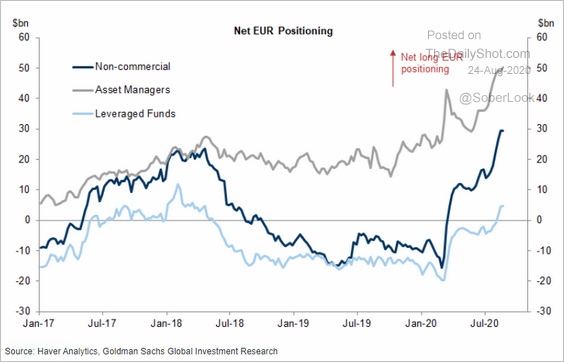
Euro positioning remains stretched. If the US elections go smoothly, the euro could take a hit later this year.
 Source: Goldman Sachs
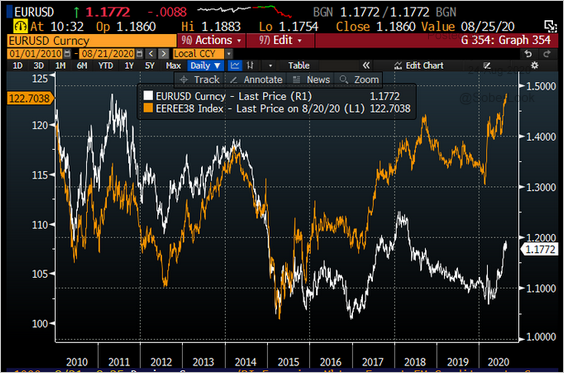
By the way, the euro trade-weighted index (orange) is near record highs.
 Source: @RobinBrooksIIF
——————–
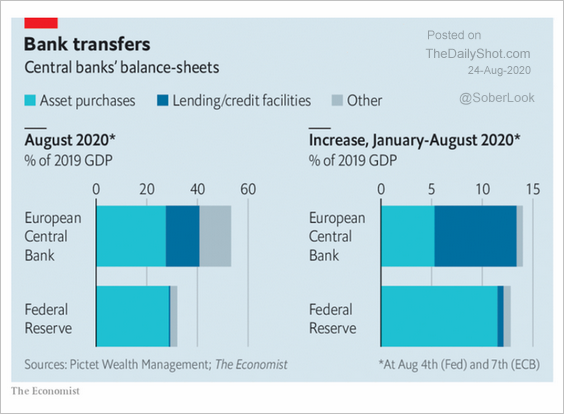
3. Taking TLTRO into account, the ECB’s balance sheet expansion has been larger than the Fed’s.
 Source: @adam_tooze, @fwred, @TheEconomist Read full article
The United Kingdom
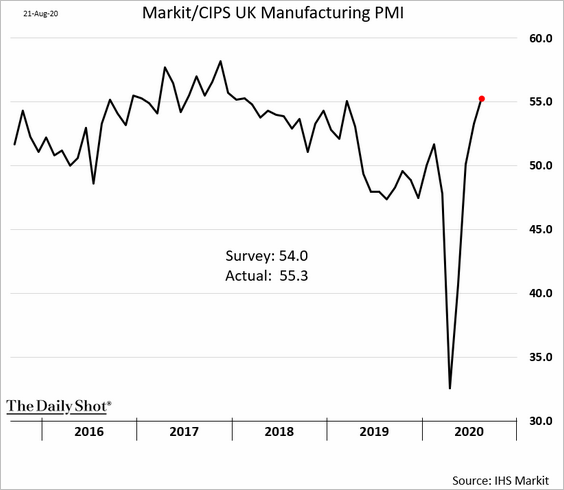
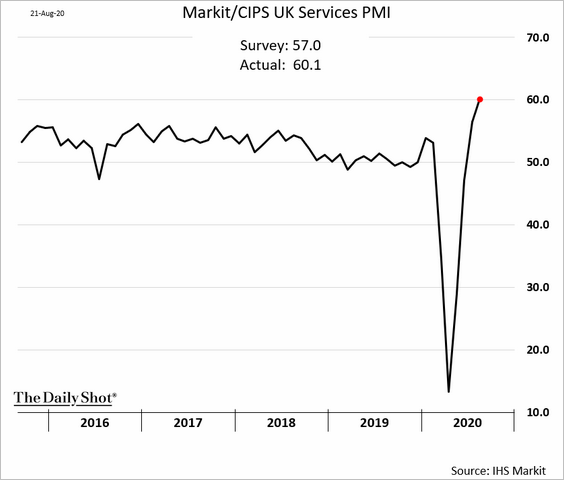
1. The August PMI report showed a further acceleration in business activity (exceeding estimates).
• Manufacturing:
• Services:
——————–
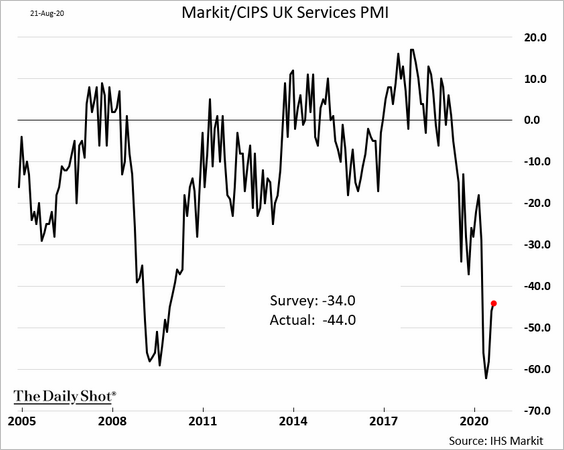
2. However, the CBI index remains weak.
 Source: Reuters Read full article
——————–
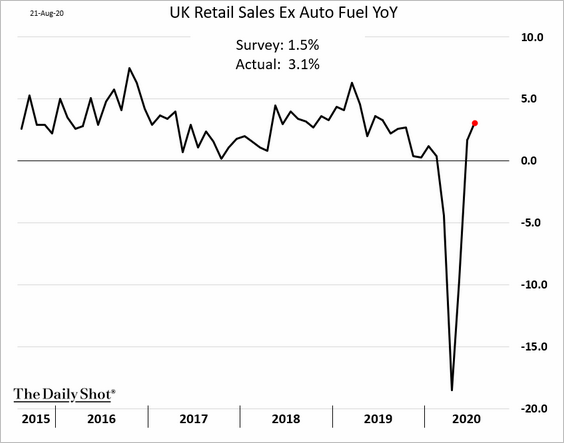
3. July retail sales topped economists’ estimates.
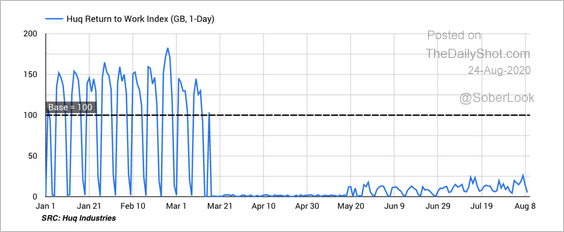
4. This chart shows a measure of office attendance.
 Source: Huq Read full article
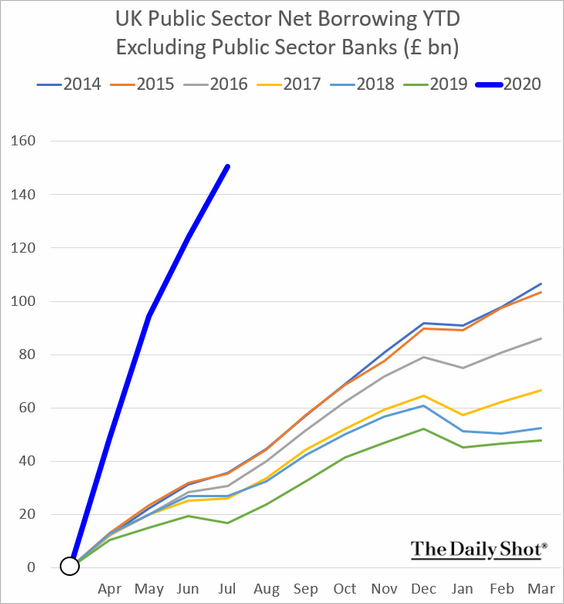
5. Public-sector borrowing has been unprecedented.
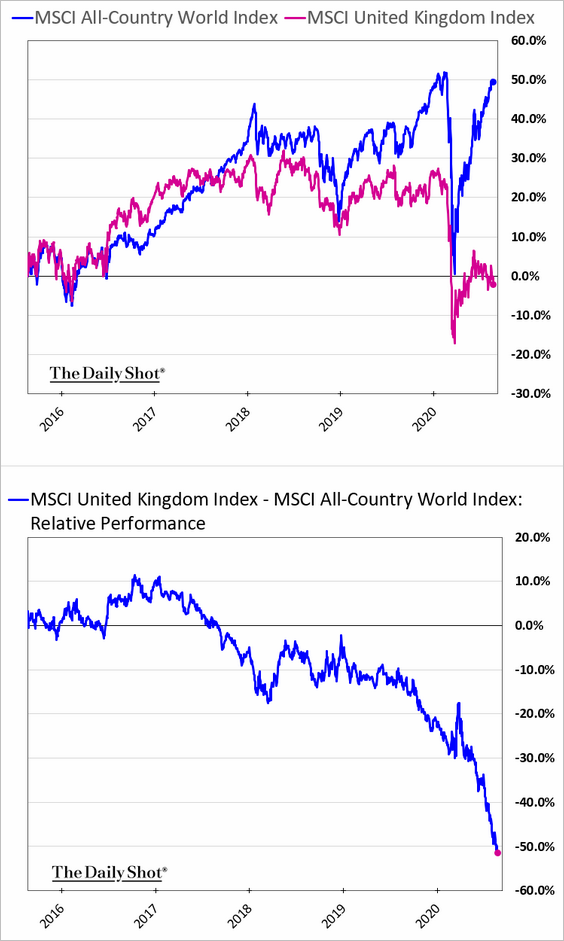
6. The UK stock market’s underperformance has blown out this year.
The United States
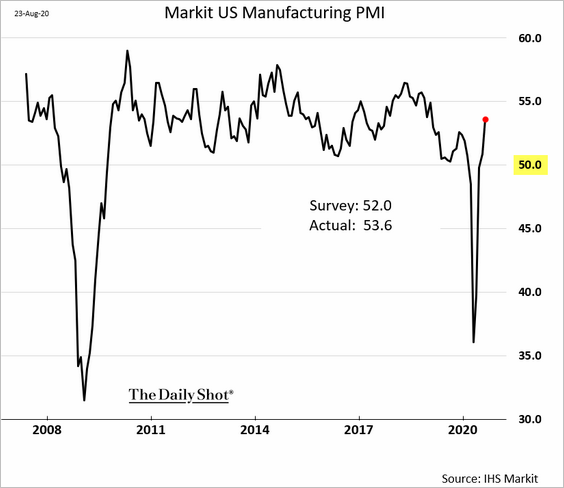
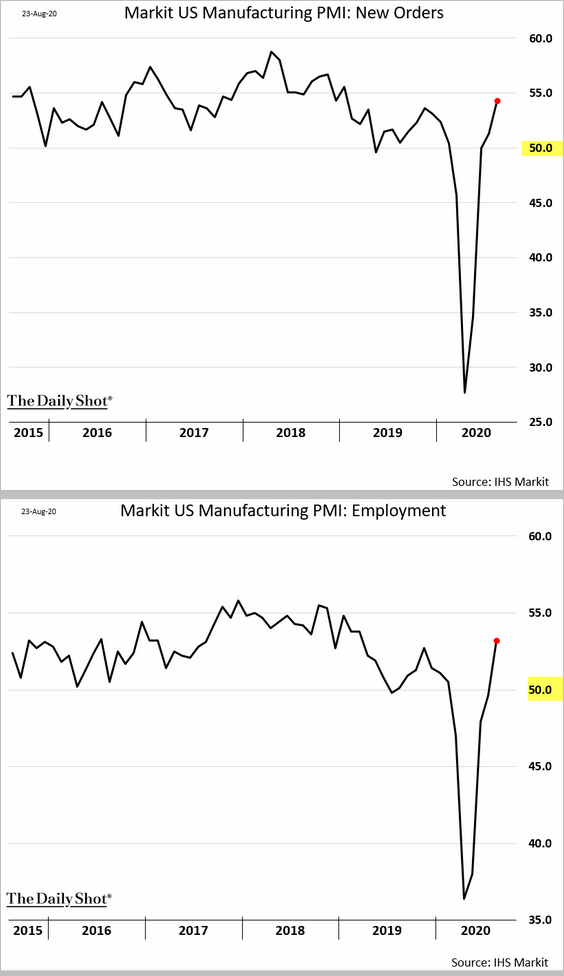
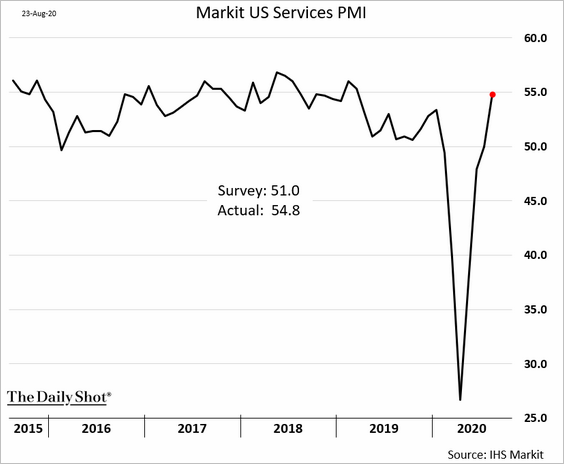
1. The US Markit PMI indicators show business activity strengthening further this month.
• Manufacturing PMI:
• Manufacturing orders and employment:
• Services PMI:
——————–
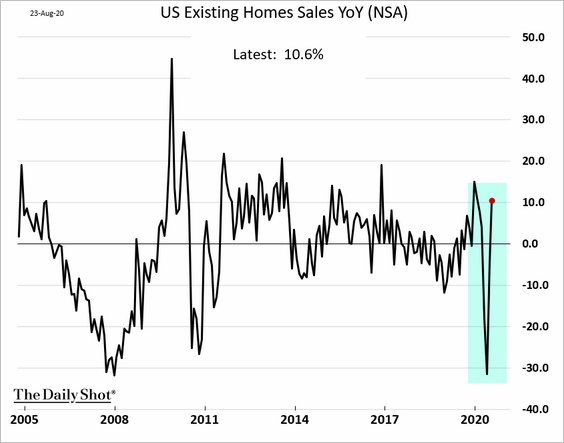
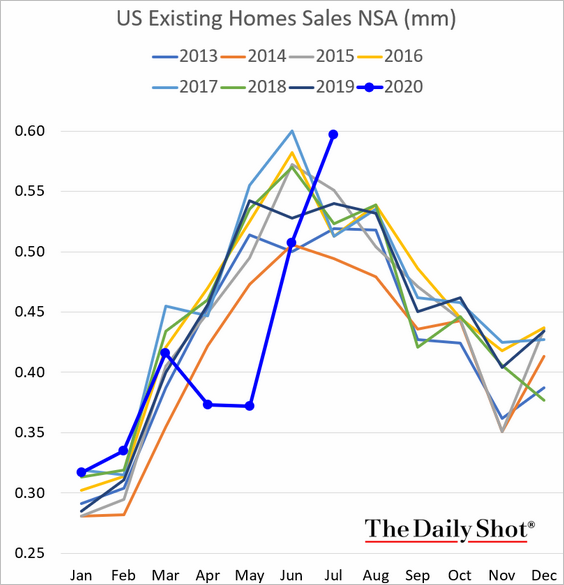
2. Sales of previously-owned homes spiked last month.
• Year-over-year change:
• Unadjusted home sales:
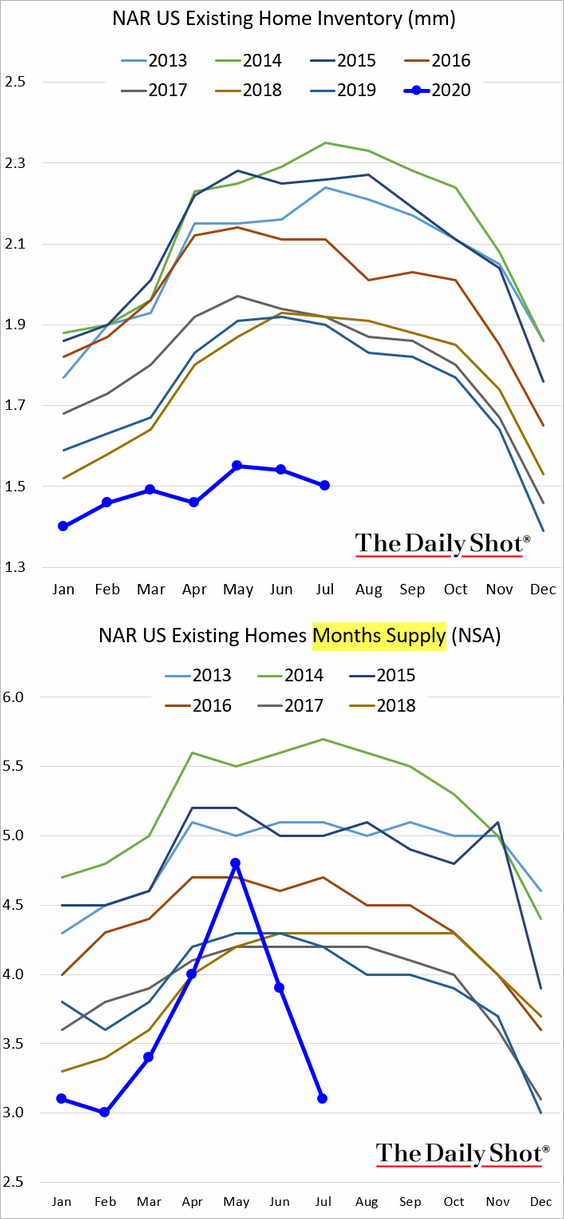
Housing inventories are extremely low.
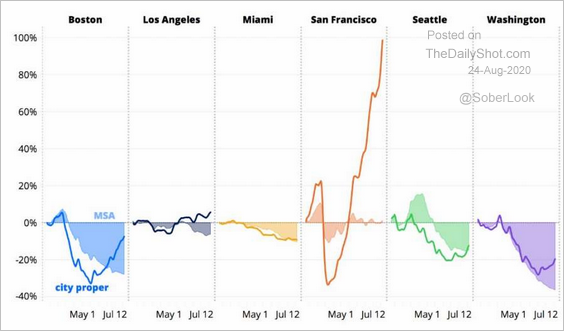
By the way, an exodus from San Francisco boosted housing inventories there.
 Source: @SFGate Read full article
——————–
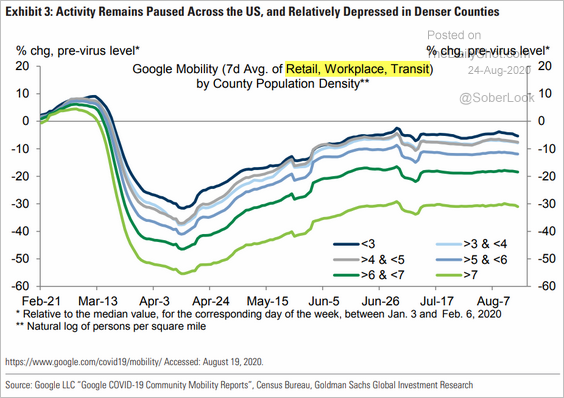
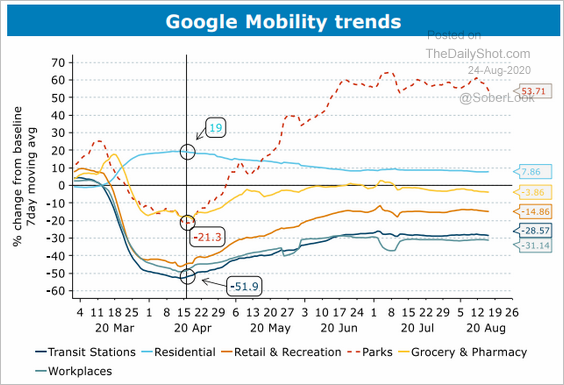
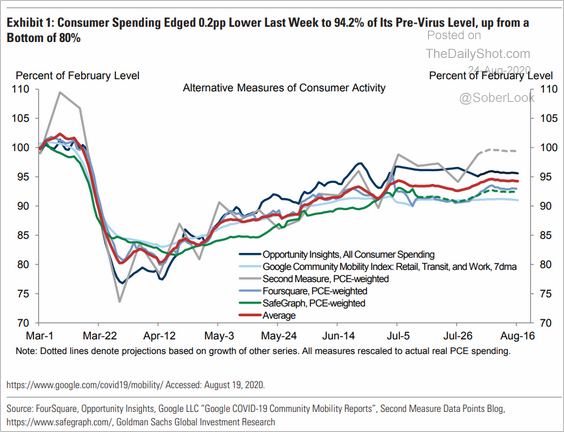
3. Next, we have some high-frequency indicators.
• Mobility trends by county population density:
 Source: Goldman Sachs
• Mobility by sector:
 Source: ANZ Research
• Consumer spending indicators:
 Source: Goldman Sachs
• ANZ activity tracker:
![]() Source: ANZ Research
Source: ANZ Research
• Small business sentiment:
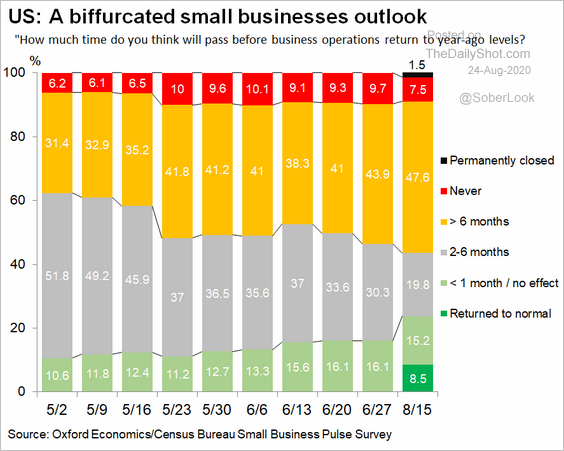 Source: @GregDaco, @uscensusbureau
• Other indicators:
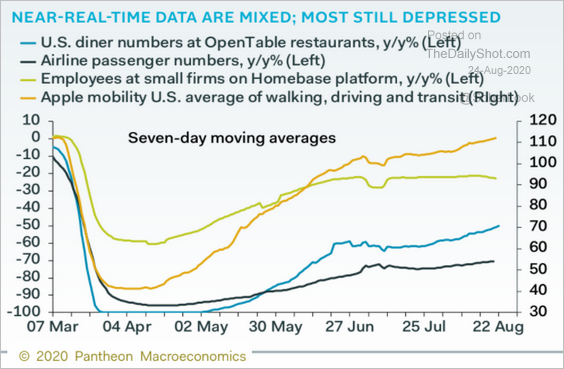 Source: Pantheon Macroeconomics
——————–
Food for Thought
1. Business meetings after lockdowns:
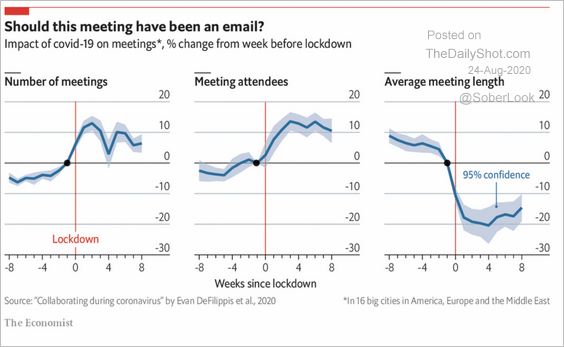 Source: The Economist Read full article
2. Tourism contribution to the GDP:
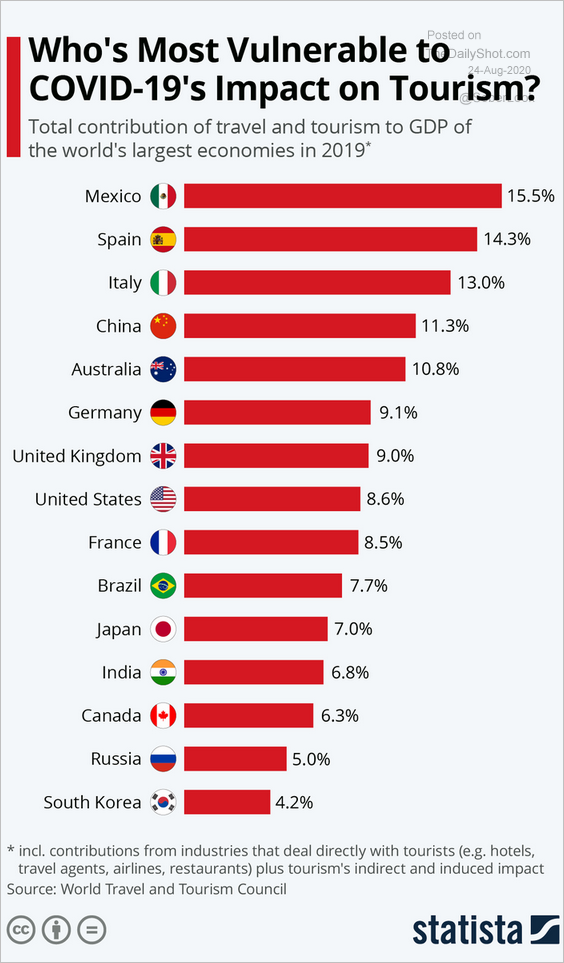 Source: Statista Further reading
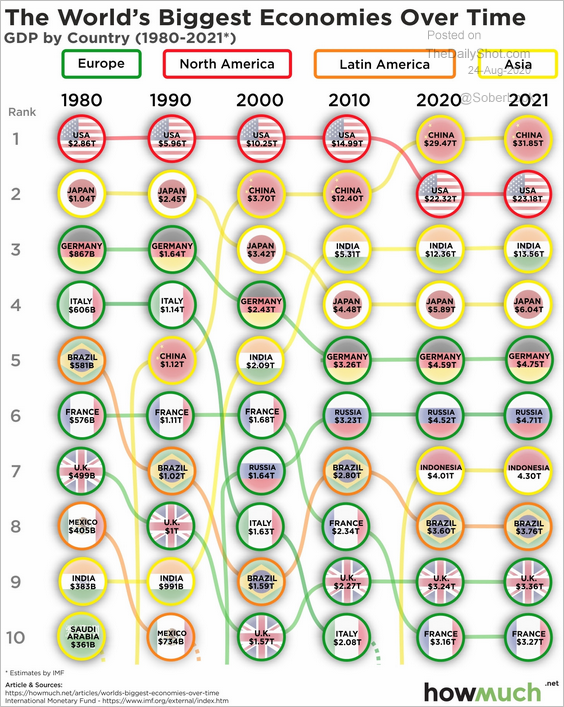
3. The world’s biggest economies over time:
 Source: @howmuch_net Read full article
4. How US school districts are starting the academic year:
 Source: @bpolitics Read full article
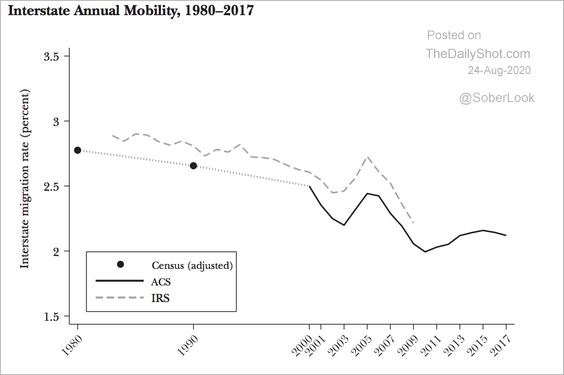
5. US interstate mobility:
 Source: Gaetano Basso, Giovanni Peri Read full article
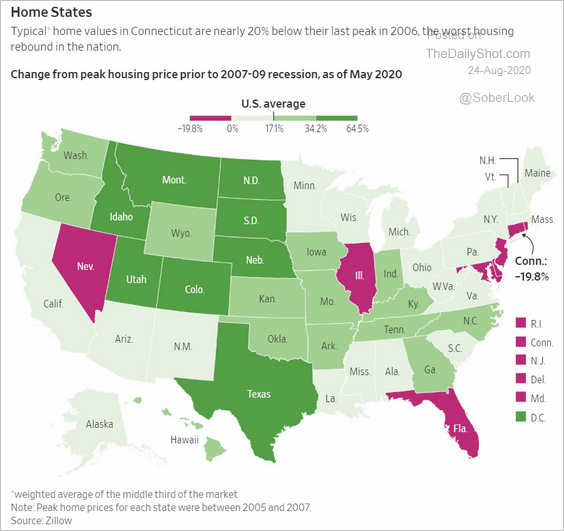
6. Home price changes since the 2006 peak:
 Source: @WSJ Read full article
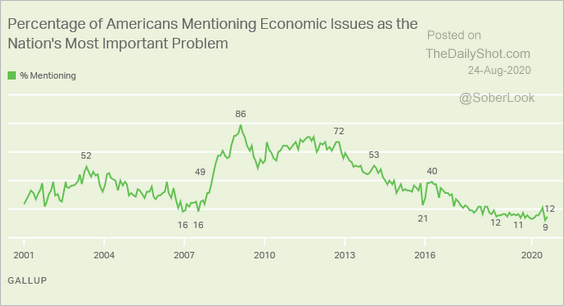
7. Americans’ concerns about economic issues:
 Source: Gallup Read full article
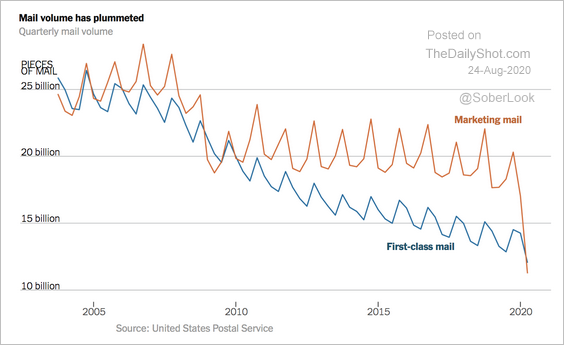
8. US mail volume:
 Source: The New York Times Read full article
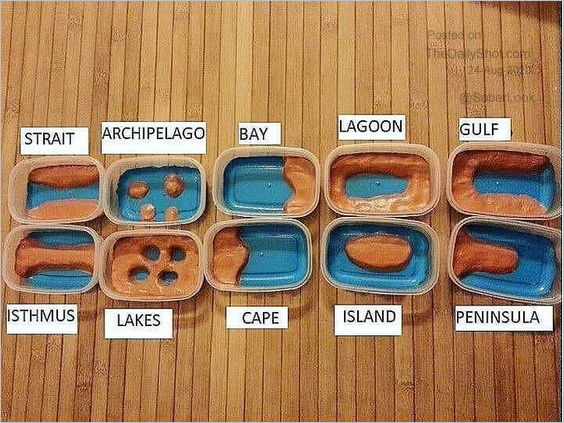
9. Learning geomorphology with Tupperware:
 Source: @simongerman600 Read full article
——————–
