
The Daily Shot: 26-Aug-20
• Apologies for the delay
• The United States
• The United Kingdom
• The Eurozone
• Europe
• Asia – Pacific
• China
• Emerging Markets
• Commodities
• Equities
• Alternatives
• Rates
• Global Developments
• Food for Thought
Apologies for the delay
We had some technical issues this morning.
The United States
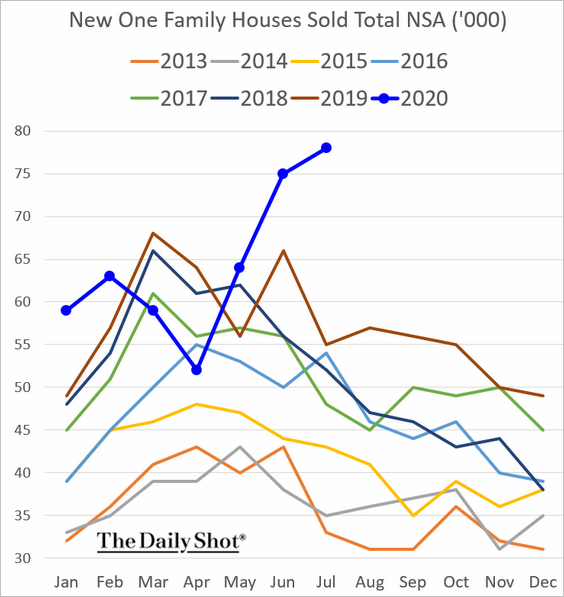
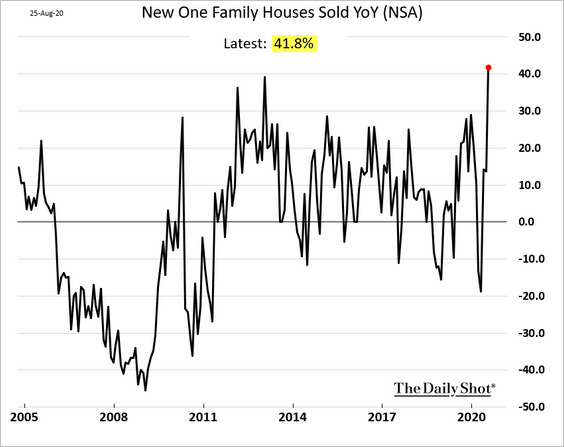
1. Let’s begin with the housing market, which remains a key source of strength in the US recovery.
• Sales of new homes hit the highest level in years, rising more than 40% from last year.
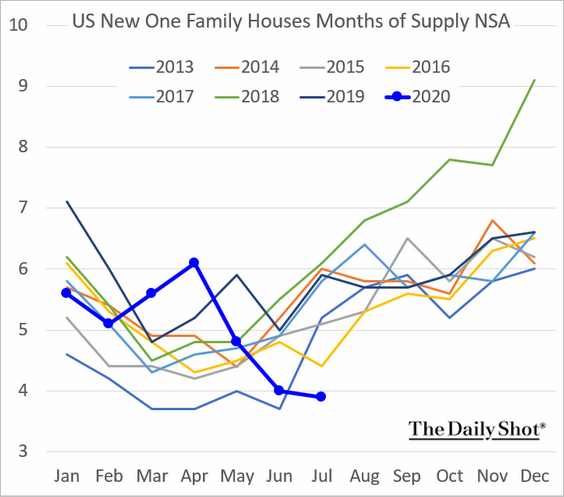
• Inventories of newly built houses are tightening.
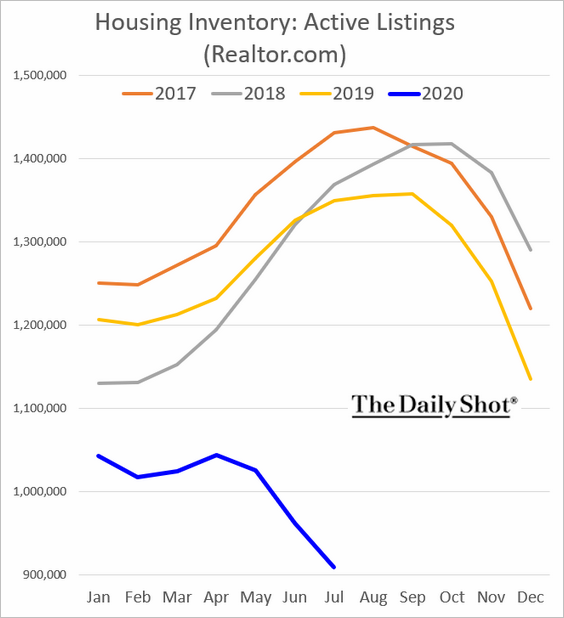
• Active listings of homes tracked by Realtor.com have collapsed this year. The lack of homes for sale will accelerate price increases.
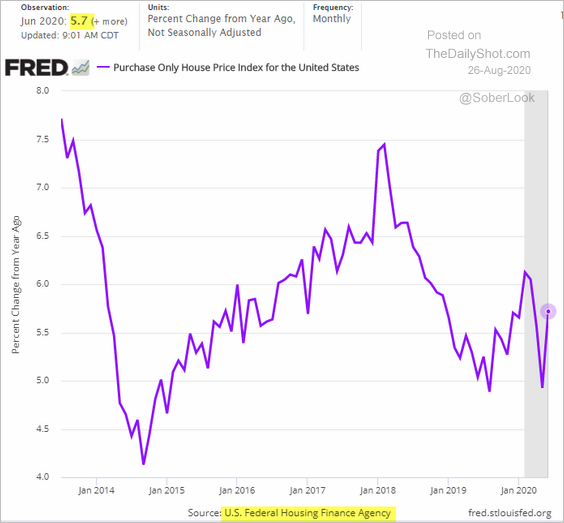
• As of June, housing price appreciation reports have been mixed.
– Year-over-year price changes tracked by the FHFA:
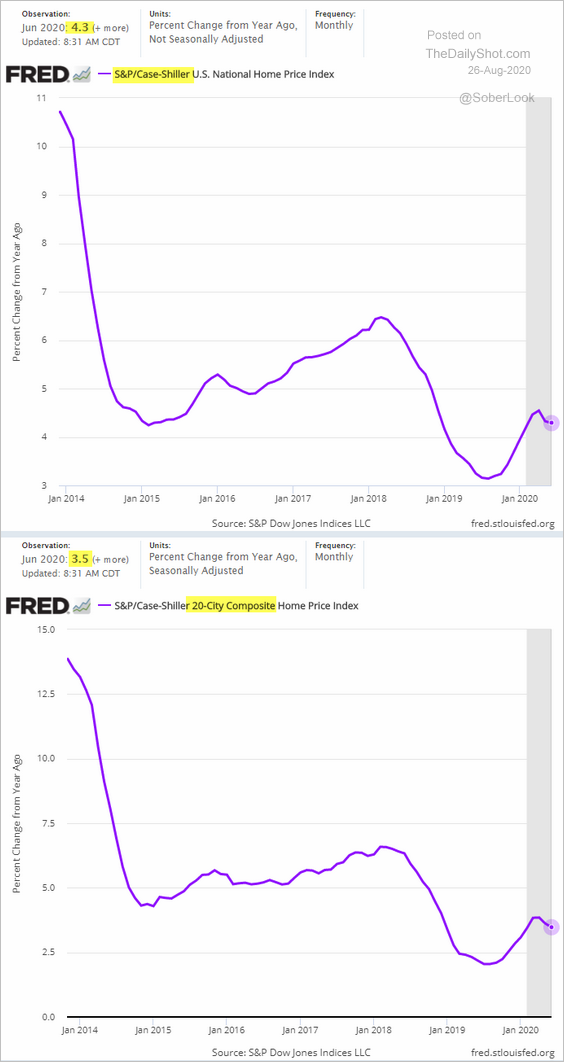
– Prices tracked by S&P/Case-Shiller:
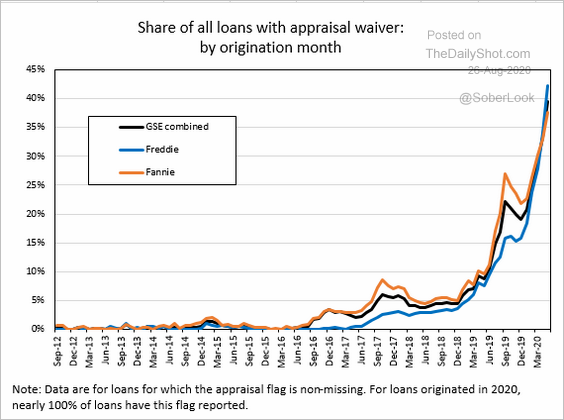
• Freddie and Fannie have increasingly been waiving housing appraisals in mortgage originations.
 Source: AEI Housing Center
——————–
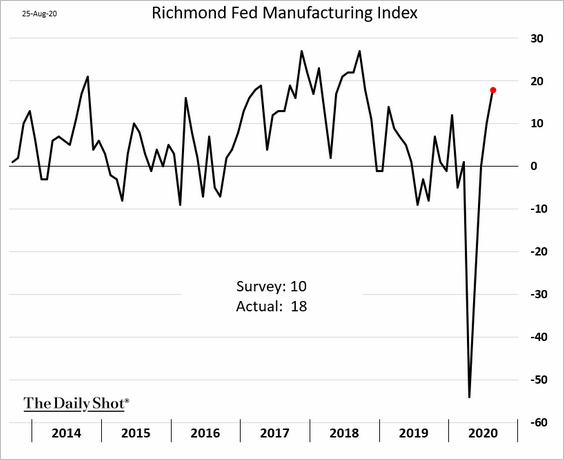
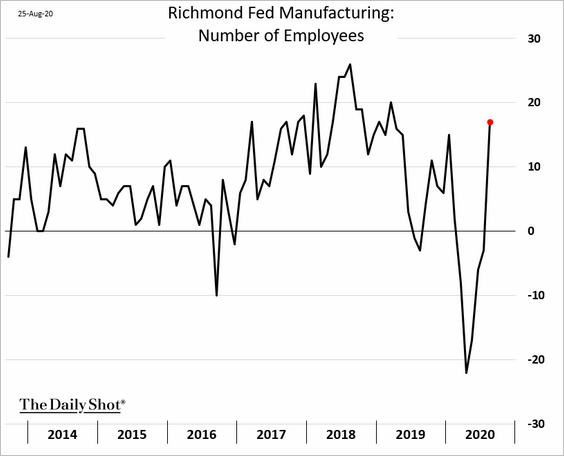
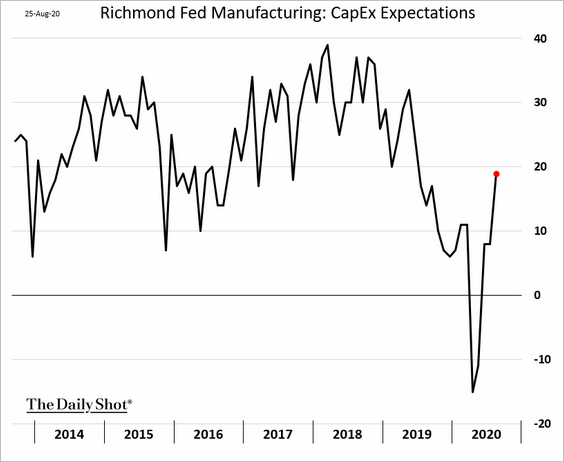
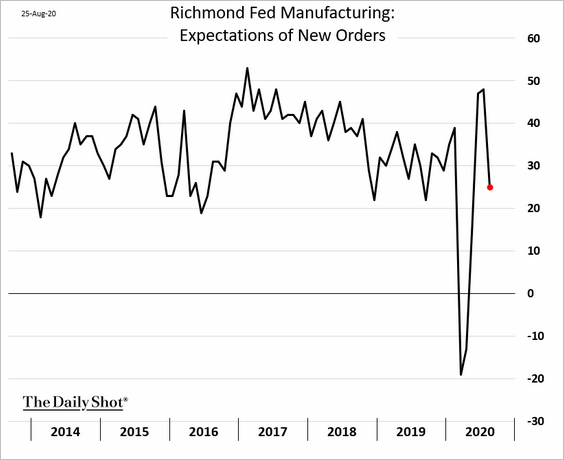
2. Next, we have a couple of regional Fed reports on business activity. Both are relatively strong.
• The Richmond Fed’s manufacturing survey:
– The headline index:
– Employment:
– CapEx expectations:
– Expectations of new orders:
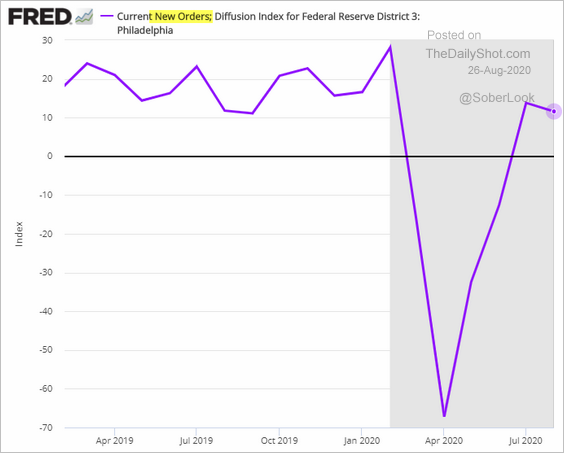
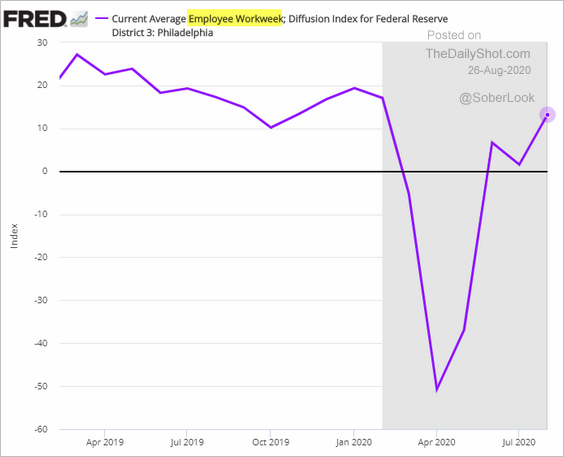
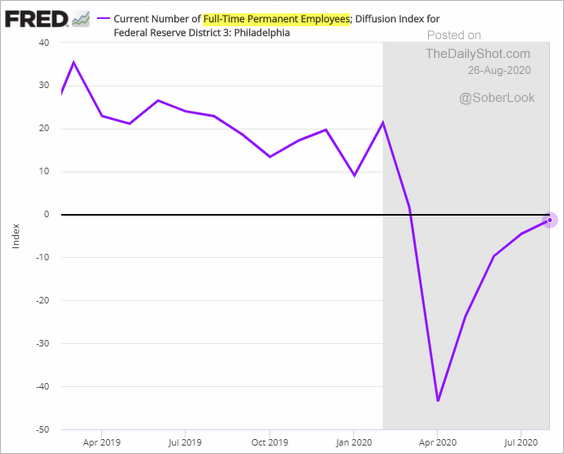
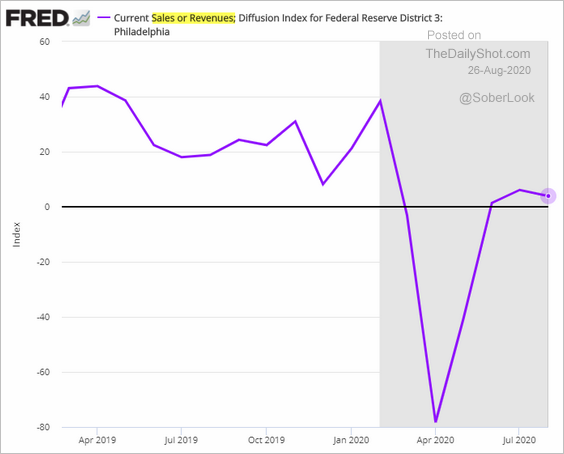
• The Philly Fed’s non-manufacturing business report was a bit softer in August.
– New orders:
– Employee workweek:
– Full-time employment (the bleeding has stopped):
– Sales:
——————–
3. Is the rout in rail freight ending?
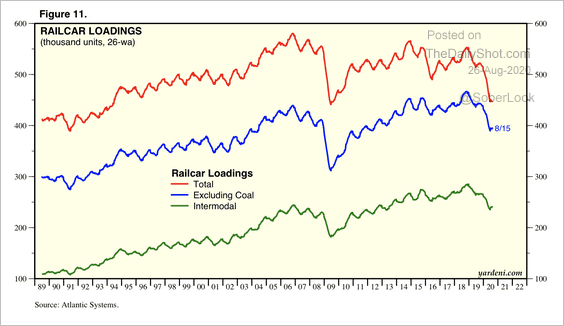 Source: Yardeni Research
4. Now, let’s take a look at the labor market.
• The sharp drop in US unemployment insurance benefits (loss of the extra $600) …
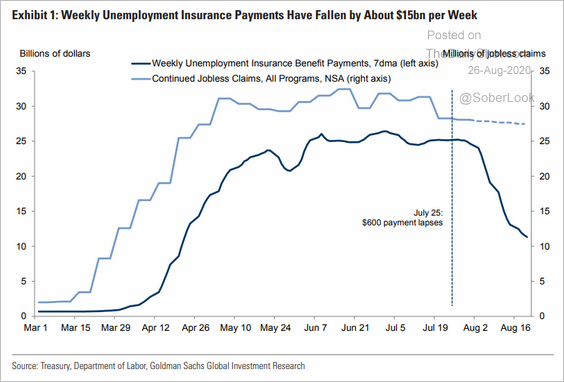 Source: Goldman Sachs
… is showing up in debit card payments (unemployment payouts are often deposited into dedicated debit card accounts).
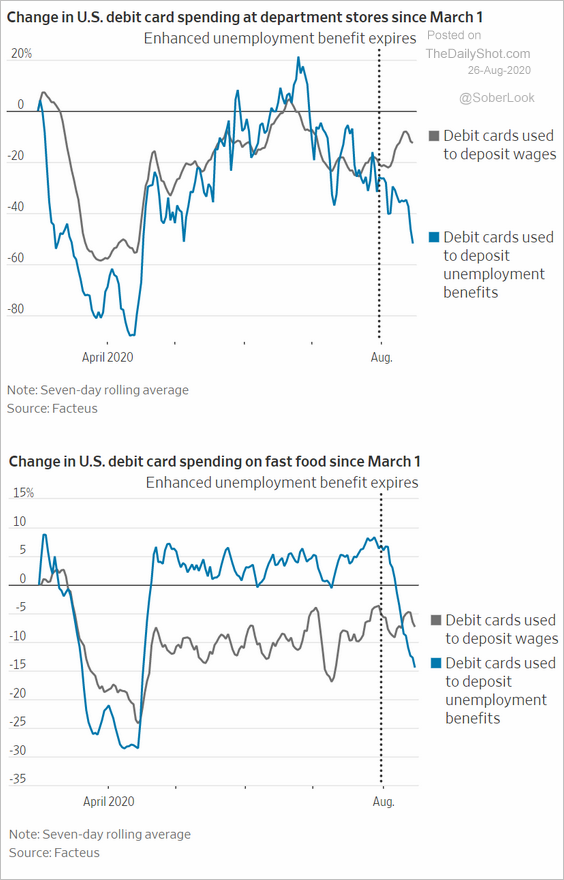 Source: @WSJ Read full article
• But even the extra $300 payments (as opposed to $600 paid earlier) will fully replace many Americans’ lost incomes.
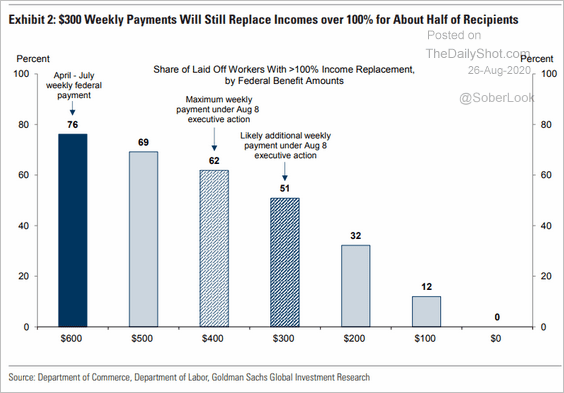 Source: Goldman Sachs
• Job postings on Indeed remain far below last year’s levels.
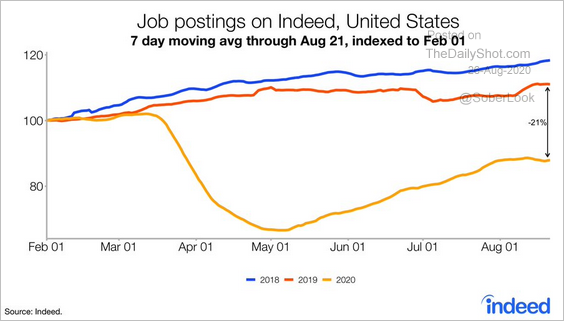 Source: @JedKolko, @indeed Read full article
• There are still over 30 million Americans receiving unemployment benefits.
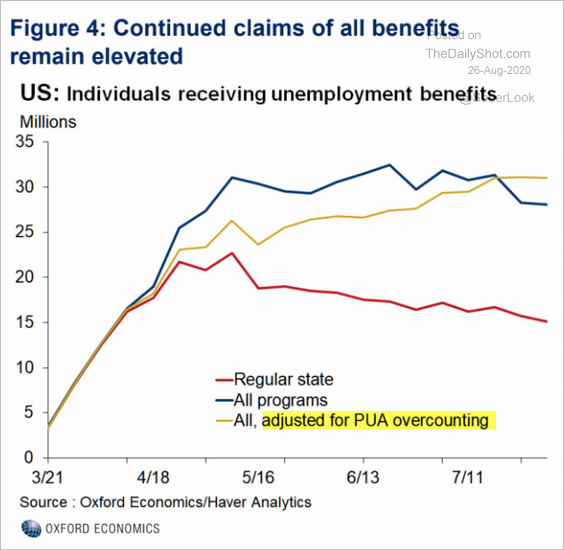 Source: Oxford Economics
• Here is the share of unemployed workers that expect to return to the same job.
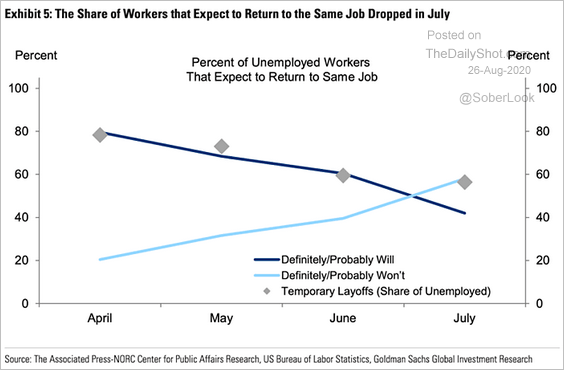 Source: @ISABELNET_SA, @GoldmanSachs
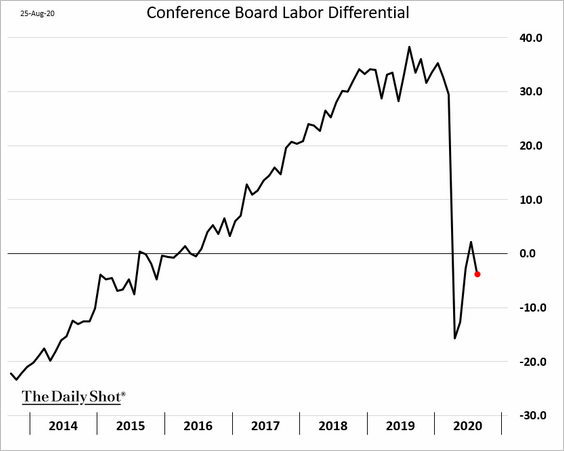
• The Conference Board Labor Differential (“jobs plentiful” less “jobs hard to get”) turned lower in August.
——————–
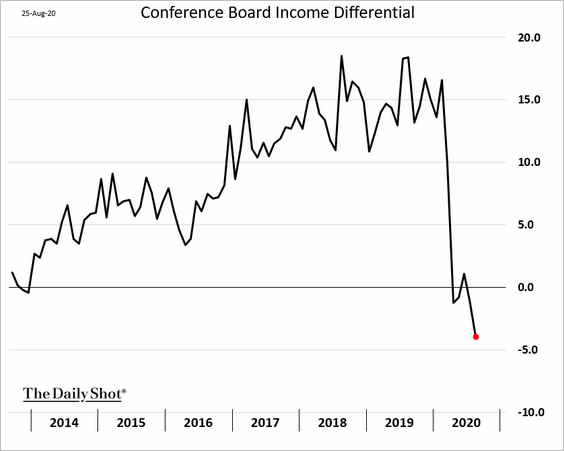
5. The Conference Board’s index of consumer confidence tumbled to the lowest level since 2014. The cut in government benefits is the key reason for the weakness.
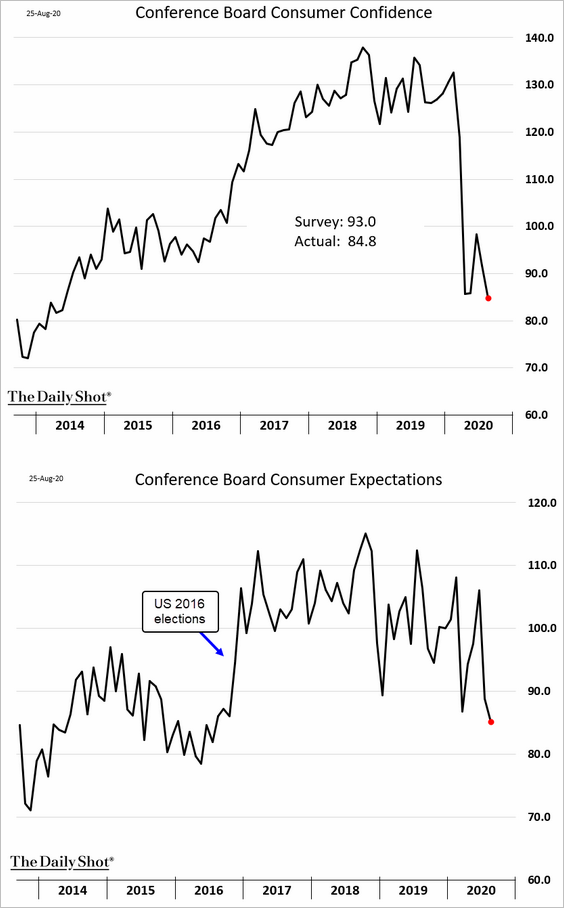
This chart shows the income differential. It’s the spread between respondents saying “my income will increase” vs. “decrease” in 6 months.
 Source:
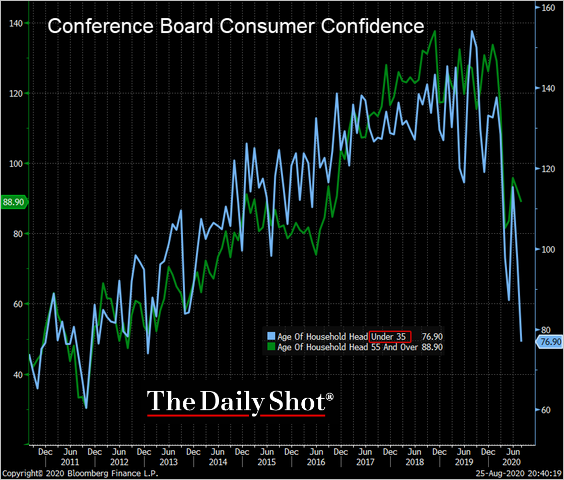
Loss of confidence among younger Americans has been particularly severe.
 Source: @TheTerminal, Bloomberg Finance L.P.
——————–
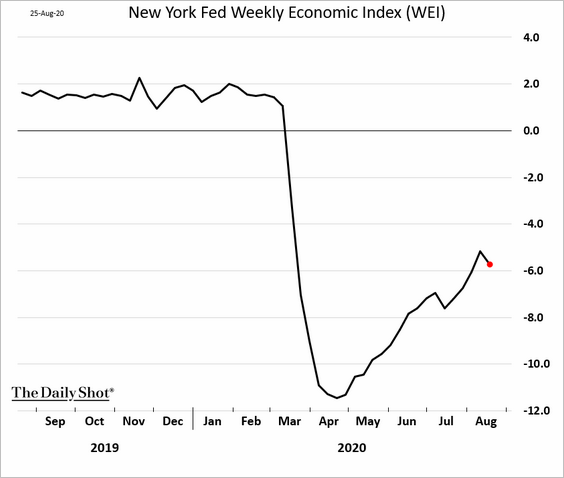
6. Finally, here is the New York Fed’s national economic activity index (WEI).
The United Kingdom
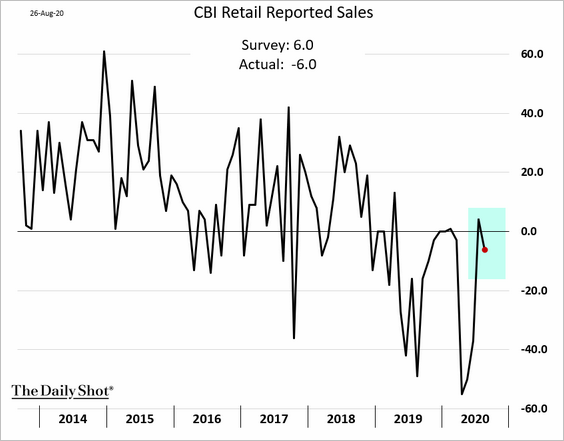
1. Retail sales softened this month according to CBI, with retailers laying off more workers.
 Source: Reuters Read full article
This chart shows retail sales trends through July.
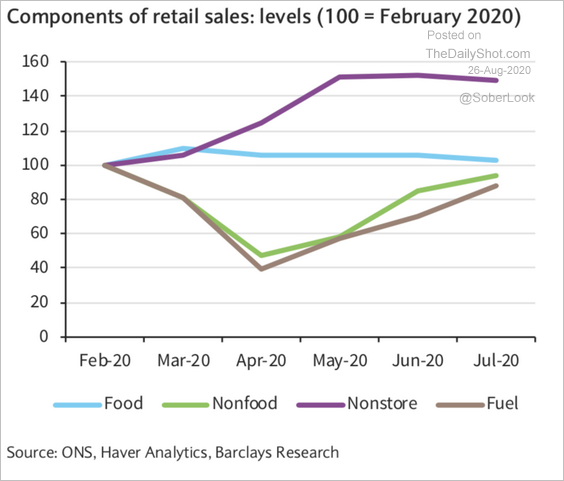 Source: Barclays Research
——————–
2. The UK recovery continues to lag the rest of Europe (although PMI measures have been strong).
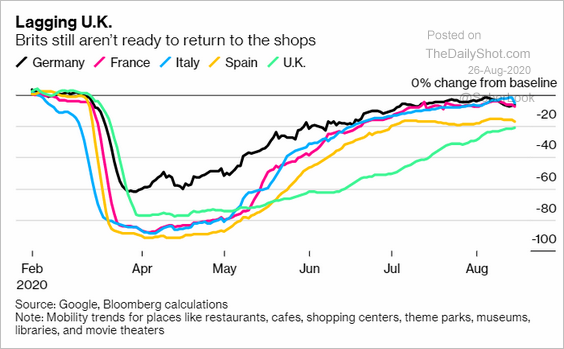 Source: @business Read full article
3. Below is the evolution of the UK’s political divide by age.
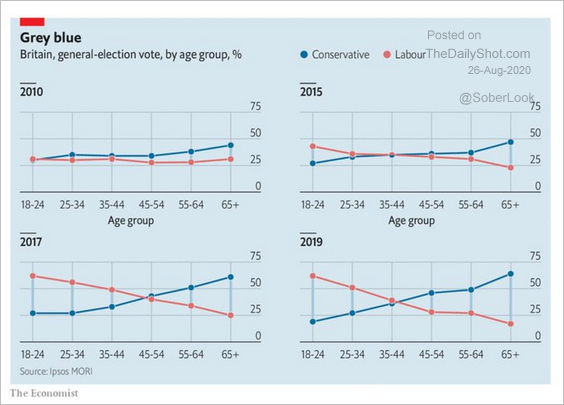 Source: @adam_tooze, @TheEconomist Read full article
And this is the government approval rate.
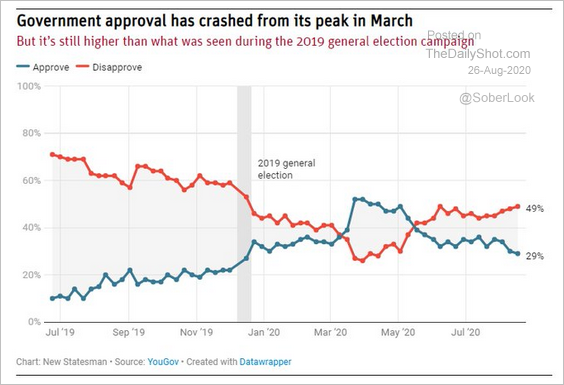 Source: @britainelects, @YouGov Read full article
The Eurozone
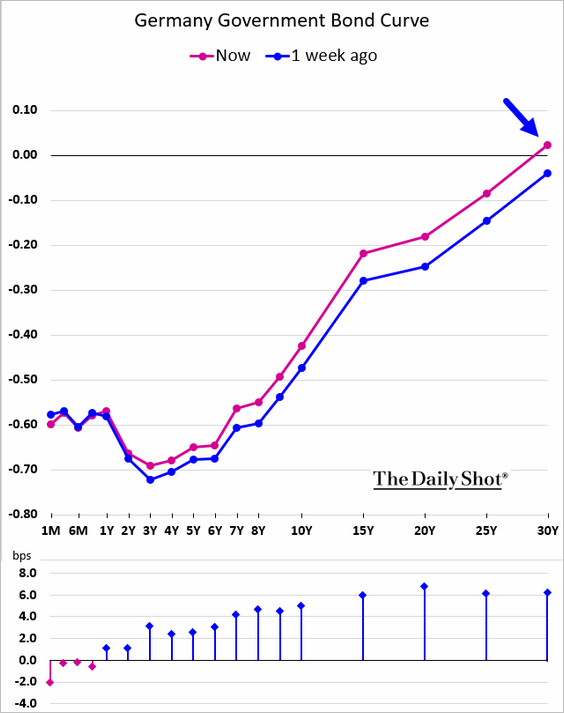
1. Let’s begin with Germany.
• The Bund curve has steepened, with the 30-year yield moving back into positive territory.
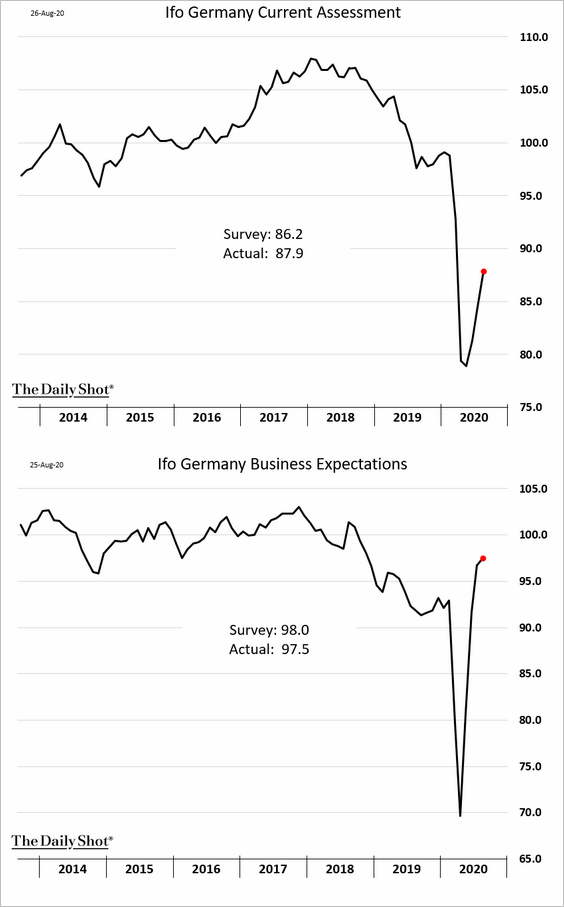
• The Ifo report continues to show improvements in Germany’s business expectations.
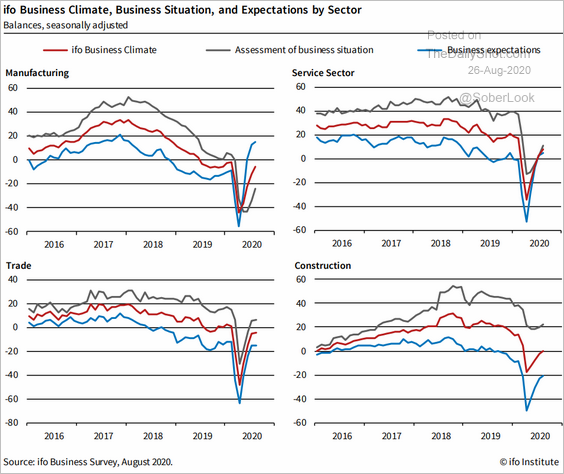
Here is the breakdown by sector.
 Source: ifo Institute
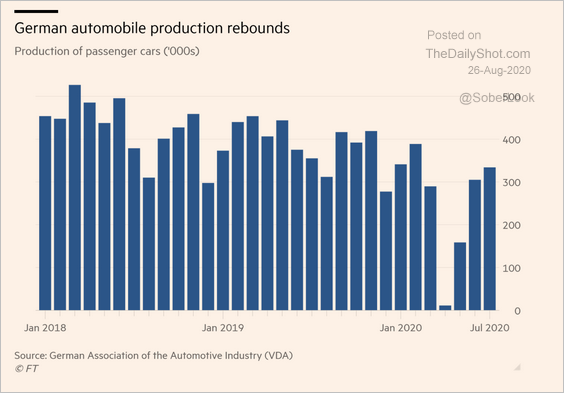
• Automobile production has been rebounding.
 Source: @financialtimes Read full article
• The German government budget swang into deficit for the first time in years (the title is supposed to say “Germany recorded …”).
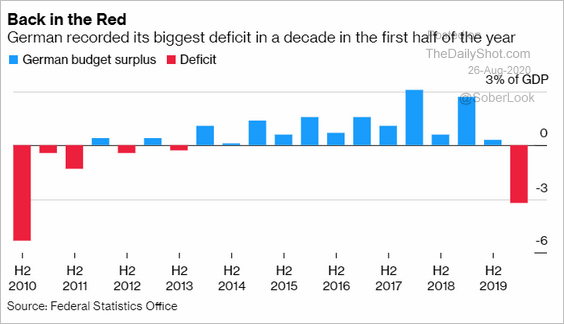 Source: @markets Read full article
——————–
2. The second wave remains a concern.
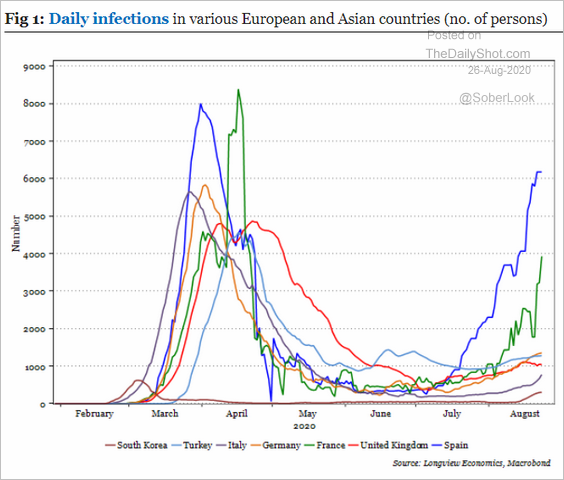 Source: Longview Economics
Nonetheless, euro-area mobility trends are outperforming the US.
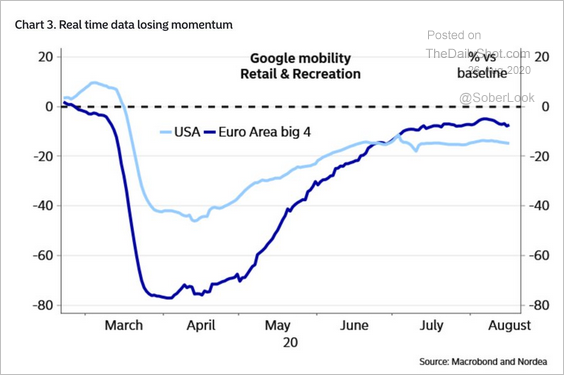 Source: @adam_tooze, @AndreasSteno Read full article
——————–
3. Consumers are starting to make major purchases – possibly using some of their savings.
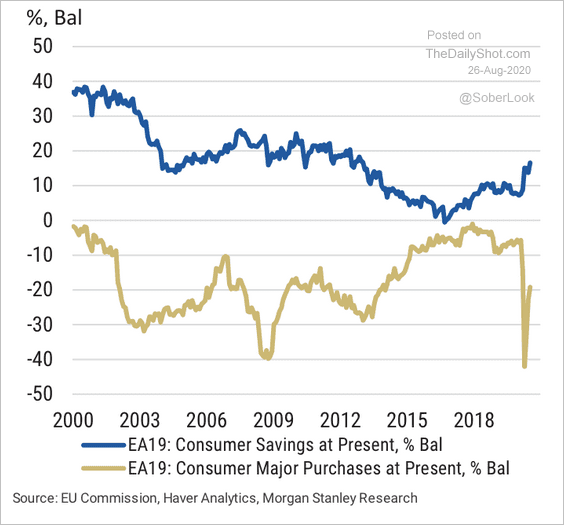 Source: Morgan Stanley Research
4. EUR/USD is at long-term resistance, and analysts are concerned that the long-euro trade has become crowded.
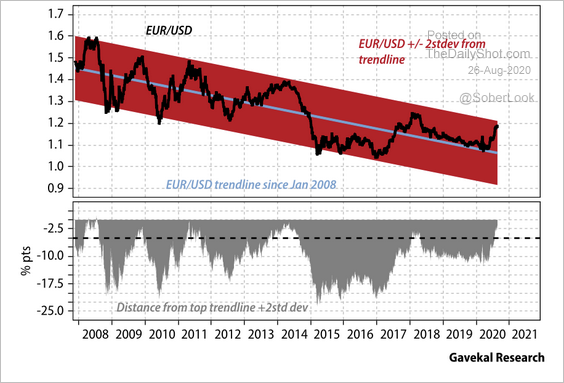 Source: Gavekal
Europe
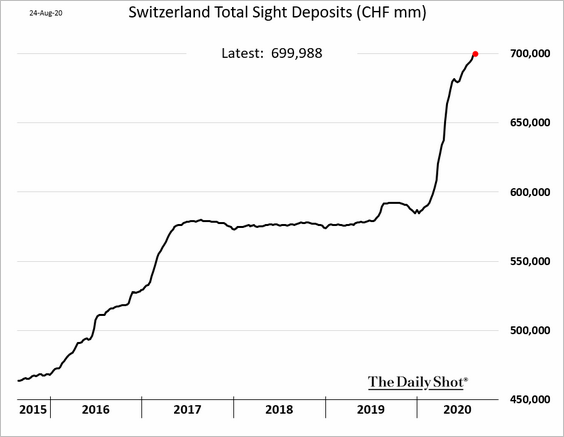
1. Elsewhere in Europe, Switzerland’s sight deposits show that the SNB continues to buy euros and other currencies to keep the franc from appreciating further. Relative to the GDP, the SNB’s balance sheet is now one of the largest in the world (bigger than BoJ’s).
2. Will Sweden’s massive spike in liquidity boost home price appreciation?
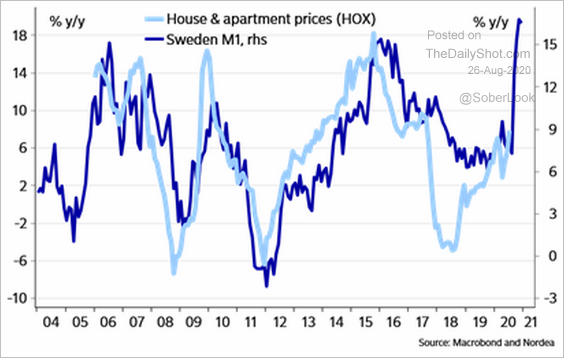 Source: @AndreasSteno
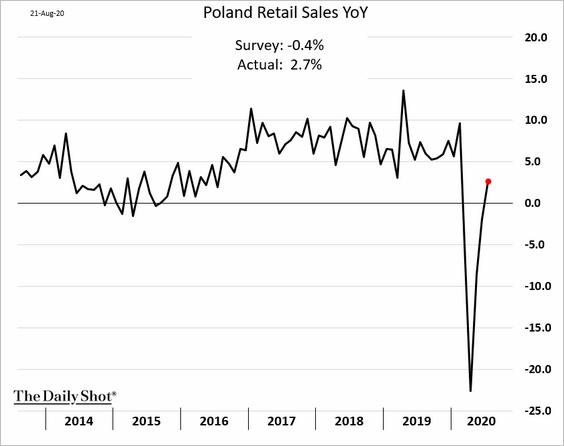
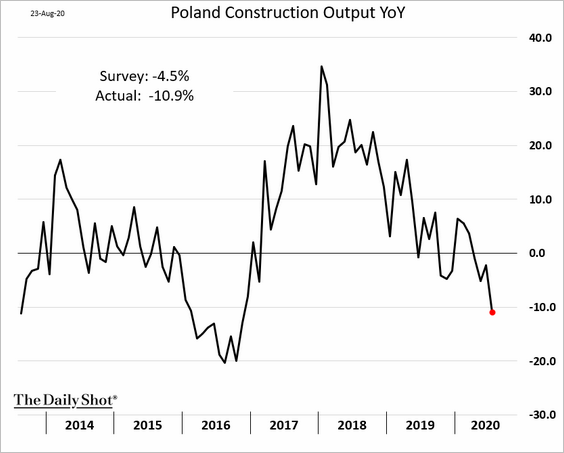
3. As of July, Poland’s retail sales were above last year’s levels.
But construction activity continues to deteriorate.
——————–
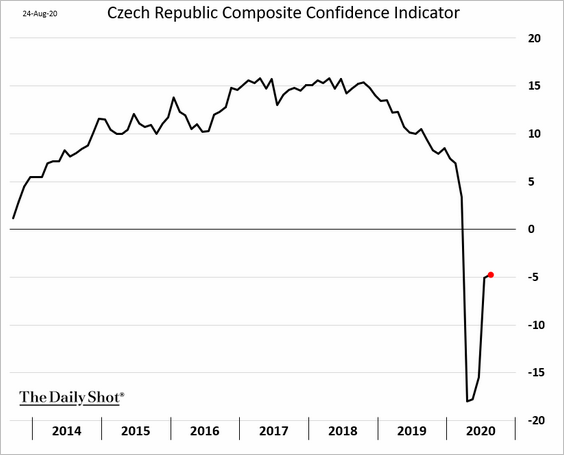
4. The recovery in Czech consumer and business confidence is stalling.
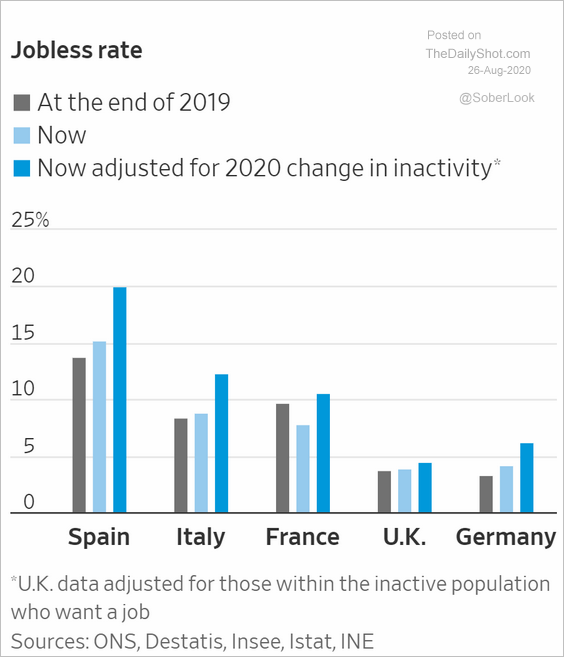
5. This chart shows the European jobless rate adjusted for changes in labor market inactivity.
 Source: @WSJ Read full article
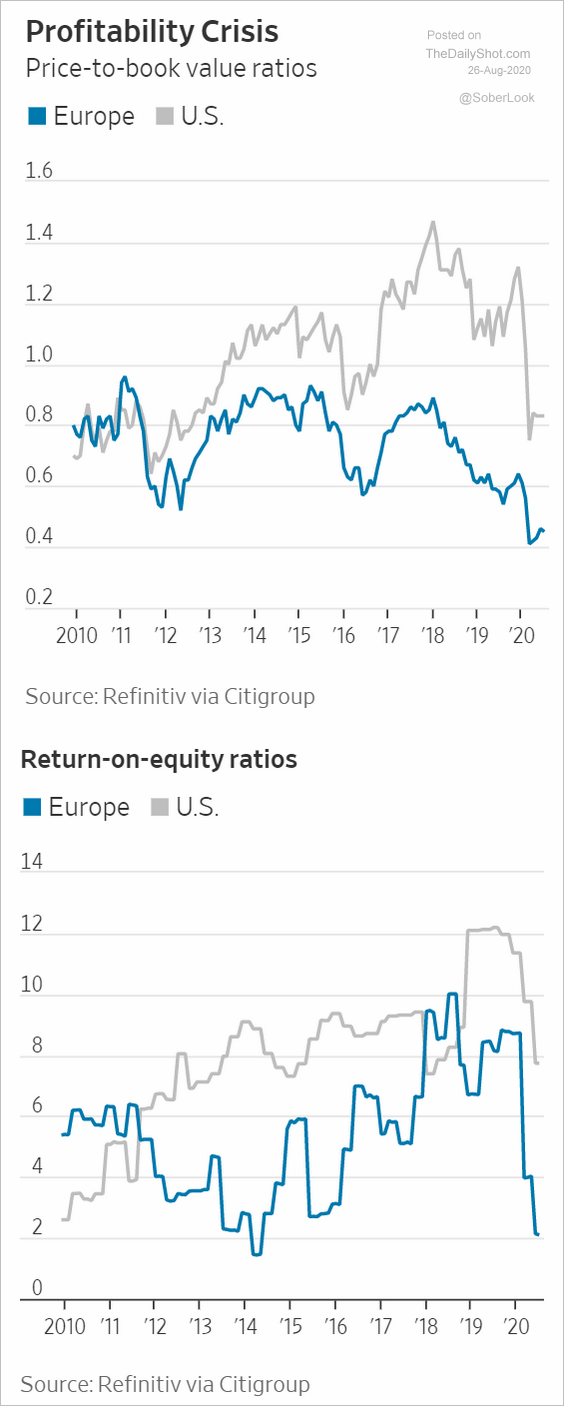
6. European banks have underperformed their US counterparts.
 Source: @WSJ Read full article
Asia – Pacific
1. According to Natixis, “a stronger yen would improve the structurally weak consumer purchasing power through falling import prices.”
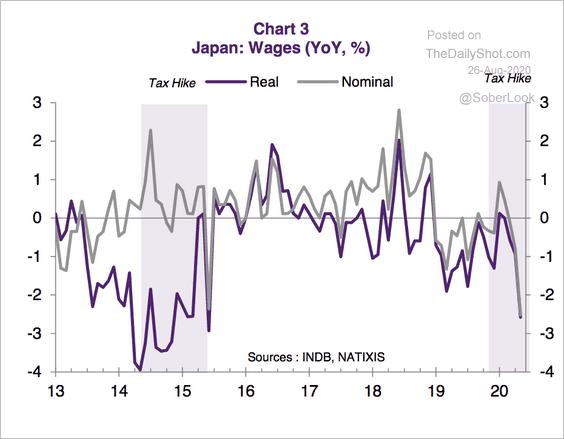 Source: Natixis
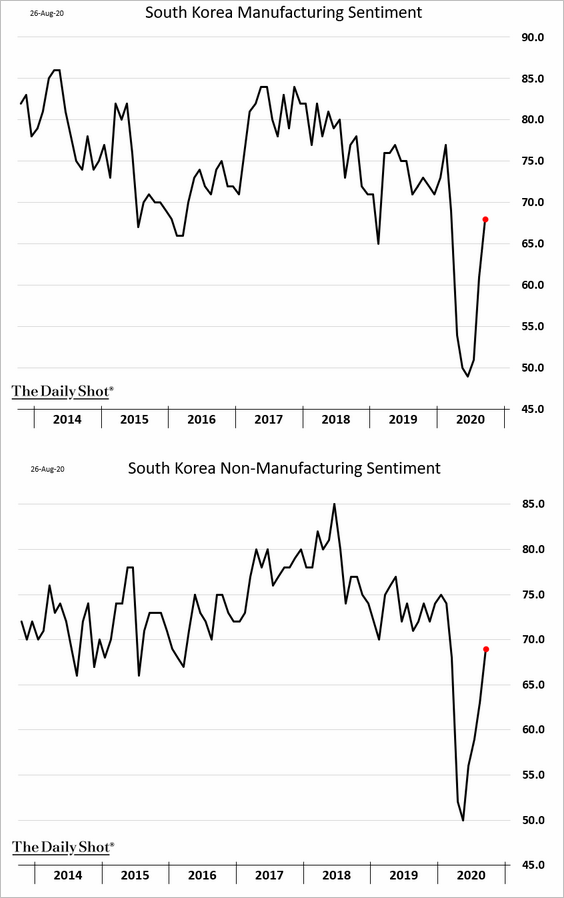
2. South Korea’s business sentiment is rebounding.
3. Government benefits drove most of the recent growth in household incomes in Australia.
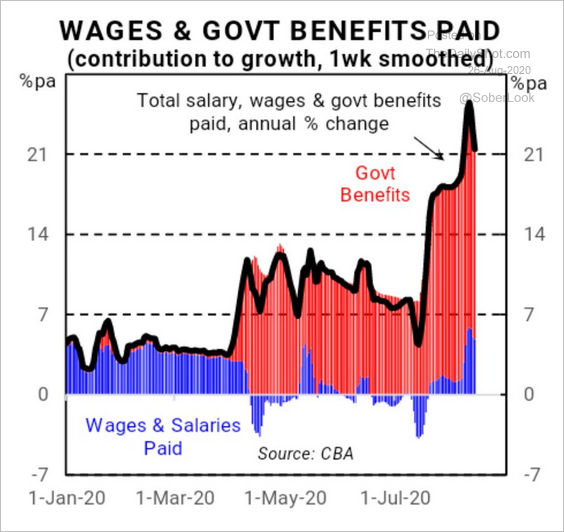 Source: Commonwealth Bank of Australia, @Scutty
Separately, Australia’s construction activity has been remarkably resilient.
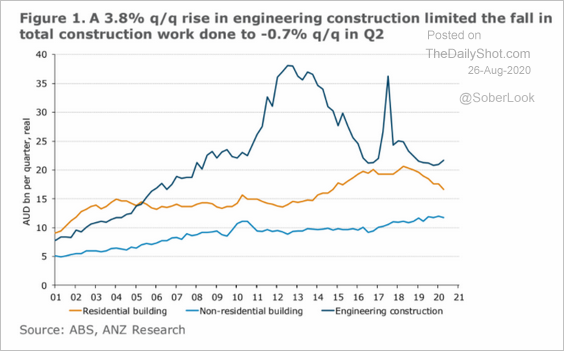 Source: ANZ Research
China
1. Will we see a breakout in China’s stock market?
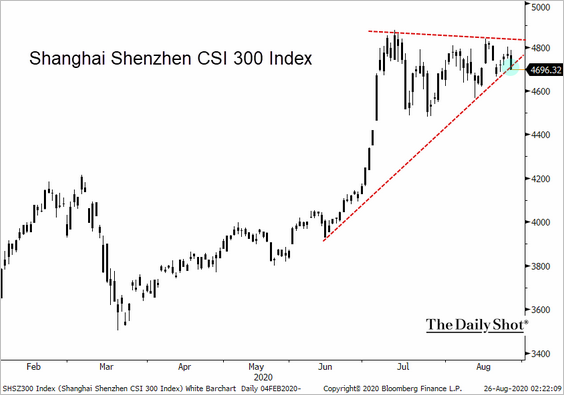 Source: @TheTerminal, Bloomberg Finance L.P.
By the way, China’s shares are not cheap.
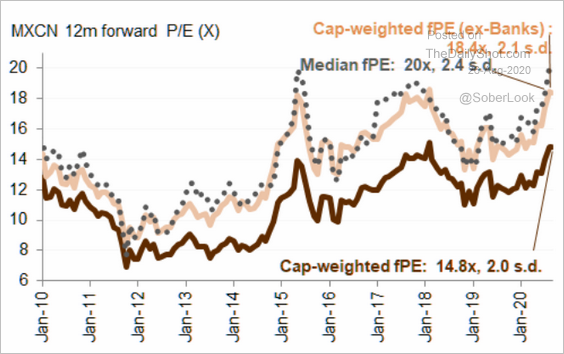 Source: MSCI IBES, @themarketear
——————–
2. Ant Group’s IPO is expected to be massive.
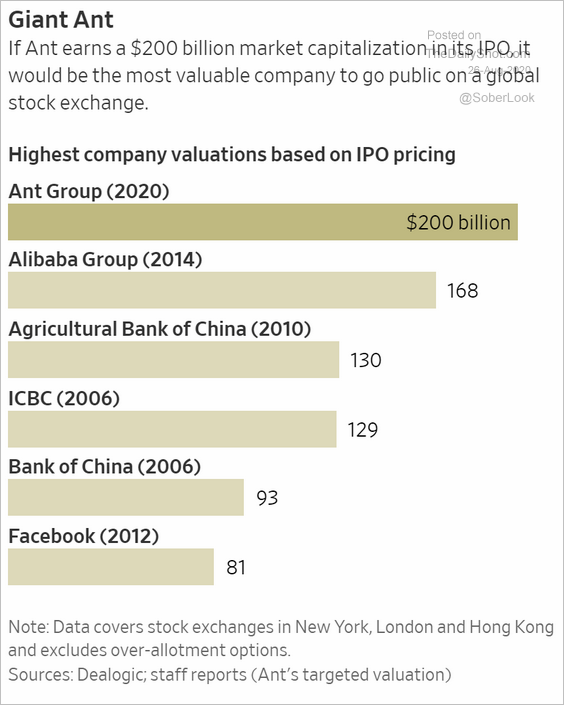 Source: @WSJ Read full article
3. How will the US supply chain diversification impact China?
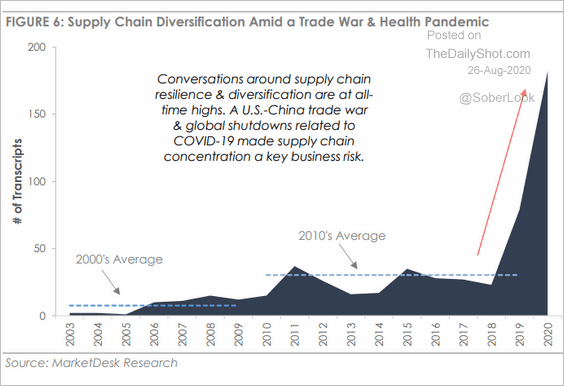 Source: MarketDesk Research
4. China’s courts are increasingly busy.
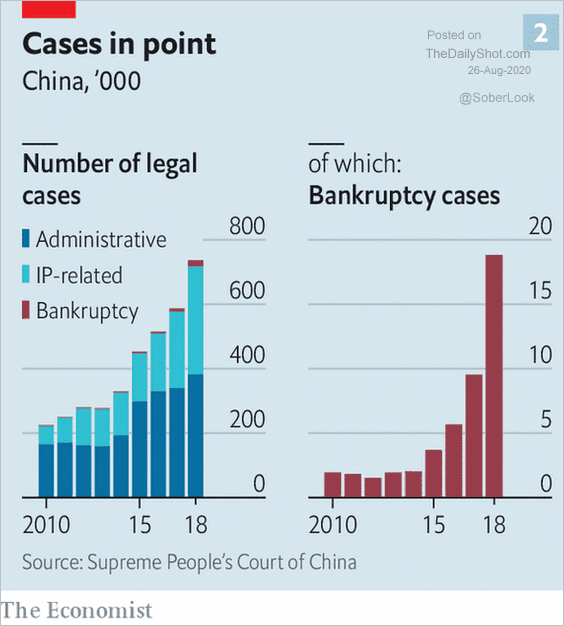 Source: The Economist, @adam_tooze Read full article
5. Finally, this chart shows the latest projections for China’s working-age population.
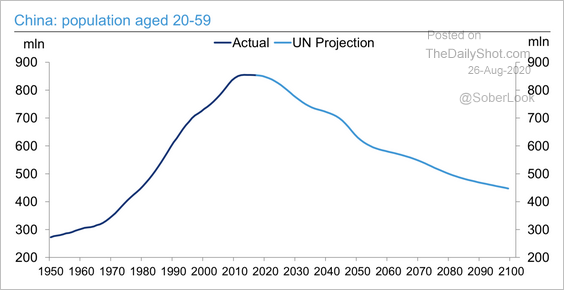 Source: Deutsche Bank Research
Emerging Markets
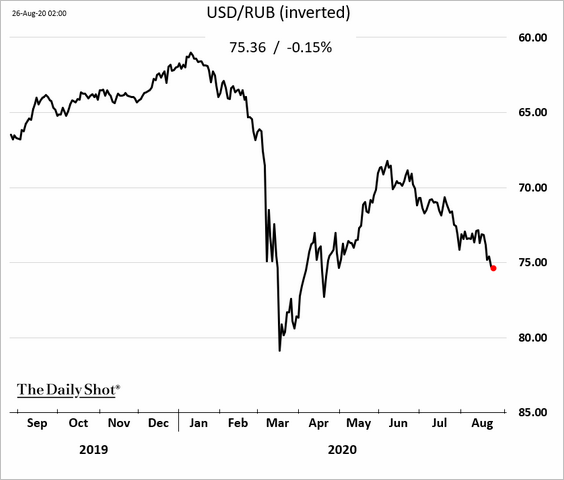
1. The Russian ruble has been drifting lower. The weakness is driven by soft economic data, the Belarus situation, and potentially a less “friendly” US government (if Joe Biden wins).
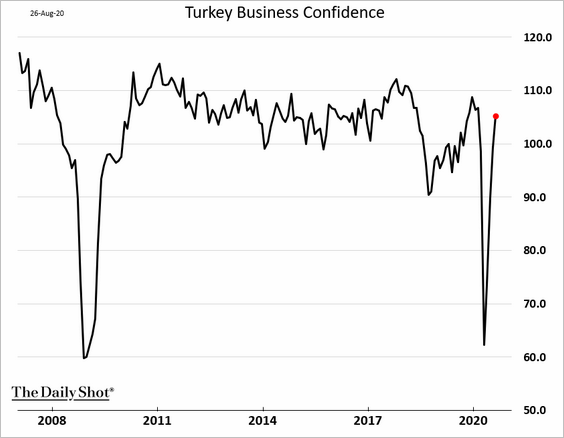
2. Turkey’s business confidence has fully recovered.
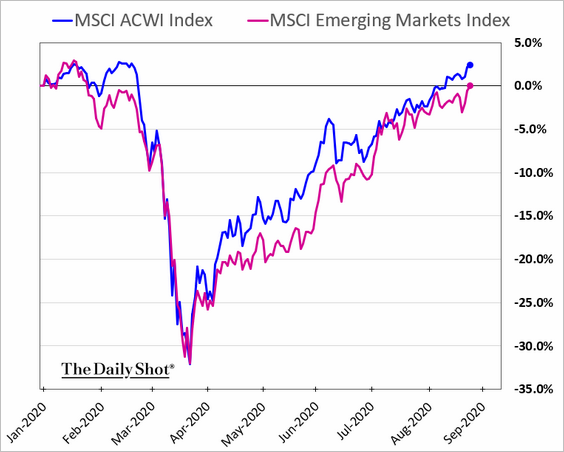
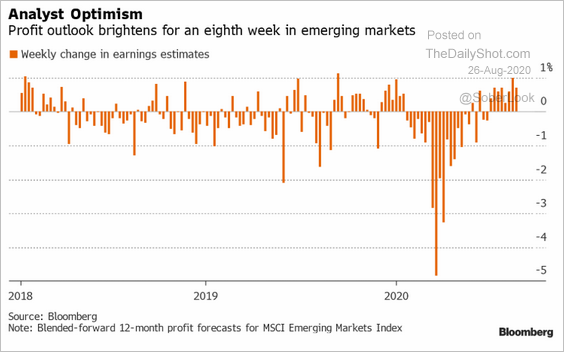
3. EM stocks are now flat on the year as analysts boost their earnings estimates.
 Source: @SriniSivabalan, @TheTerminal, Bloomberg Finance L.P.
Commodities
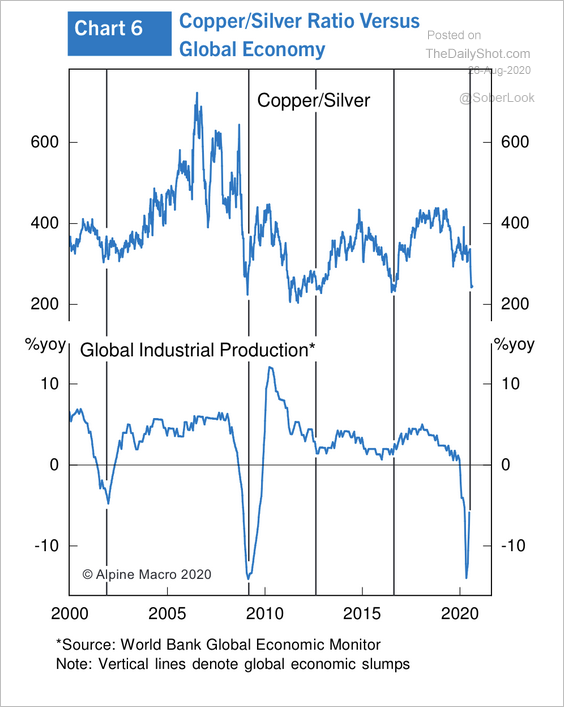
1. The copper/silver ratio has not recovered despite the rise in global industrial production.
 Source: Alpine Macro
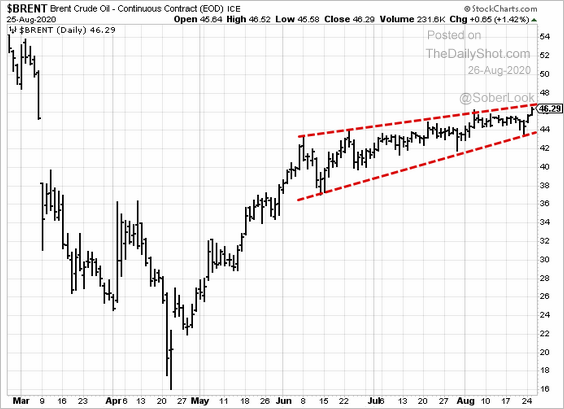
2. Crude oil is showing signs of life.
Equities
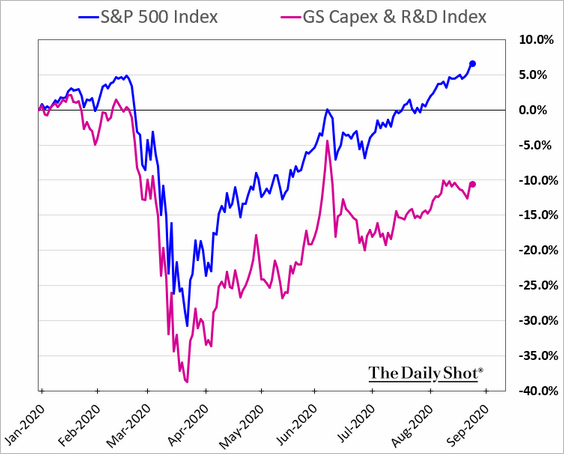
1. Focus on CapEx and R&D hasn’t helped performance this year.
2. The spike in the US forward P/E ratio has been extraordinary. Here is a comparison with global stocks.
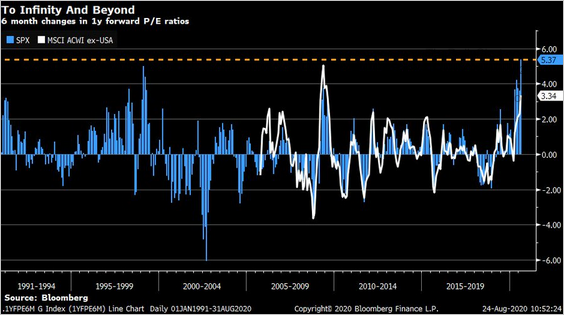 Source: @LizAnnSonders, @Bloomberg, Bloomberg Finance L.P.
3. Adjusted for the US output gap, share valuations look reasonable.
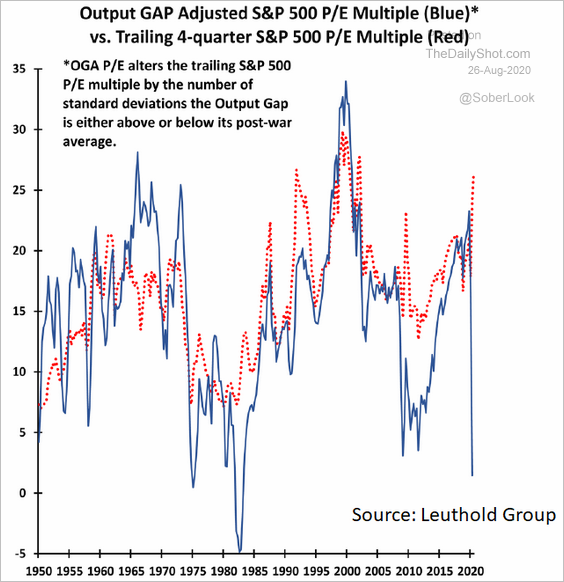 Source: Leuthold Group, @markets Read full article
4. Over the long run, “cheap” stocks tend to outperform “expensive” stocks.
 Source: FactorResearch
5. Companies are benefitting from massive cost reductions this year.
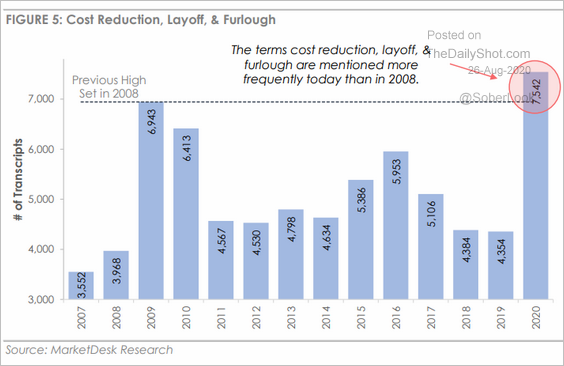 Source: MarketDesk Research
6. Goldman expects corporate profits to rebound with US economic growth.
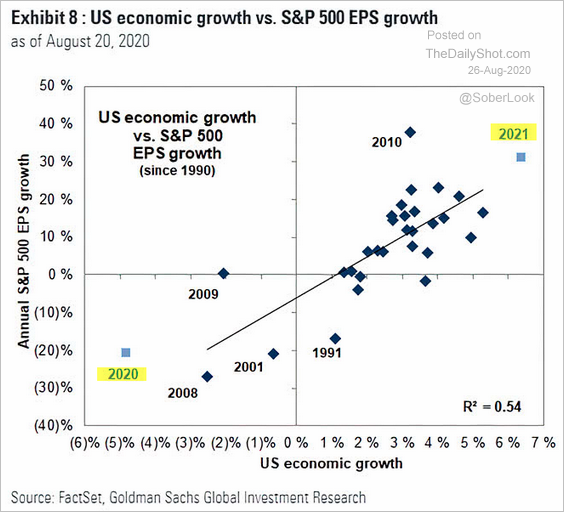 Source: @ISABELNET_SA, @GoldmanSachs Read full article
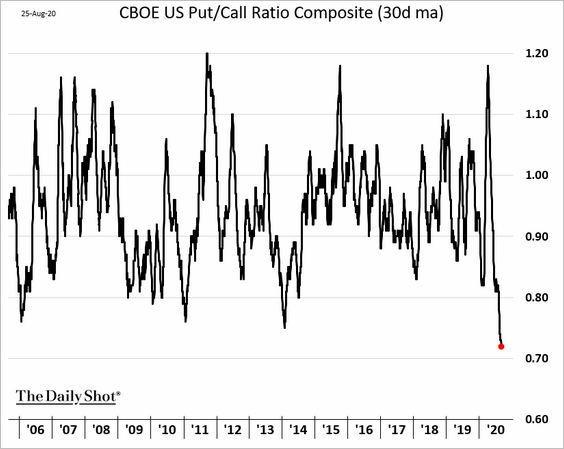
7. Nothing to see here. Let’s move on …
8. US share prices have diverged sharply from consumer confidence.
• The S&P 500:
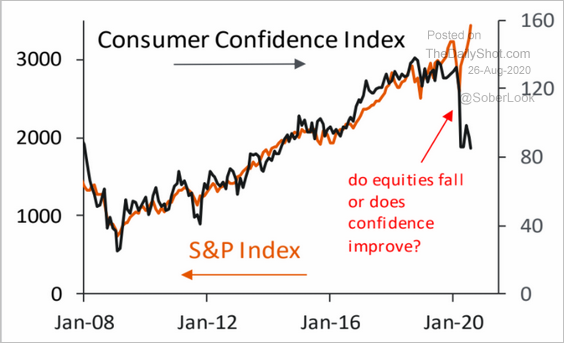 Source: Piper Sandler
• The US market cap/GDP ratio:
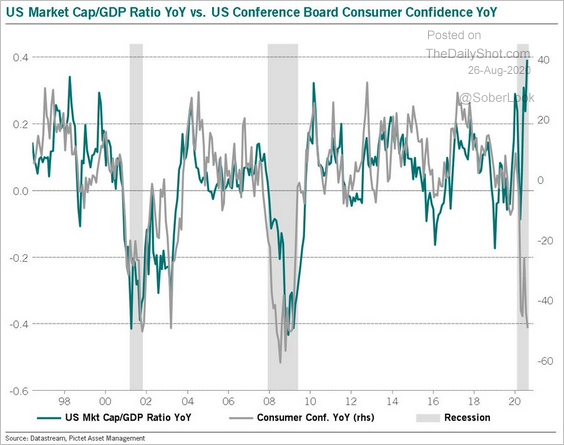 Source: @BittelJulien
——————–
9. Here’s the typical path for the S&P 500 if the incumbent party wins or loses.
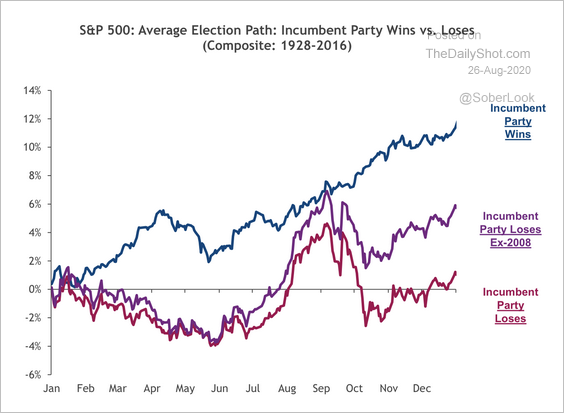 Source: SunTrust Private Wealth Management
The third year of the US election cycle tends to be the strongest for the S&P 500.
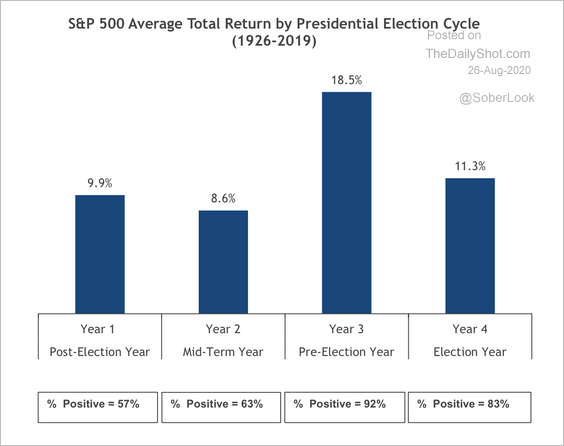 Source: SunTrust Private Wealth Management
Separately, “green” energy shares have been outperforming.
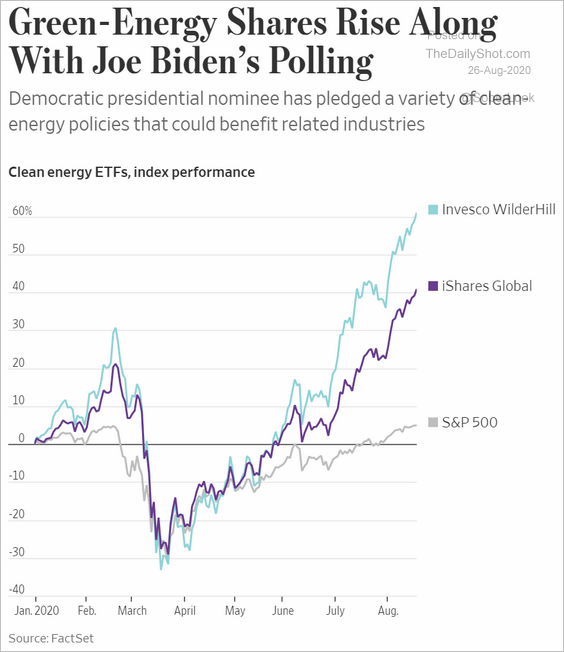 Source: @WSJ Read full article
Alternatives
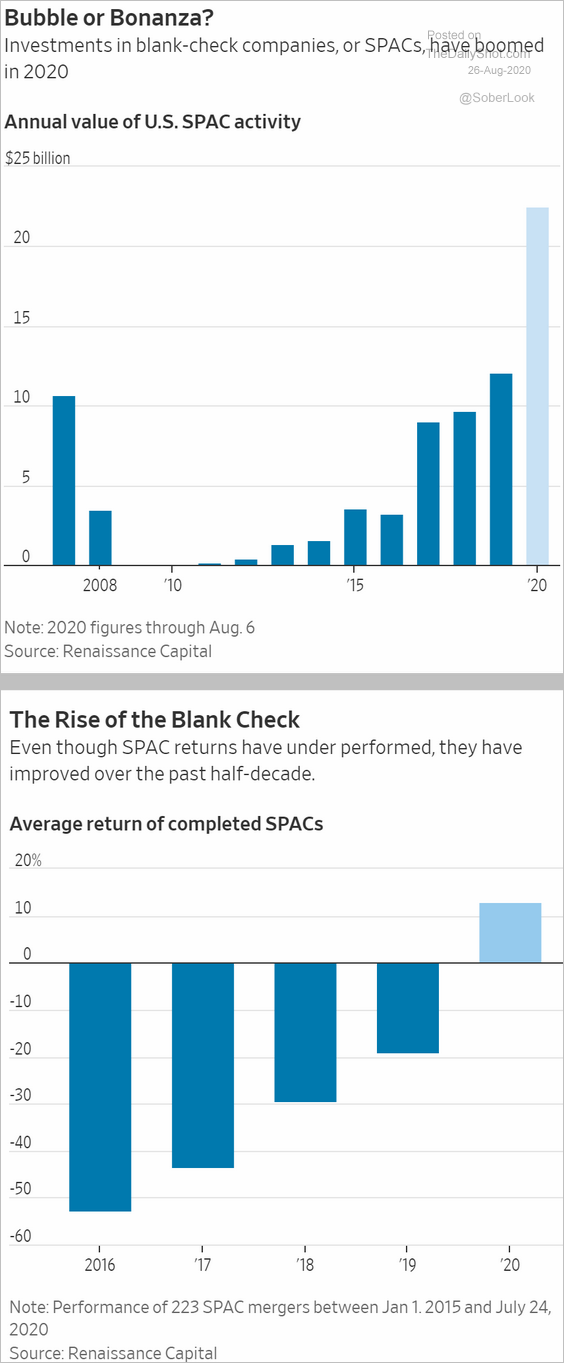
1. SPAC IPO and M&A activity has been unprecedented.
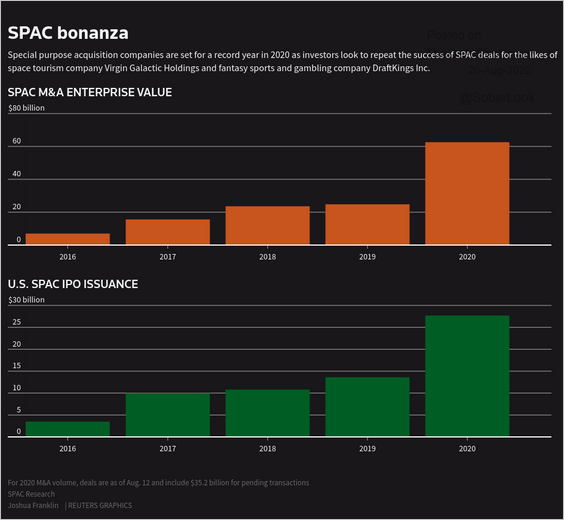 Source: Reuters Read full article
 Source: @WSJ Read full article
——————–
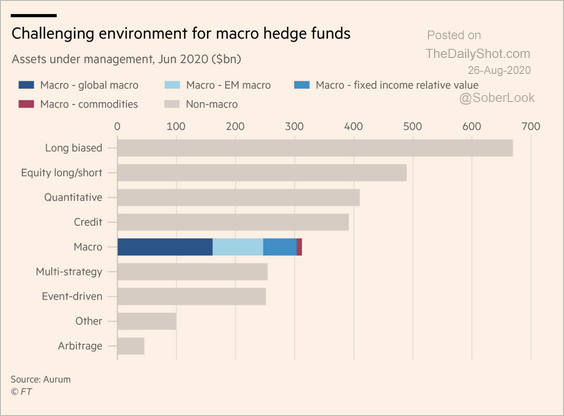
2. It’s been a tough environment for macro hedge funds. Below the AUM by category.
 Source: @financialtimes Read full article
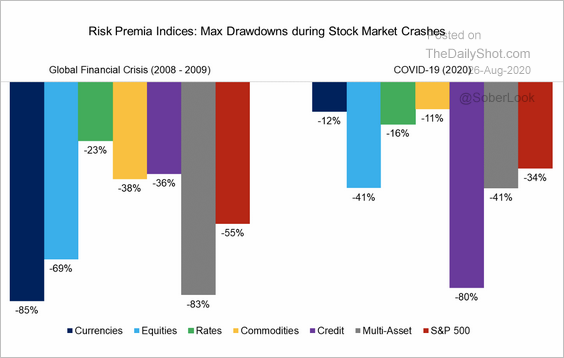
3. This chart shows the maximum drawdowns of risk premia strategies during the financial crisis and COVID-19.
 Source: Factor Research
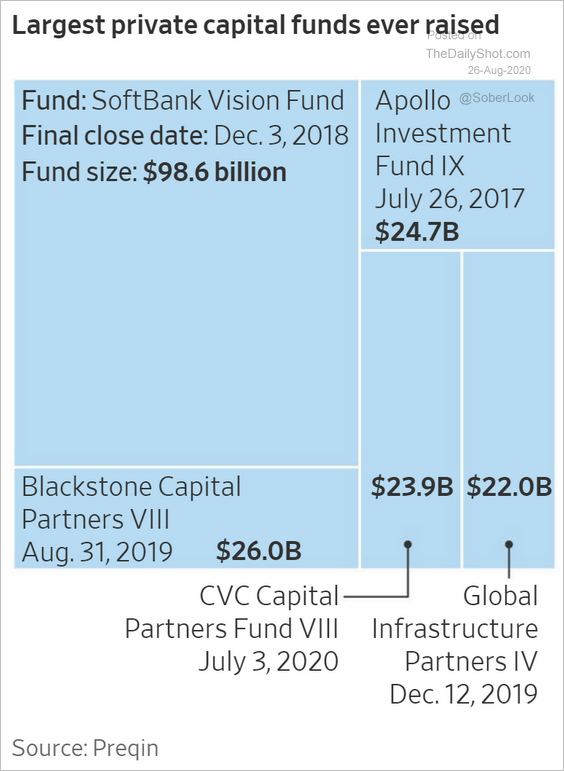
4. Here are the largest private capital funds ever raised.
 Source: @WSJ Read full article
5. Private-equity-backed middle-market loan volume tumbled last quarter (unfortunately, the x-axis on this chart is reversed).
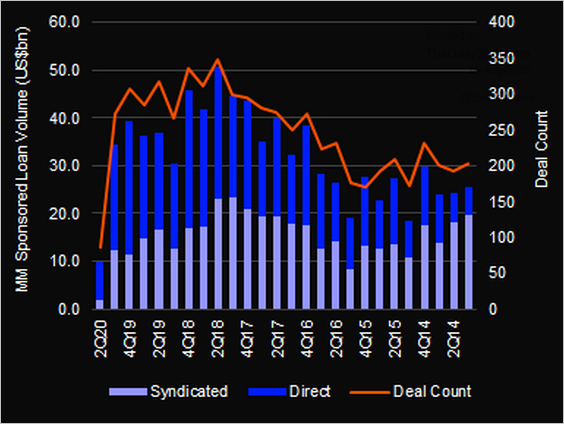 Source: @LPCLoans
6. Next, we have some updates on venture capital.
• European VC deal volume …
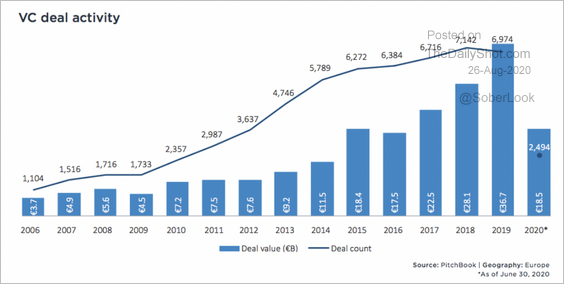 Source: PitchBook
… and deal size:
 Source: PitchBook
 Source: PitchBook
• US seed and late-stage deal value:
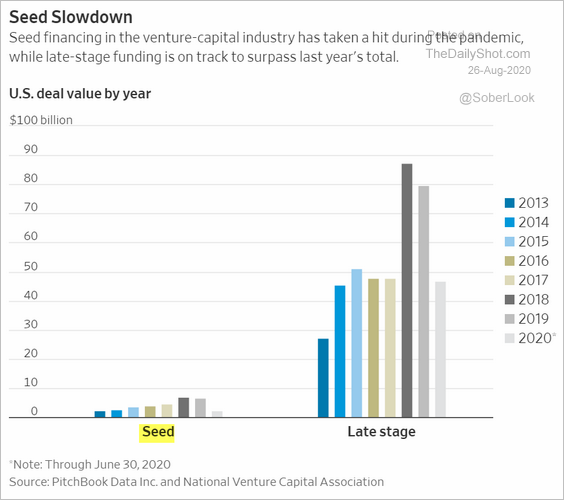 Source: @WSJ Read full article
Rates
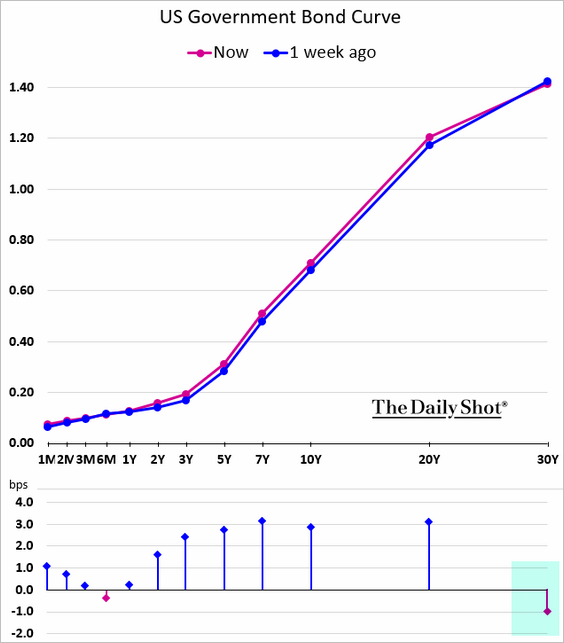
1. Despite concerns about inflation, demand for the long bond has been robust.
2. Budget deficits are associated with a steeper yield curve.
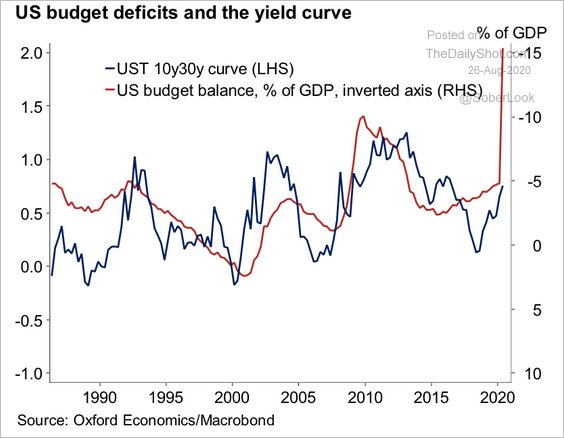 Source: Oxford Economics
3. With the correlation between the S&P 500 and Treasury yields breaking down, the bond market is no longer a good hedge for stocks.
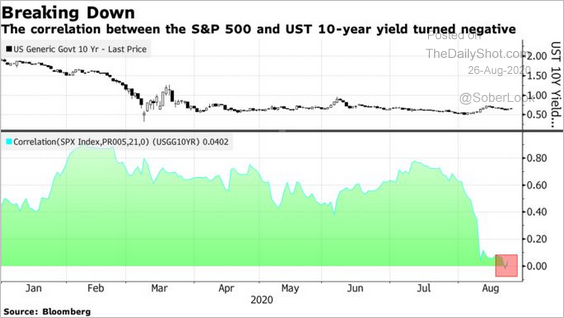 Source: @markets Read full article
4. The relationship between equity implied volatility (VIX) and the Treasury market equivalent (MOVE) has shifted since the crisis.
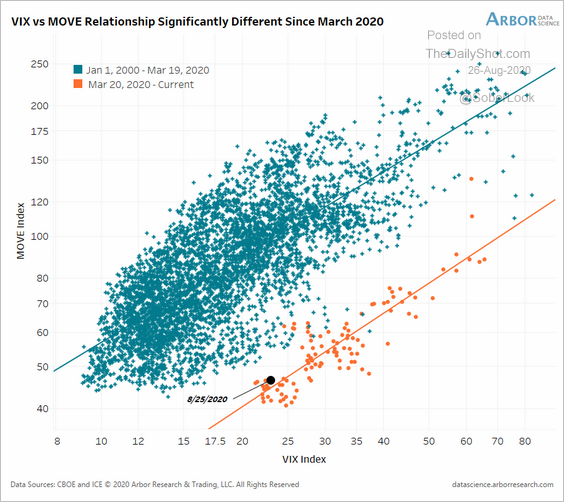 Source: @benbreitholtz
5. Should market participants consider Ameribor rather than SOFR as an alternative to LIBOR? Ameribor is a better benchmark of borrowing costs for smaller banks.
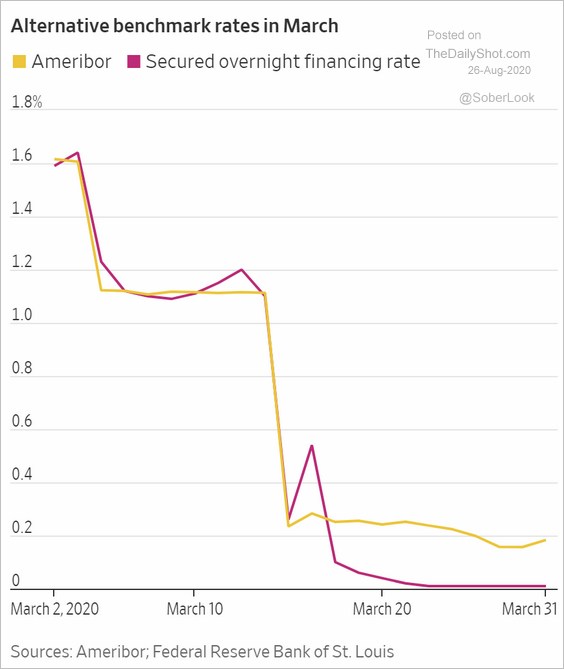 Source: @WSJ Read full article
Global Developments
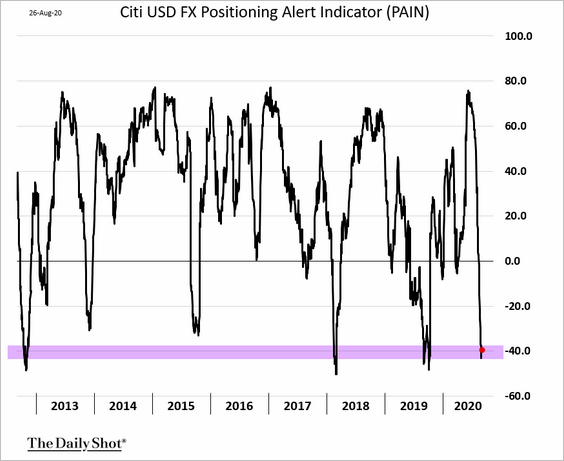
1. Active F/X traders are betting against the US dollar.
2. Global trade is starting to recover.
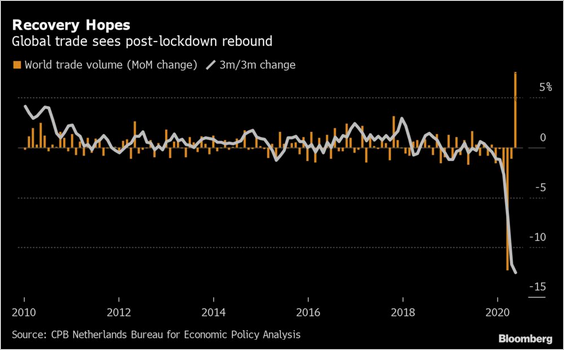 Source: @markets Read full article
3. Here are the projected 2020 GDP changes for select economies.
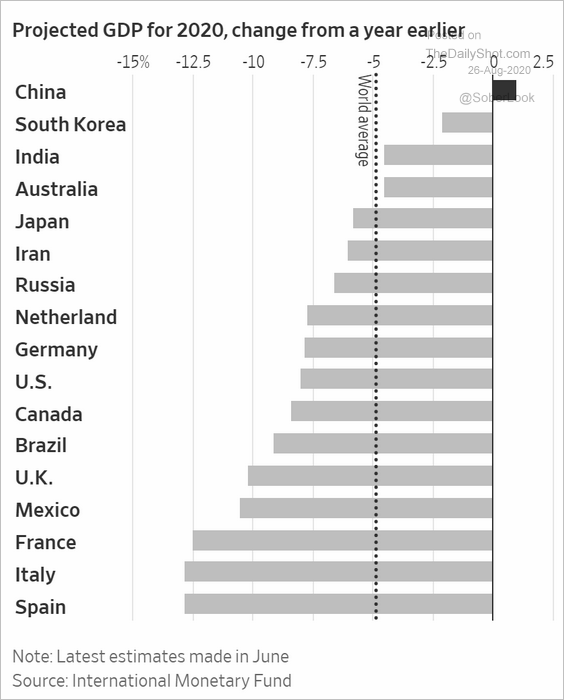 Source: @WSJ Read full article
And this chart shows Bank of America’s projections.
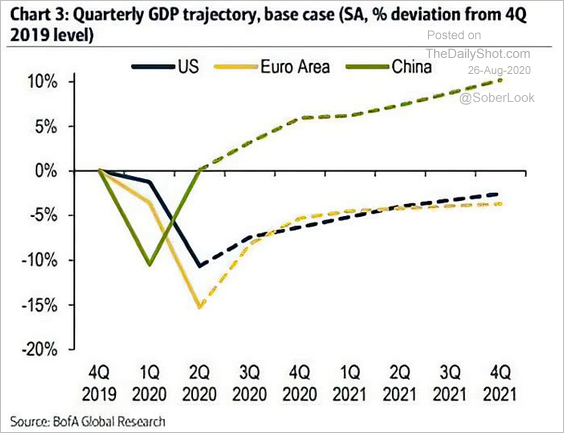 Source: @ISABELNET_SA, @BofAML Read full article
——————–
4. How stringent were the lockdowns in different countries?
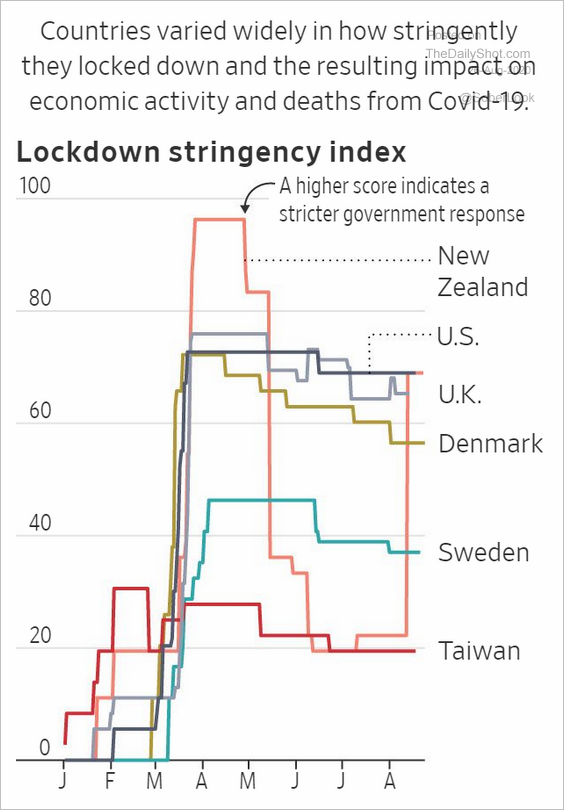 Source: @WSJ Read full article
5. The UK and US business activity indicators have pulled ahead.
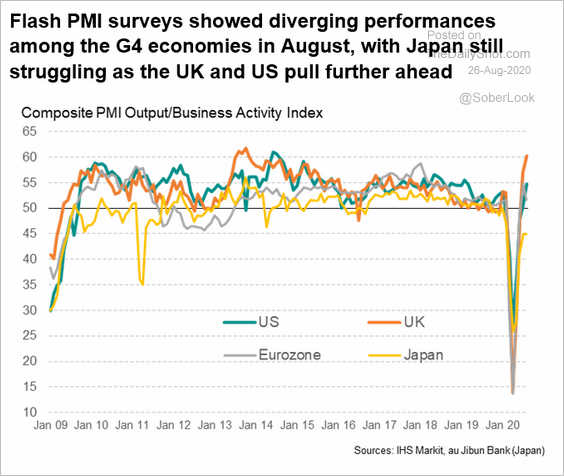 Source: @IHSMarkitPMI Read full article
——————–
Food for Thought
1. Electric vehicle market share by country:
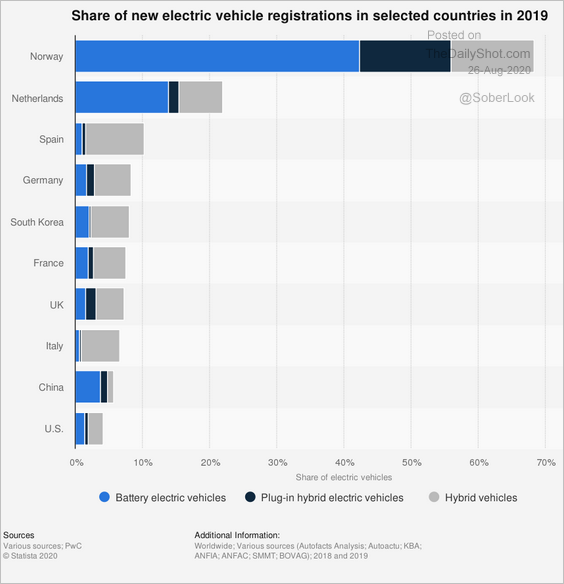 Source: Statista
2. How long does it take to sell a used Tesla?
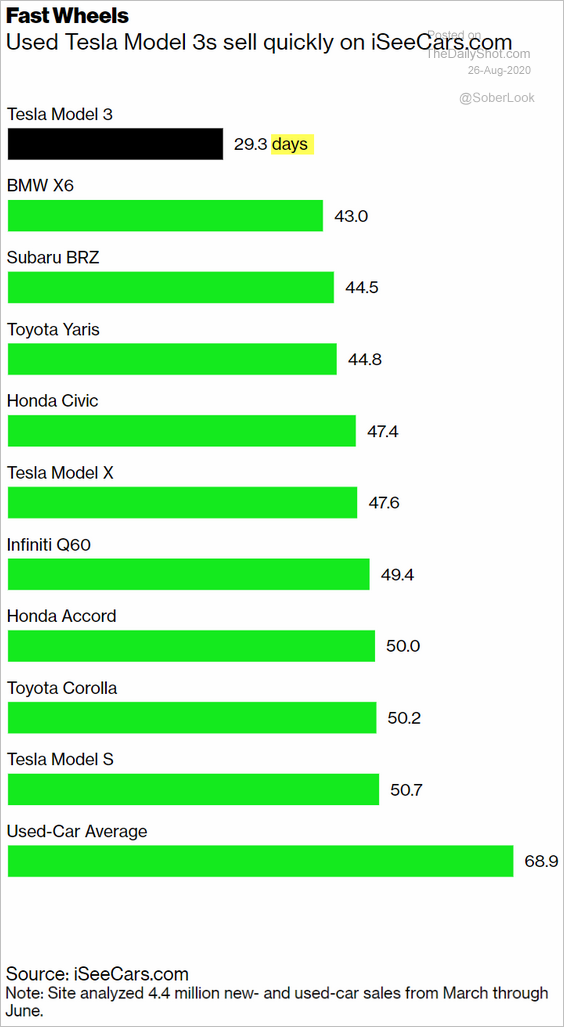 Source: @business Read full article
3. US vehicle miles traveled:
 Source: @WSJ Read full article
4. Apple’s market dominance …
 Source: @adam_tooze, @FT Read full article
… and the road to a $2 trillion valuation.
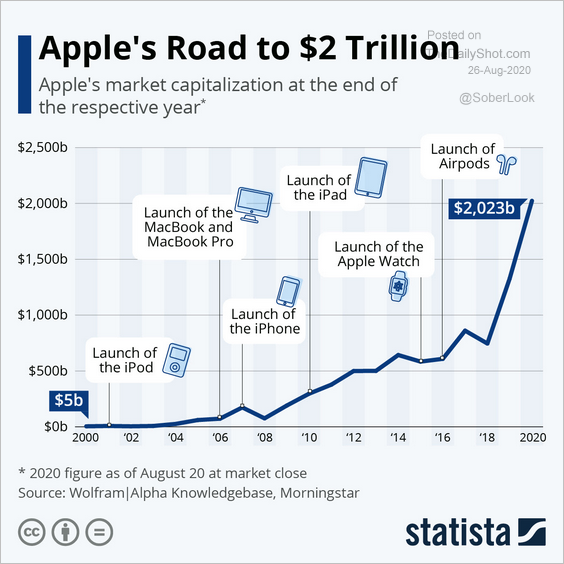 Source: Statista
——————–
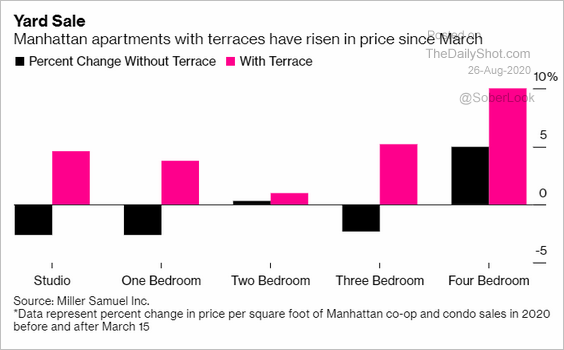
5. Paying more for outdoor space in Manhattan:
 Source: @luxury Read full article
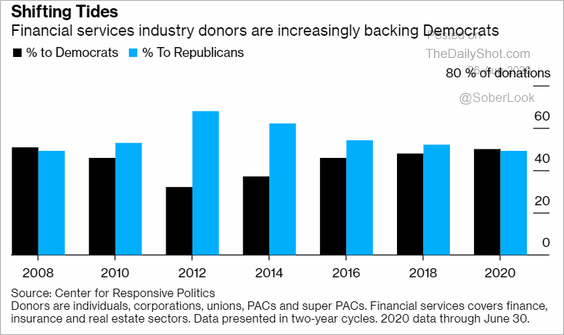
6. Political donations in financial services:
 Source: @bpolitics Read full article
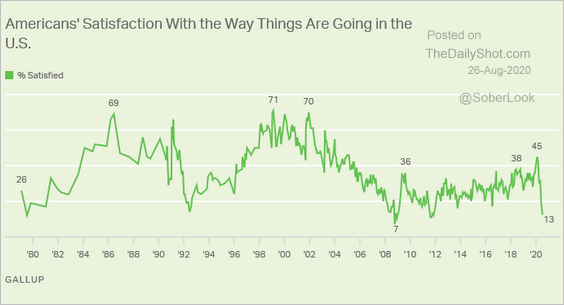
7. Satisfaction with the US:
 Source: Gallup Read full article
8. Concerns about foreign governments influencing the US 2020 election:
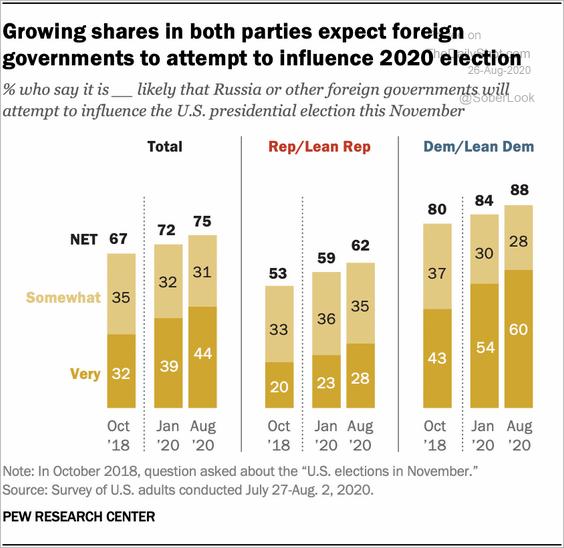 Source: @mpiccorossi Read full article
9. The worst attraction in each state:
 Source: @mattsurely
——————–