The Daily Shot: 27-Aug-20
• The United States
• The United Kingdom
• Europe
• Japan
• Asia-Pacific
• China
• Emerging Markets
• Energy
• Equities
• Credit
• Rates
• Food for Thought
The United States
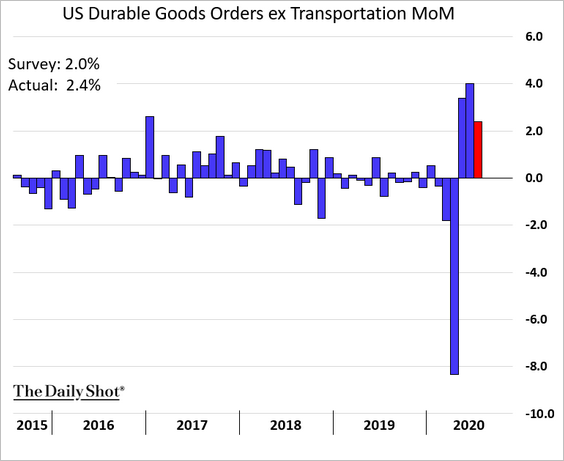
1. Durable goods orders continued to recover last month.
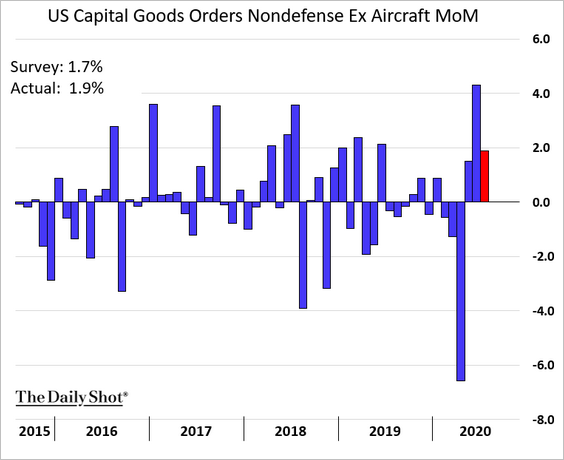
The rebound in capital goods orders suggests that CapEx is improving.
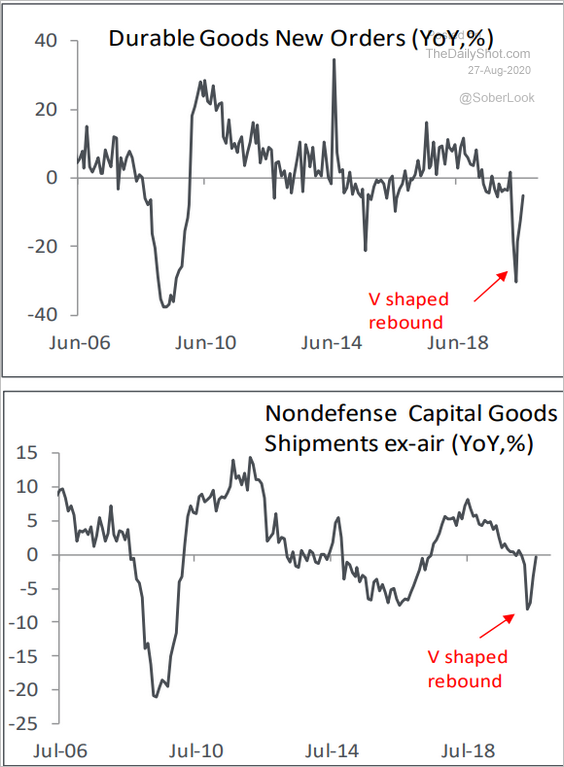
Below are the year-over-year trends.
 Source: Piper Sandler
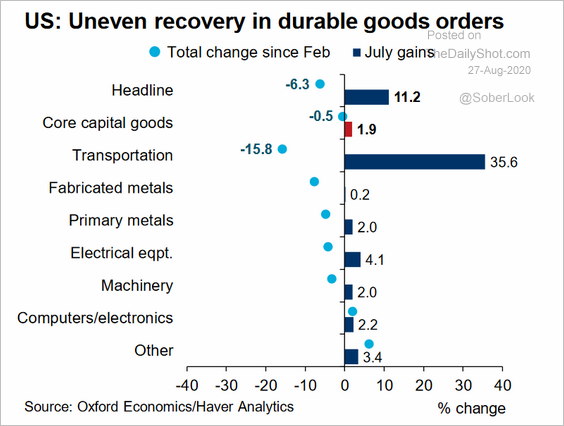
The durable goods orders recovery has been uneven across sectors.
 Source: @GregDaco
——————–
2. Mortgage applications remain elevated.
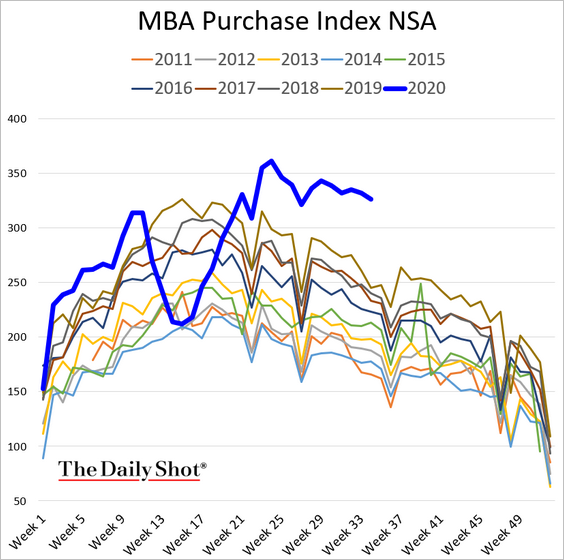
3. According to JP Morgan, credit/debit card spending hasn’t been significantly impacted by the loss of unemployment benefits.
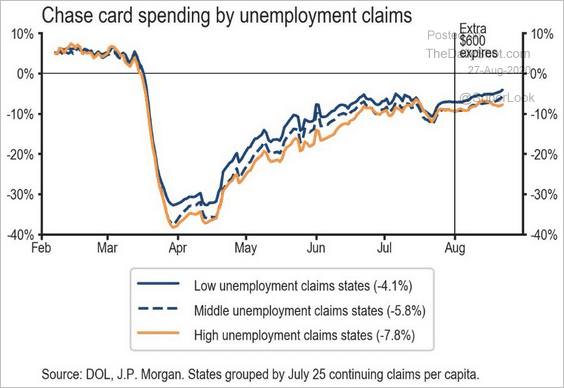 Source: JP Morgan, @carlquintanilla
However, the situation could change if there is no additional stimulus after the White House program ($300/week) expires.
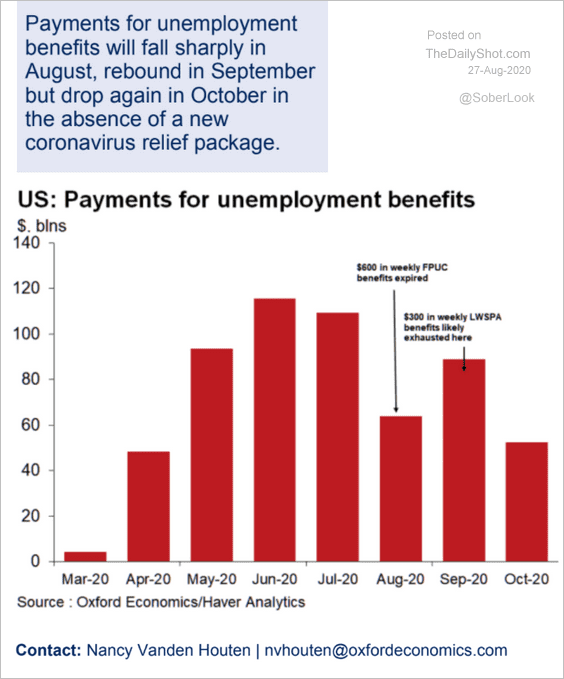 Source: Oxford Economics
——————–
4. Spending at restaurants and bars remains well below pre-crisis levels.
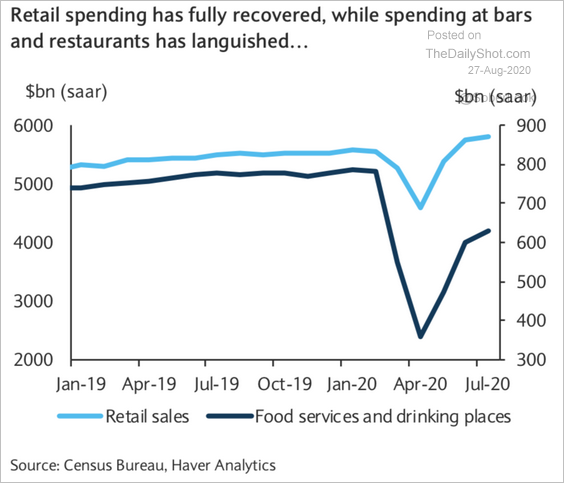 Source: Barclays Research
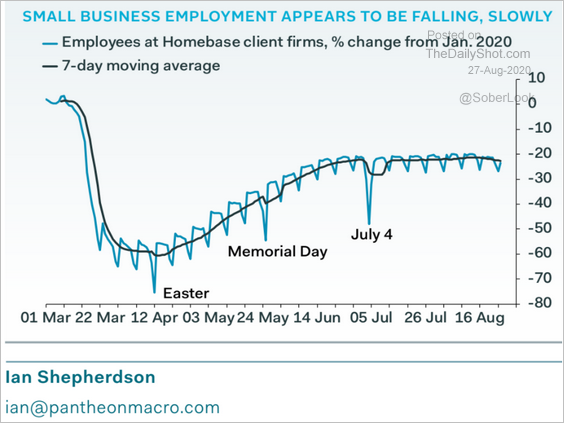
5. Small business employment remains soft.
 Source: Pantheon Macroeconomics
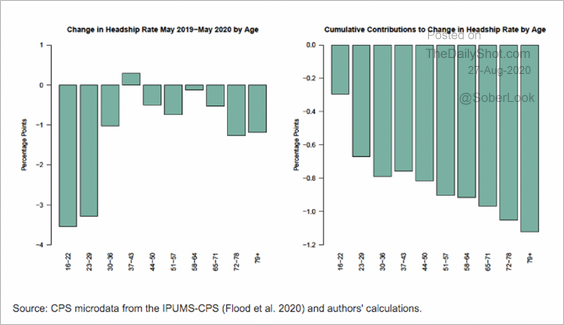
6. Hardship rates among younger Americans have declined over the past year, suggesting that many have moved back in with their parents.
 Source: Federal Reserve
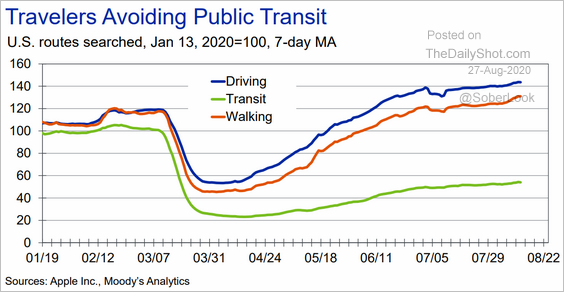
7. Americans continue to avoid public transportation.
 Source: Moody’s Analytics
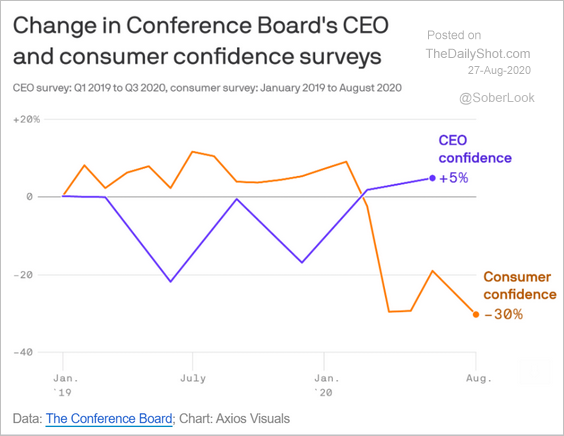
8. CEO and consumer confidence trends have diverged.
 Source: @axios Read full article
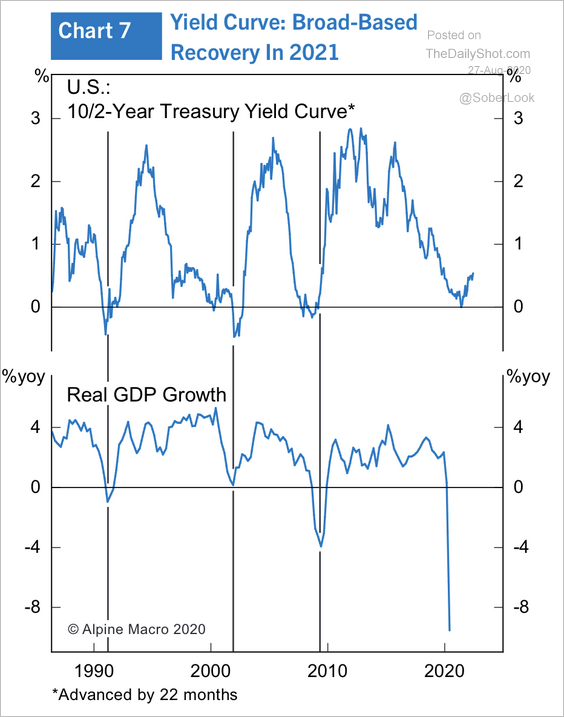
9. The yield curve has steepened this year, which points to a rebound in the GDP in 2021.
 Source: Alpine Macro
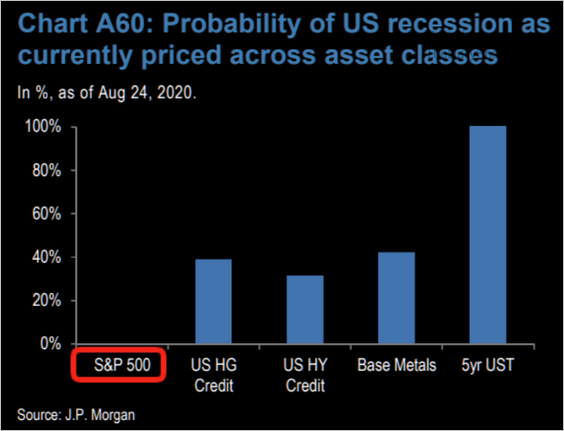
Stock prices are telling us that the US is out of recession, according to JP Morgan. Other markets are less upbeat.
 Source: JP Morgan, @TheMarketEar
——————–
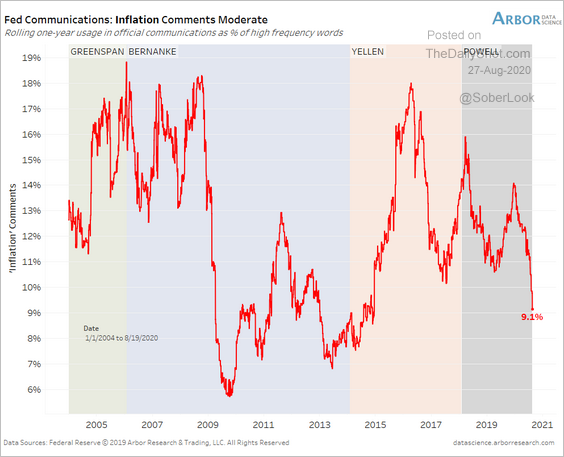
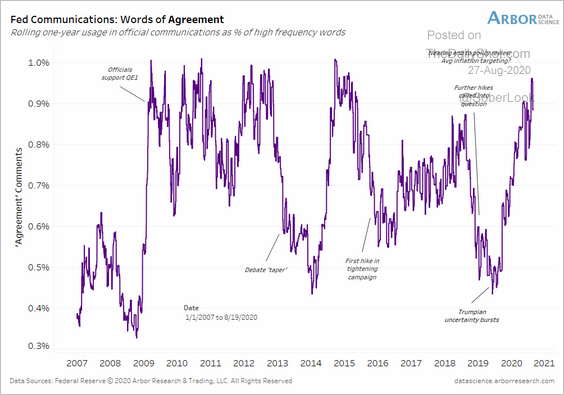
10. Inflation-related comments from the Fed have moderated this year.
 Source: Arbor Research & Trading
The markets are betting that the Fed will shift to a more accommodative approach to dealing with inflation.
 Source: MarketWatch Read full article
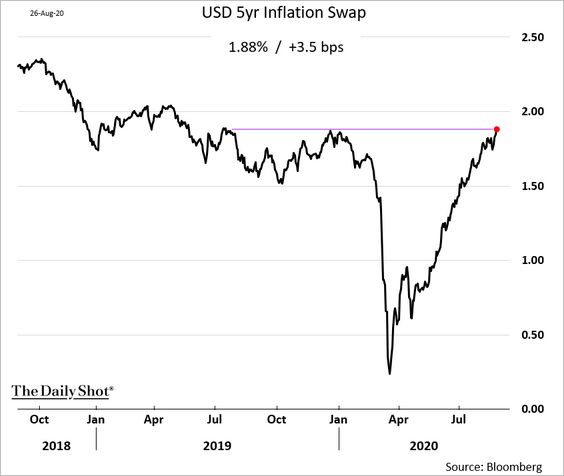
Market-based inflation expectations have now recovered to pre-crisis levels.
The United Kingdom
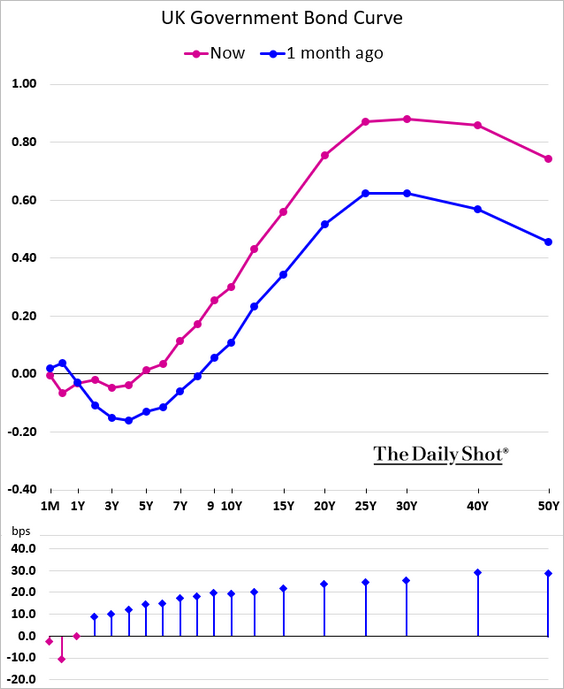
1. The yield curve continues to steepen.
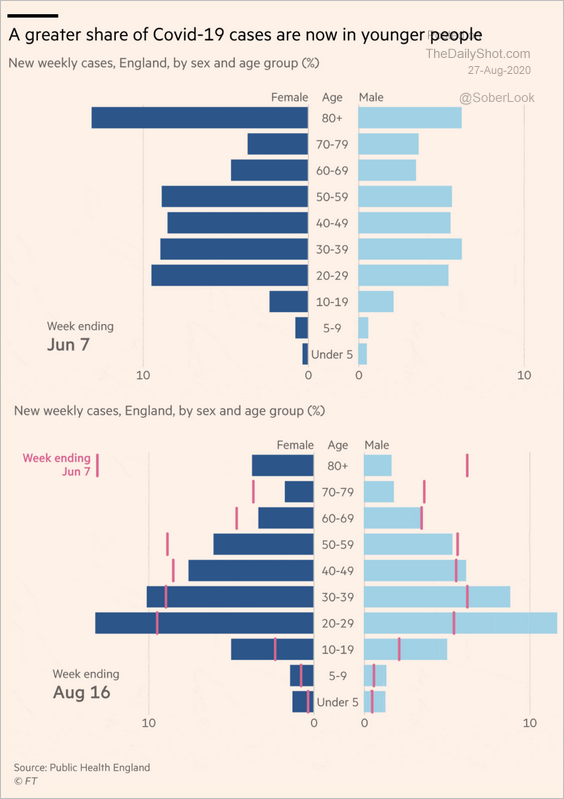
2. COVID infection rates have shifted toward younger people.
 Source: @financialtimes Read full article
Europe
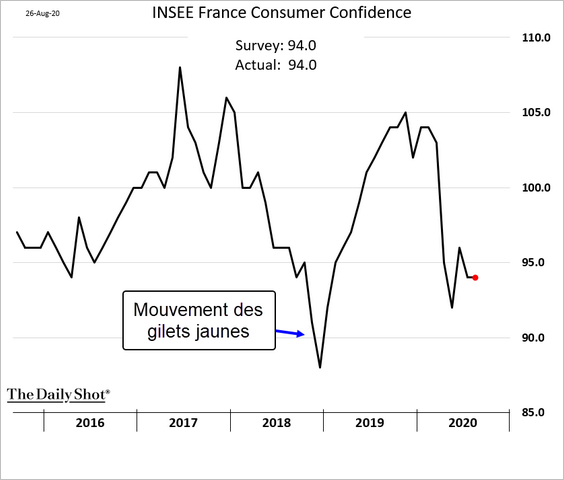
1. French consumer confidence remains stable.
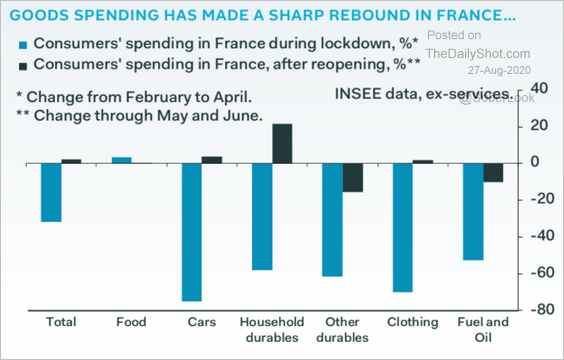
Goods spending in France has rebounded.
 Source: Pantheon Macroeconomics
——————–
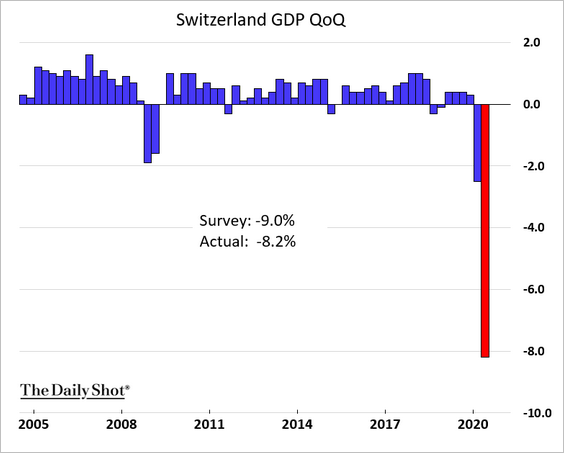
2. The Swiss Q2 GDP decline was a bit less severe than expected.
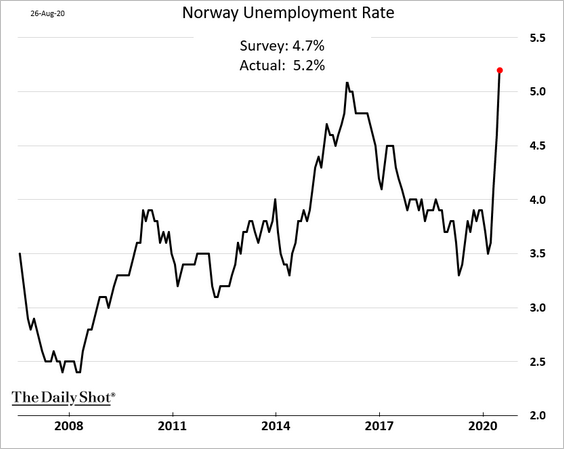
3. Norway’s unemployment rate hit a multi-year high.
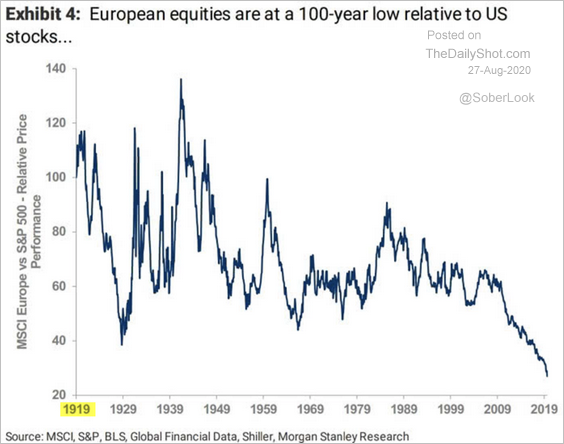
4. European equities are at a 100-year low versus US equities.
 Source: Goldman Sachs
Japan
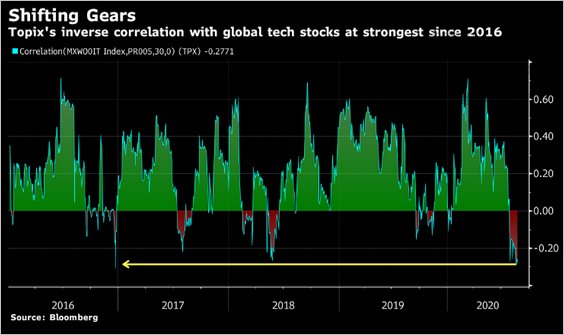
1. Japan’s shares have been inversely correlated with global tech.
 Source: @shoko_oda, @TheTerminal, Bloomberg Finance L.P.
As a result, the nation’s stock market performance has lagged global peers. But Japan’s shares are set to benefit if the tech sector falls out of favor.
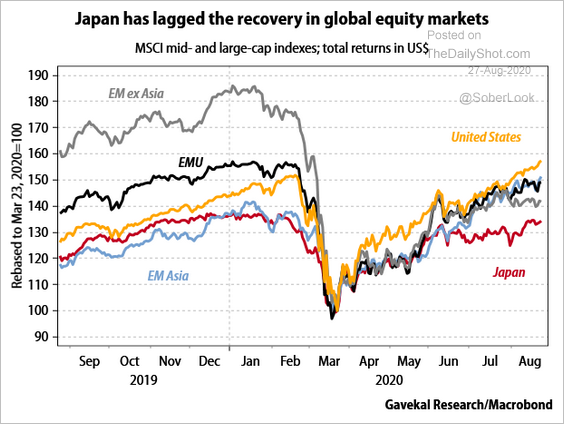 Source: Gavekal
——————–
2. According to Barclays Research, Japan’s households “face a slide in disposable income due to the fading effect of fiscal support (cash handouts, for instance, represented 2.3% of GDP) as well as falling wages.”
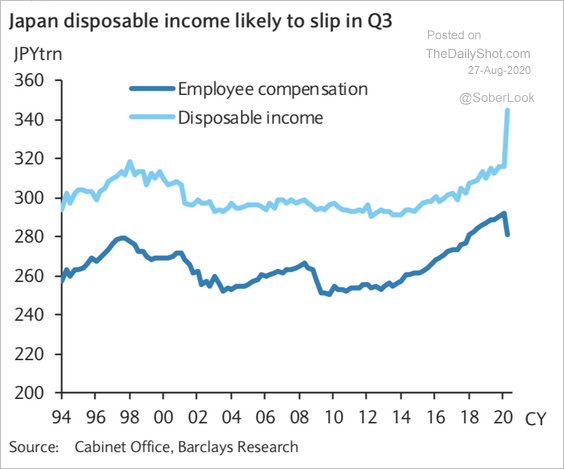 Source: Barclays Research
3. Japan’s tourism business has collapsed.
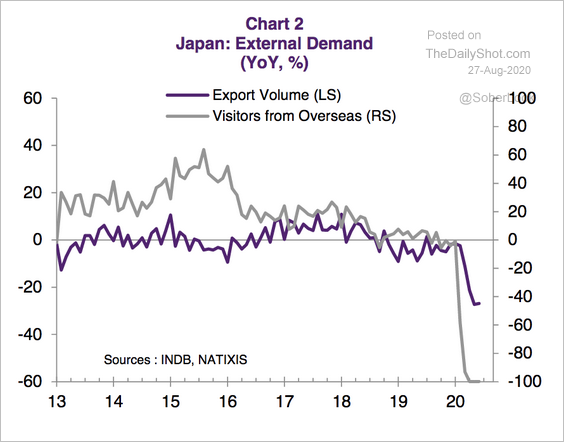 Source: Natixis
Asia-Pacific
1. Singapore is in recession, as industrial production continues to shrink.
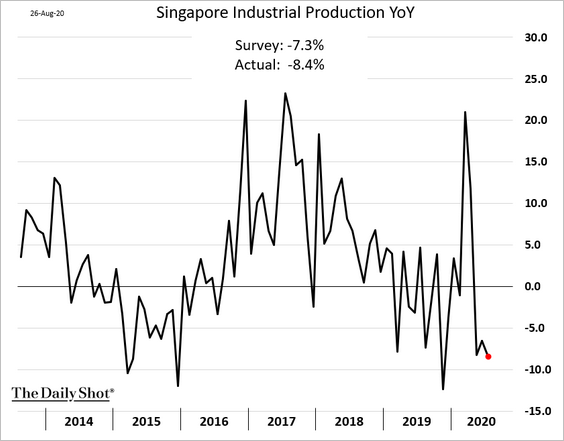
 Source: @markets Read full article
——————–
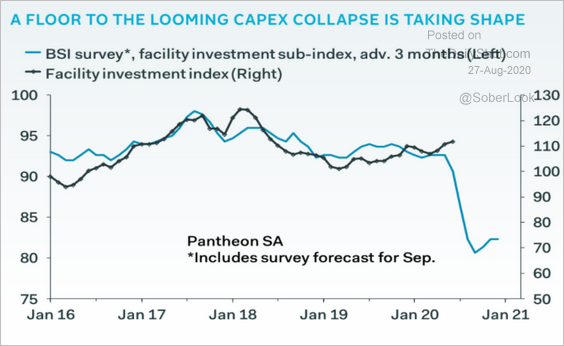
2. South Korea’s CapEx appears to be bottoming.
 Source: Pantheon Macroeconomics
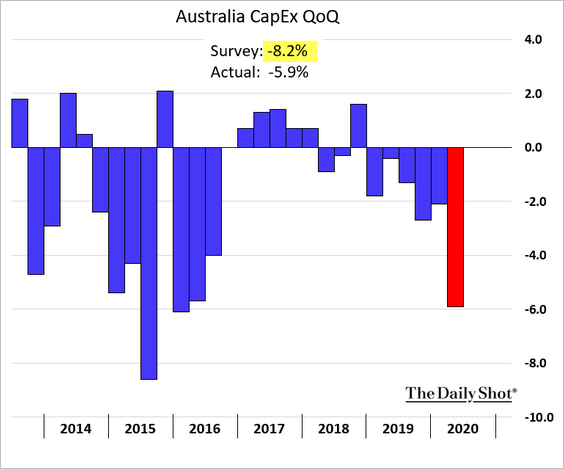
3. The Q2 decline in Australia’s CapEx wasn’t nearly as severe as expected.
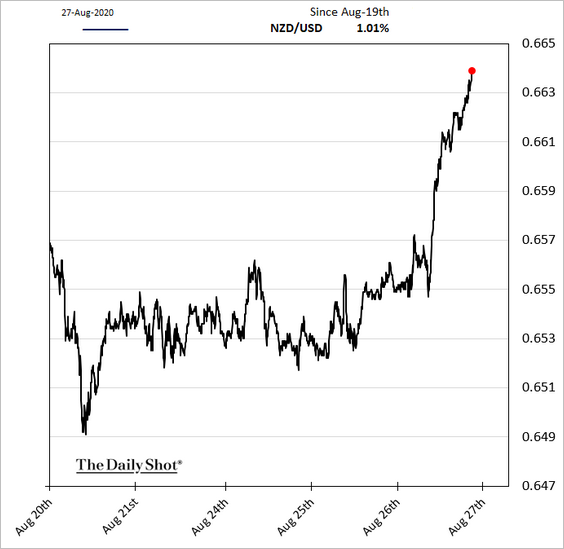
4. The Kiwi dollar rose sharply on short-covering and expectations for the Fed’s dovish inflation policy shift.
China
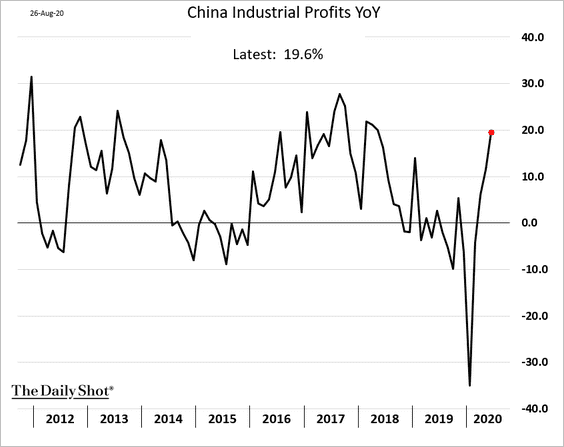
1. Growth in industrial profits has accelerated.
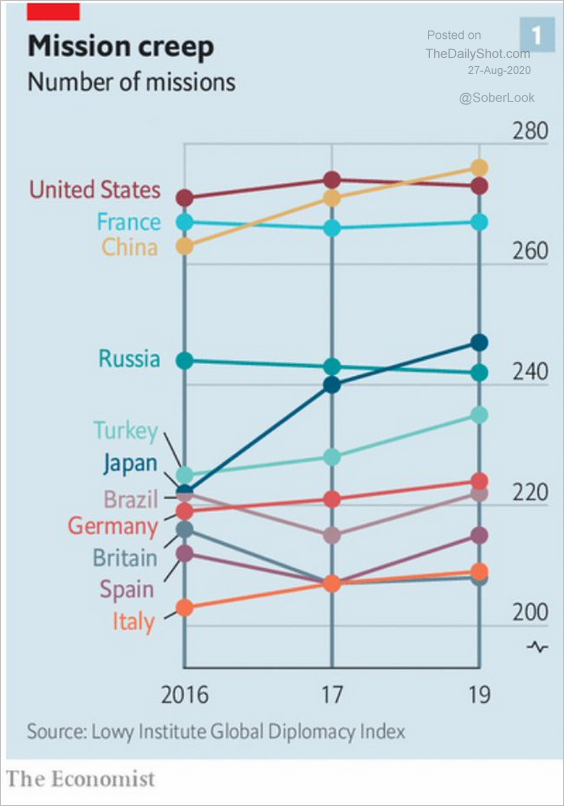
2. The number of China’s embassies has exceeded that of the US.
 Source: @adam_tooze, @LowyInstitute Read full article
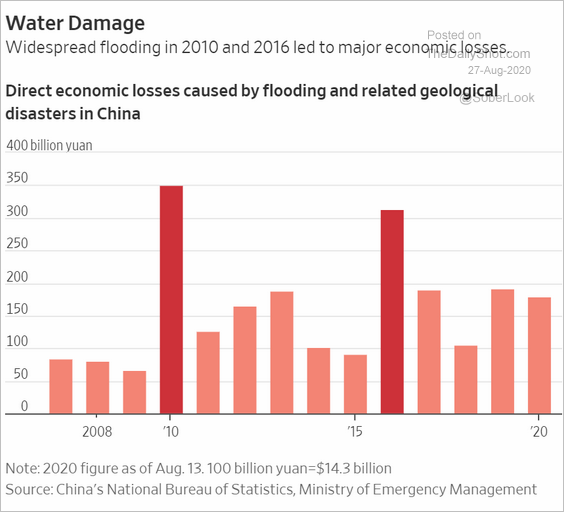
3. This chart shows the economic losses caused by flooding.
 Source: @WSJ Read full article
Emerging Markets
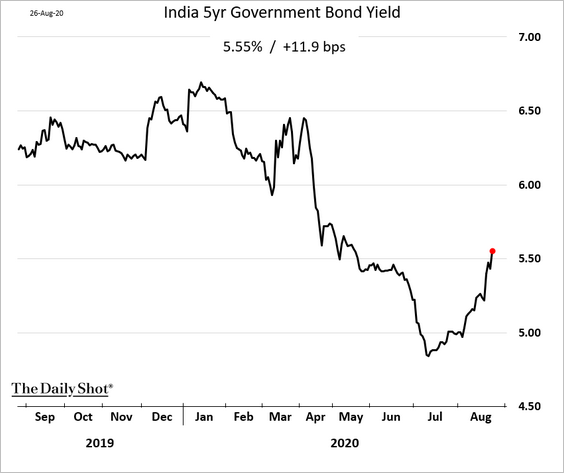
1. India’s bond yields keep climbing.
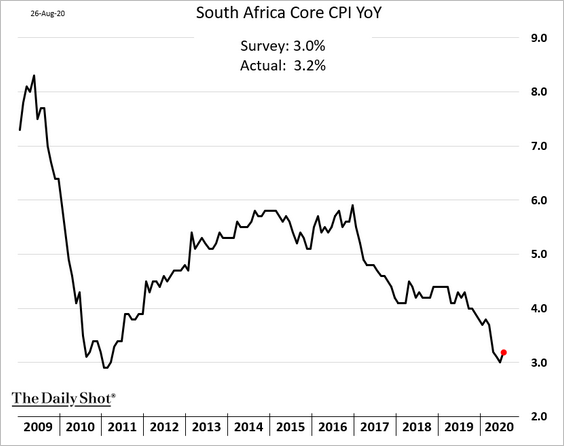
2. South Africa’s inflation has bottomed.
3. Saudi F/X reserves are at multi-year lows.
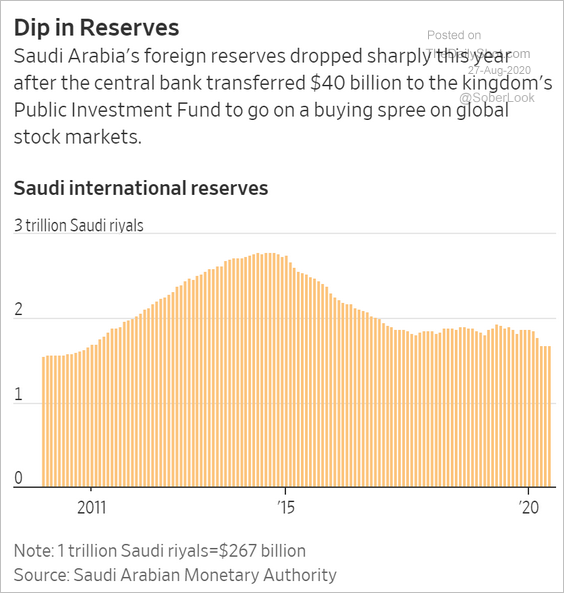 Source: @WSJ Read full article
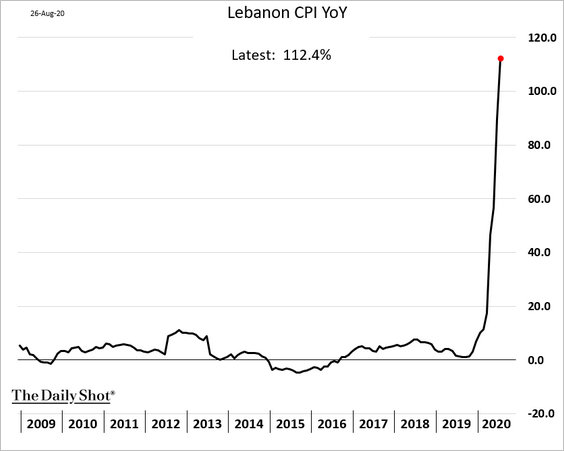
4. Lebanon’s hyperinflation is accelerating.
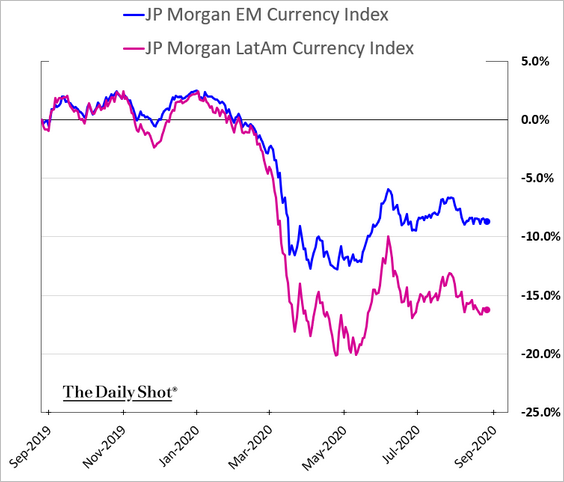
5. LatAm currencies continue to underperform.
6. This scatterplot shows EM (USD-denominated) government bond spreads vs. the Oxford Economics’ sovereign risk indicator.
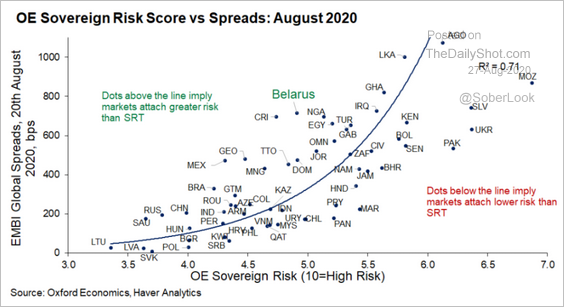 Source: Oxford Economics
Energy
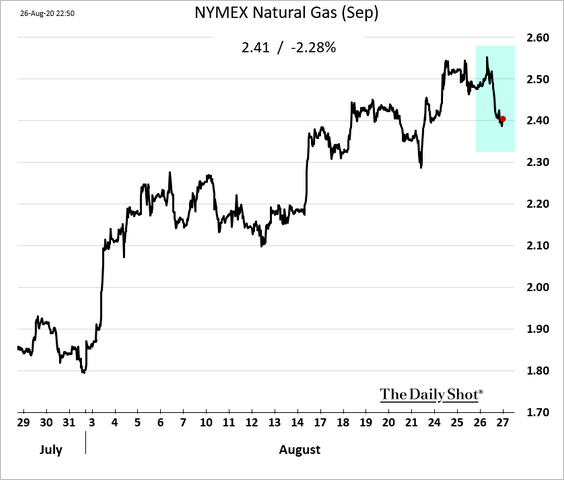
1. US energy markets don’t seem to be too concerned about the hurricane.
 Source: USC Read full article
Here is natural gas.
——————–
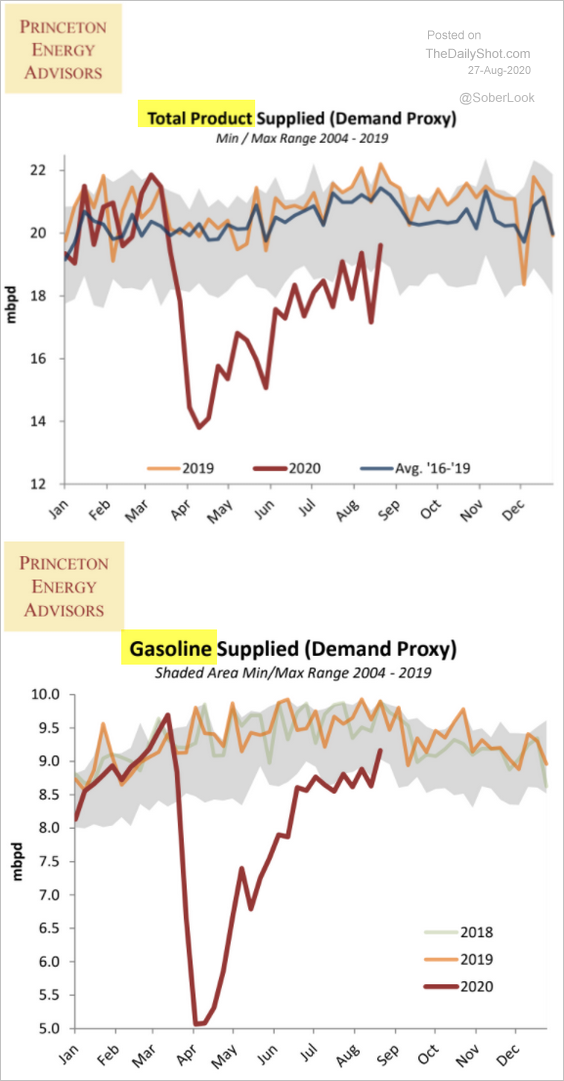
2. US gasoline demand has almost fully recovered.
 Source: Princeton Energy Advisors
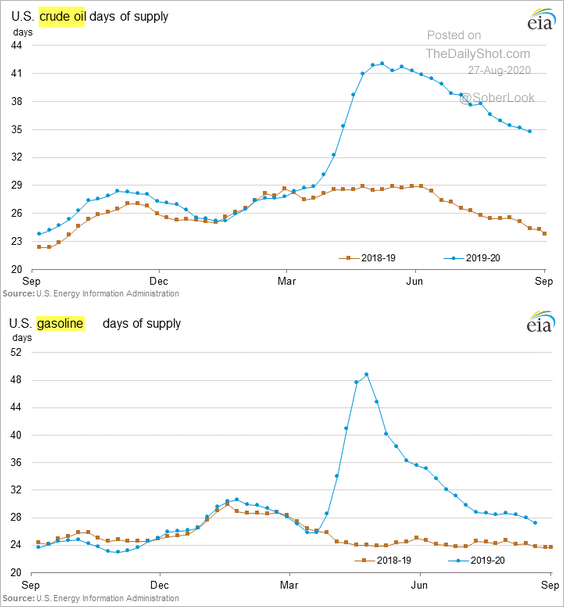
And gasoline inventories (measured in days of supply) are shrinking (second panel).
——————–
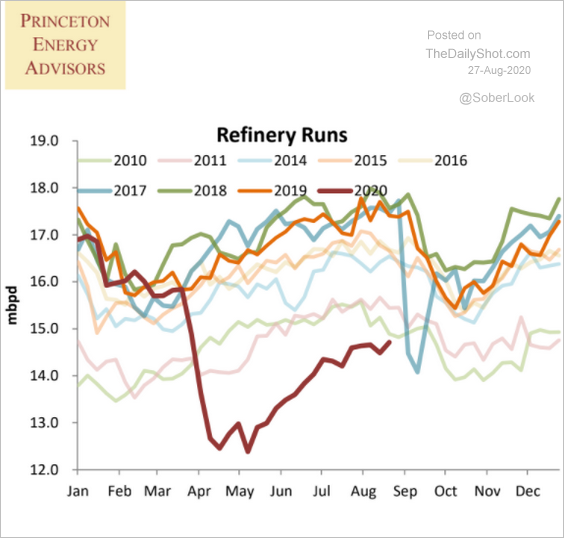
3. US refinery inputs are grinding higher.
 Source: Princeton Energy Advisors
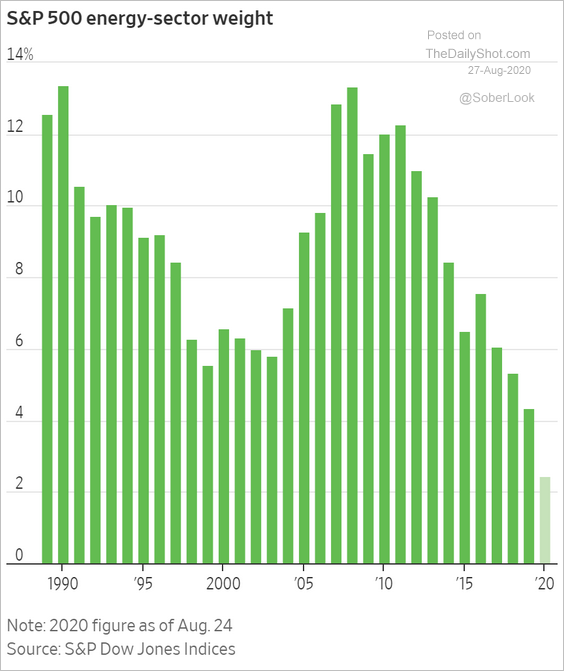
4. This chart shows the energy sector’s weight in the S&P 500.
 Source: @WSJ Read full article
Equities
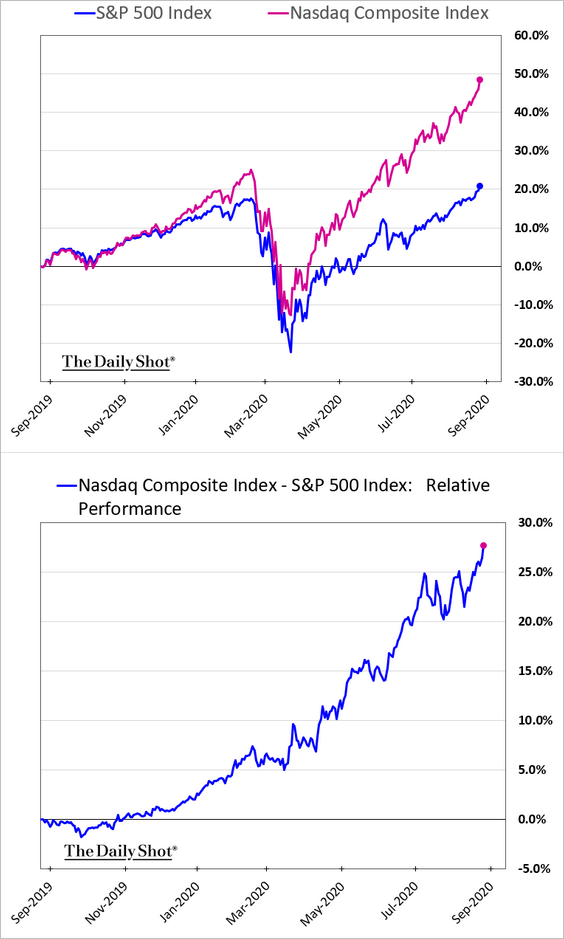
1. The outperformance of the Nasdaq Composite has been remarkable.
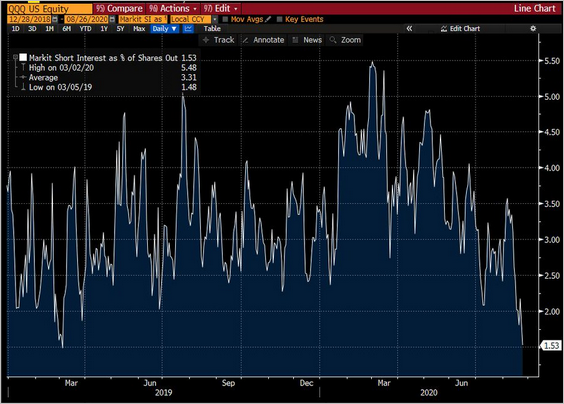
• This chart shows the short interest in QQQ (the Nasdaq 100 ETF).
 Source: @SarahPonczek
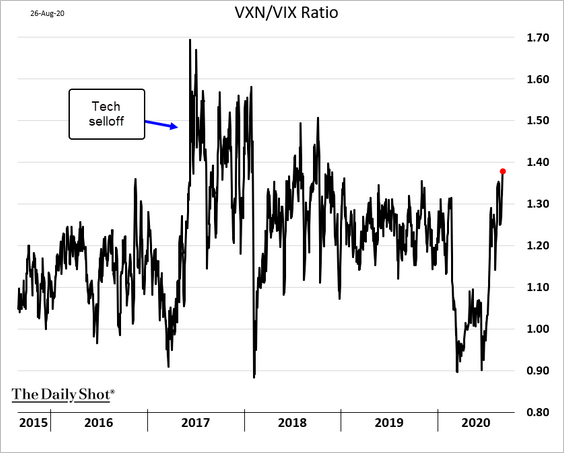
• The options markets are becoming more cautious on the Nasdaq 100, as the extraordinary rally continues. VXN is the VIX-equivalent for Nasdaq 100.
——————–
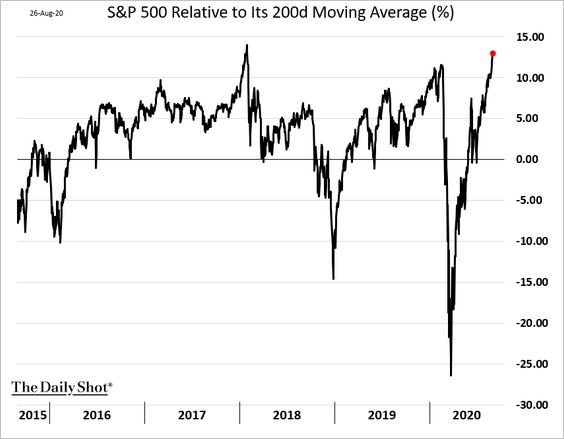
2. Here is the S&P 500 relative to its 200-day moving average.
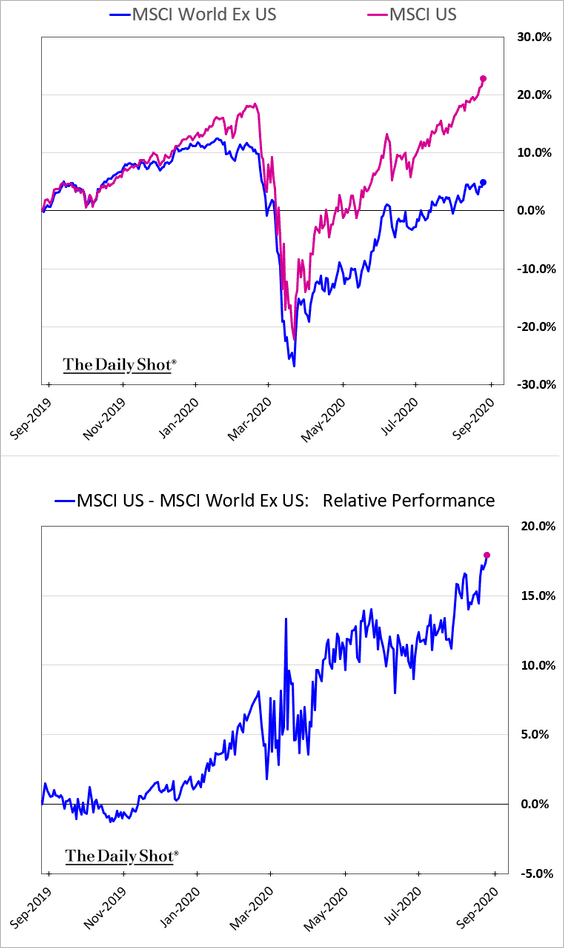
3. US shares continue to widen their gap vs. global peers.
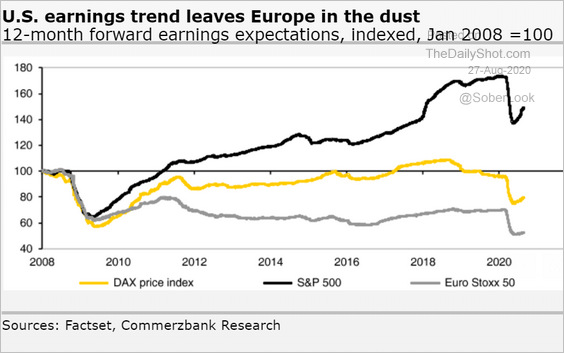
4. This chart shows the 12-month forward earnings expectations for the S&P 500 vs. European counterparts.
 Source: Commerzbank Research
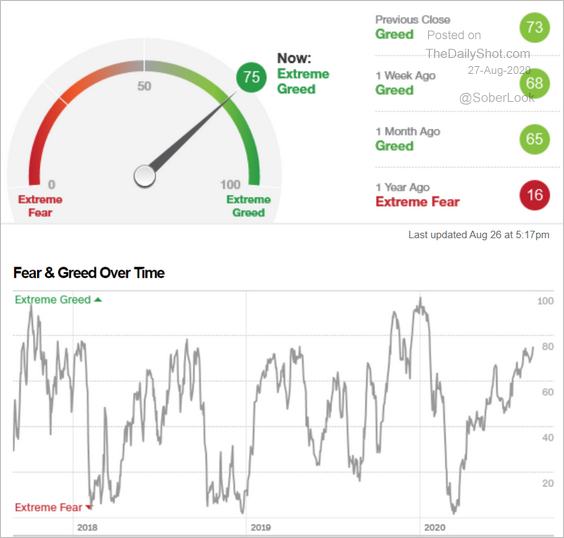
5. The CNN Fear/Greed indicator has moved into “extreme greed” territory but remains below the extremes we saw back in January.
 Source: CNN Business
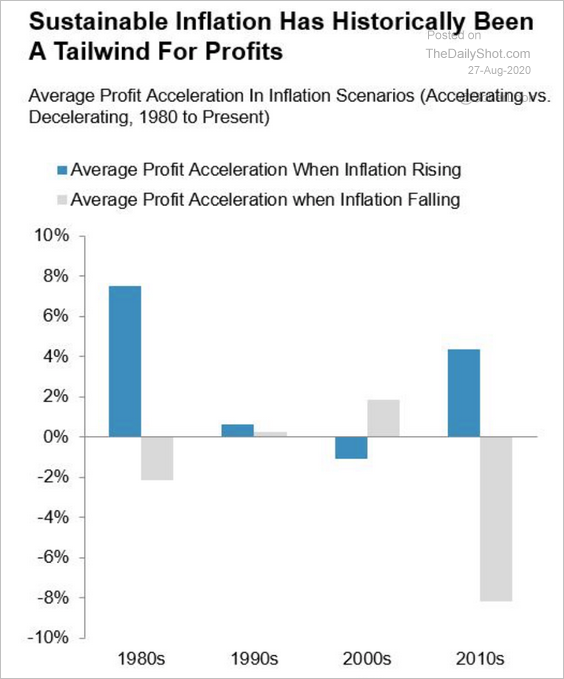
6. Historically, inflation growth has been good for corporate profits.
 Source: Denise Chisholm; Fidelity Investments
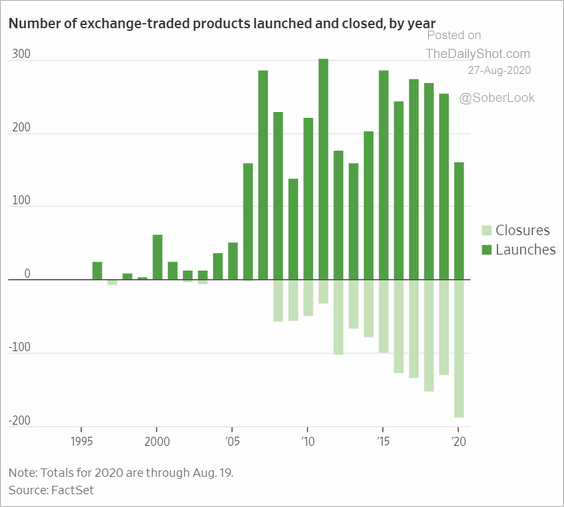
7. ETF closures accelerated this year.
 Source: @WSJ Read full article
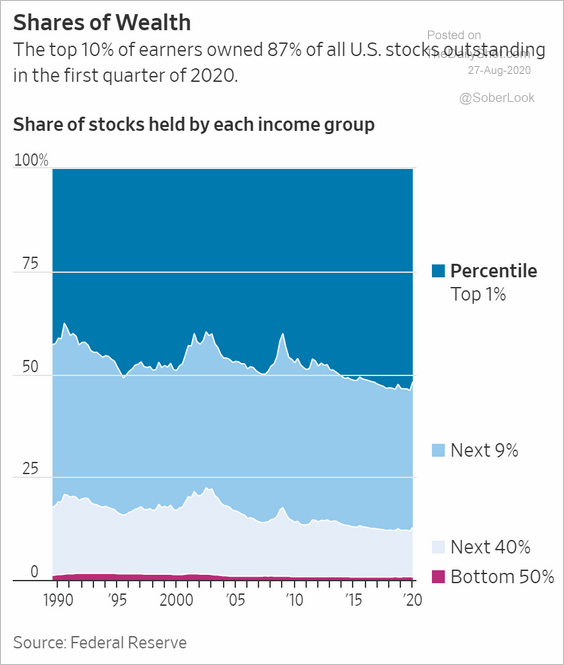
8. Here is the ownership of US stocks by income group.
 Source: @WSJ Read full article
Credit
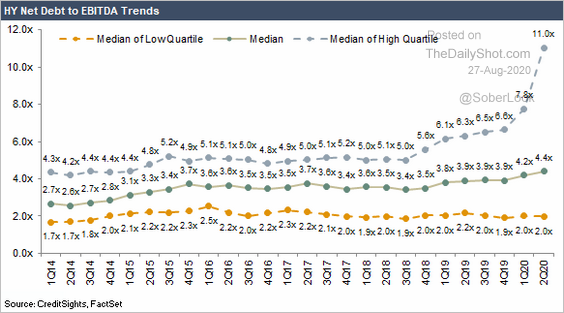
1. The recent spike in the US high-yield leverage has been mostly limited to the weaker names.
 Source: CreditSights
Nonetheless, the overall corporate leverage has been trending higher for years.
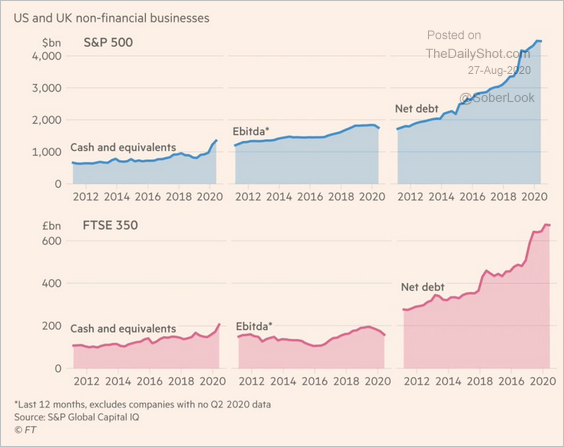 Source: @trevornoren, @FT Read full article
——————–
2. Large firms have been dominating corporate debt issuance this year.
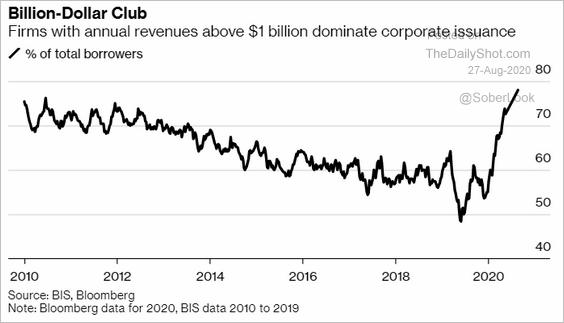 Source: @markets Read full article
3. European high-yield credit default swap spreads continue to tighten.
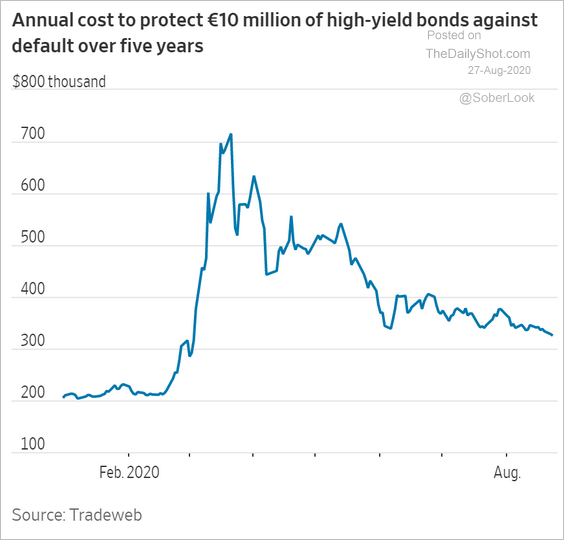 Source: @WSJ Read full article
Rates
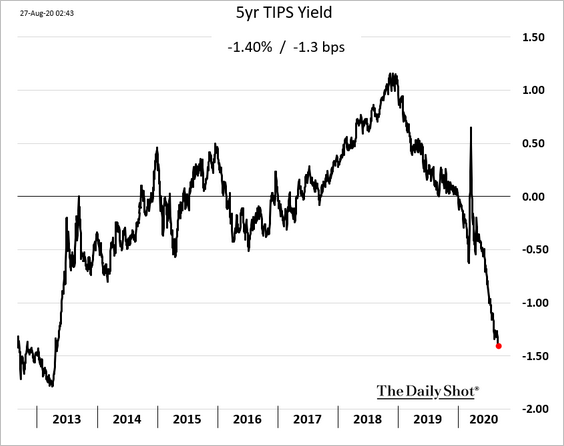
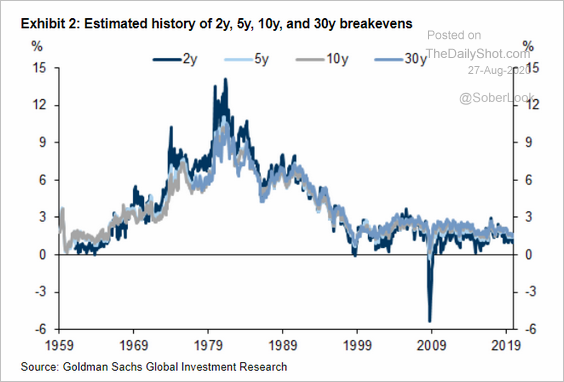
1. US real yields keep falling as the market prices in higher inflation ahead. That’s in part due to the Fed’s expected dovish policy shift on inflation.
By the way, here’s a new estimate of market-based measures of inflation expectations going back to the 1950s.
 Source: Goldman Sachs, @tracyalloway
——————–
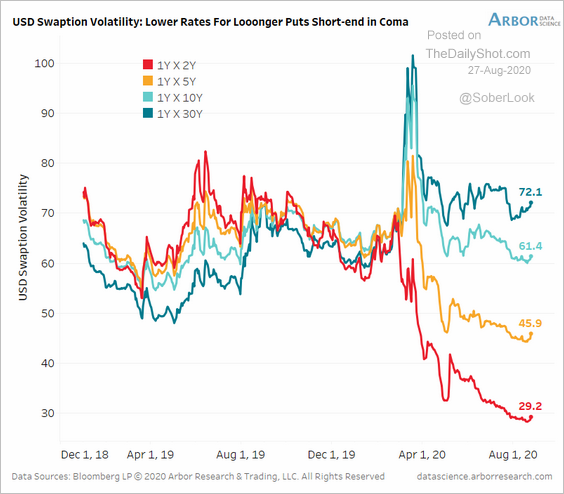
2. Short-term rate volatility has collapsed, with the market convinced that the Fed is on hold for years.
 Source: Arbor Research & Trading
3. Recent communications from the Fed suggest that the central bank officials are in agreement.
 Source: Arbor Research & Trading
Food for Thought
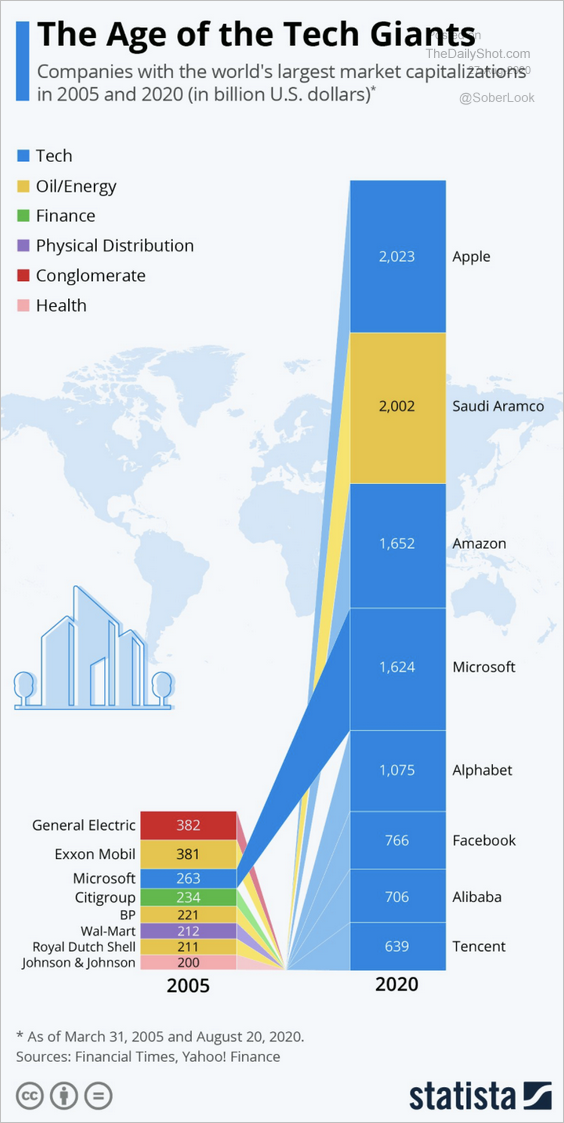
1. Companies with the largest market value in 2005 and 2020:
 Source: Statista
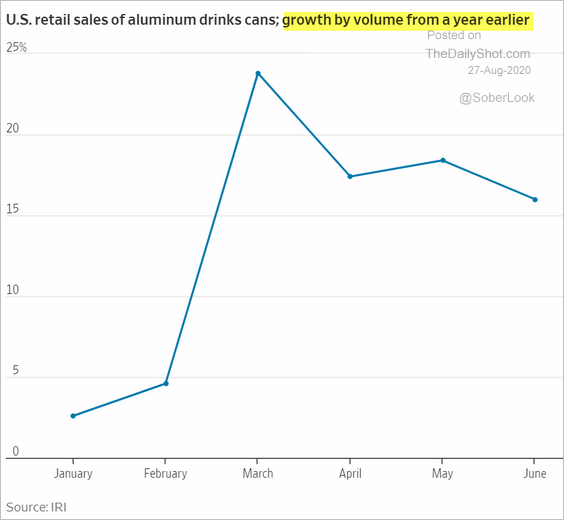
2. This year’s usage of aluminum cans vs. 2019:
 Source: @WSJ Read full article
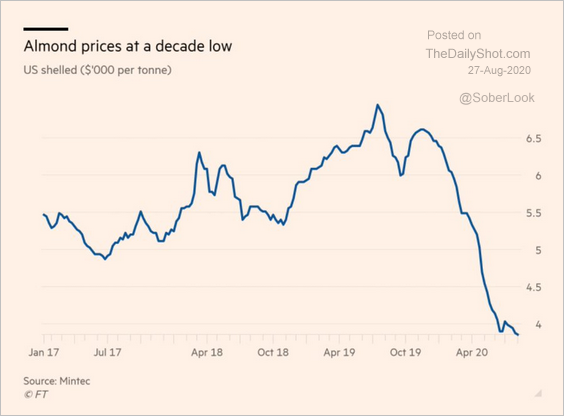
3. Almond prices:
 Source: @adam_tooze, @EmikoTerazono Read full article
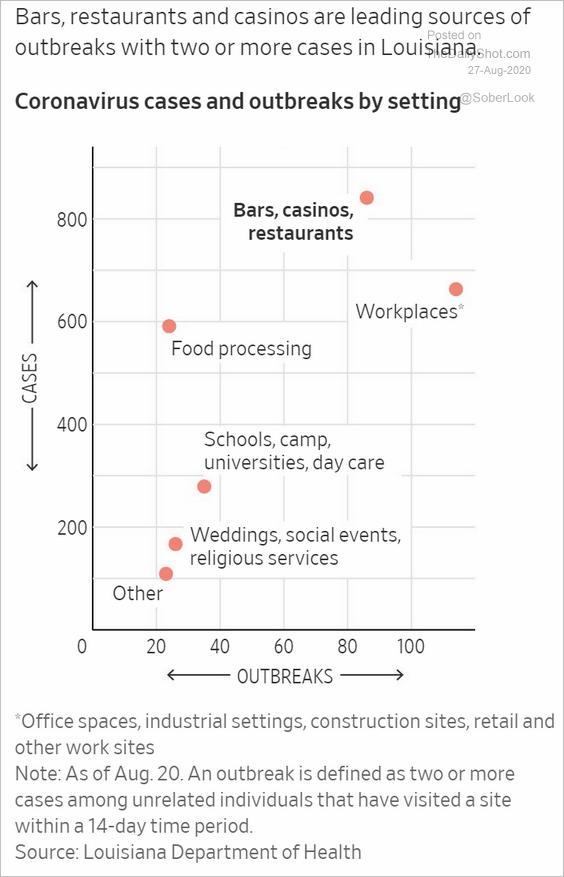
4. Coronavirus cases and outbreaks by setting (in Lousiana):
 Source: @WSJ Read full article
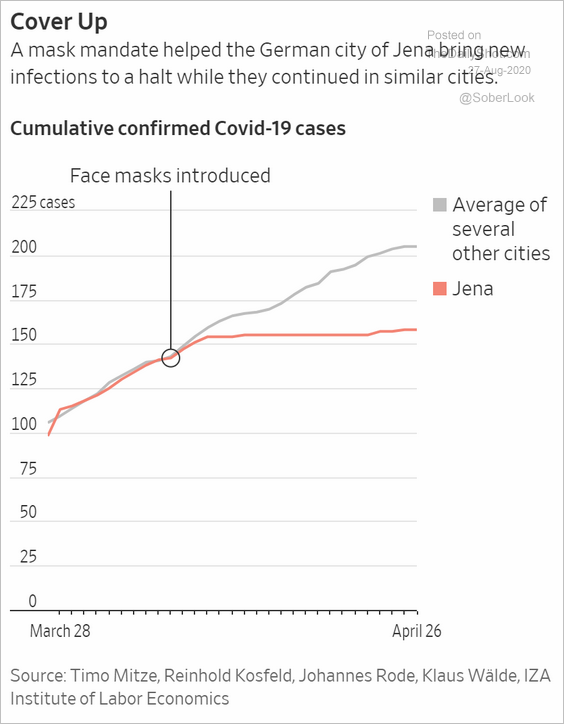
5. Face mask effectiveness:
 Source: @WSJ Read full article
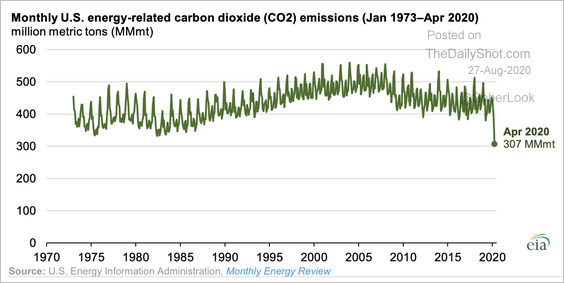
6. US CO2 emissions in April were the lowest in decades …
 Source: EIA Read full article
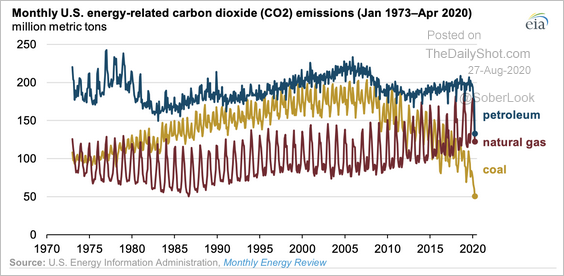
… mostly due to the decreased use of gasoline, brought on by lockdowns.
 Source: EIA Read full article
——————–
7. Campaign spending:
 Source: @WSJ Read full article
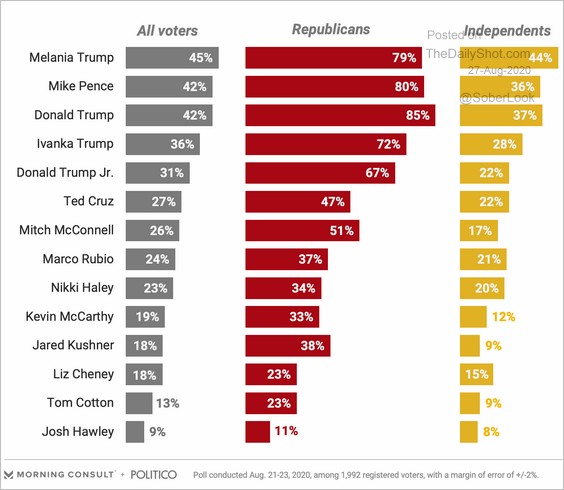
8. Most popular GOP figures:
 Source: Morning Consult Read full article
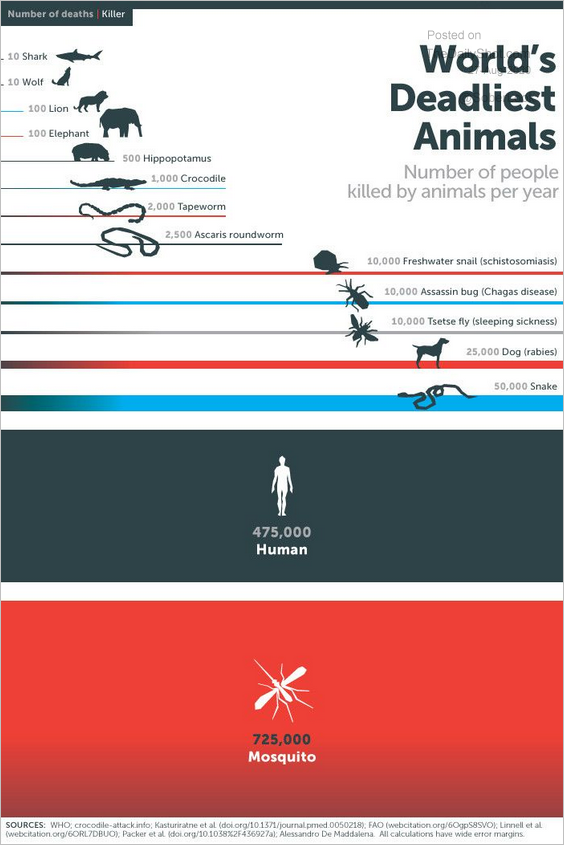
9. The world’s deadliest animals:
 Source: @wef Read full article
——————–
