The Daily Shot: 31-Aug-20
• Administrative Updates
• The United States
• The Eurozone
• Europe
• Japan
• Asia – Pacific
• China
• Emerging Markets
• Commodities
• Equities
• Global Developments
• Food for Thought
Administrative Updates
1. Please note that The Daily Shot will not be published on Monday, September 7th.
2. Please contact [email protected] for any technical or account-related issues/questions.
3. Administrative updates are published on our website here.
The United States
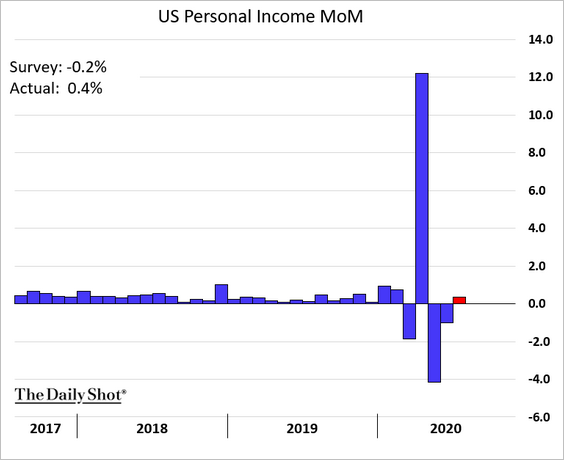
1. US personal incomes unexpectedly increased last month.
Here is the attribution.
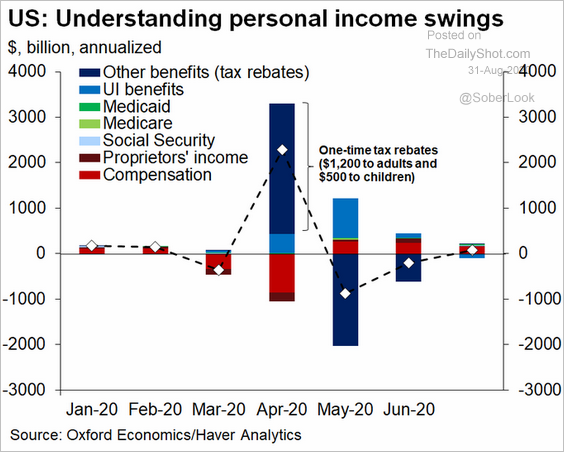 Source: @GregDaco
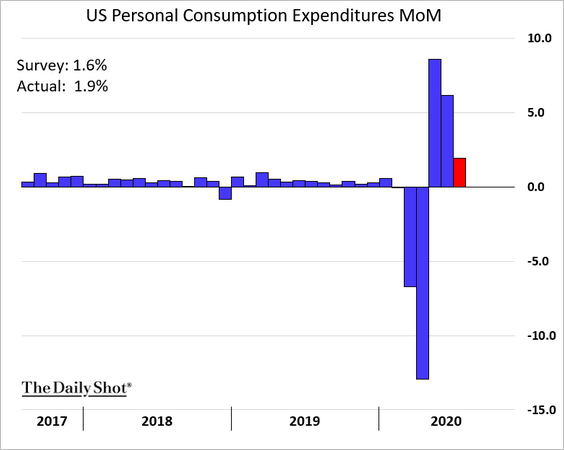
• Spending was also stronger than expected.
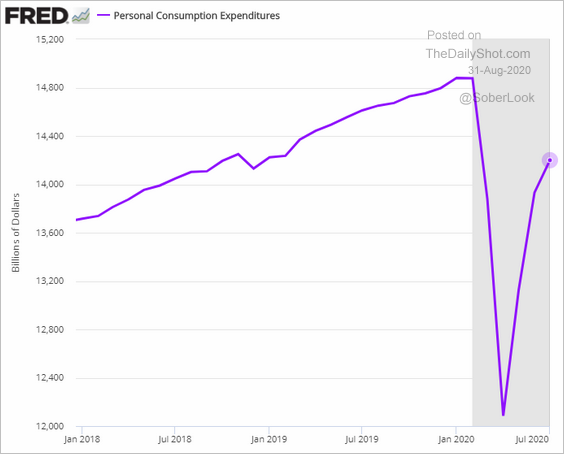
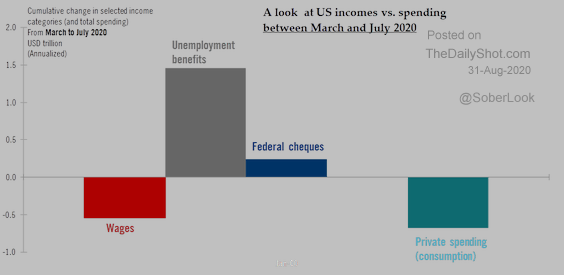
The overall US consumer spending is now back to early 2019 levels.
– This chart compares the changes in spending and income since March.
 Source: @TCosterg
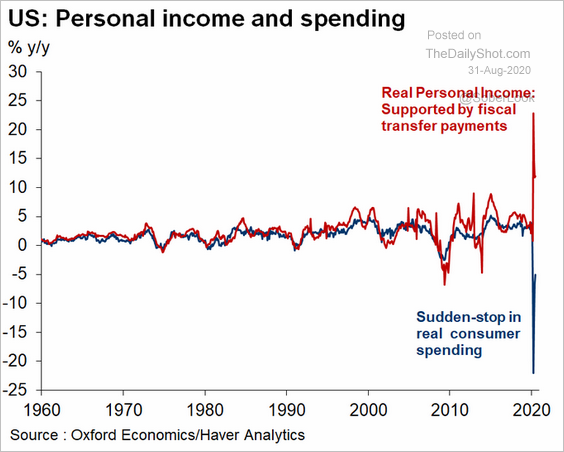
And here are the income/spending trends over time.
 Source: @GregDaco
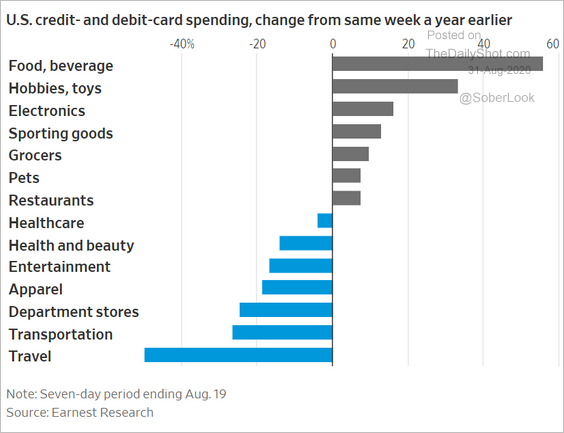
– Below, we have credit/debit card spending by sector vs. the same period in 2019.
 Source: @WSJ Read full article
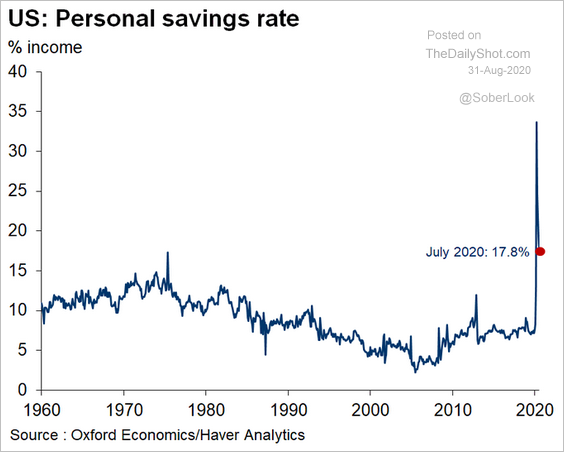
• The US personal savings rate is still elevated.
 Source: @GregDaco
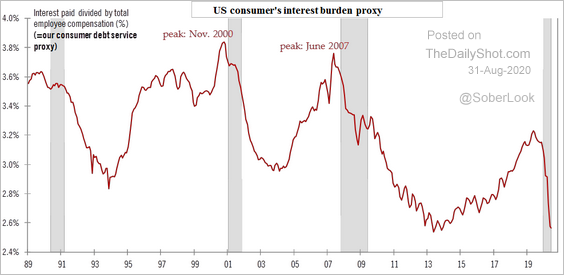
• Reduced interest burden (due to lower rates and delayed mortgage payments) has been supporting consumption.
 Source: @TCosterg
——————–
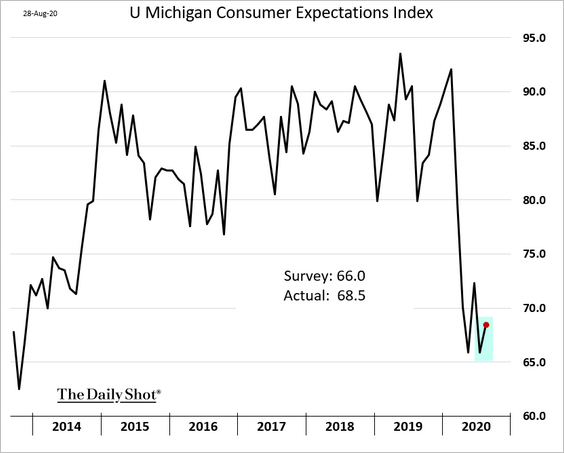
2. Consumer sentiment ticked higher in the second half of the month.
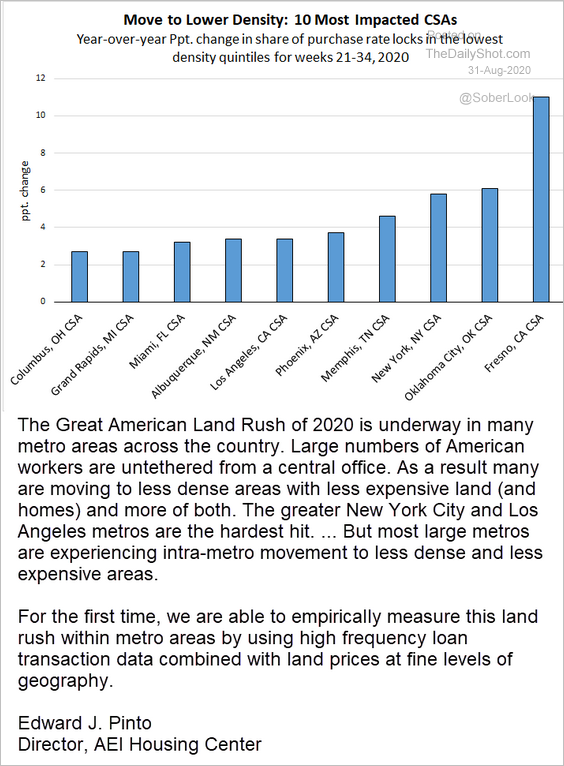
3. Americans are moving into lower-density communities within their metro areas. Regional mortgage data provide the evidence for this trend (see comment below).
 Source: AEI Housing Center
4. Next, we have some updates on inflation.
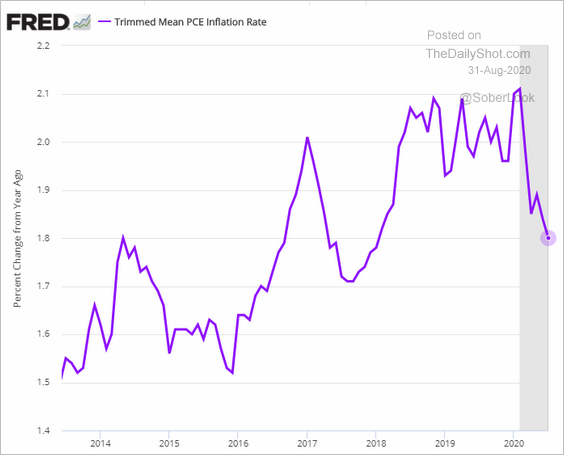
• The core PCE inflation (the Fed’s preferred measure) is rebounding.
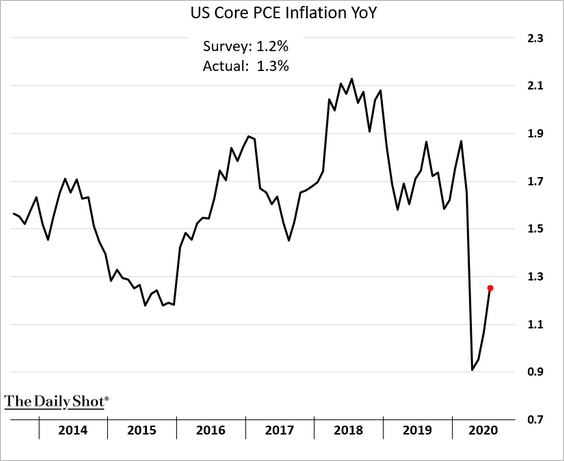
However, the closely-watched trimmed PCE (from the Dallas Fed) continues to moderate.
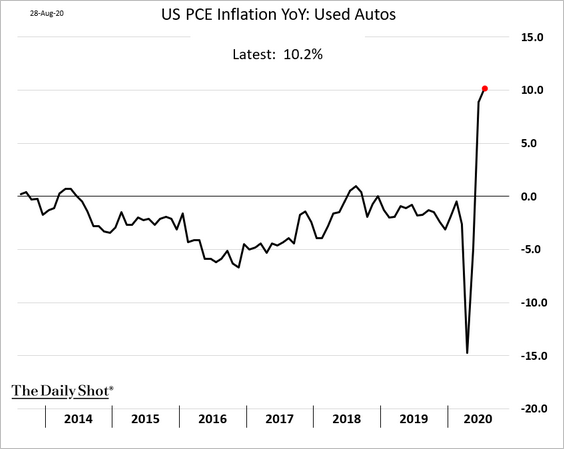
• The move to lower-density areas and fear of public transportation have boosted demand for used vehicles.
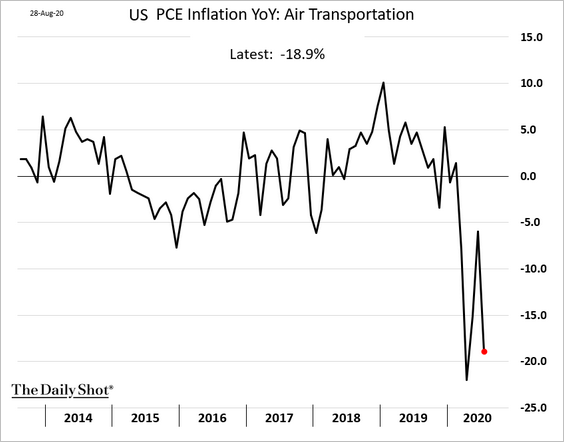
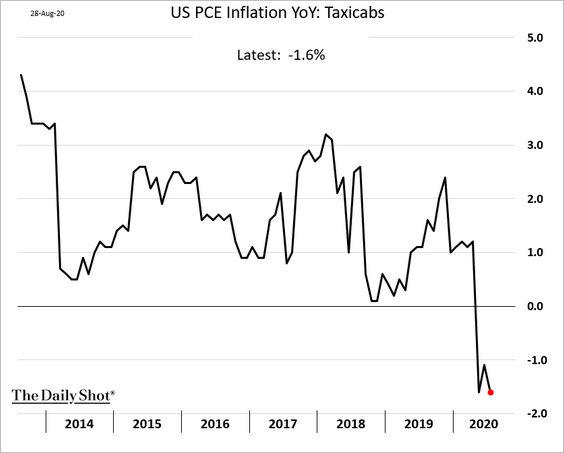
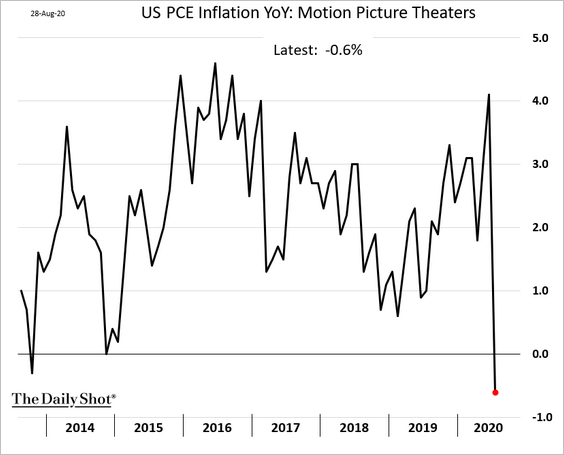
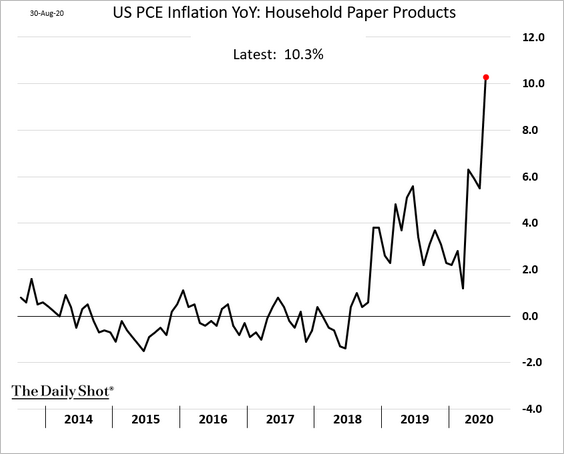
• Below are a few other pandemic-driven inflation trends.
– Airline tickets:
– Taxi:
– Movie tickets (first decline in years):
– Toilet paper and paper towels:
• The Fed is telling us that downside inflation surprises are over. The central bank wants to press beyond “full employment,” letting inflation quicken.
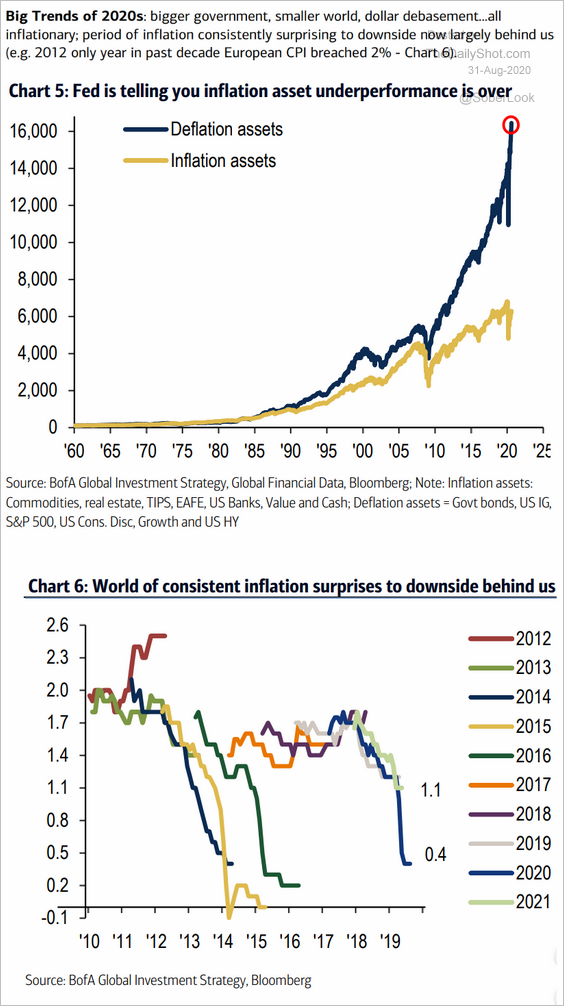 Source: BofA Merrill Lynch Global Research
However, slower population growth will continue to be a drag on inflation.
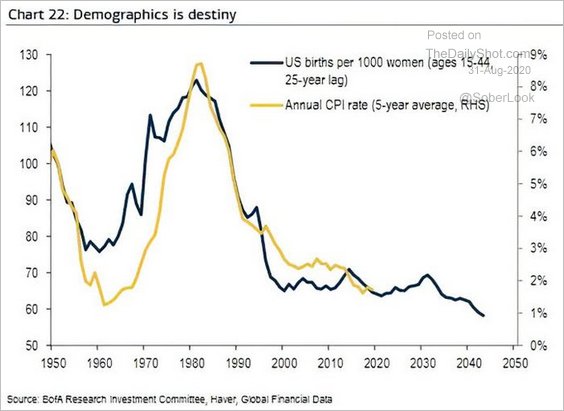 Source: @ISABELNET_SA, @BofAML
——————–
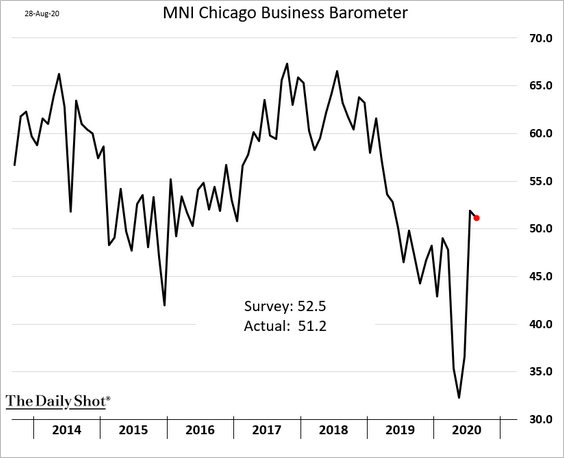
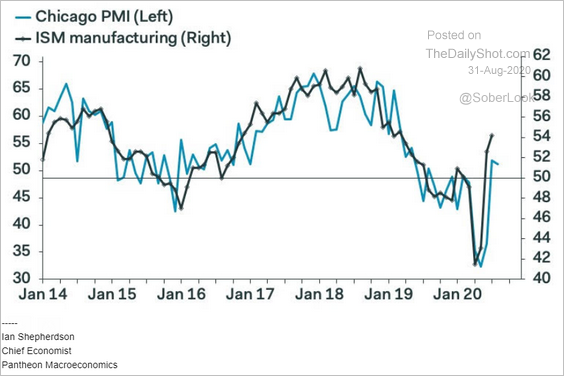
5. The MNI Chicago-area business activity indicator was weaker than expected this month, suggesting that factory growth at the national level (ISM) is slowing (2 charts).
 Source: Pantheon Macroeconomics
——————–
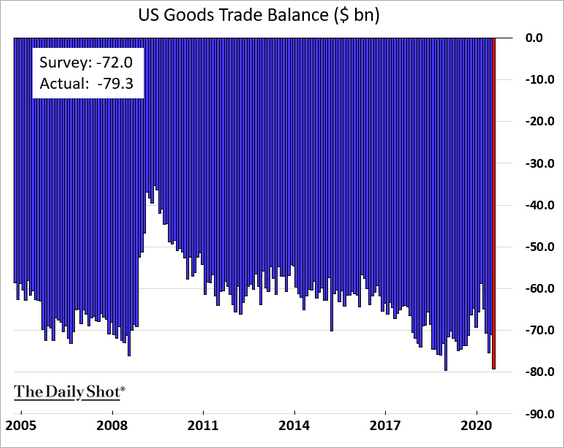
6. The trade deficit in goods is approaching record levels again.
The Eurozone
1. Let’s begin with sentiment indicators.
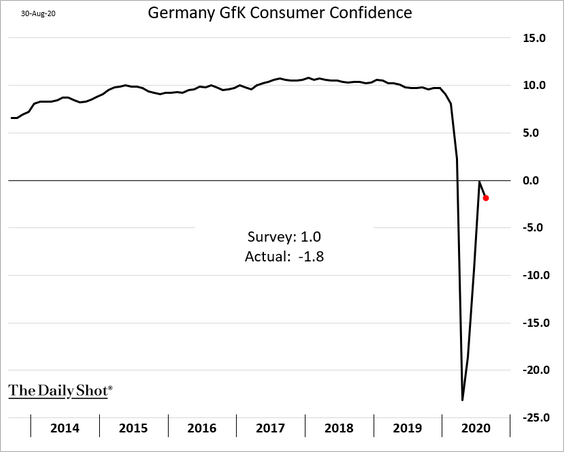
• German consumer confidence unexpectedly declined this month.
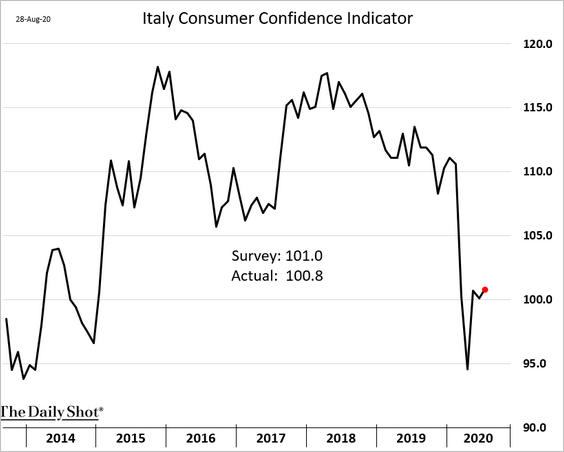
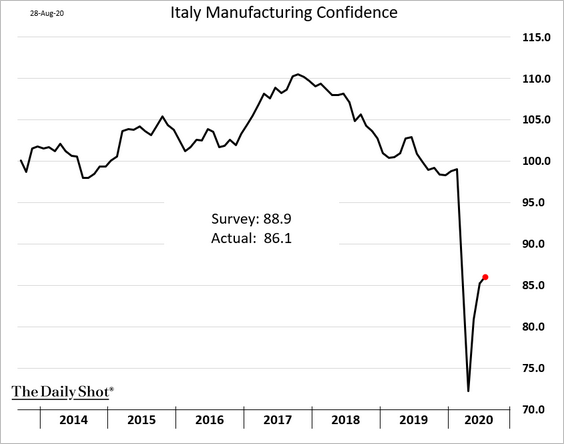
• Here is Italian consumer and industrial confidence.
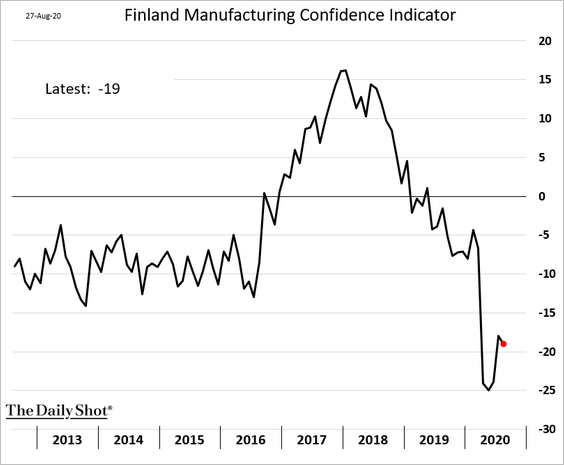
• Finland’s manufacturing confidence has been terrible.
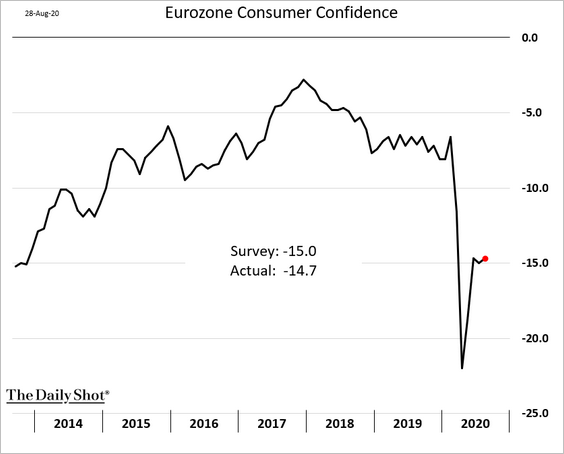
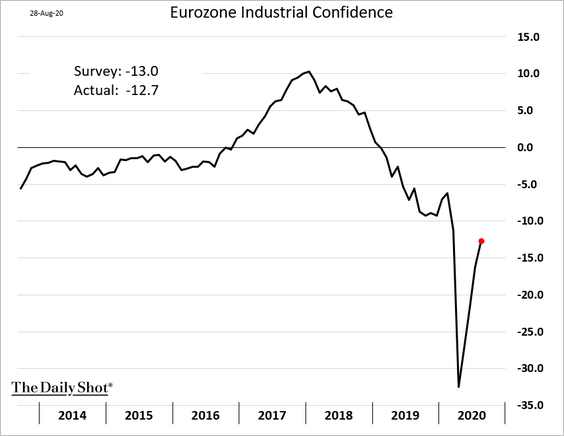
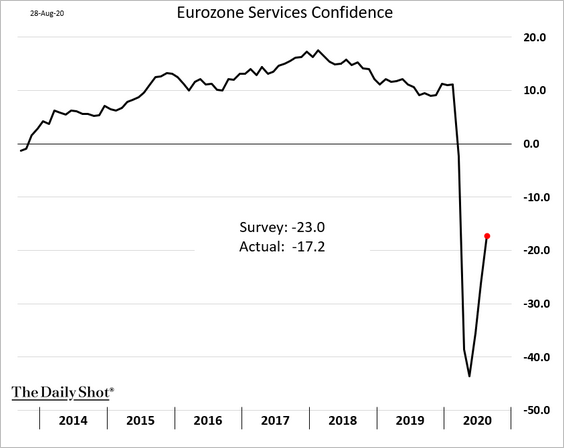
• Below are the sentiment indicators at the Eurozone level.
– Consumer confidence:
– Industrial confidence:
– Services:
——————–
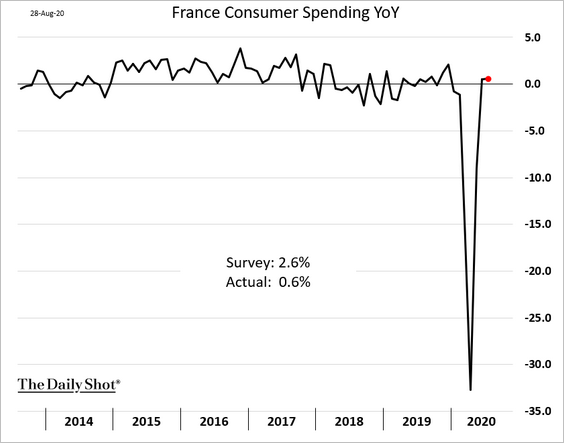
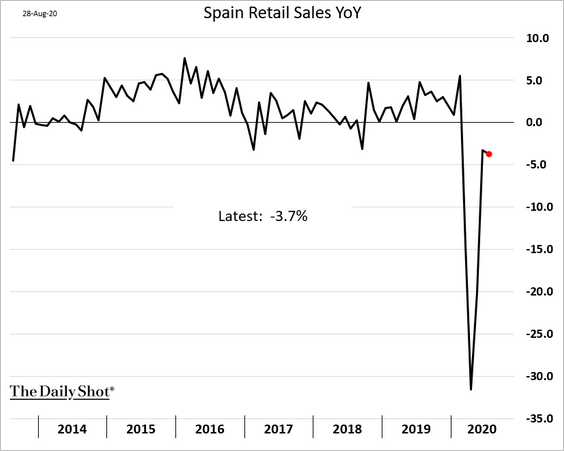
2. Next, we have some updates on retail/consumer spending.
• French consumer spending (weaker than expected):
• Spanish retail sales:
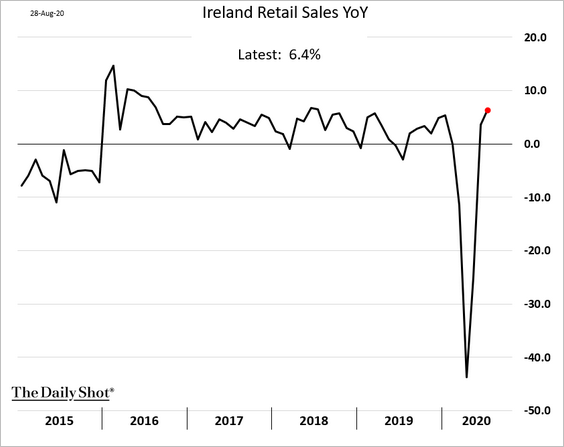
• Ireland’s retail sales:
——————–
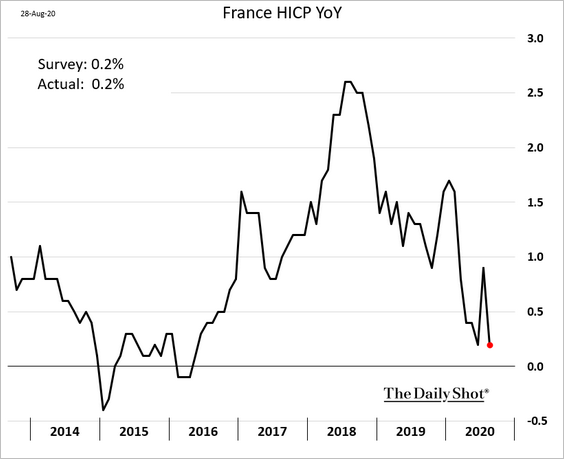
3. French consumer inflation reversed the July spike, which was driven by the timing of summer sales.
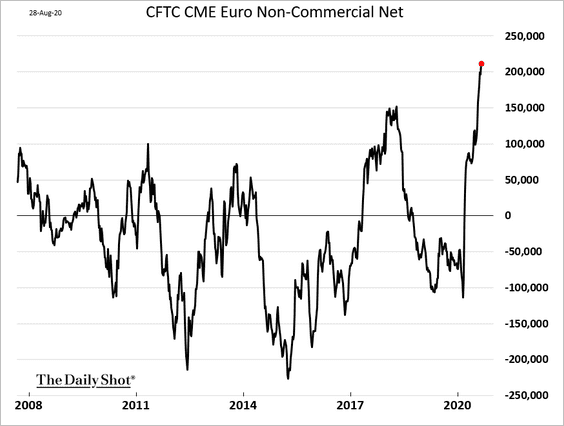
4. Hedge funds continue to boost their bets on the euro. When this crowded trade reverses, the selloff is going to be violent.
Europe
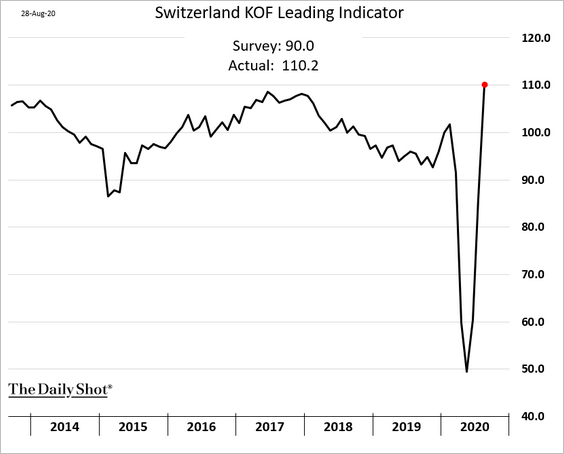
1. Switzerland’s leading indicator surprised to the upside this month.
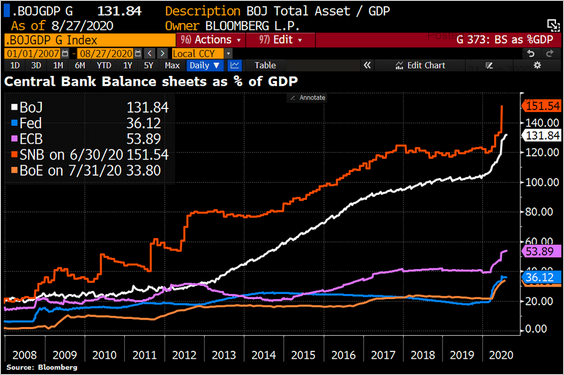
Separately, here is the Swiss central bank’s (SNB) balance sheet (% of GDP) vs. peers in other advanced economies.
 Source: @Schuldensuehner
——————–
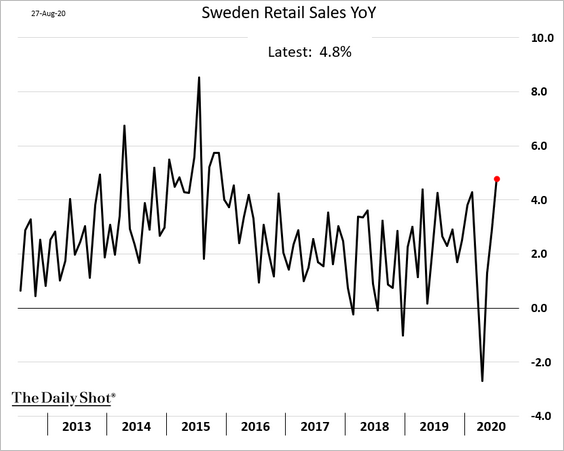
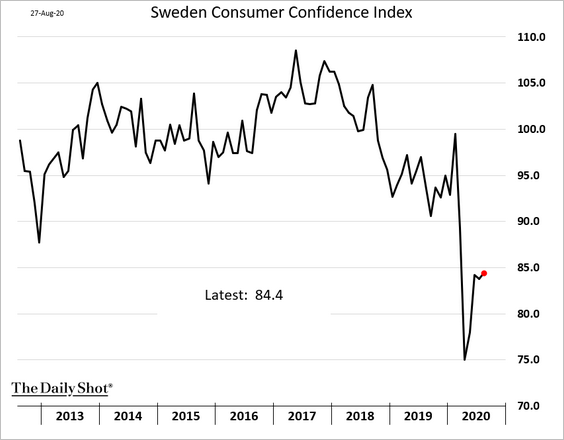
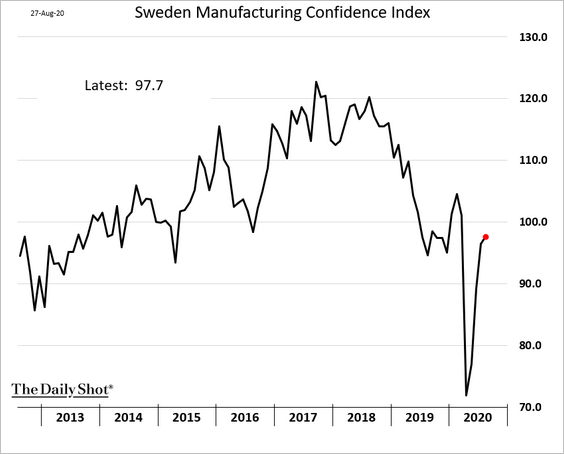
2. Here are some updates on Sweden.
• July retail sales:
• Consumer and industrial confidence:
——————–
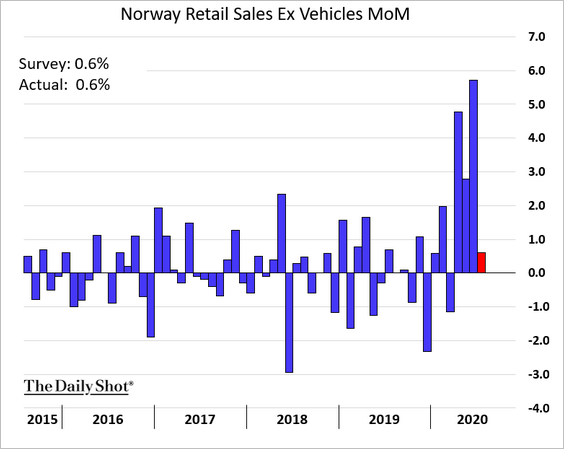
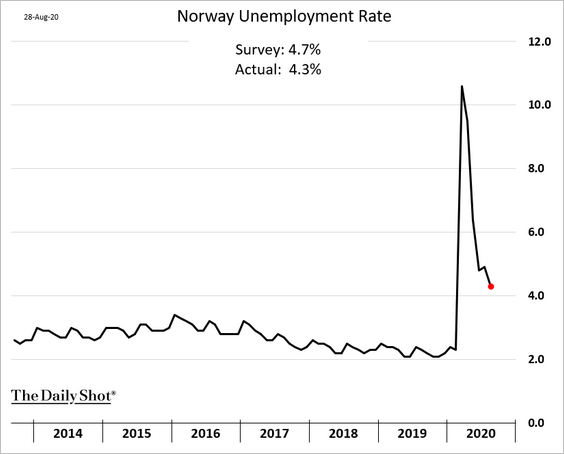
3. Norway’s retail sales remain strong as the unemployment rate continues to moderate.
Japan
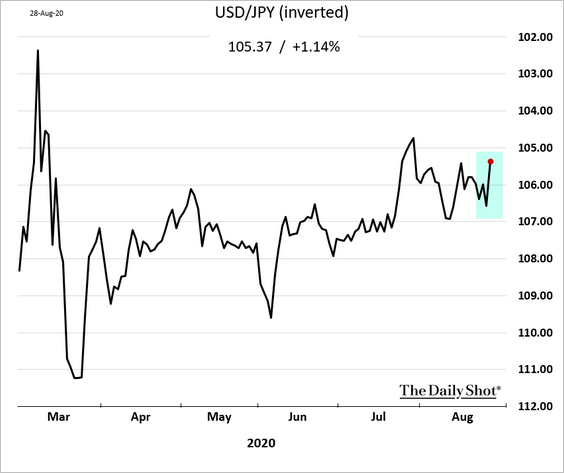
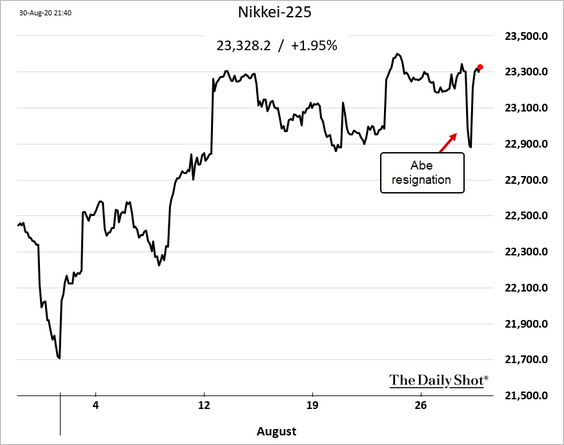
1. Shinzo Abe’s resignation spooked the markets last week, strengthening the yen and pushing stocks lower.
However, Abe’s replacement is likely to continue with fiscal support.
 Source: Reuters Read full article
Moreover, Buffett’s bet on Japan’s trading firms boosted stocks on Monday.
——————–
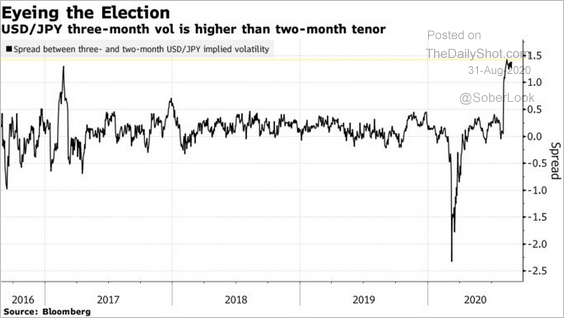
2. Demand for the three-month USD/JPY options has risen on US elections risk.
 Source: @markets Read full article
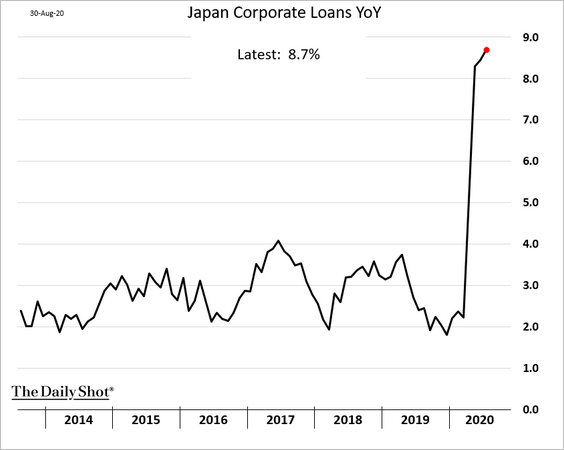
3. Japanese businesses have increased borrowing sharply since the start of the crisis.
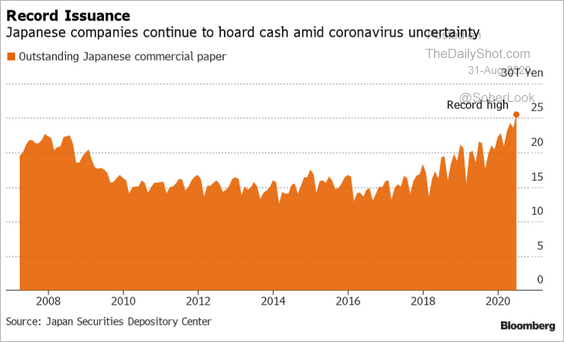
We can also see this trend in the amount of commercial paper outstanding.
 Source: Chikako Mogi, @TheTerminal, Bloomberg Finance L.P.
——————–
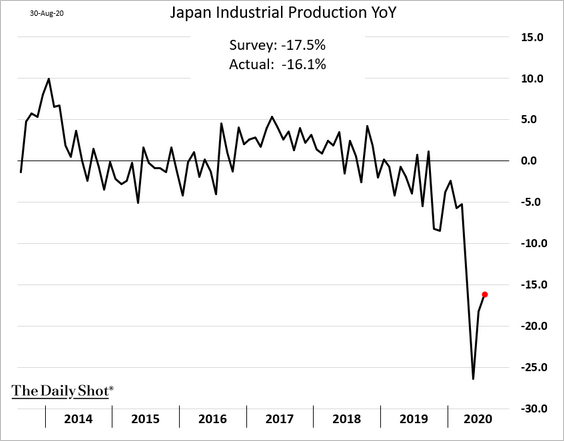
4. Industrial production has a long way to go to get to 2019 levels.
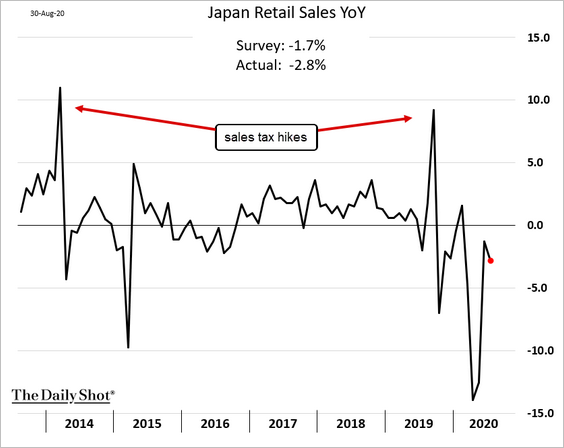
5. Retail sales weakened last month.
Asia – Pacific
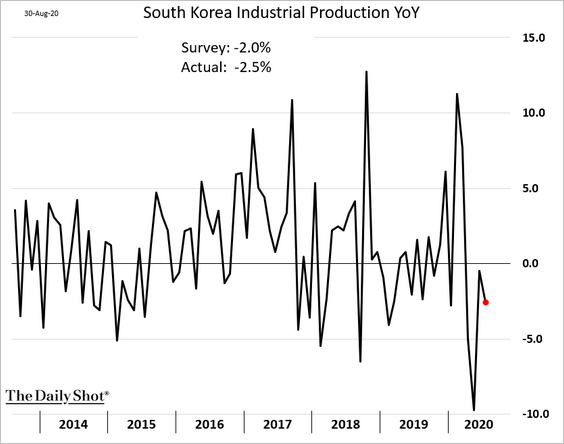
1. South Korea’s industrial production remains soft.
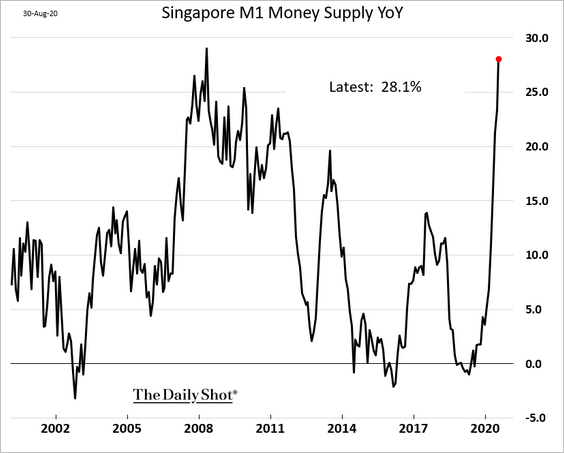
2. Singapore’s money supply growth has accelerated.
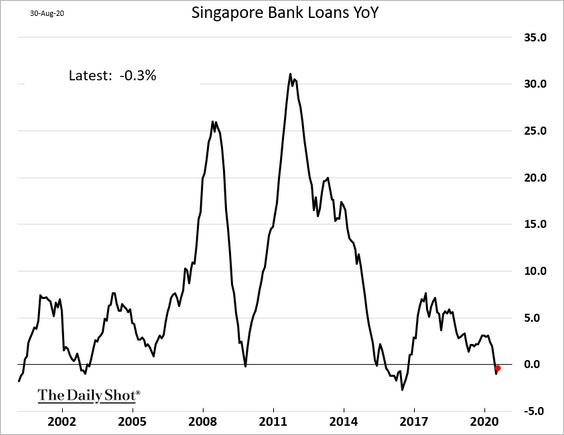
But it’s not driven by private-sector lending.
——————–
3. Next, we have some updates on Australia.
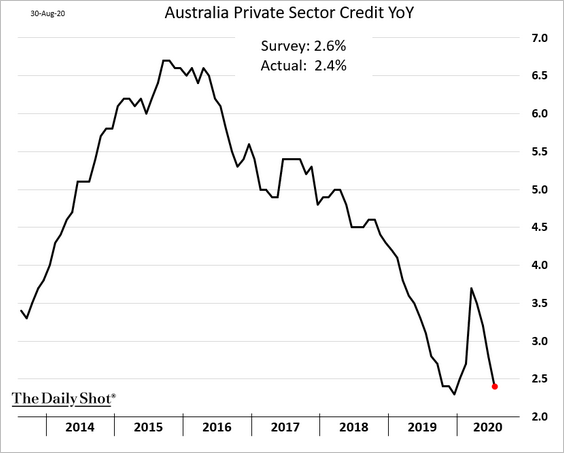
• Private-sector credit growth continues to moderate.
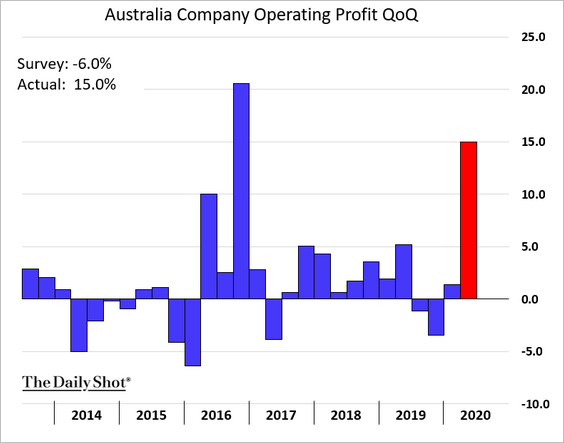
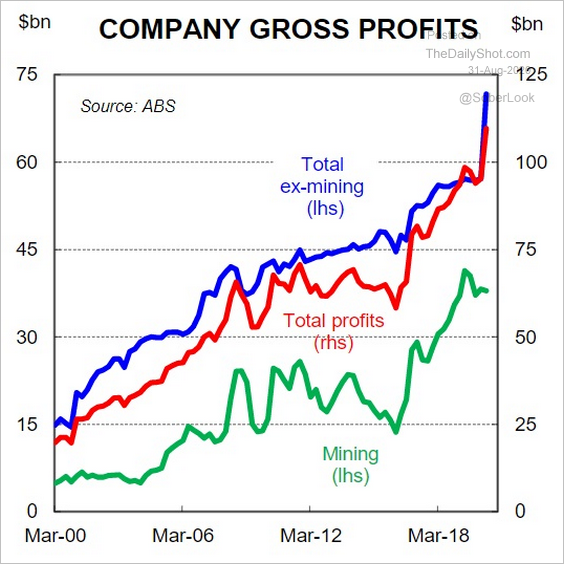
• Corporate profits ware much stronger than expected in the second quarter.
 Source: CBA, @Scutty
China
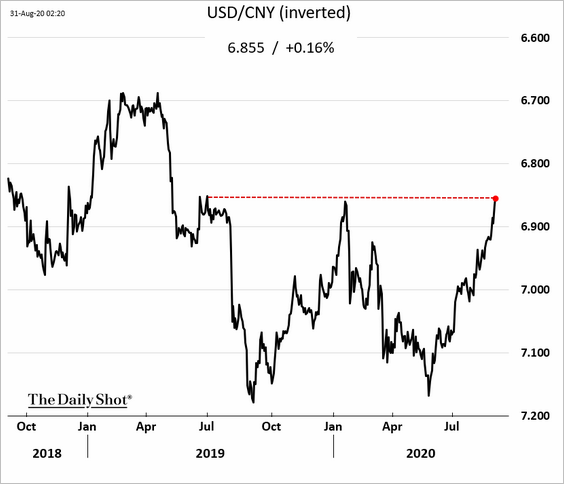
1. The renminbi cleared the January high (vs. USD).
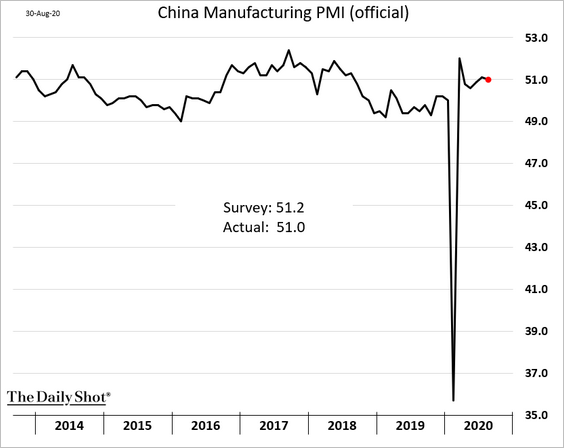
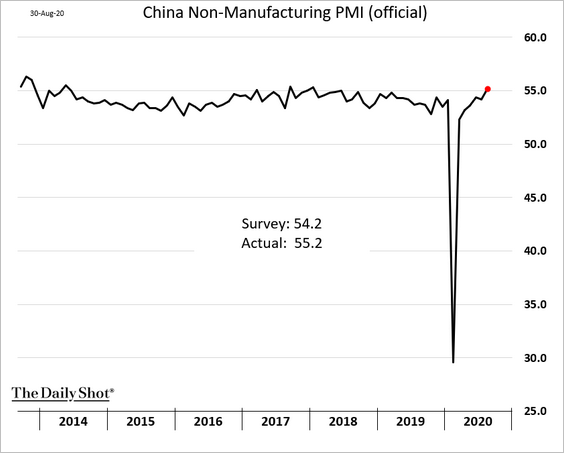
2. PMI indicators point to stable growth, with non-manufacturing business activity accelerating.
• Manufacturing:
• Non-Manufacturing:
——————–
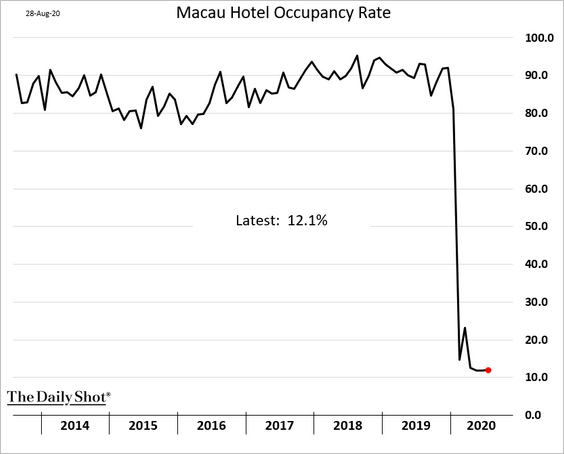
3. Gamblers continue to avoid Macau.
Emerging Markets
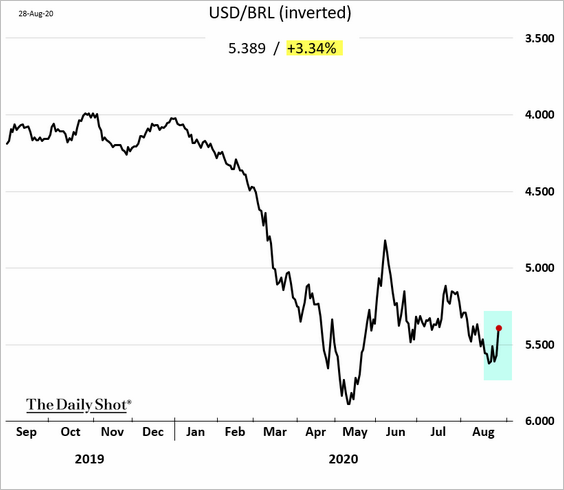
1. The Brazilian real popped last week.
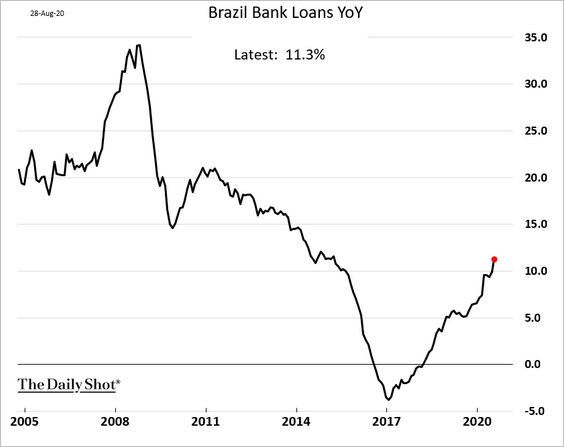
Brazil’s loan growth is accelerating.
——————–
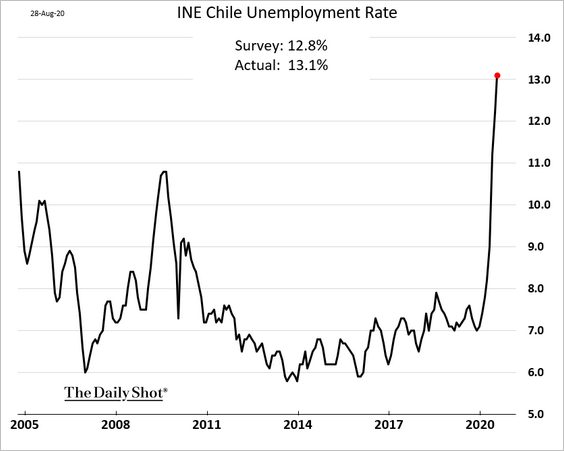
2. Chile’s unemployment rate surprised to the upside as the pandemic takes its toll.
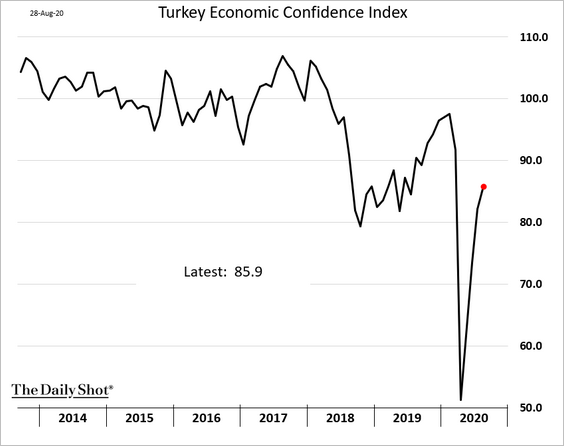
3. Turkey’s economic confidence is recovering.
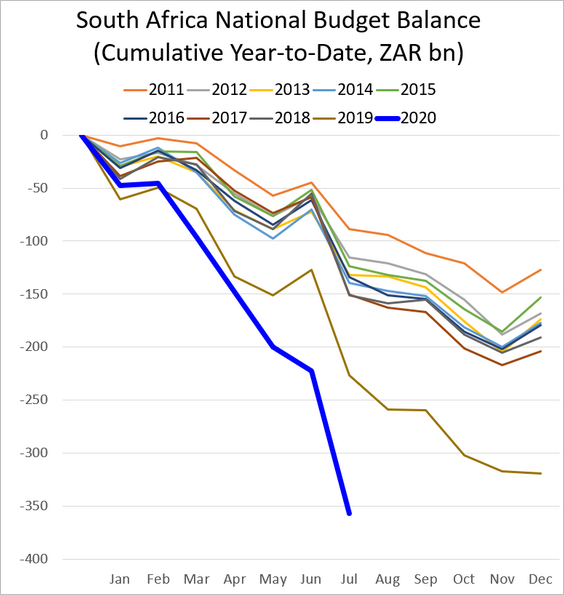
4. South Africa’s budget gap has blown out.
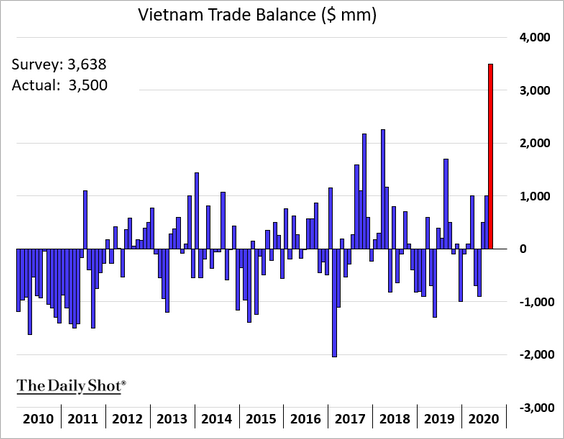
5. Vietnam’s trade surplus hit a record high.
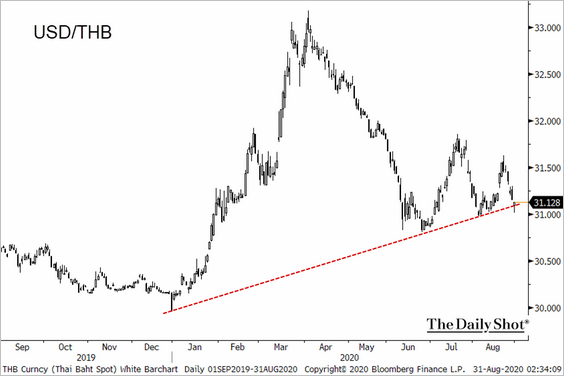
6. USD/THB (Thai baht) is at support (lower = stronger THB, weaker USD).
 Source: @TheTerminal, Bloomberg Finance L.P.
Commodities
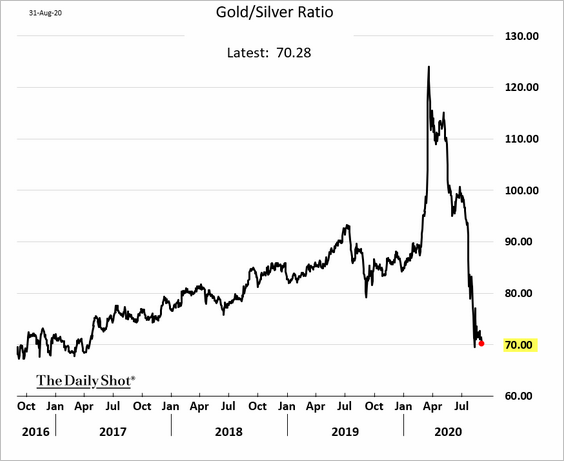
1. The gold/silver ratio is testing 70 again.
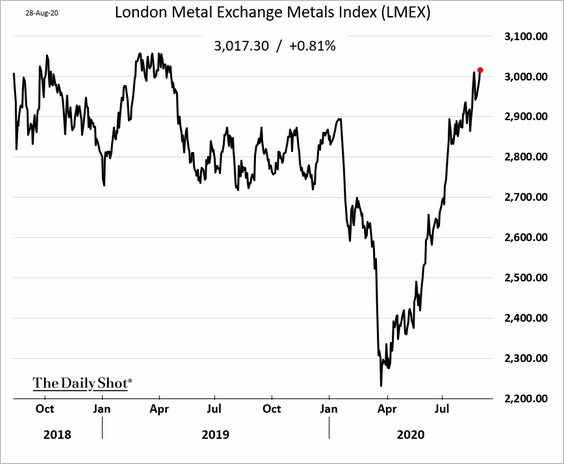
2. Industrial metals continue to advance.
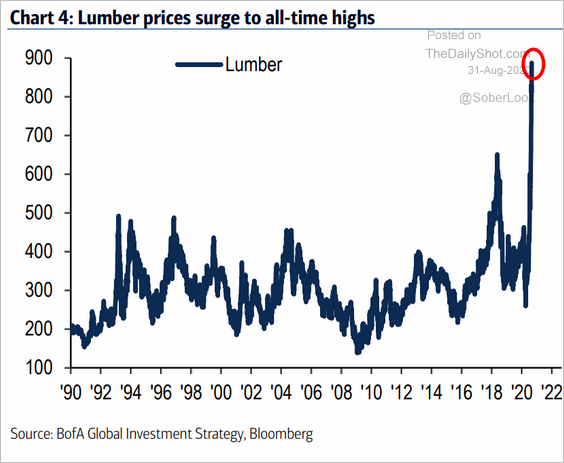
3. US lumber prices are out of control.
 Source: BofA Merrill Lynch Global Research
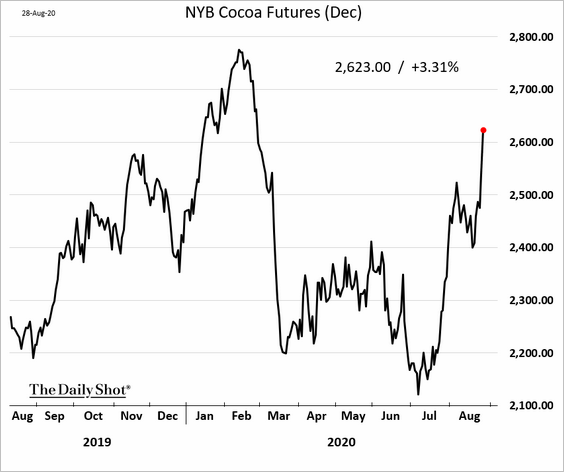
4. Cocoa futures were up sharply on crop concerns (dry weather) and political uncertainty in Ivory Coast.
 Source:
Equities
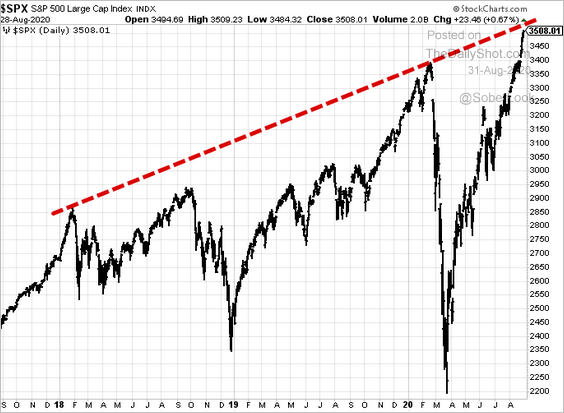
1. The S&P 500 is testing resistance.
 h/t @hmeisler
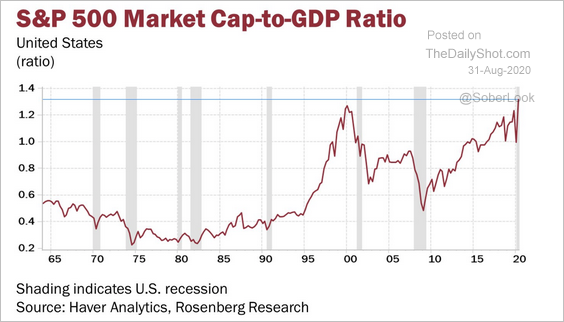
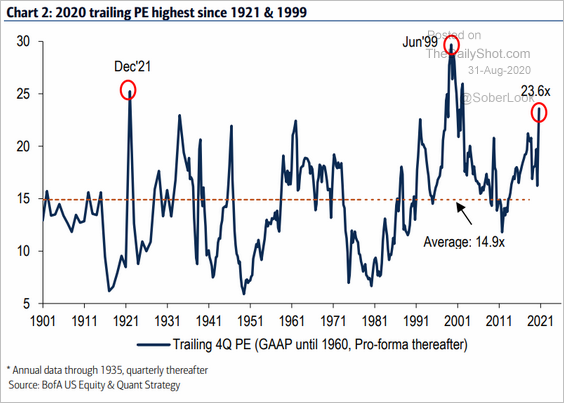
2. Should we be concerned about the following two indicators?
• Market cap-to-GDP ratio (some of which is driven by increased foreign earnings):
 Source: @EconguyRosie
• Trailing P/E ratio:
 Source: BofA Merrill Lynch Global Research
——————–
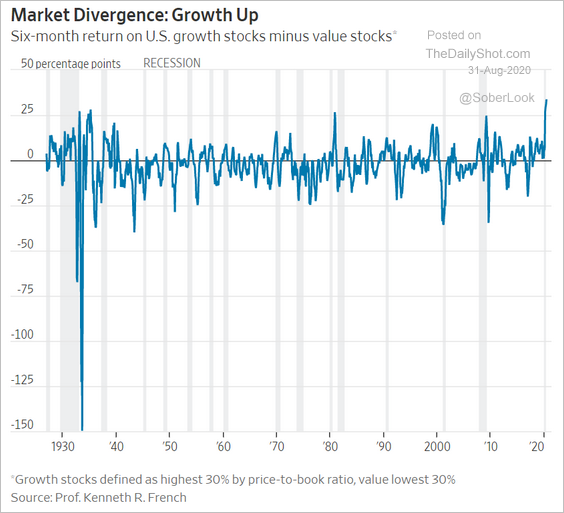
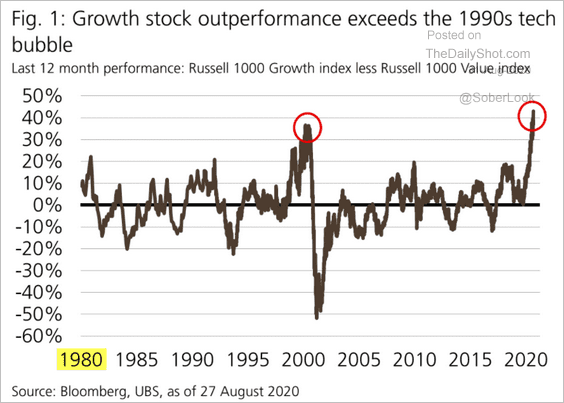
3. The recent outperformance of growth vs. value has been remarkable.
 Source: @WSJ Read full article
 Source: David Lefkowitz, UBS Financial Services
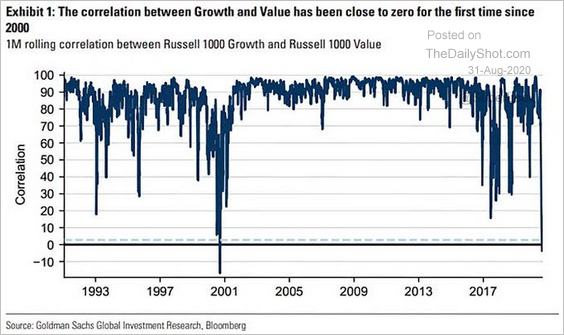
The correlation between growth and value has collapsed.
 Source: Goldman Sachs, @ISABELNET_SA
——————–
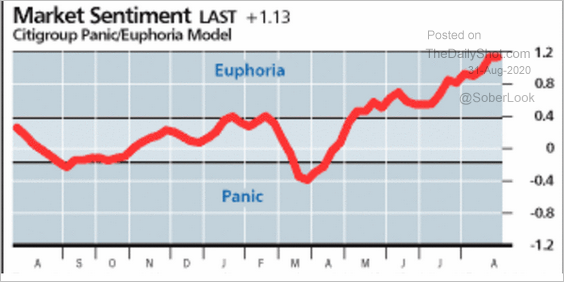
4. Citigroup’s sentiment indicator is deep in “euphoria” territory.
 Source: @hmeisler
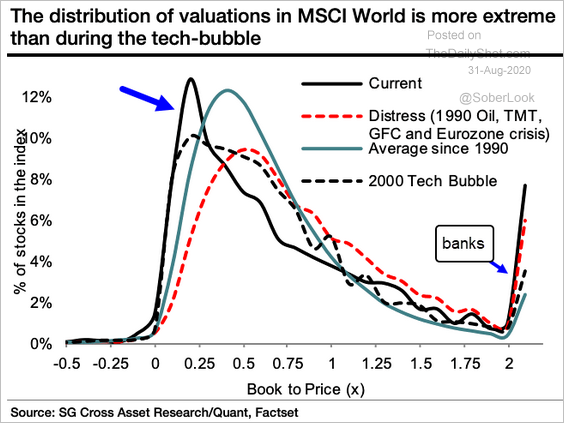
5. This chart shows the distribution of book-to-price ratios for global companies (lower = more expensive).
 Source: @ISABELNET_SA, @SocieteGenerale
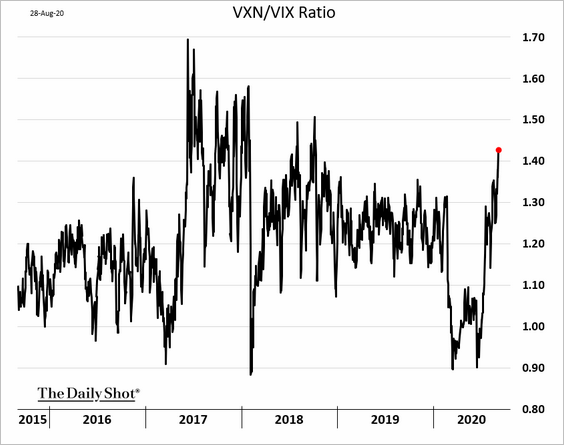
6. Demand for options on the Nasdaq 100 index continues to climb amid concerns about the spectacular rally in tech mega-caps (VXN = VIX-equivalent for Nasdaq 100).
Global Developments
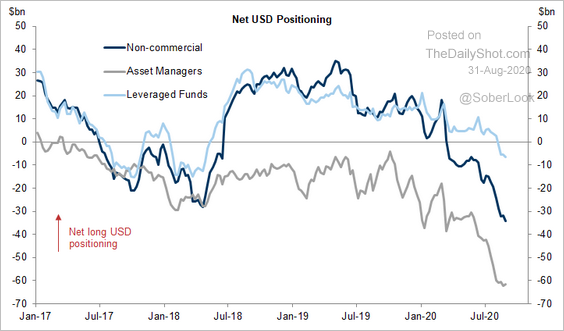
1. Hedge funds are pressing their bets against the US dollar.
 Source: Goldman Sachs
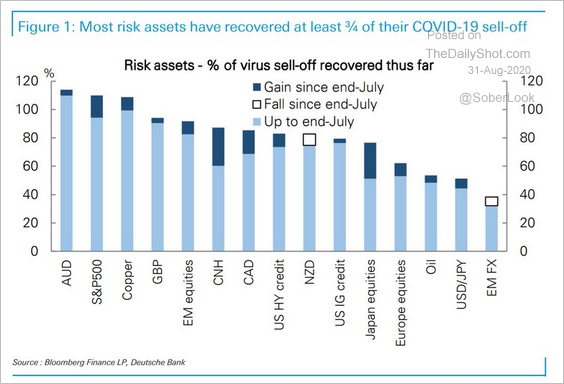
2. This chart shows the rebound across different asset classes.
 Source: Deutsche Bank Research, @Scutty
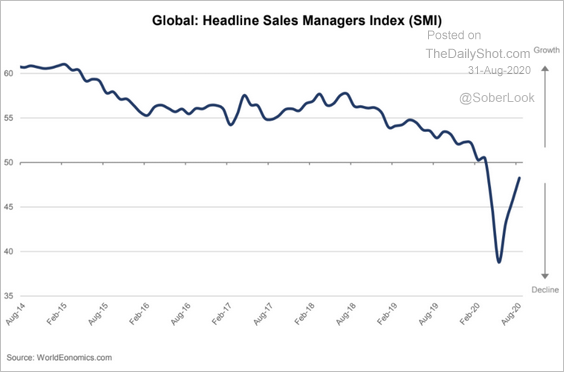
3. Finally, the global SMI from World Economics shows that business activity has almost stabilized (but remains in contraction territory).
 Source: World Economics
——————–
Food for Thought
1. How to spot malicious emails:
 Source: Statista
2. Cyberattacks on utilities:
 Source: @MorningConsult, @l_m_j_ Read full article
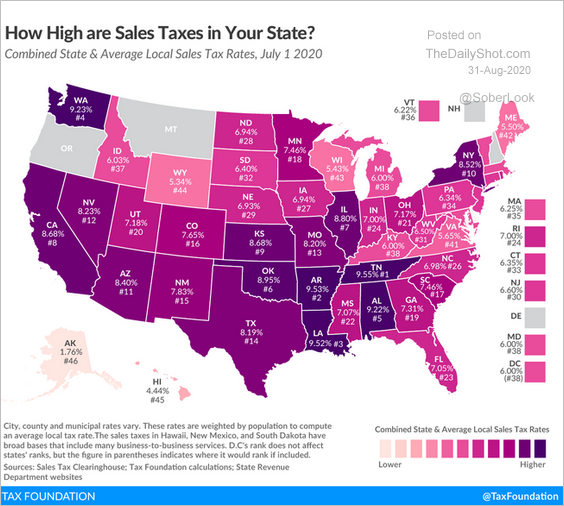
3. Sales tax by state:
 Source: @TaxFoundation Read full article
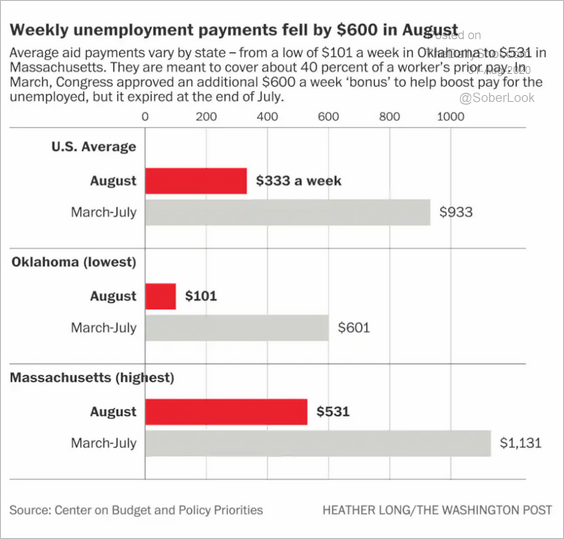
4. Highest and lowest US unemployment payments and changes since July:
 Source: The Washington Post Read full article
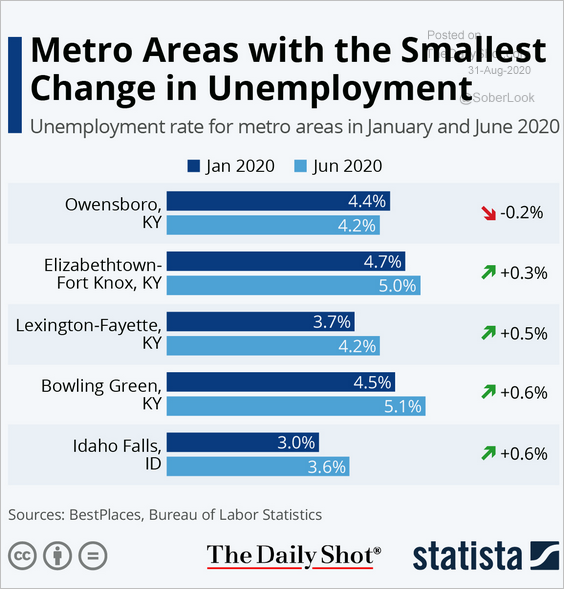
5. Metro areas with the smallest increases in unemployment:
 Source: Statista
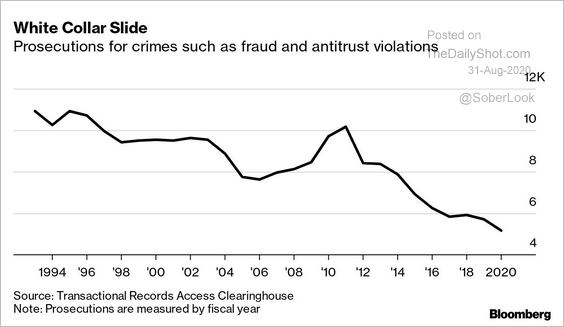
6. White-collar prosecutions:
 Source: @bpolitics Read full article
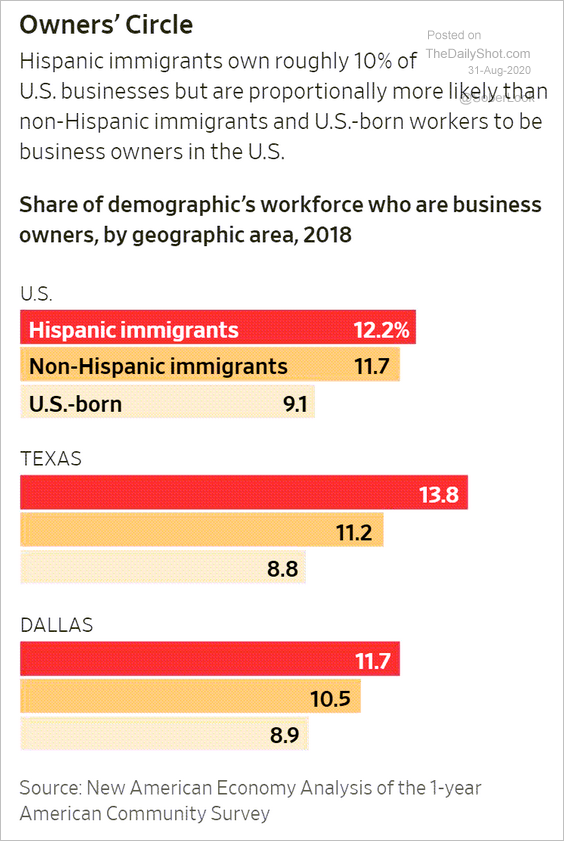
7. US Latino business owners:
 Source: @WSJ Read full article
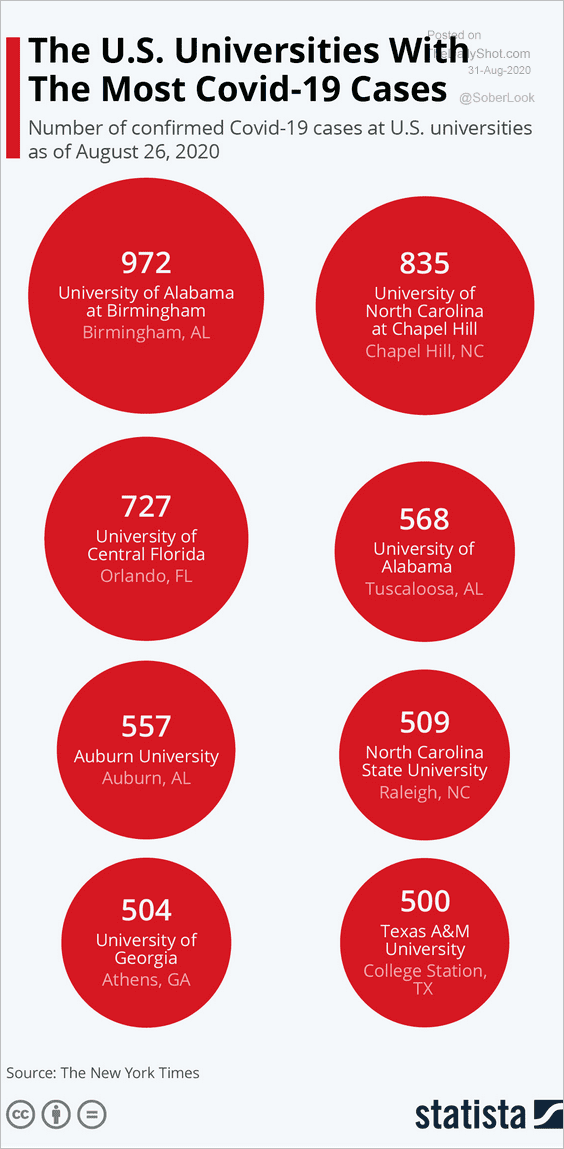
8. COVID cases at US universities:
 Source: Statista
9. Mental health issues:
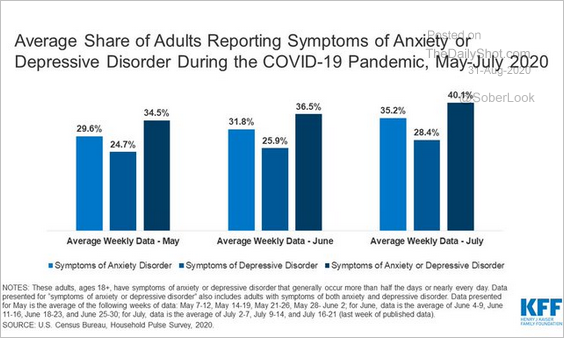 Source: @KFF Read full article
10. Australia overlaid on the US:
 Source: @simongerman600 Read full article
——————–
