
The Daily Shot: 14-Sep-20
• The United States
• Canada
• The United Kingdom
• The Eurozone
• Asia – Pacific
• China
• Emerging Markets
• Commodities
• Energy
• Equities
• Credit
• Food for Thought
The United States
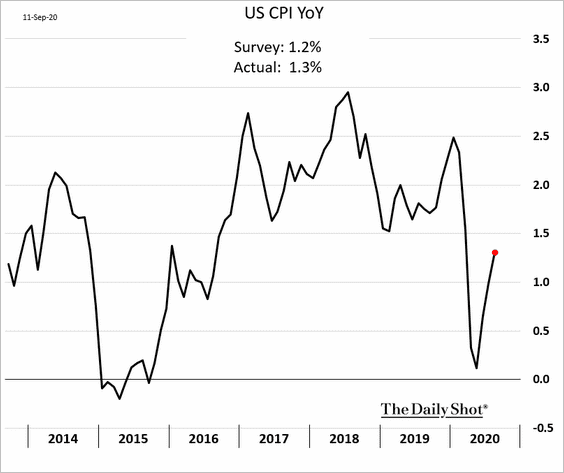
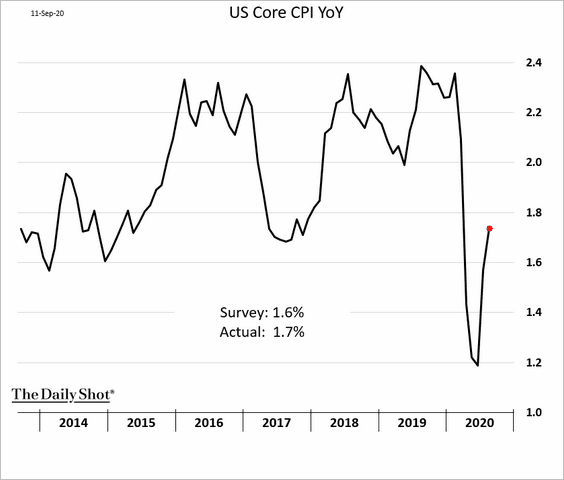
1. Let’s begin with the August CPI report, which was slightly above market expectations.
• The headline CPI (year-over-year):
• Core CPI:
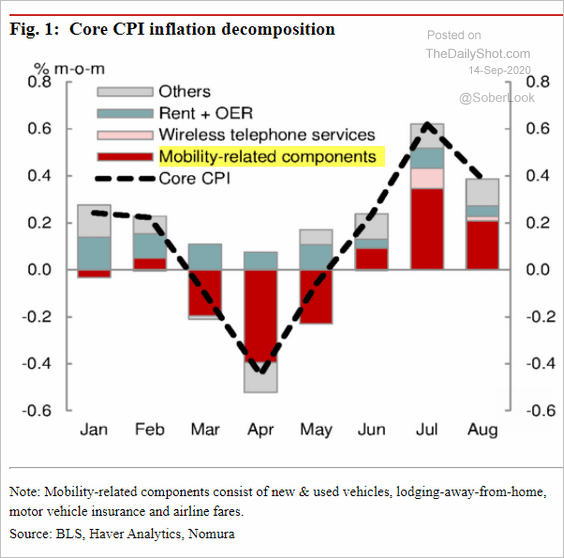
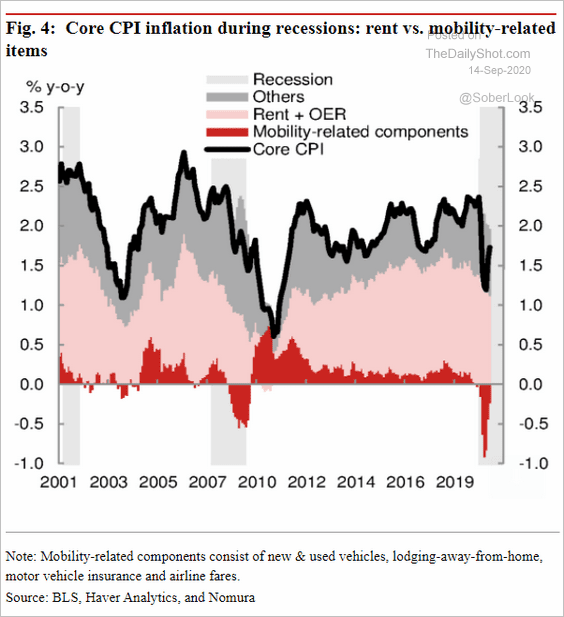
The rebound in sectors impacted by the lockdowns continued to push inflation higher (although not all sectors saw a bounce in prices).
• Month-over-month:
 Source: Nomura Securities
• Year-over-year:
 Source: Nomura Securities
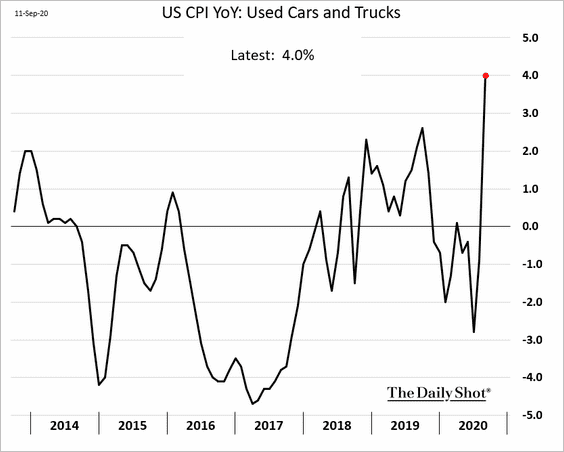
Used car prices jumped sharply, as Americans move to less-populated areas and avoid public transportation.
• Year-over-year:
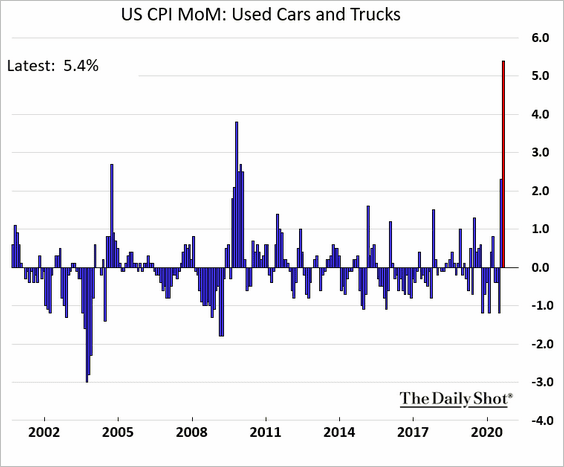
• Month-over-month:
Some of the price increases have been sustained by government checks and may not persist going forward.
 Source: @TCosterg
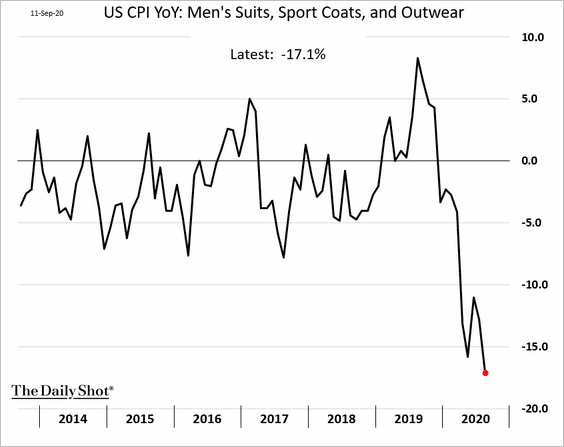
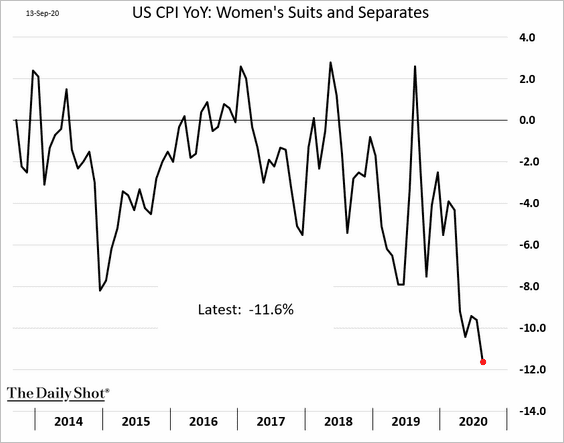
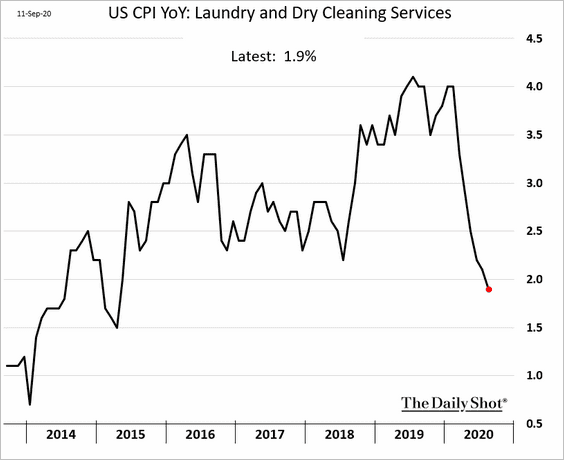
• These are challenging times for formal work attire retailers.
– Men’s suits:
– Women’s suits:
– Dry cleaning services:
——————–
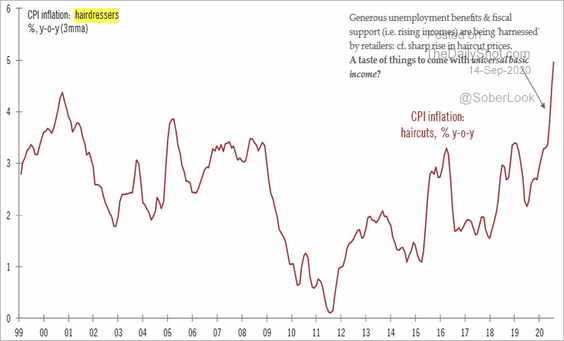
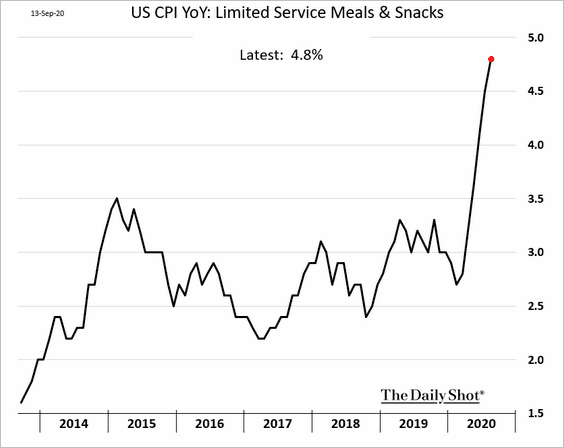
• Fast food restaurants have been boosting prices, as they face higher expenses.
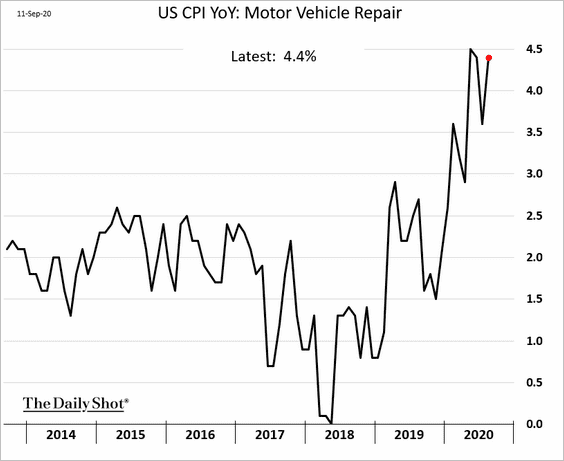
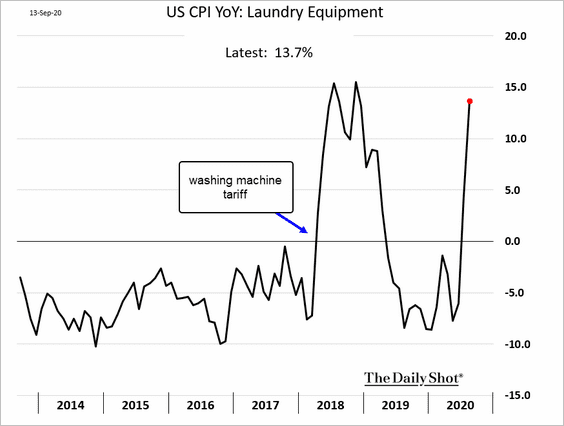
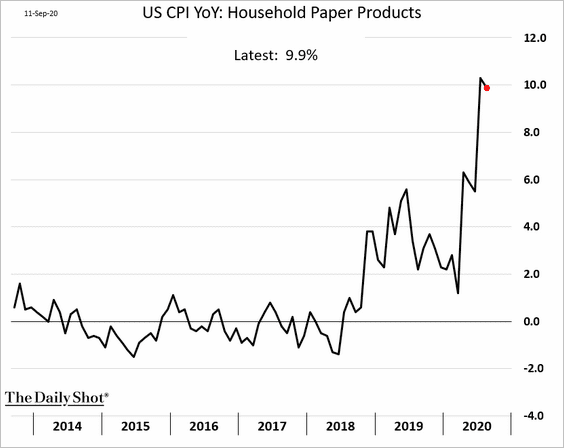
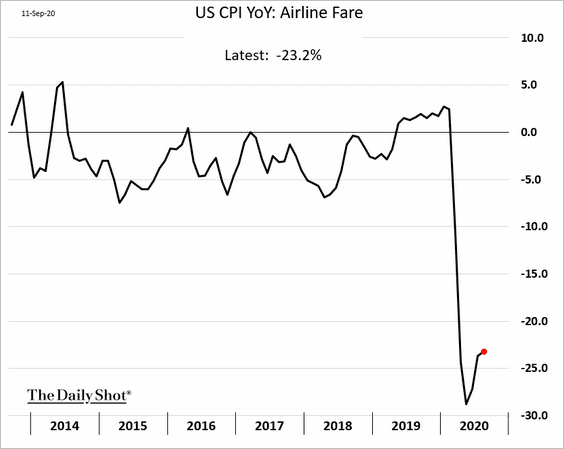
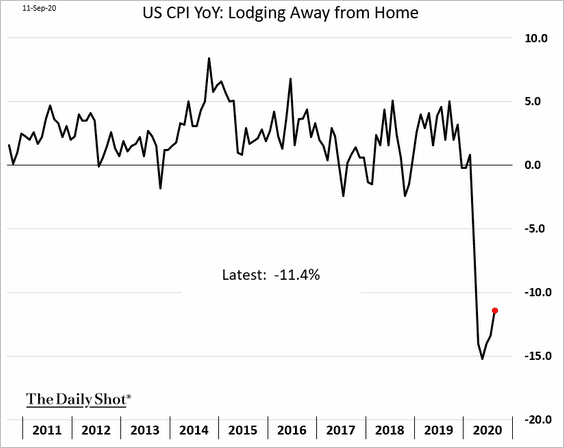
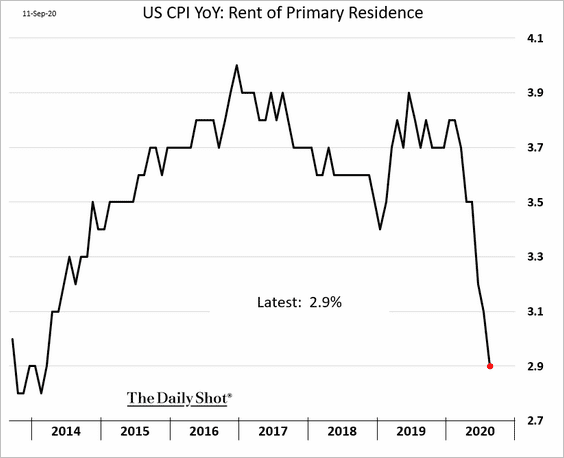
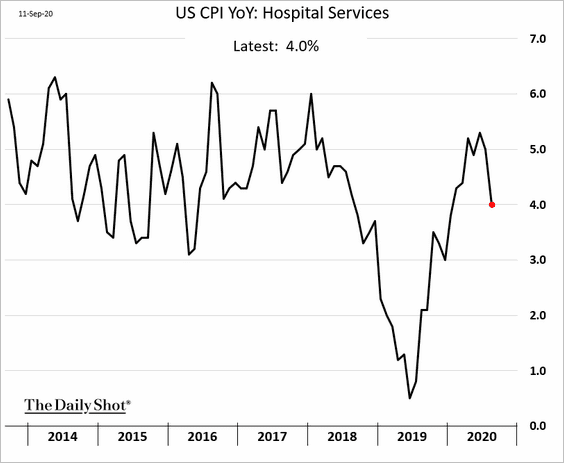
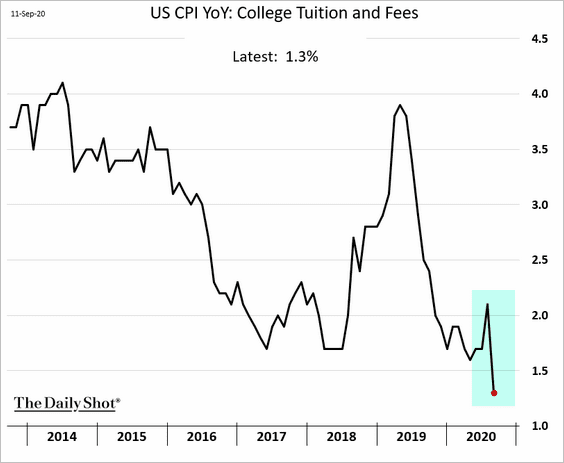
• Here are a few other CPI trends.
– Vehicle repair:
– Washing machines:
– Paper towels and toilet paper:
– Airline fare:
– Hotels:
– Rent:
– Hospital services:
– College tuition:
——————–
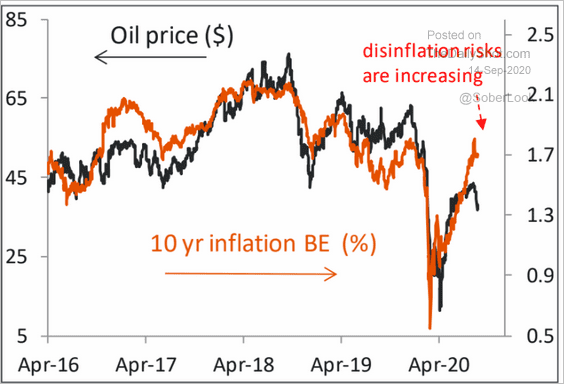
2. Given the recent weakness in oil prices, will market-based inflation expectations begin to turn lower?
 Source: Piper Sandler
3. US renters increasingly face evictions, and without further government support, the situation may worsen in the months ahead.
• As of early September, substantially fewer renters have made payments vs. last year.
![]() Source: Nomura Securities
Source: Nomura Securities
• Rent renewals are lower:
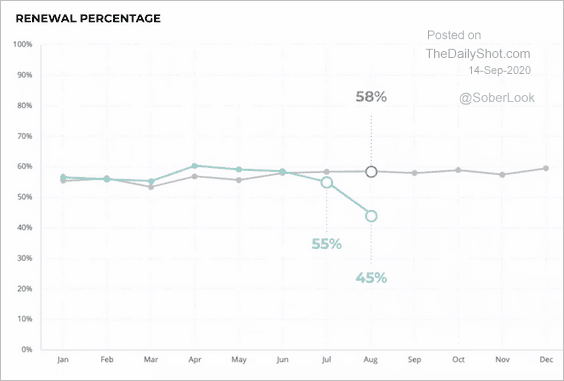 Source: NMHC
• Google search activity related to evictions is soaring.
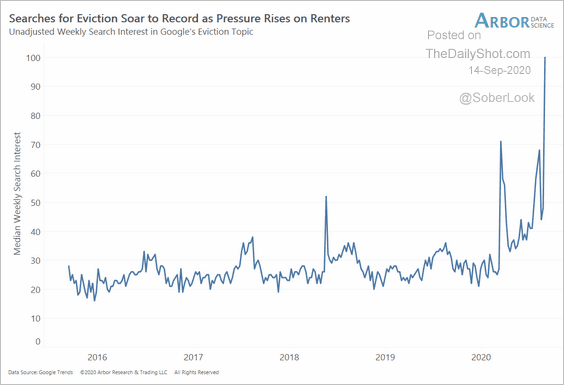 Source: Arbor Research & Trading
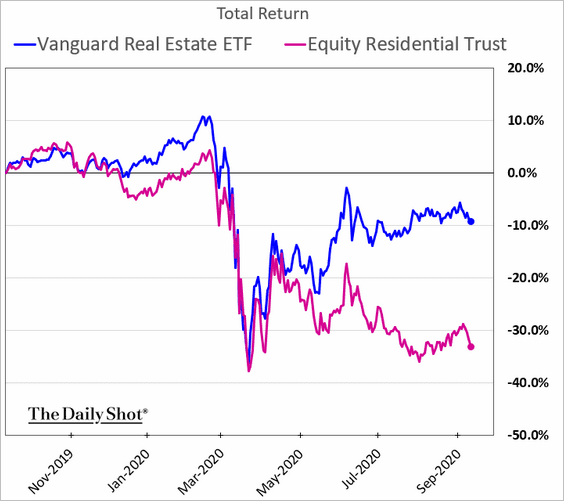
• The stock market shows the struggle of residential rental properties.
By the way, the situation isn’t a whole lot better for many homeowners.
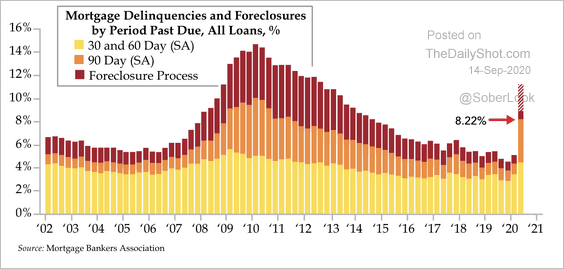 Source: Quill Intelligence
——————–
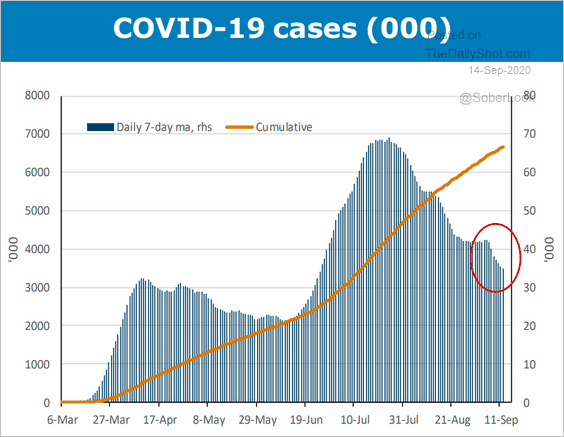
4. The ANZ activity tracker showed a rebound in recent days.
![]() Source: ANZ Research
Source: ANZ Research
However, most of that bounce has been due to falling new COVID cases.
 Source: ANZ Research
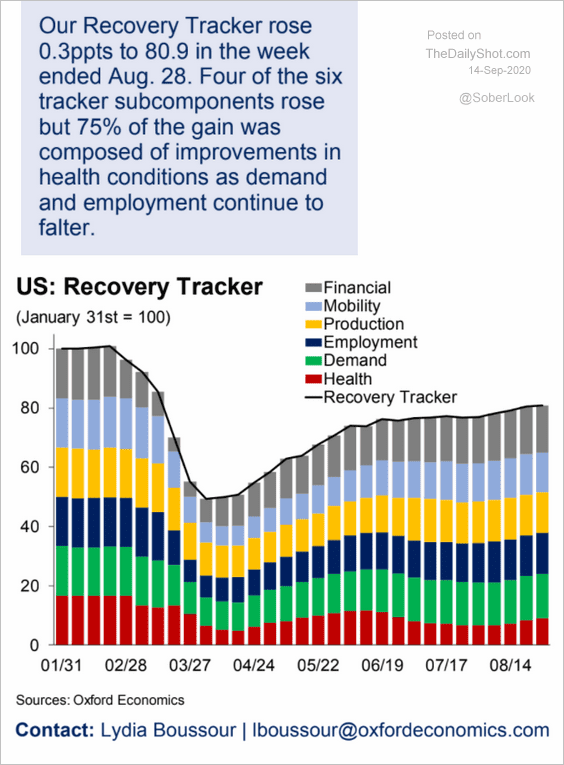
Outside of the health-related improvement, economic activity continues to tread water. Here is a comment from Oxford Economics.
 Source: Oxford Economics
——————–
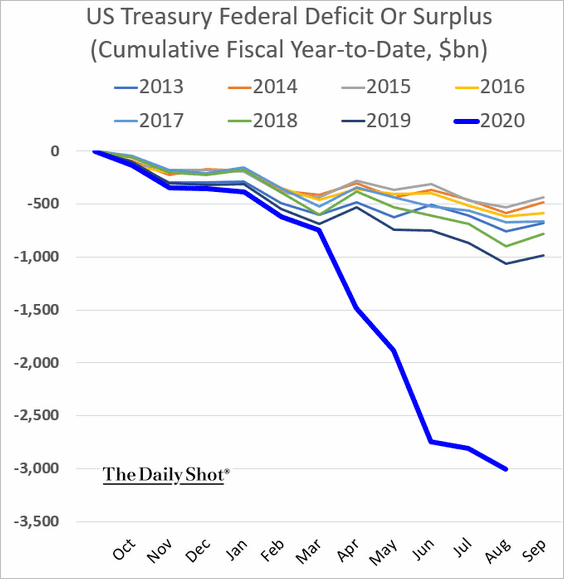
5. The US fiscal 2020 budget gap hit $3 trillion. The trajectory going forward will depend on whether we see a CARES 2 package.
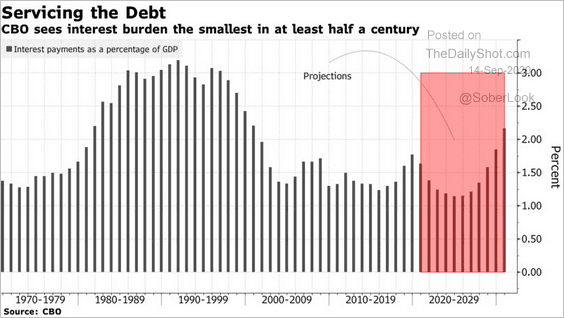
The good news is that the government’s interest burden is expected to decline over the next few years, helped by extraordinarily low Treasury yields.
 Source: @markets Read full article
Canada
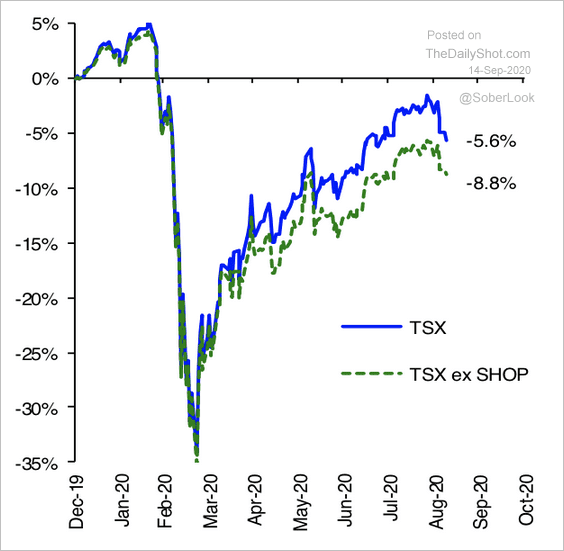
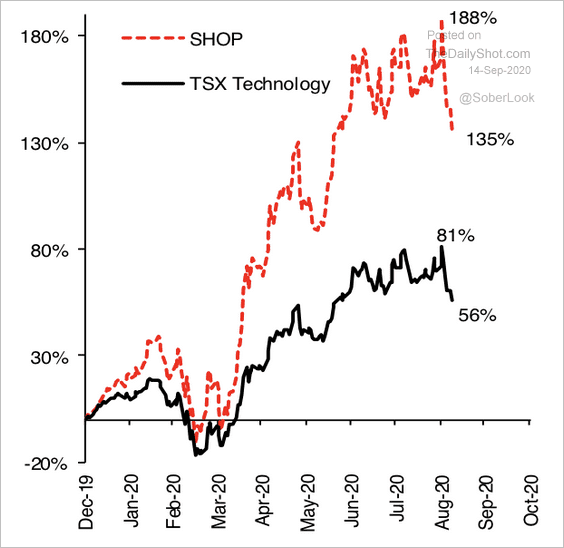
Shopify has been an outsize driver of Canada’s stock market performance, boosting TSX year-to-date returns by more than 3% (3 charts).
 Source: Hugo Ste-Marie, Portfolio & Quantitative Strategy Global Equity Research, Scotia Capital
 Source: Hugo Ste-Marie, Portfolio & Quantitative Strategy Global Equity Research, Scotia Capital
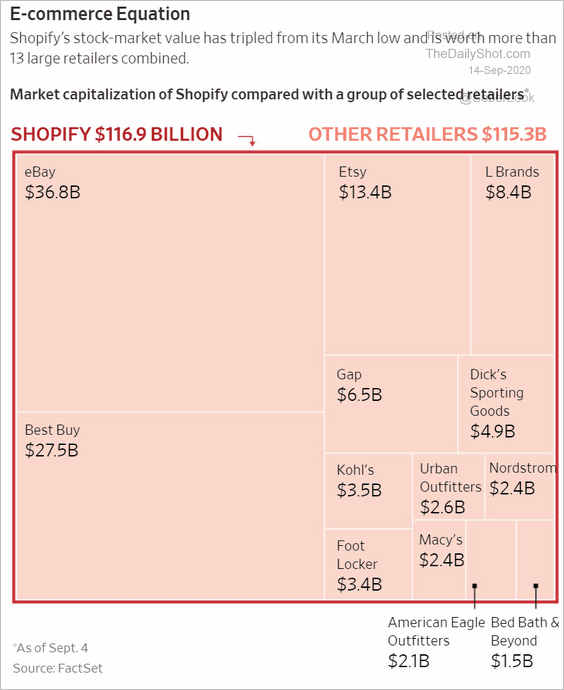 Source: @WSJ Read full article
The United Kingdom
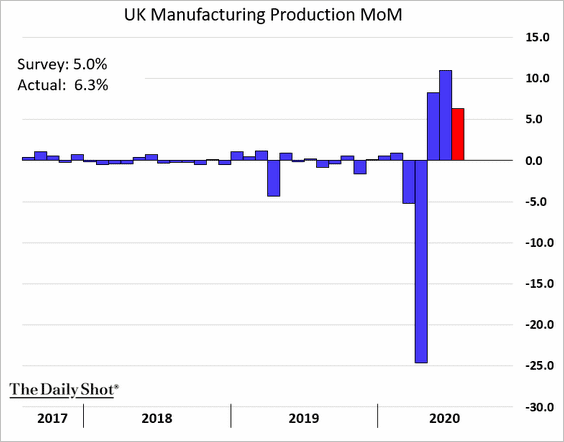
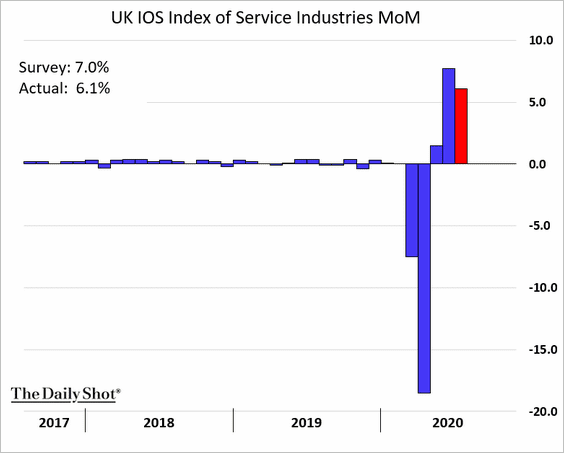
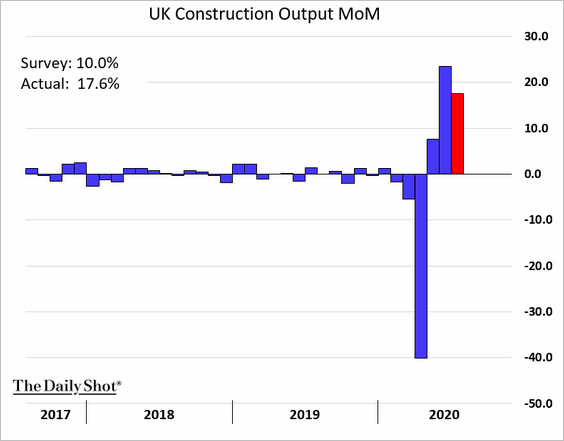
1. The July economic output indicators surprised to the upside.
• Manufacturing:
• Services:
• Construction:
2. Nonetheless, it’s a long road to recovery.
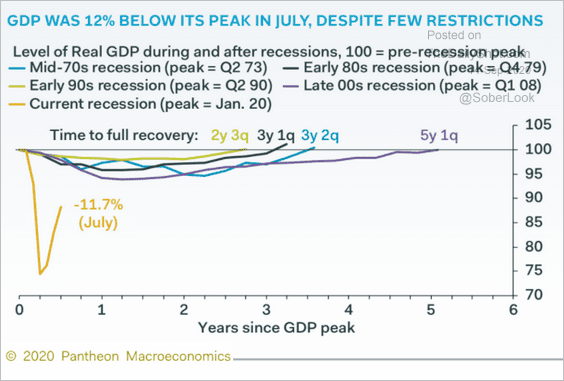 Source: Pantheon Macroeconomics
Here is the GDP by sector vs. February levels.
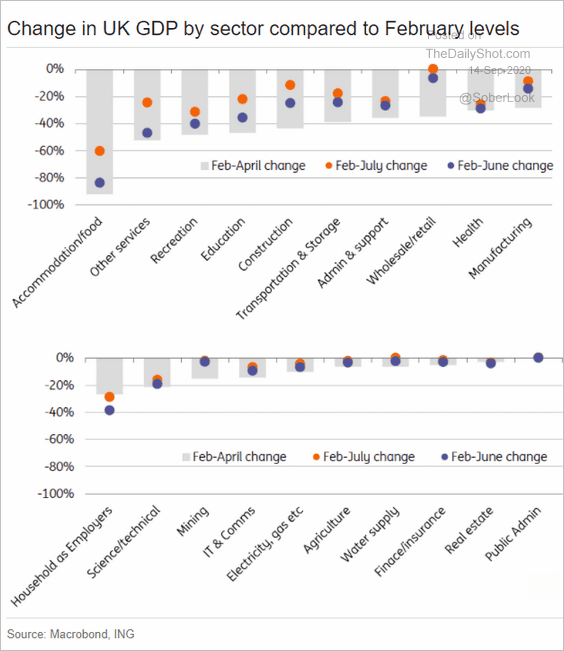 Source: ING
——————–
3. It’s been a tough few days for the pound.
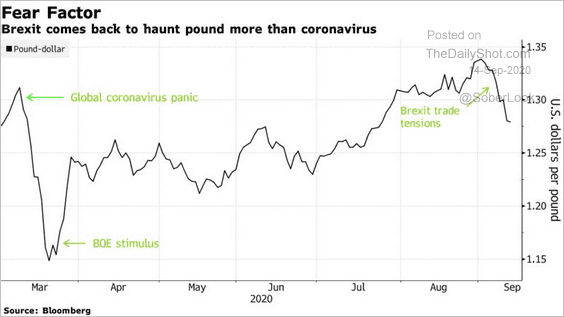 Source: @markets Read full article
However, the pound has more downside if we head toward a no-deal outcome with the EU.
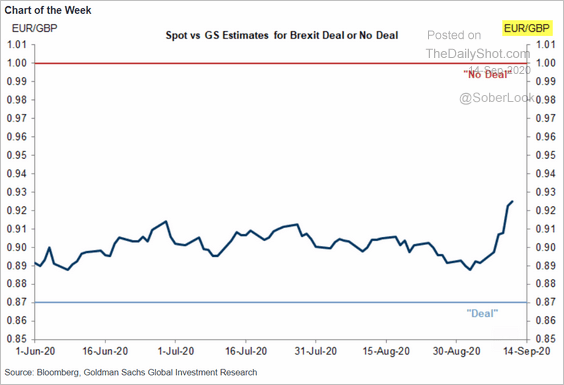 Source: Goldman Sachs
——————–
4. The UK sold six-month government bills at negative rates.
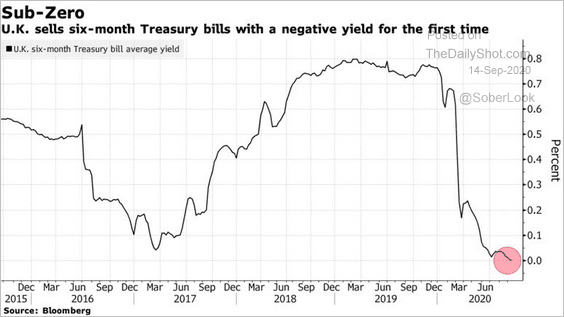 Source: @markets Read full article
The Eurozone
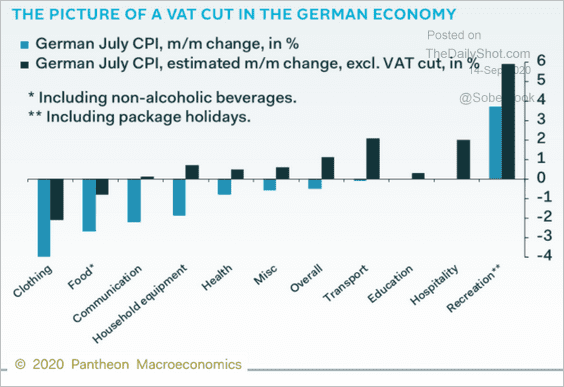
1. A substantial portion of Germany’s CPI decline was due to the VAT cut (2 charts).
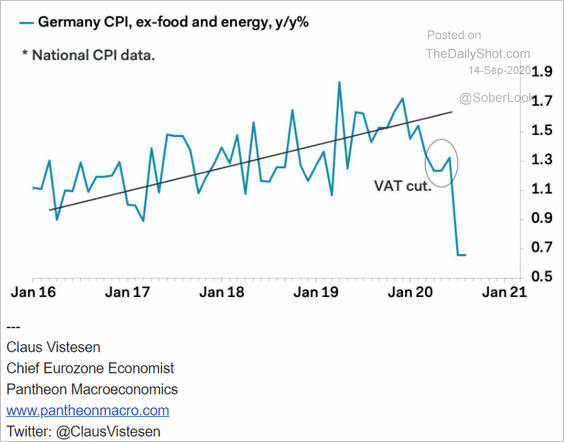 Source: Pantheon Macroeconomics
 Source: Pantheon Macroeconomics
Here is the proportion of the Eurozone CPI components that are declining.
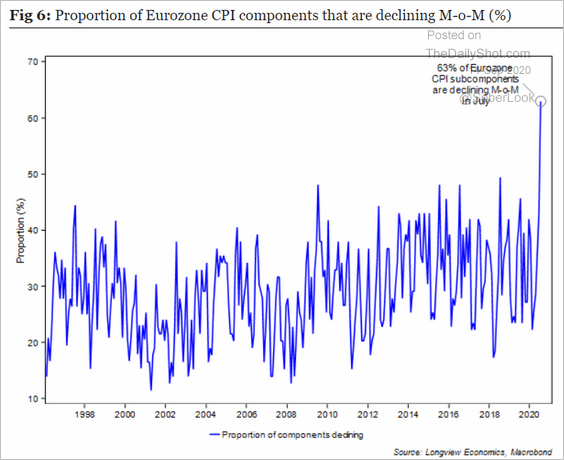 Source: Longview Economics
——————–
2. Household bank deposits rose sharply recently (year-over-year).
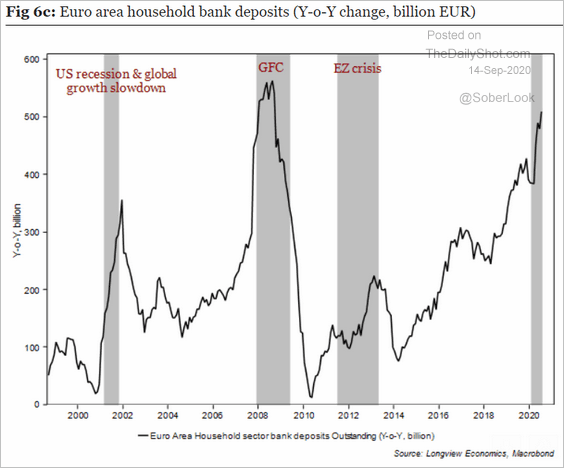 Source: Longview Economics
Here are the absolute levels by country.
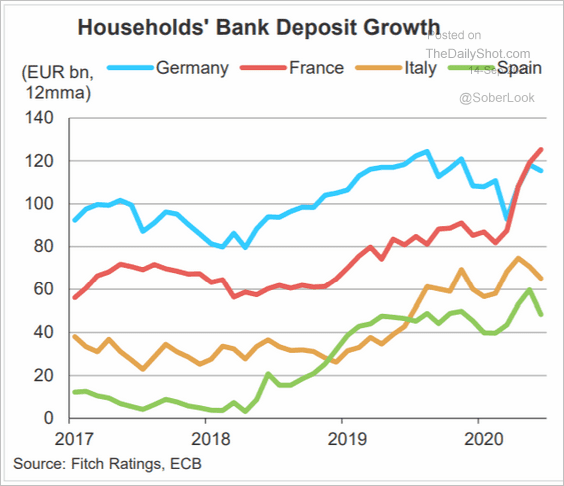 Source: Fitch Ratings
——————–
3. This chart shows the evolution of payment methods in the Eurozone.
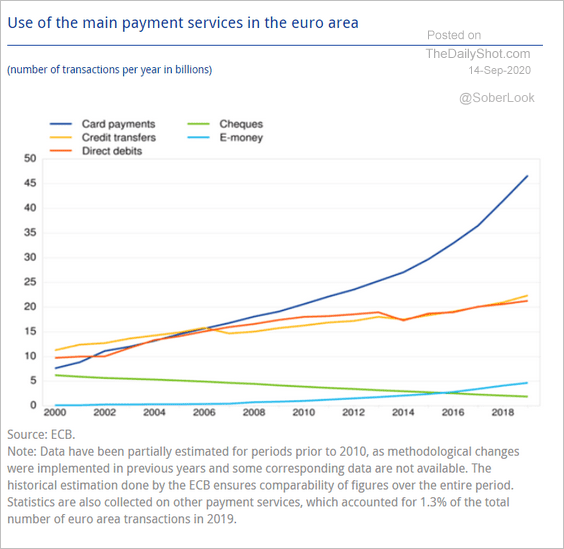 Source: EC Read full article
4. How much of the recent corporate credit expansion was driven by bank loans vs. bonds?
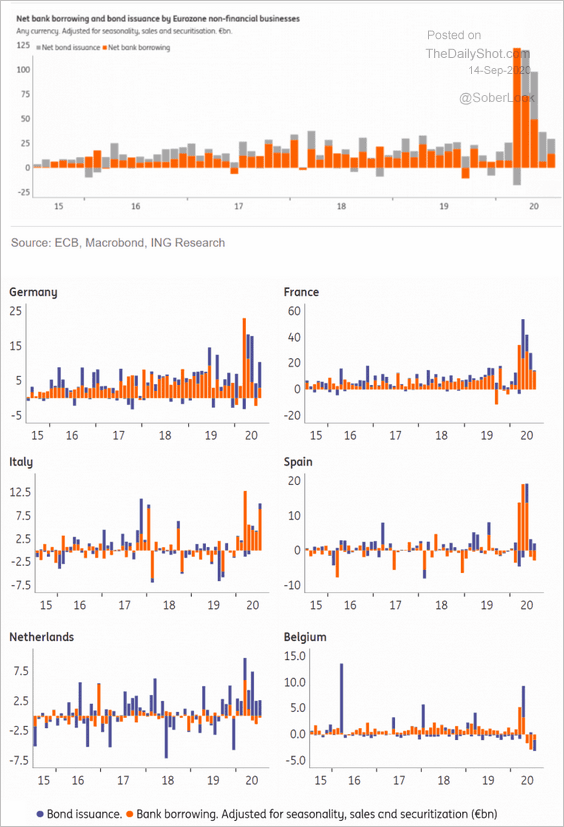 Source: ING
5. Germany is highly exposed to the auto sector.
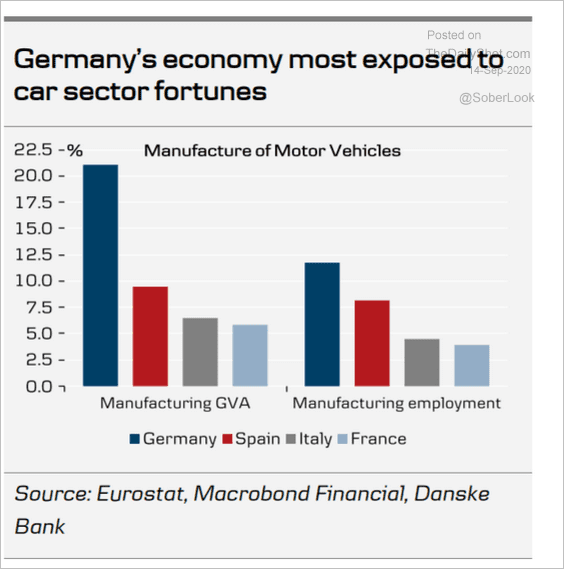 Source: Danske Bank
According to Danske Bank, the automotive sector’s economic importance rose substantially since the GFC.
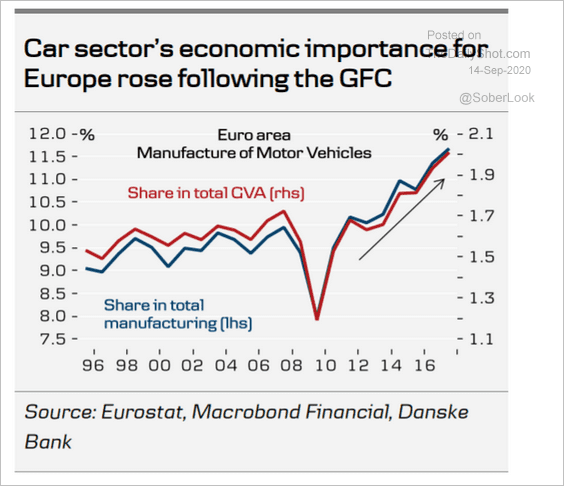 Source: Danske Bank
The industry is undergoing a shift toward hybrid/electric vehicles.
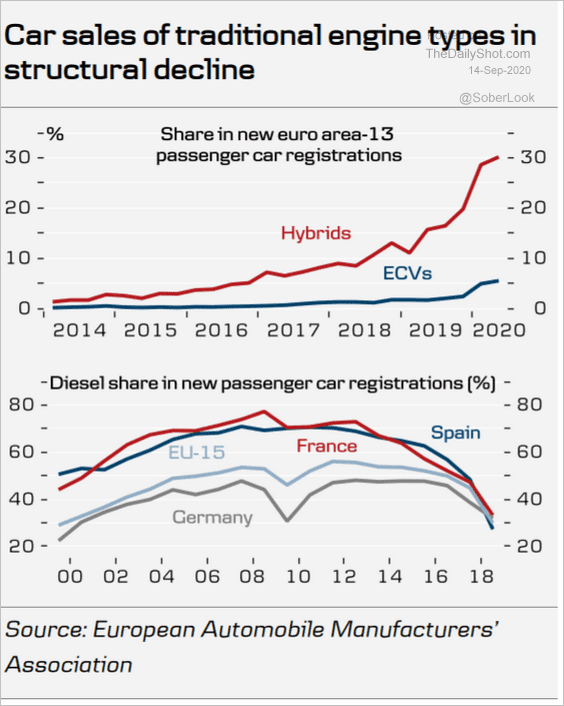 Source: Danske Bank
——————–
6. The STOXX 600 index has been testing resistance at its 200-day moving average.
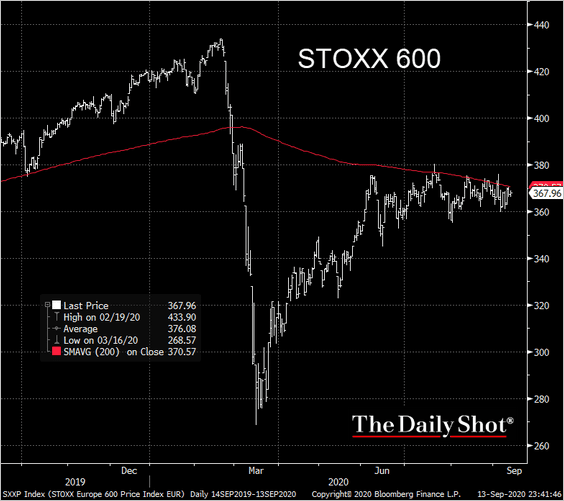 Source: @TheTerminal, Bloomberg Finance L.P., h/t Longview Economics Research
Asia – Pacific
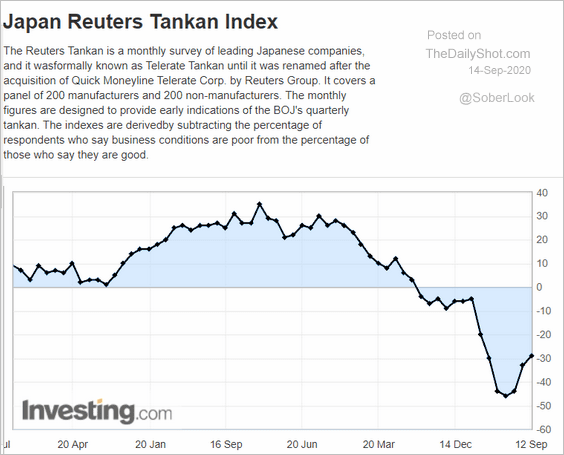
1. Japan’s Reuters Tankan index shows the nation’s business activity is gradually recovering. But it will be a while before we get to pre-COVID levels.
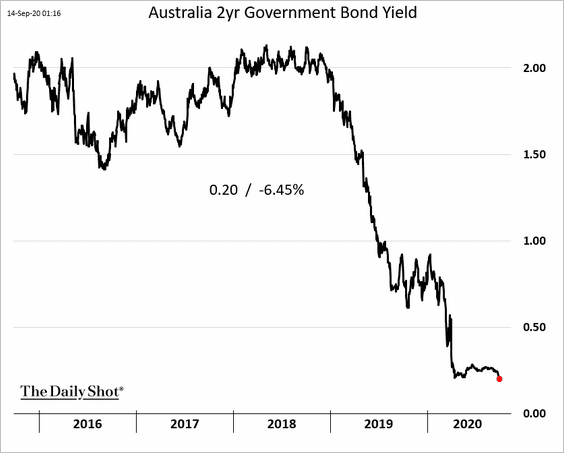
2. Australia’s 2yr bond yield hit a record low.
Separately, restaurant bookings have been recovering outside of Victoria.
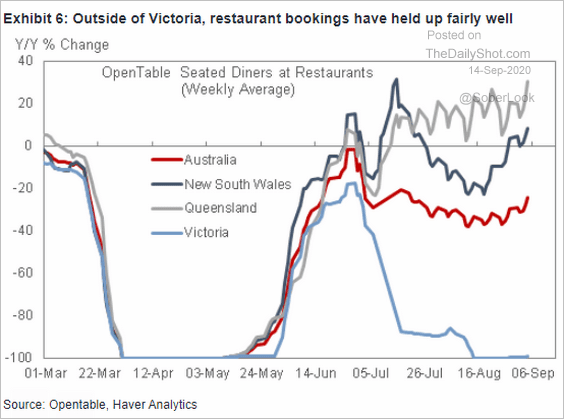 Source: Goldman Sachs
——————–
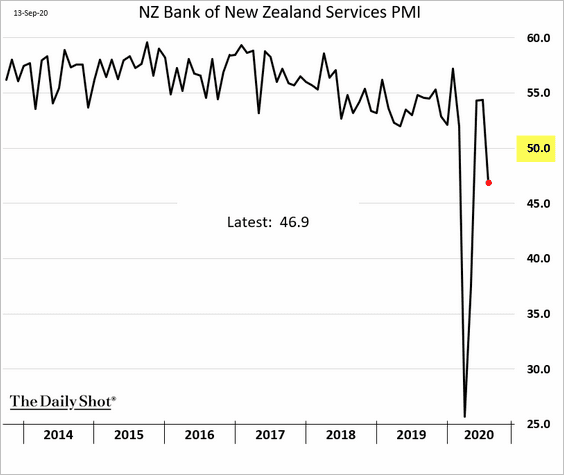
3. New Zealand’s service sector is back in contraction mode.
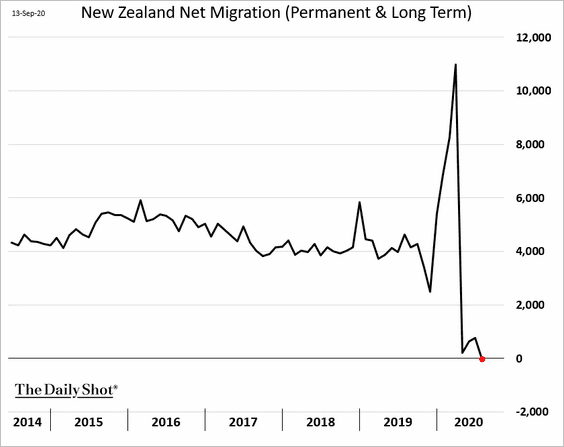
Net migration is at zero.
China
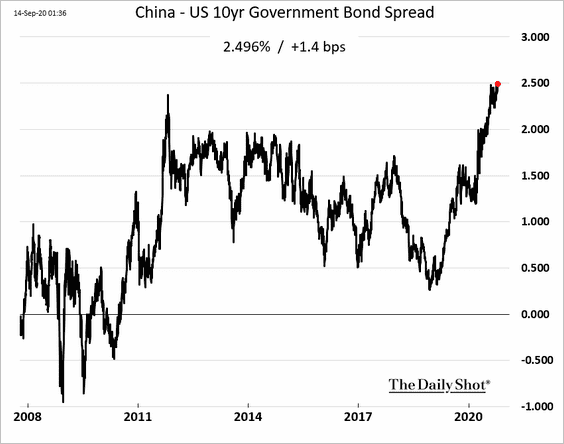
1. Bond yields continue to grind higher.
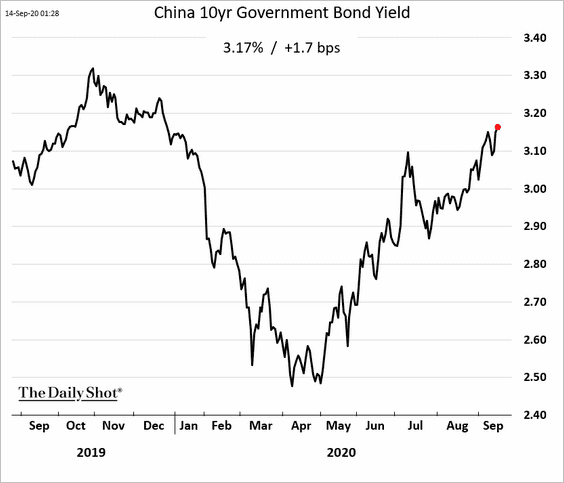
The 10yr spread between China and the US hit a multi-year high.
——————–
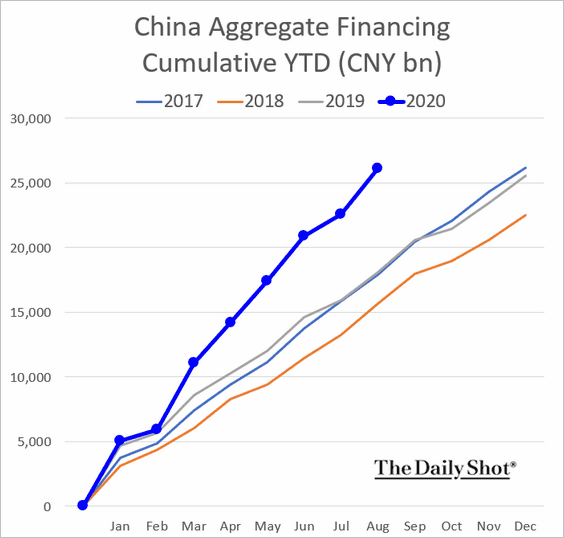
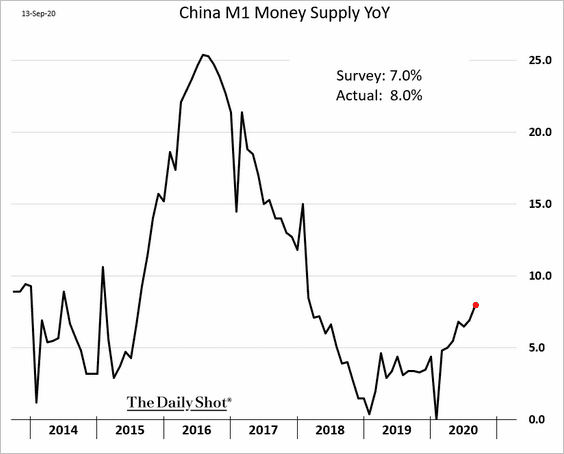
2. Credit expansion remains robust, with bank loans running well ahead of last year’s levels.
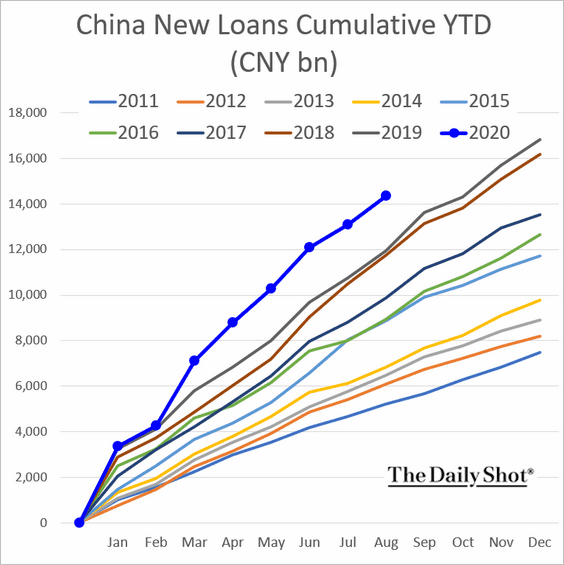
Aggregate financing has accelerated as government bond issuance picked up last month (2nd chart).
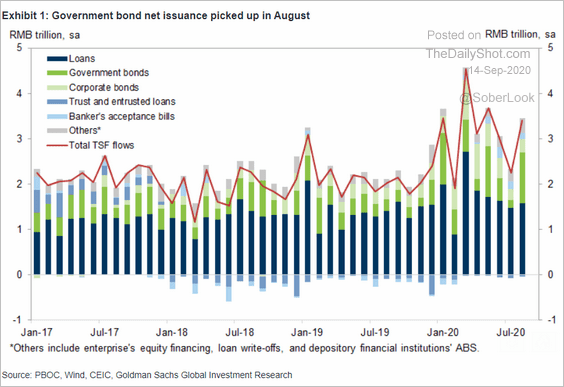 Source: Goldman Sachs
The M1 (narrow) money supply expansion surprised to the upside.
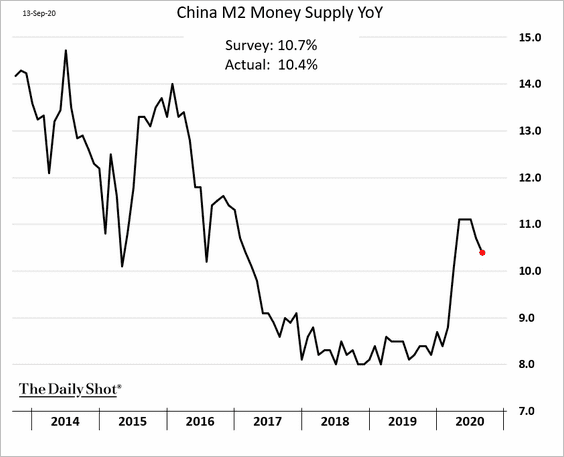
But the M2 (broad) money supply growth slowed.
——————–
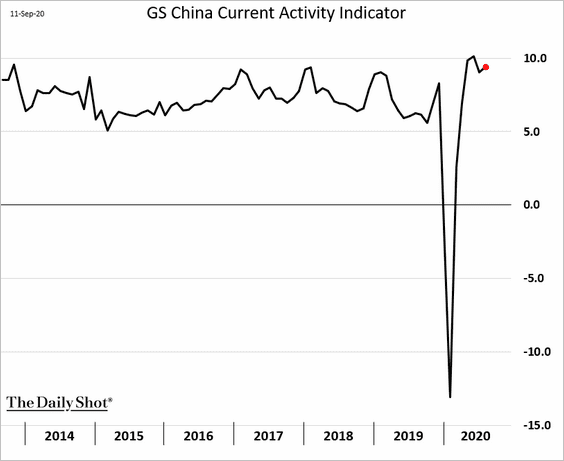
3. Here is Goldman’s China current activity indicator (CAI).
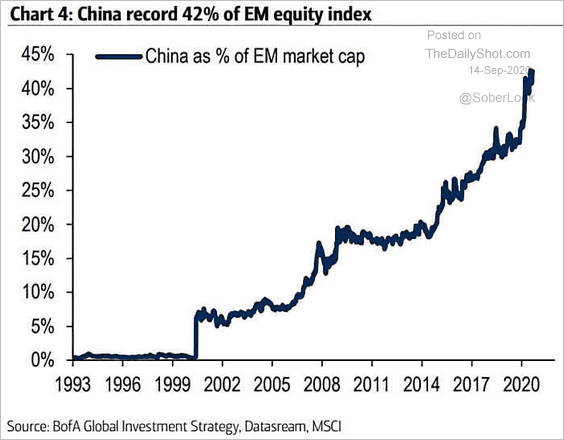
4. China is now 42% of the EM market cap.
 Source: @ISABELNET_SA, @BofAML
Emerging Markets
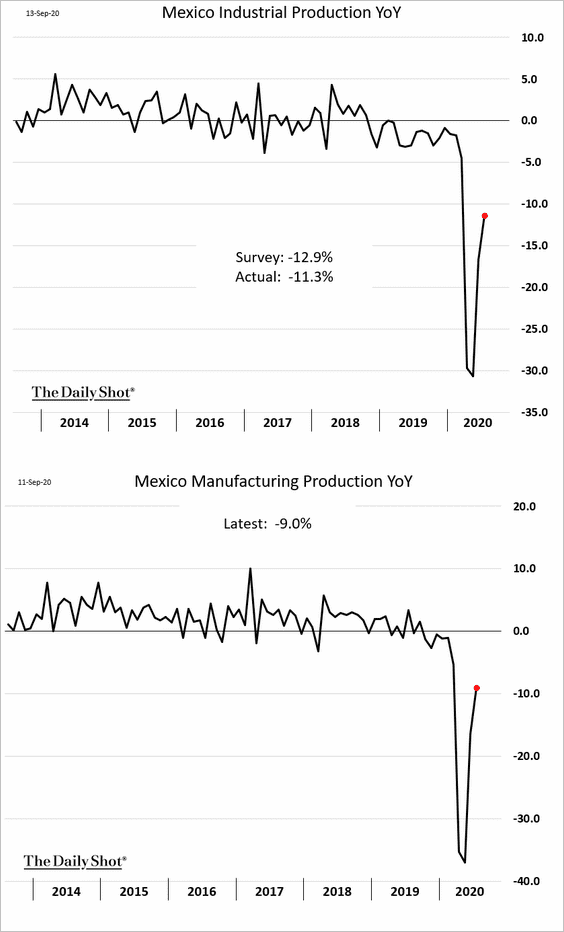
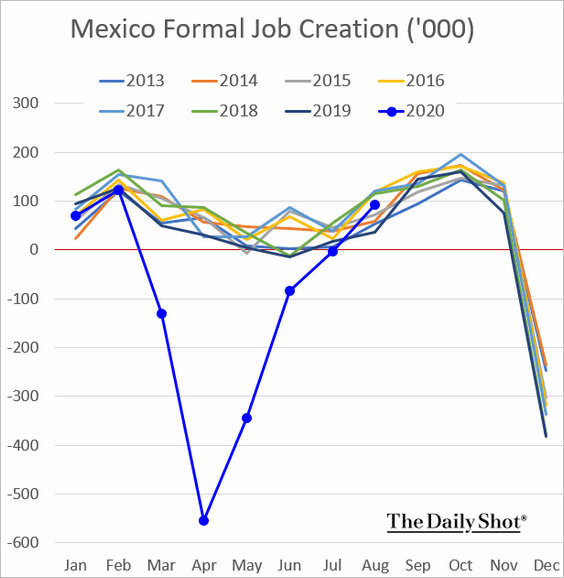
1. Mexico’s industrial production continues to recover.
Official job creation is back at pre-crisis levels.
——————–
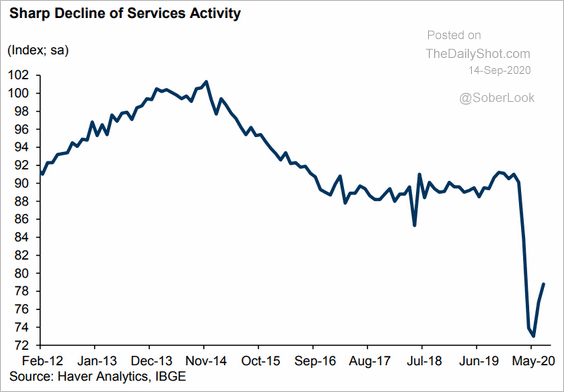
2. Brazil’s service sector activity remains soft,
 Source: Goldman Sachs
The nation’s real policy rate is now negative, and analysts think that the central bank is on hold for a while.
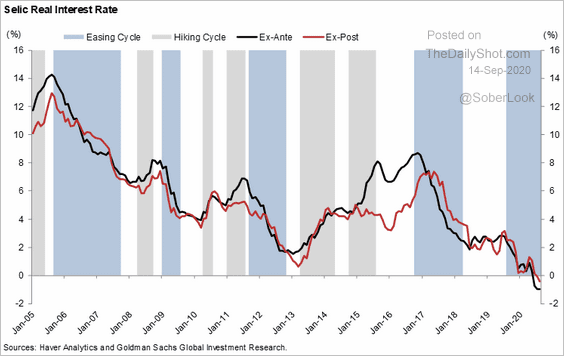 Source: Goldman Sachs
——————–
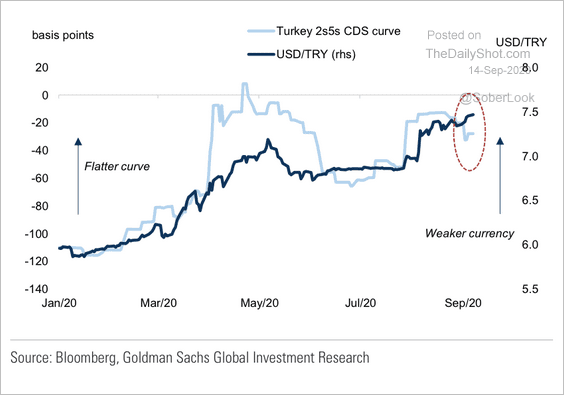
3. The Turkish lira has continued to weaken, whereas the credit default swap (CDS) curve has steepened slightly.
 Source: Goldman Sachs
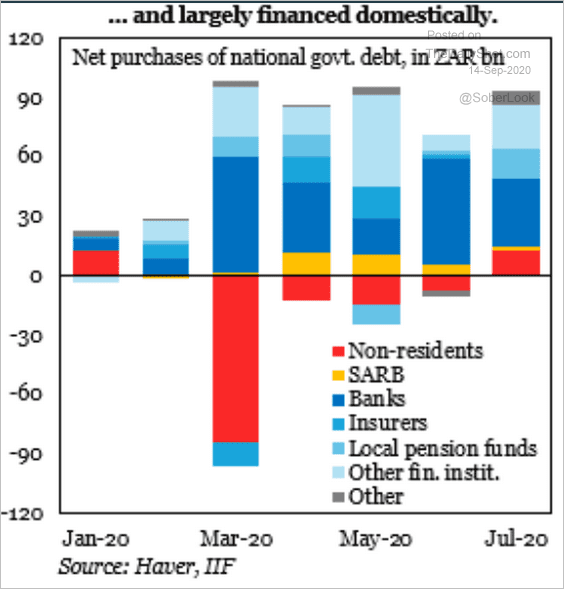
4. South Africa’s budget gap (see chart) is largely financed domestically.
 Source: @IIF, @elinaribakova, @BHilgenstockIIF
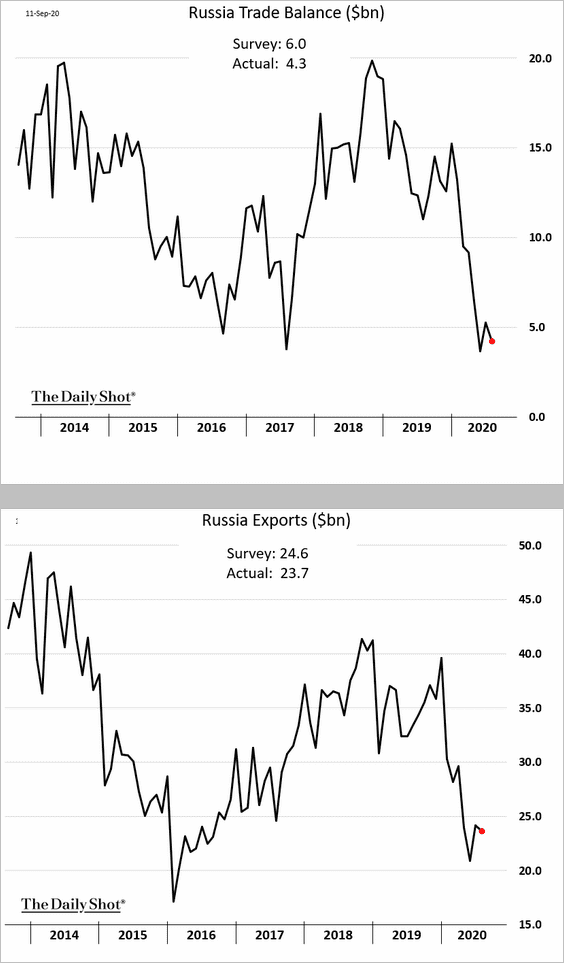
5. Russia’s exports remain soft.
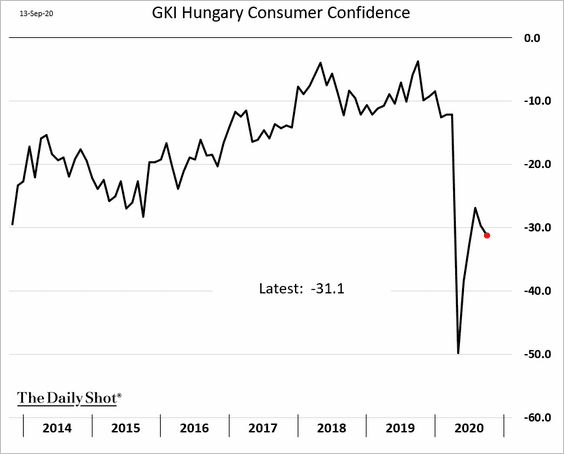
6. Hungarian consumer confidence is deteriorating again.
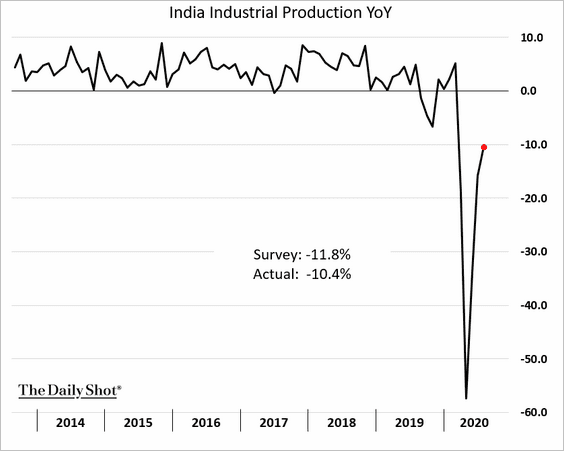
7. India’s industrial output is recovering from this year’s collapse.
Commodities
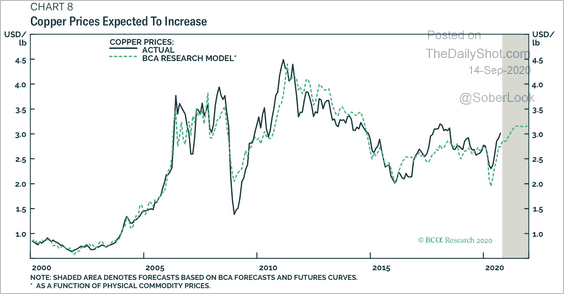
1. BCA Research expects higher copper prices.
 Source: BCA Research
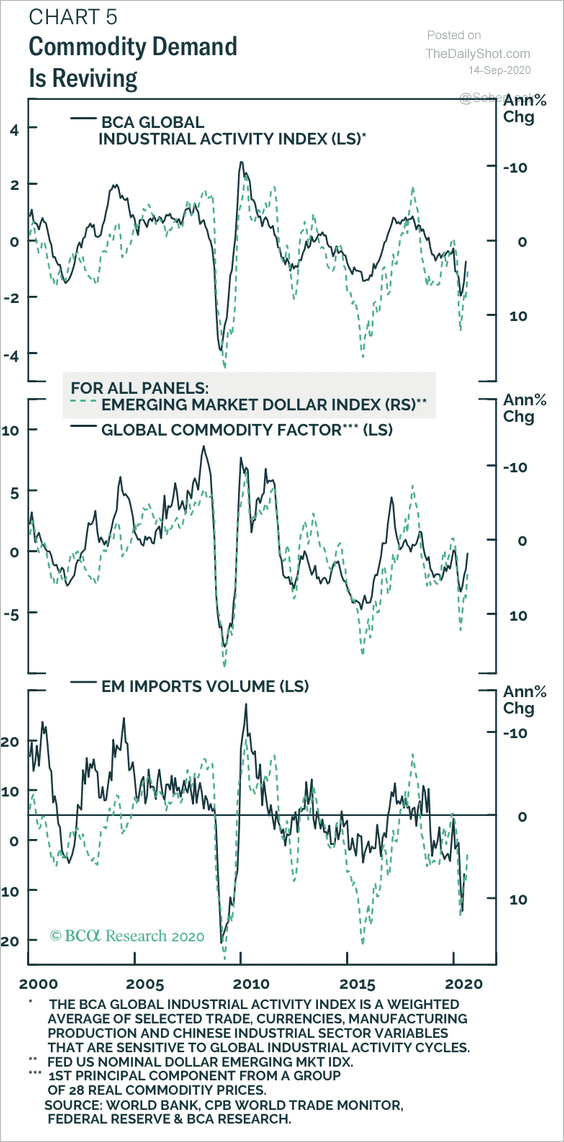
The rebound in global industrial activity is fueling demand for commodities.
 Source: BCA Research
——————–
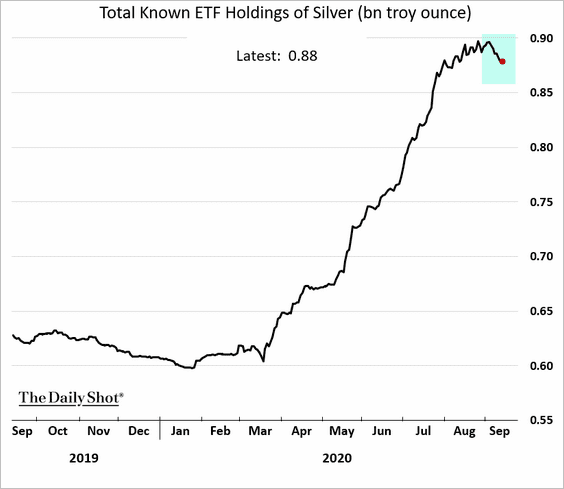
2. ETFs’ holdings of silver have peaked for now.
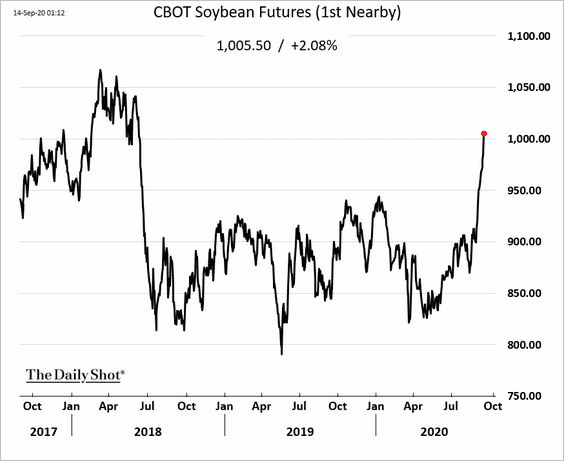
3. Last week’s bullish USDA supply/demand and WASDE reports sent US soy futures above $10/bushel for the first time in over two years.
 Source:
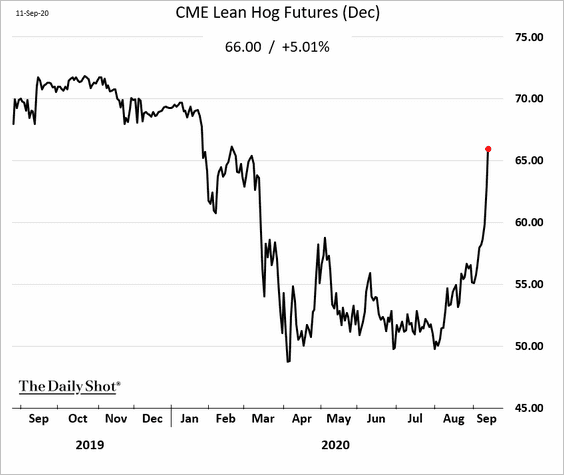
4. Hog futures in Chicago hit another limit-up.
 Source: The Pig Site Read full article
Energy
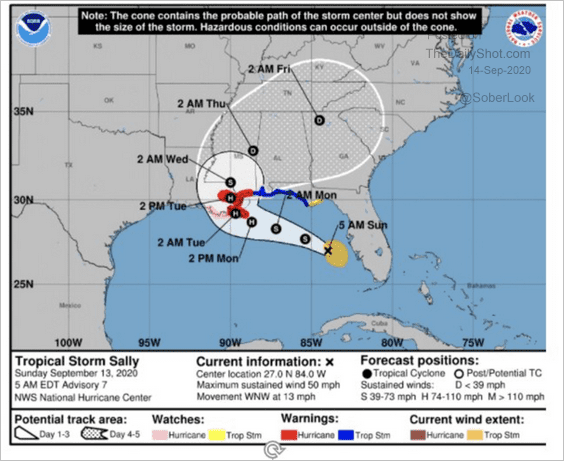
1. Tropical storm Sally is expected to reach hurricane category 2 when it makes landfall late Monday night around New Orleans.
 Source: @Energy_Tidbits
US Gulf operators are preparing by shutting down facilities.
 Source: Argus Media Read full article
——————–
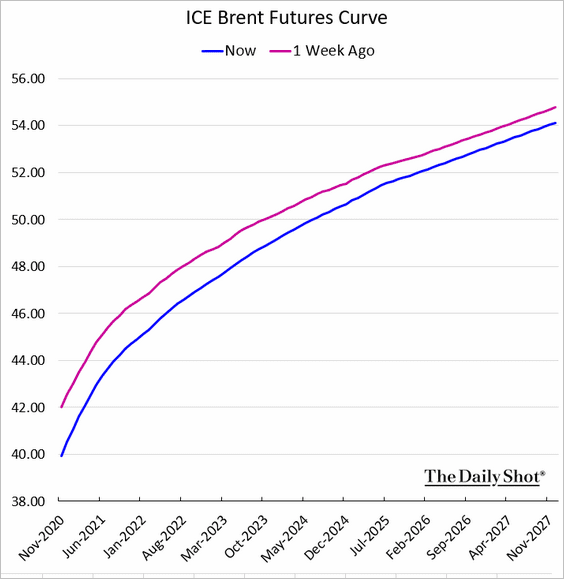
2. The Brent curve has been moving into contango, and floating storage activity is picking up again.
3. US refinery inputs are running well below the 5-year range.
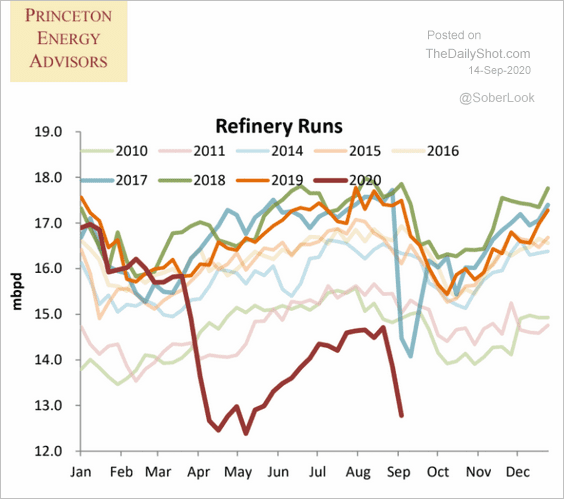 Source: Princeton Energy Advisors
Equities
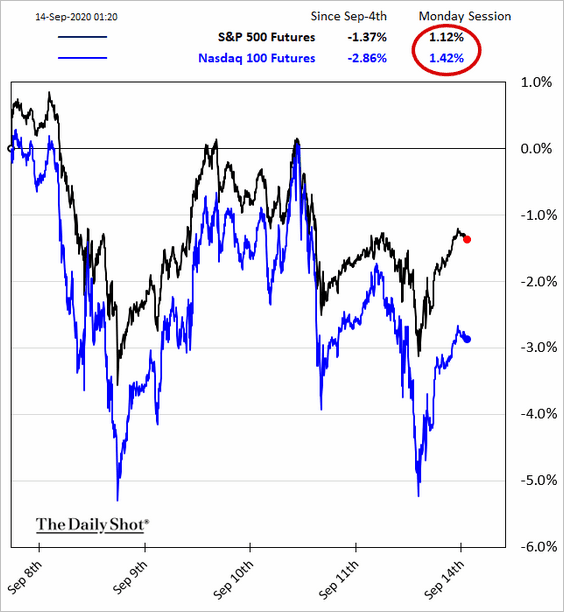
1. US stock futures are up sharply, signaling a rebound on Monday.
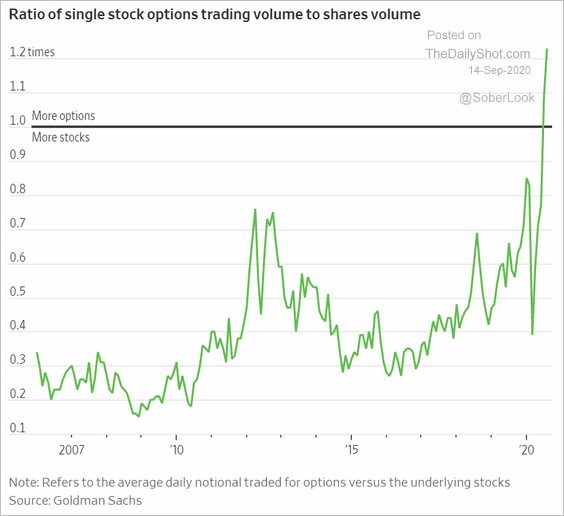
2. The options frenzy has been extreme.
• The options-to-shares volume ratio:
 Source: @WSJ Read full article
• Retail investors driving demand for short-term options:
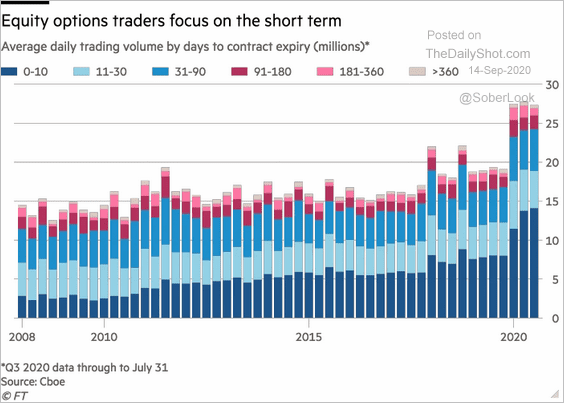 Source: @financialtimes Read full article
Options traders have pulled back some in recent days but remain aggressively long the market.
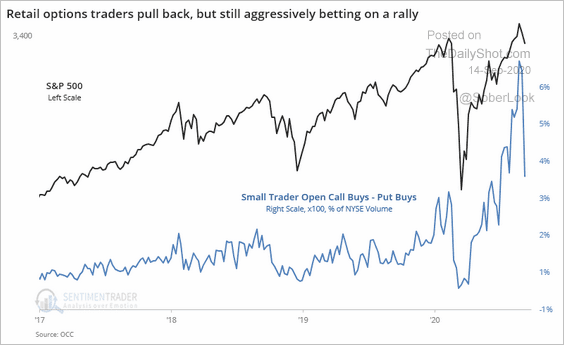 Source: @sentimentrader
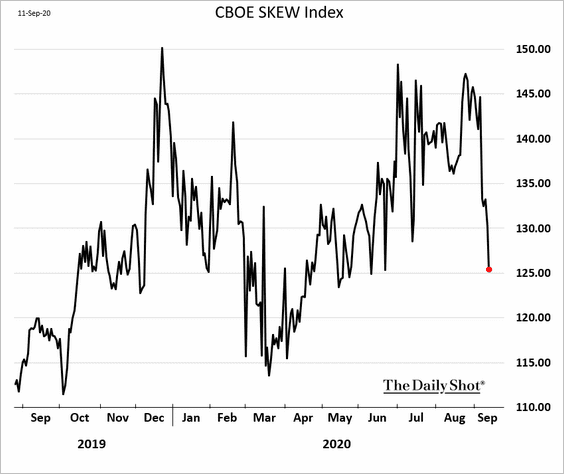
We can see the pullback in the CBOE Skew Index. Option speculation is likely to accelerate again in the days ahead.
By the way, how significant was Softbank’s options trading?
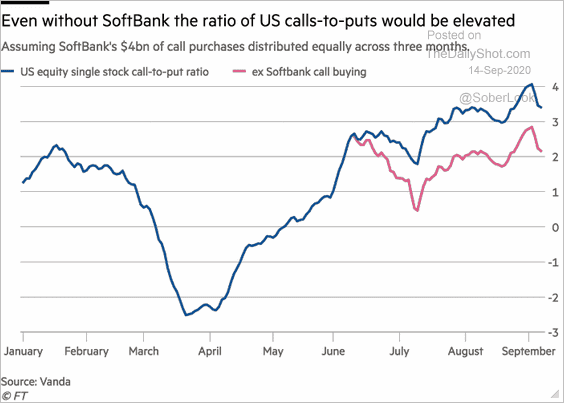 Source: @financialtimes Read full article
——————–
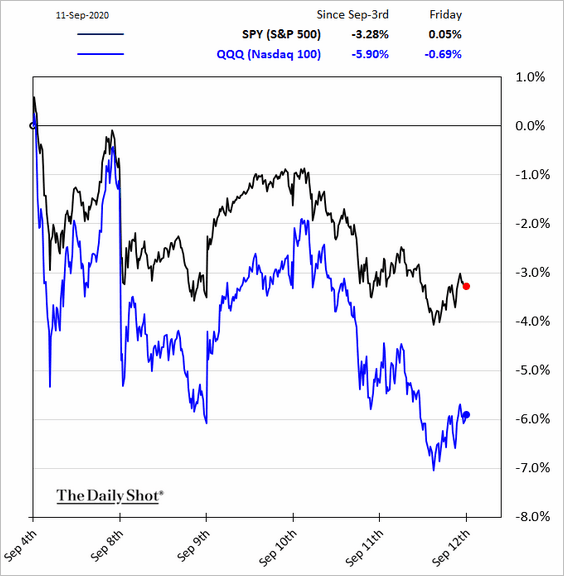
3. Next, we have some updates on the Nasdaq Composite and the Nasdaq 100.
• Relative performance last week:
• Elevated volatility:
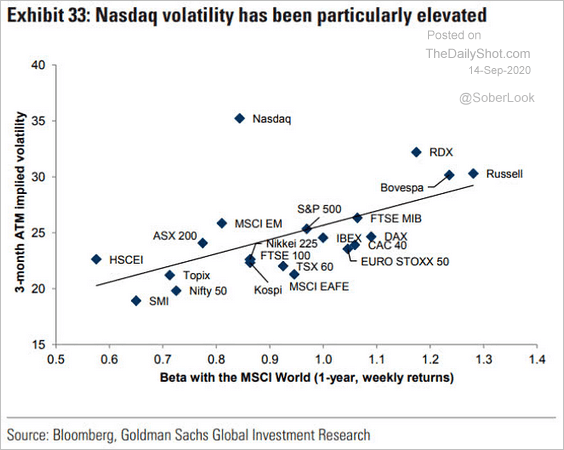 Source: @ISABELNET_SA, @GoldmanSachs
• The 3-day move relative to vol:
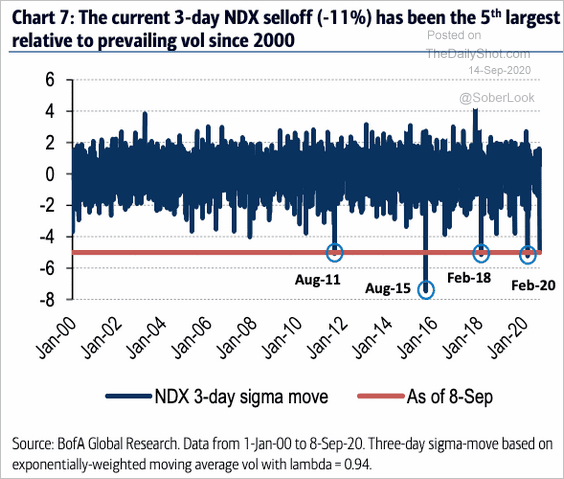 Source: @ISABELNET_SA, @BofAML
• The Nasdaq 100 vs. the 200-day moving average:
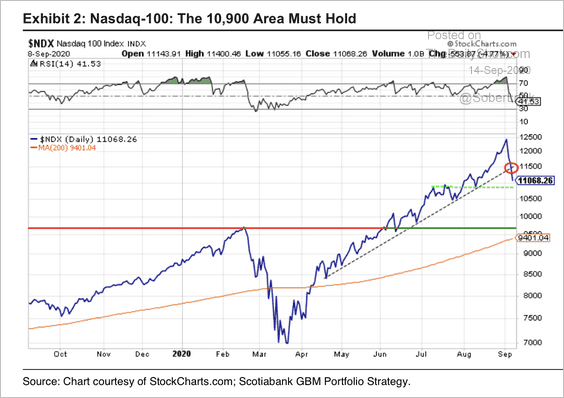 Source: Hugo Ste-Marie, Portfolio & Quantitative Strategy Global Equity Research, Scotia Capital
——————–
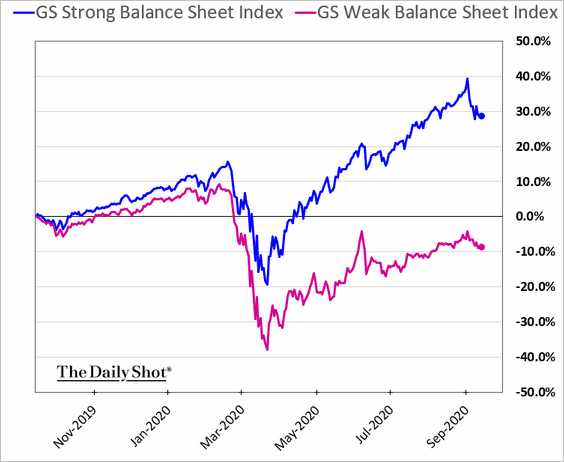
4. Companies with weaker balance sheets have underperformed this year (2 charts).
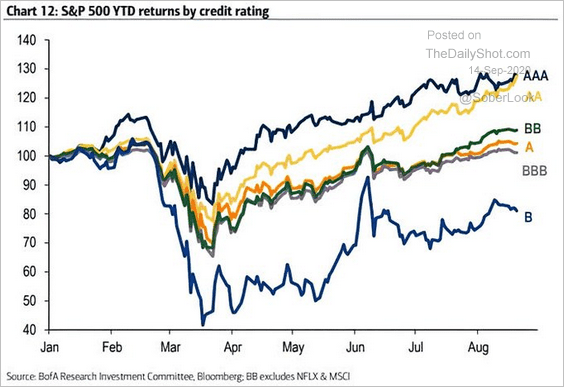 Source: @ISABELNET_SA, @BofAML
Credit
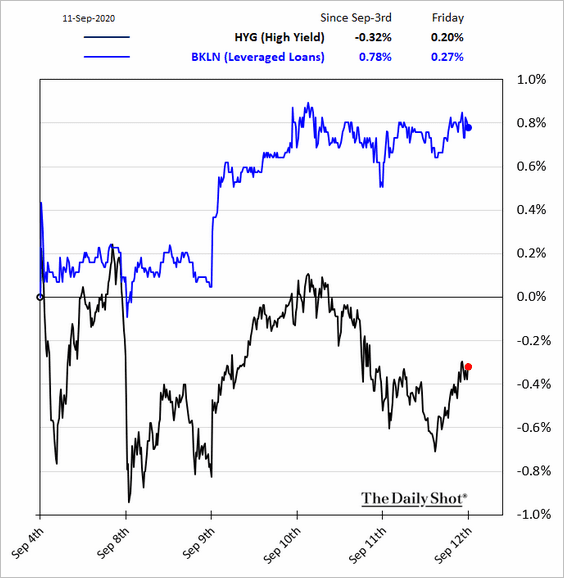
1. Leveraged loans outperformed high yield bonds last week.
2. This graphic shows the average yield by sector vs. bond duration.
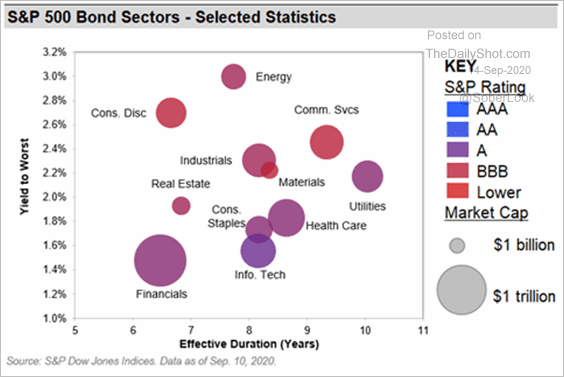 Source: S&P Global Market Intelligence
3. The global corporate debt market credit quality has been deteriorating over the past few decades.
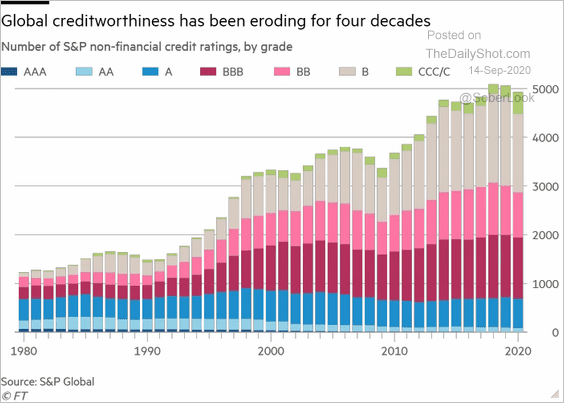 Source: @financialtimes, h/t @ISABELNET_SA Read full article
——————–
Food for Thought
1. US teen employment trend:
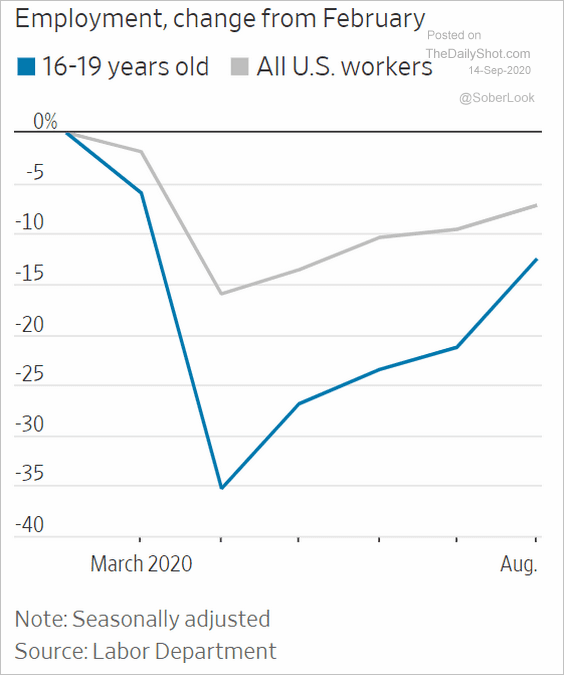 Source: @WSJ Read full article
2. Apple vs. Android:
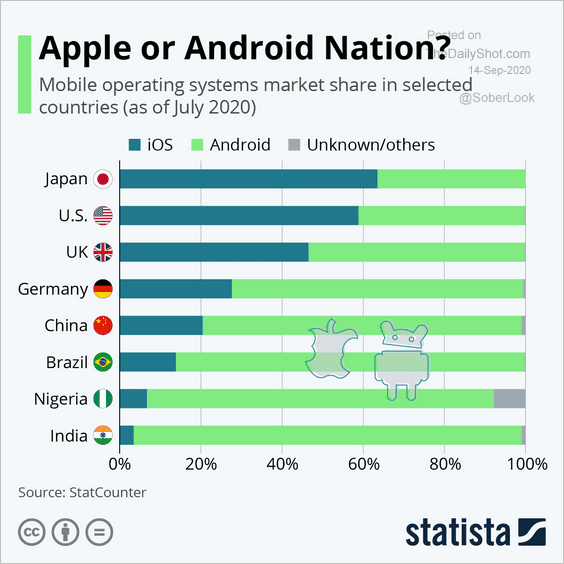 Source: Statista
3. US nonvoters in battleground states:
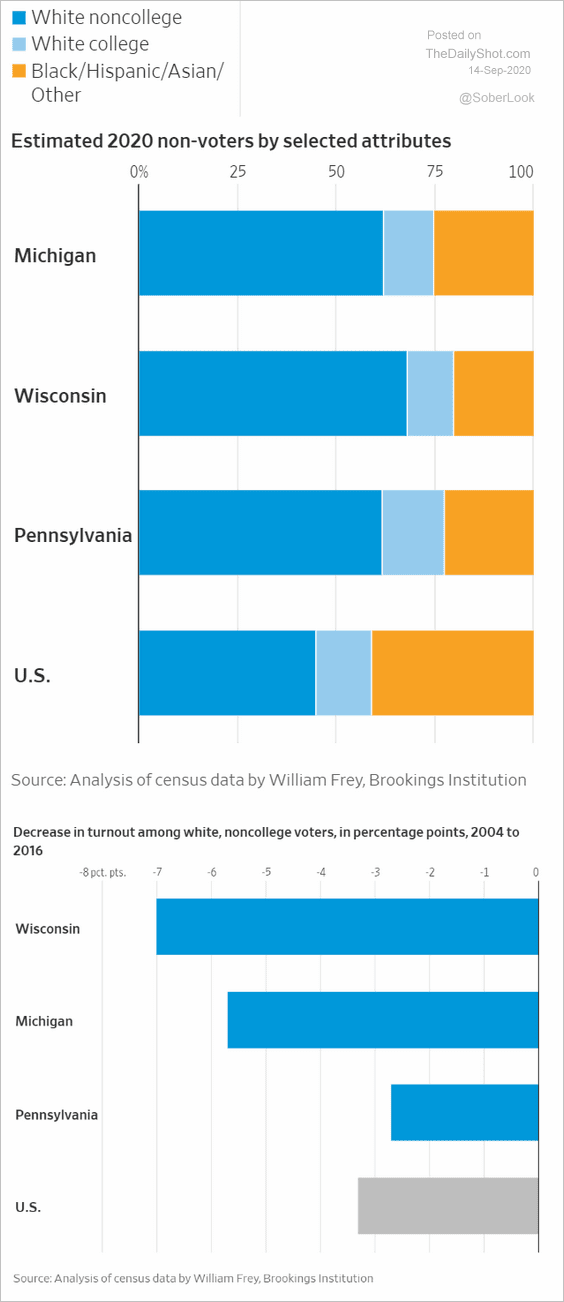 Source: @WSJ Read full article
4. Views on the economy:
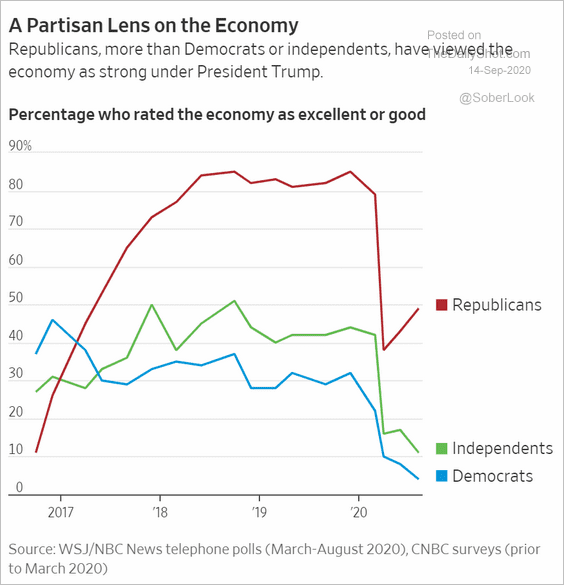 Source: @WSJ Read full article
5. Global fish stocks:
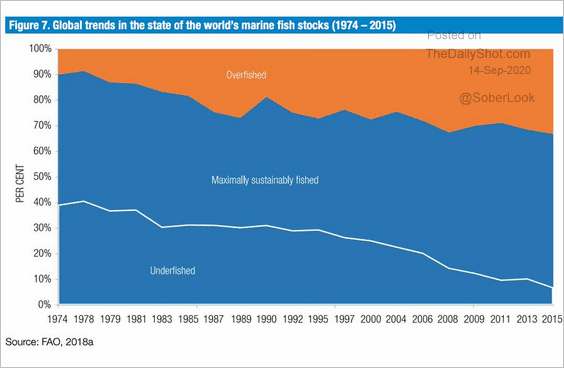 Source: @adam_tooze Read full article
6. Losing old trees:
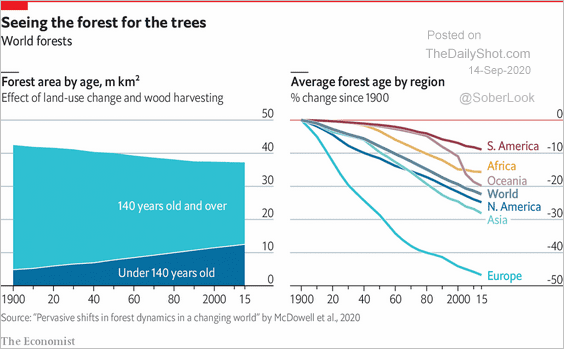 Source: The Economist Read full article
7. Attitudes toward vaccination:
• Globally:
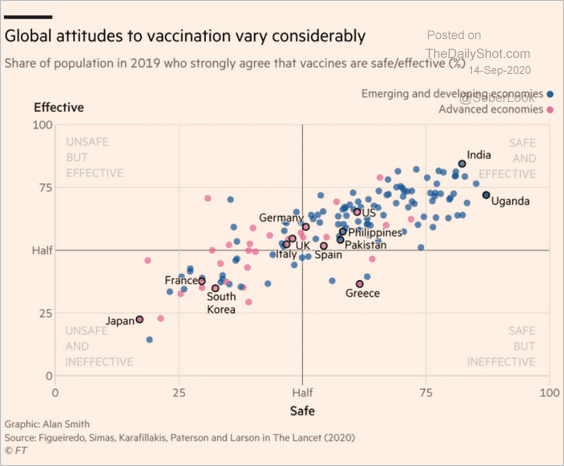 Source: @financialtimes Read full article
• In the US:
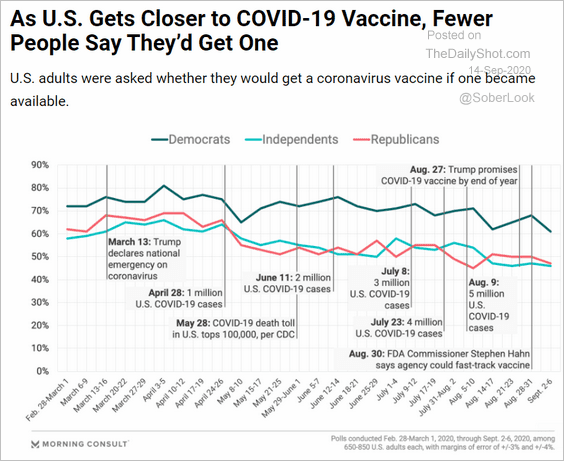 Source: Morning Consult Read full article
——————–
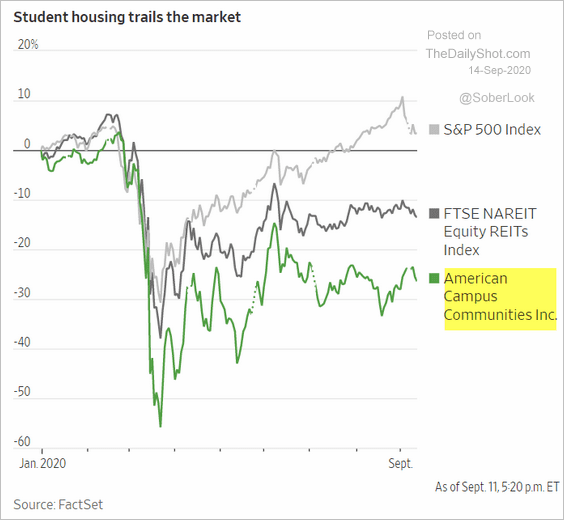
8. Struggling student housing rentals:
 Source: @WSJ Read full article
9. The original (129-year-old) patent for toilet paper:
 Source: Science Alert Read full article
——————–