
The Daily Shot: 22-Sep-20
• The United States
• The United Kingdom
• The Eurozone
• Asia – Pacific
• China
• Emerging Markets
• Cryptocurrency
• Commodities
• Energy
• Equities
• Credit
• Food for Thought
The United States
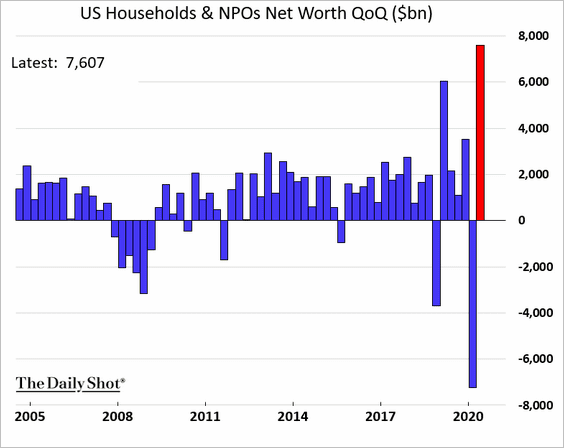
1. US household net worth rose sharply last quarter (biggest quarterly gain since 1952) as the stock market recovered.
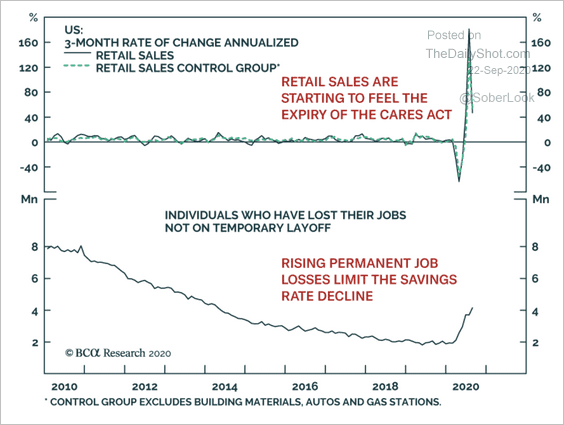
2. The expiration of the $300/week unemployment benefits this month will reverberate through the economy.
 Source: BCA Research
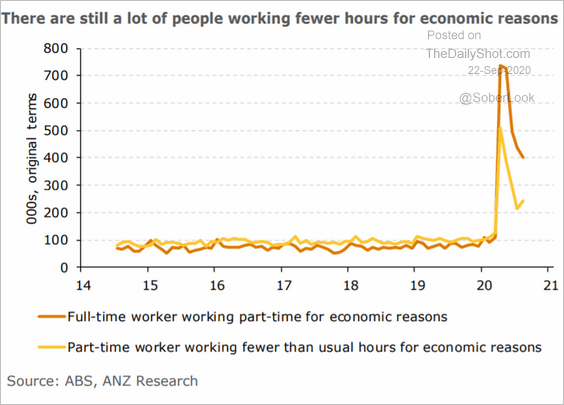
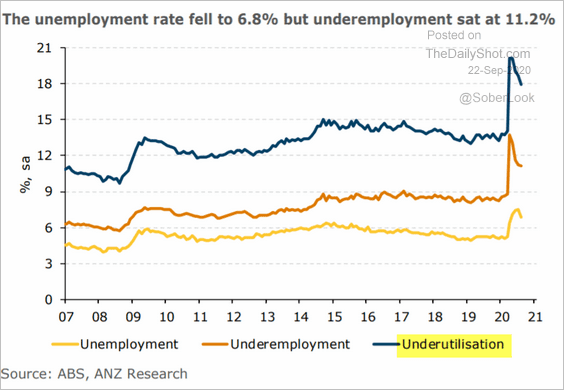
3. Next, we have some updates on the labor market.
• Labor underutilization continues to be a concern (2 charts).
 Source: ANZ Research
 Source: ANZ Research
• More of the layoffs have become permanent.
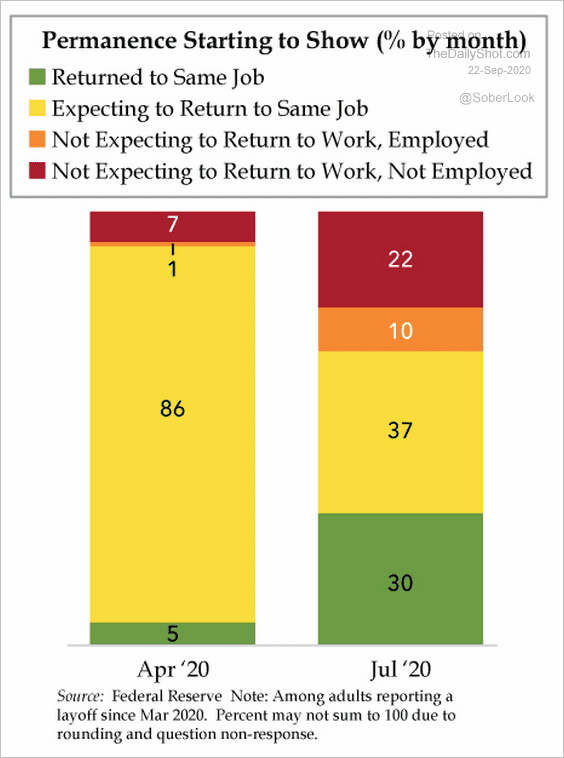 Source: The Daily Feather
• Job-related online search activity remains below last year’s levels.
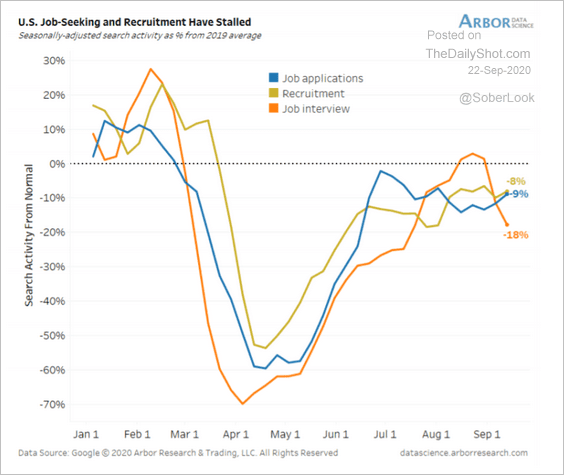 Source: Arbor Research & Trading
——————–
4. Here is Morgan Stanley’s projection for the pace of growth in disposable income.
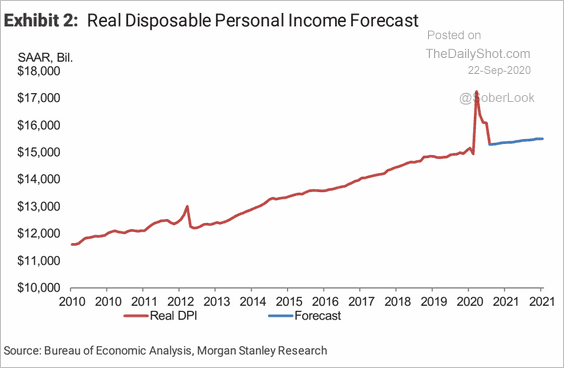 Source: Morgan Stanley Research
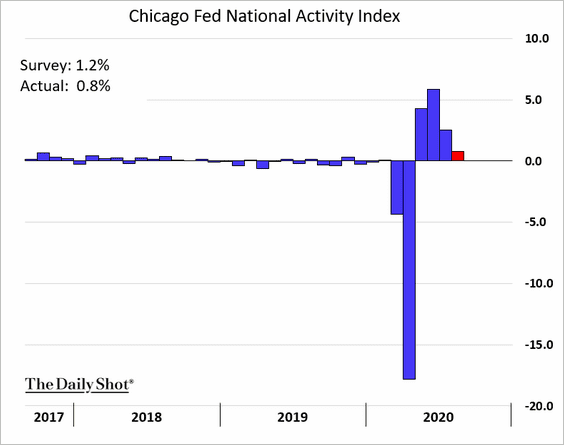
5. Similar to the leading index, the Chicago Fed National Activity Index showed a smaller increase last month.
6. Freight activity is rebounding.
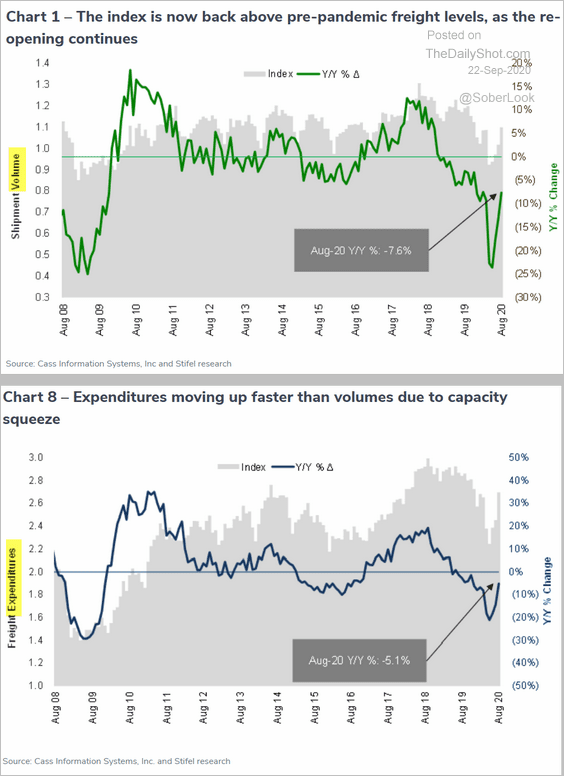 Source: Cass Information Systems
• Truckload rates have increased sharply.
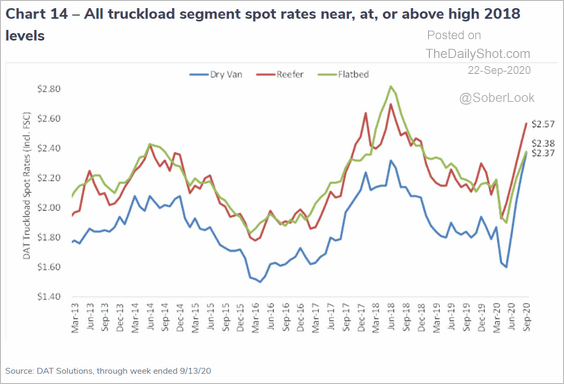 Source: Cass Information Systems
• However, intermodal shipment prices remain depressed.
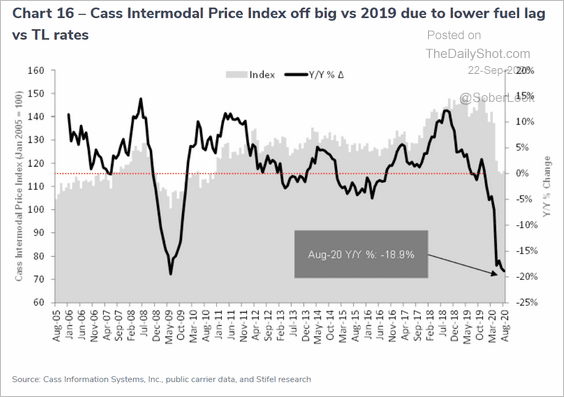 Source: Cass Information Systems
——————–
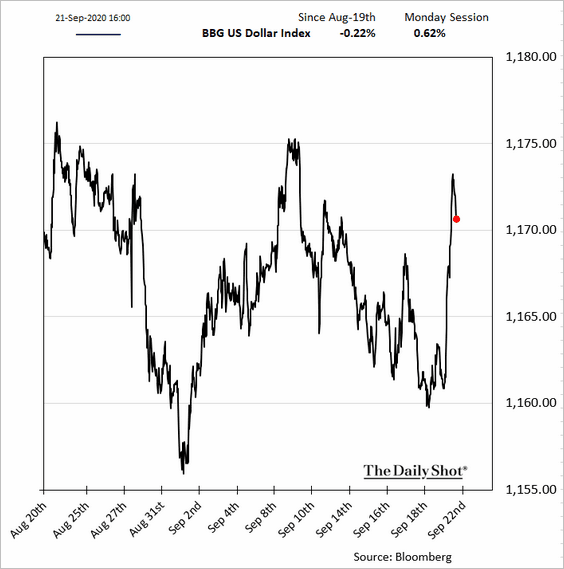
7. Has the US dollar bottomed?
 Source: @TheTerminal, Bloomberg Finance L.P.
The United Kingdom
1. Are UK exporters ready to start paying a 3% tariff to the EU?
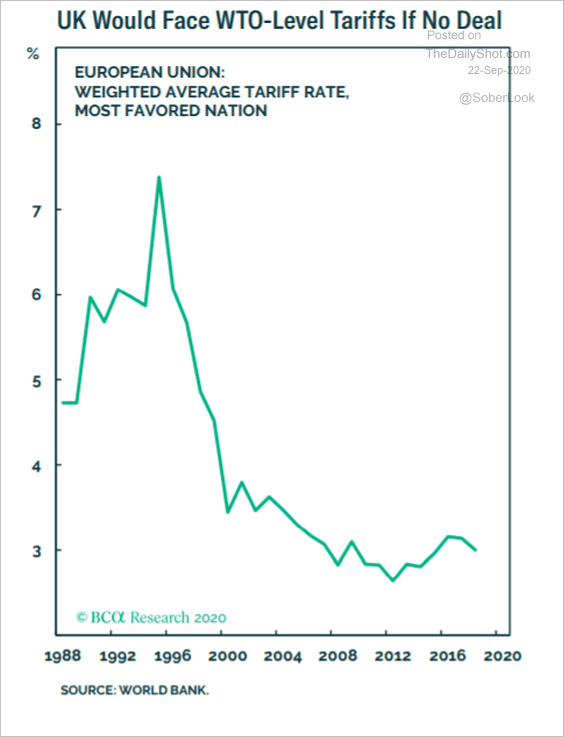 Source: BCA Research
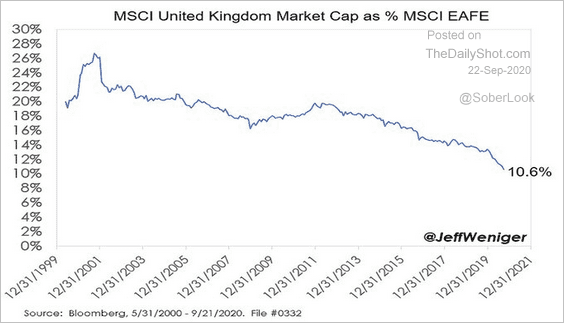
2. The UK stock market’s share of the MSCI EAFE index capitalization keeps shrinking.
 Source: @JeffWeniger
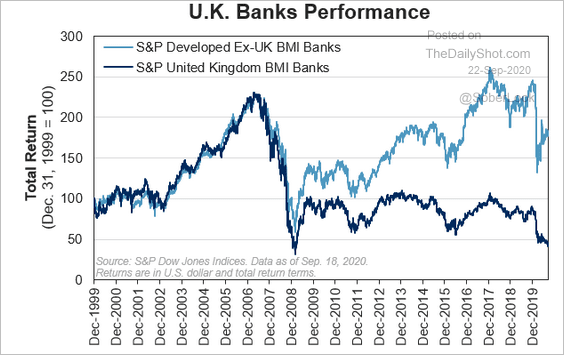
UK banks continue to underperform.
 Source: S&P Global Market Intelligence
——————–
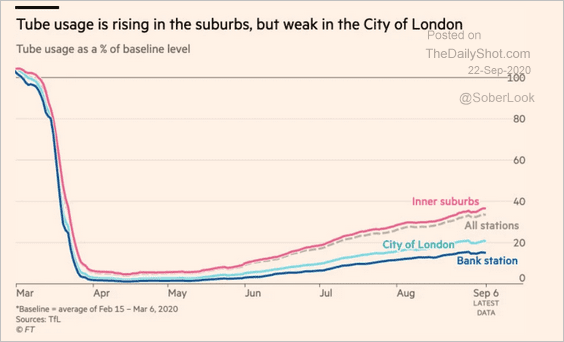
3. Here are a couple of charts on mobility.
• Tube usage:
 Source: @financialtimes Read full article
• Cars vs. trains:
![]() Source: @financialtimes Read full article
Source: @financialtimes Read full article
Mobility is expected to take a hit again as the nation struggles with higher infection rates.
 Source: @bpolitics Read full article
——————–
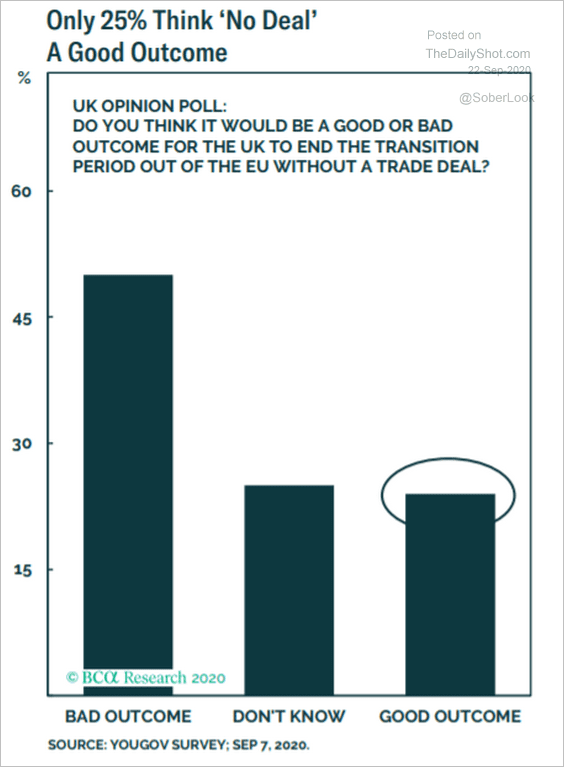
4. Finally, here are a couple of poll results.
• Views on the no-deal outcome:
 Source: BCA Research
• The Prime Minister’s approval ratings:
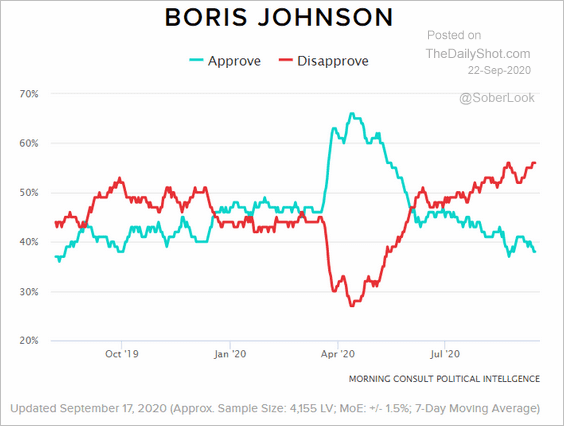 Source: Morning Consult
The Eurozone
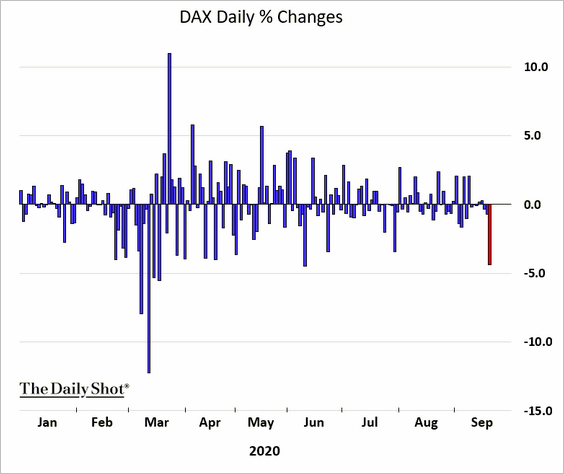
1. European shares sold off sharply on Monday, but markets are stable this morning.
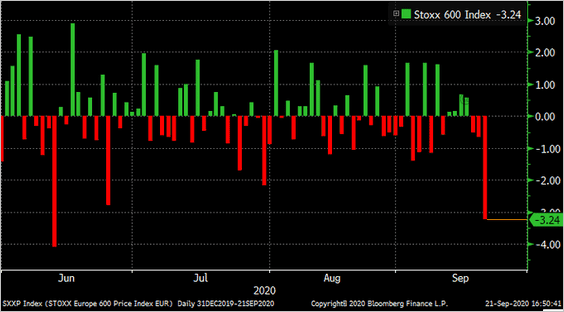 Source: @markets Read full article
——————–
2. EUR/USD options are pricing in a significant US election risk.
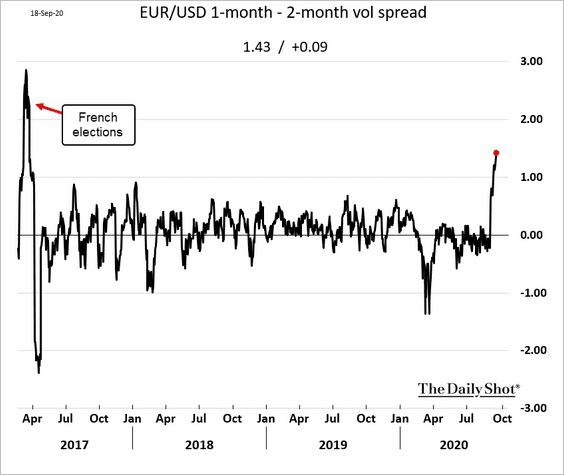 Source: Anil Varma, Bloomberg Finance L.P.
3. These charts show the evolution of corporate and household debt in the Eurozone.
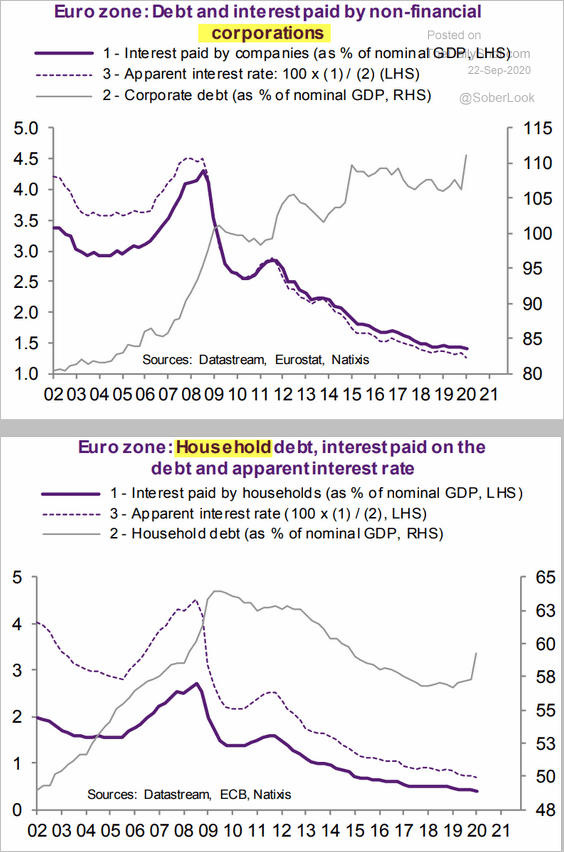 Source: Natixis
4. The budget gap continues to widen.
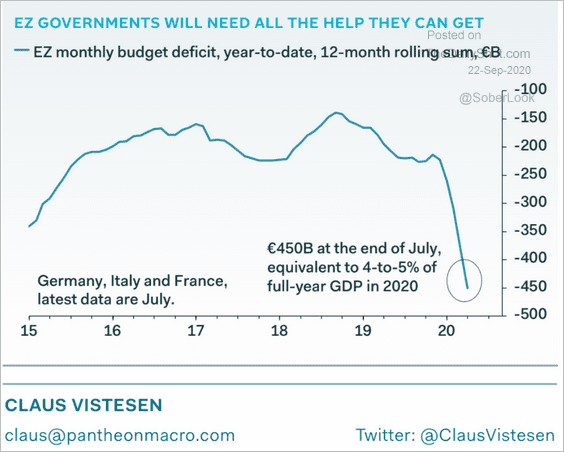 Source: Pantheon Macroeconomics
Asia – Pacific
1. Japan’s service sector activity remains soft.
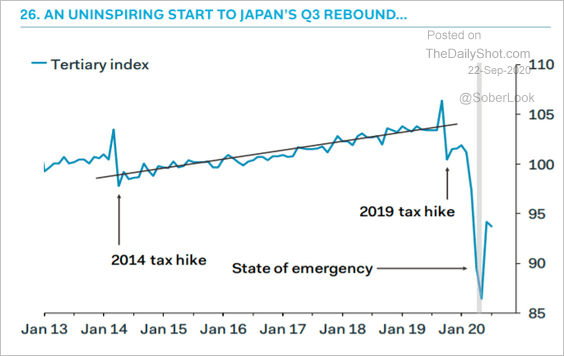 Source: Pantheon Macroeconomics
2. South Korea’s KOSPI index is testing support at the 50-day moving average.
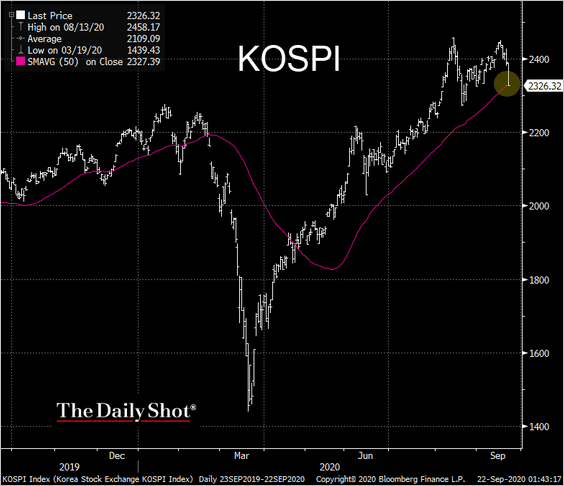 Source: @TheTerminal, Bloomberg Finance L.P.
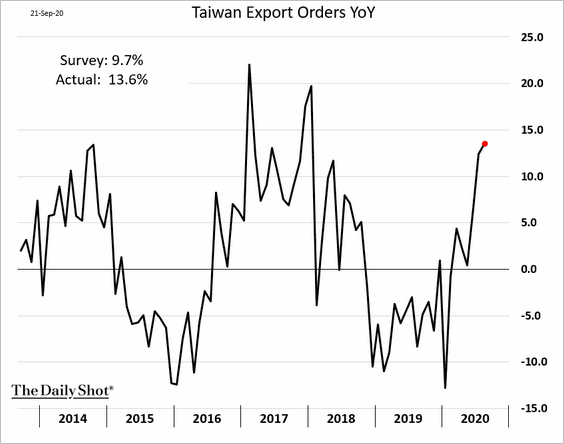
3. Taiwan’s export orders continue to beat expectations.
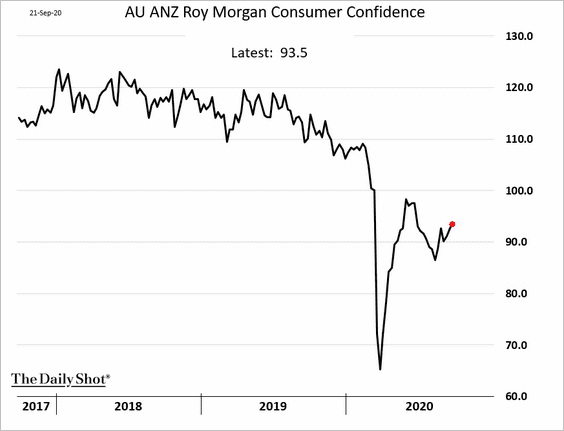
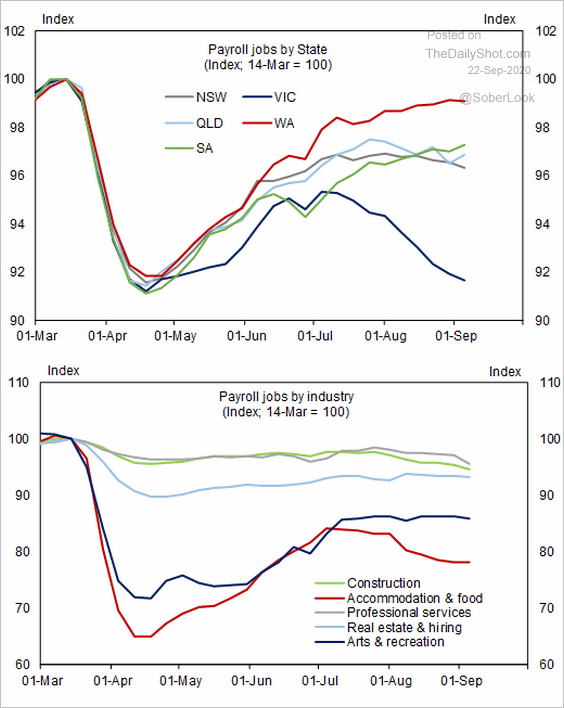
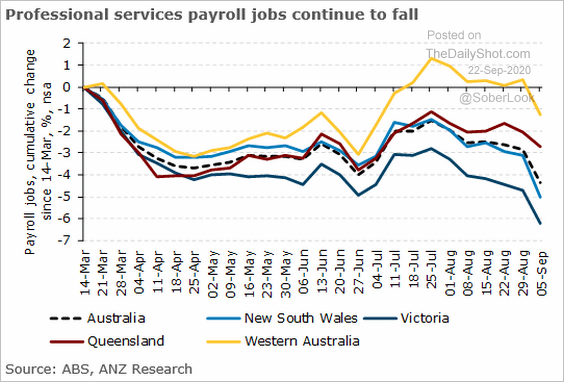
4. Next, we have some updates on Australia.
• Consumer confidence:
• Payrolls (3 charts):
 Source: Goldman Sachs
 Source: @ANZ_Research, @cfbirch
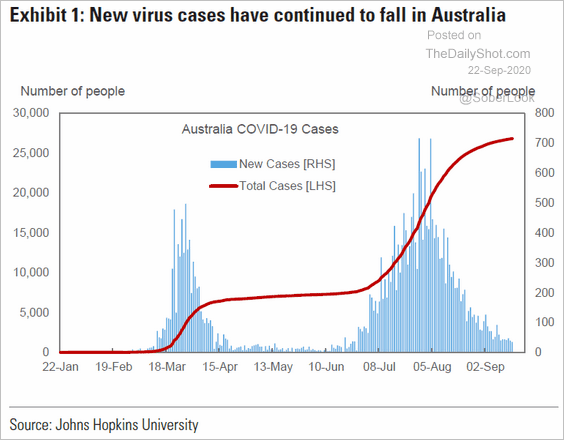
• New infections:
 Source: Goldman Sachs
By the way, will we see a third wave?
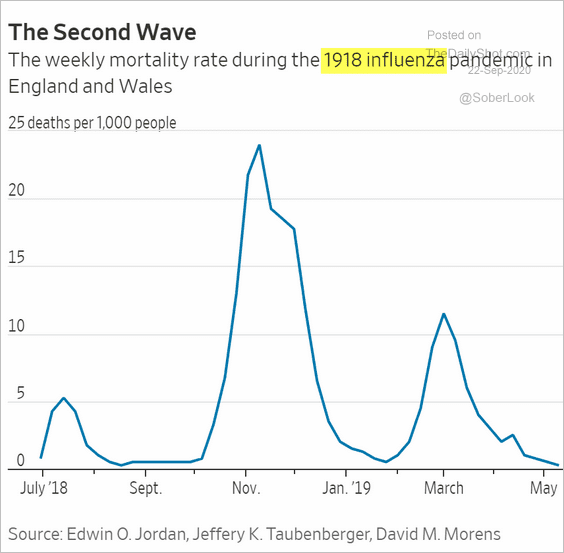 Source: @WSJ Read full article
——————–
• The collapse in immigration and its impact on home prices:
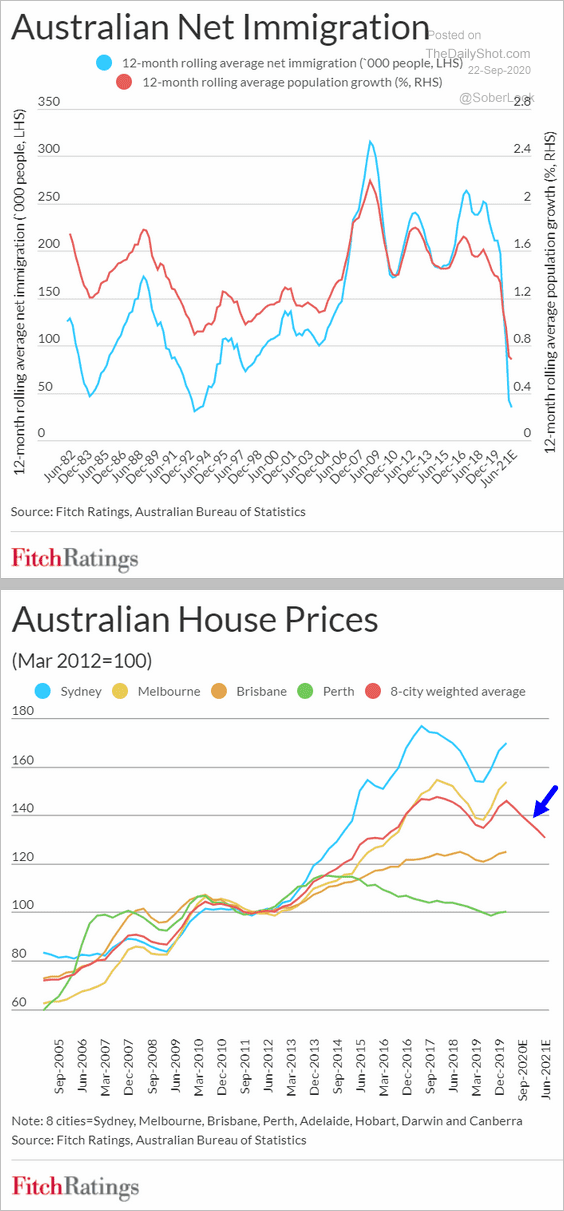 Source: Fitch Ratings
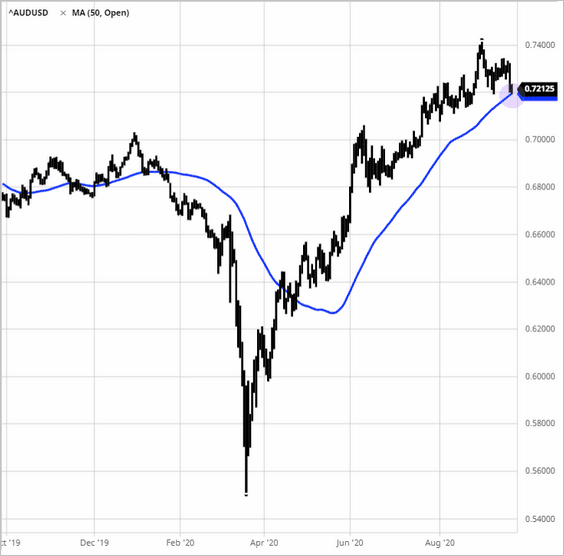
• The Aussie dollar (at 50d moving average):
China
1. Mainland shares are trading at a premium vs. Hong Kong.
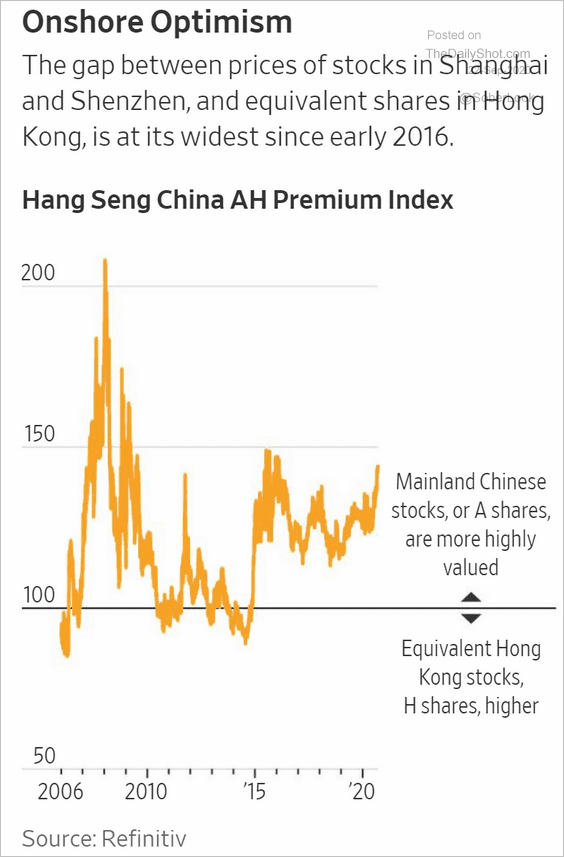 Source: @WSJ Read full article
2. China’s consumption recovery has lagged other major economies.
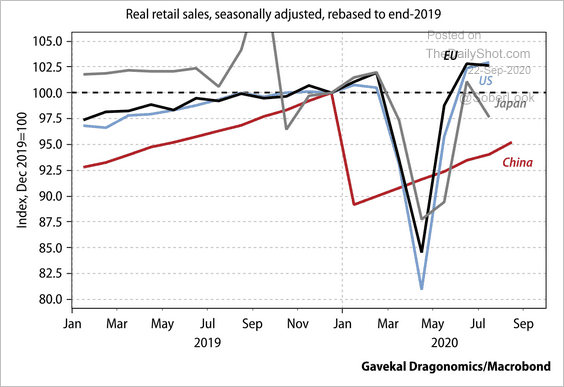 Source: Gavekal
Households have been more cautious about spending.
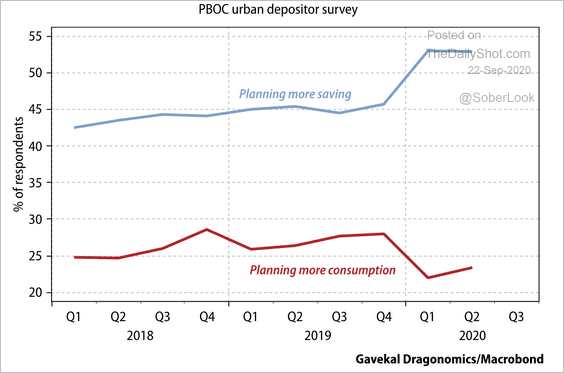 Source: Gavekal
——————–
3. Loan rates are expected to drift lower.
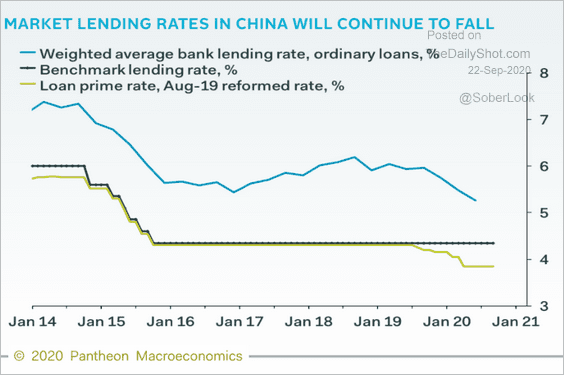 Source: Pantheon Macroeconomics
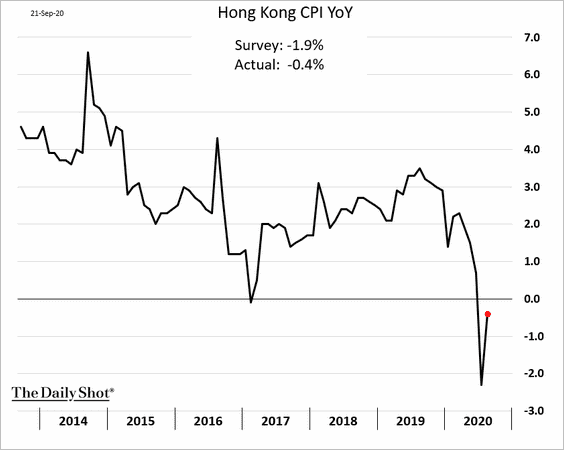
4. Hong Kong’s CPI is rebounding.
Emerging Markets
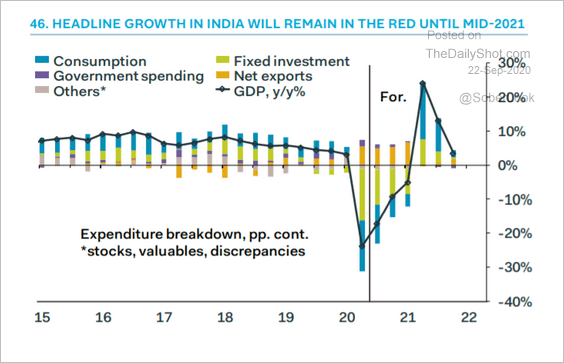
1. Let’s begin with some updates on India.
• The recovery will take some time.
 Source: Pantheon Macroeconomics
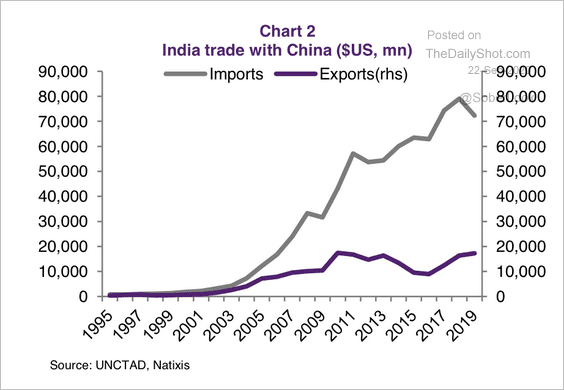
• India has a large trade deficit with China.
 Source: Natixis
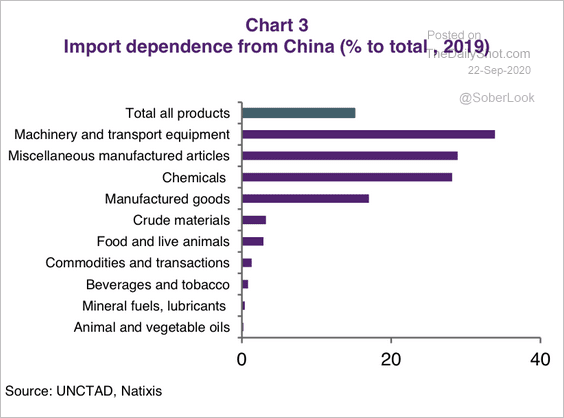
• Here is a breakdown of India’s import dependence on China.
 Source: Natixis
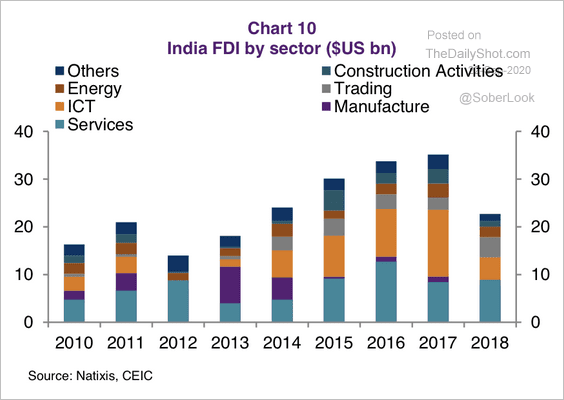
• India’s foreign direct investment has been concentrated in services and information/commercial technology (ICT).
 Source: Natixis
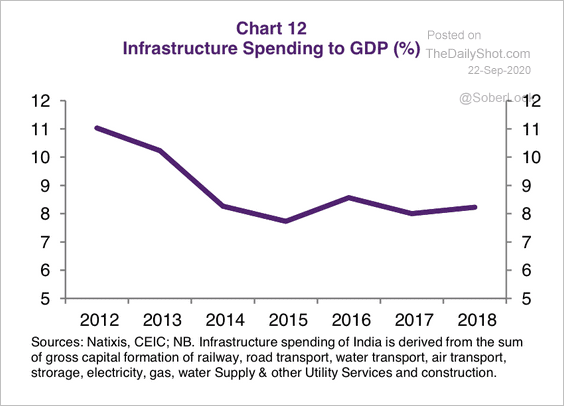
• India’s infrastructure spending has been stuck in low gear since 2012.
 Source: Natixis
——————–
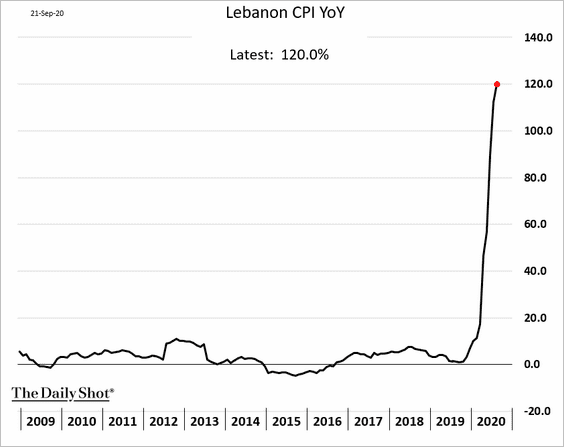
2. Lebanon’s inflation hit 120%.
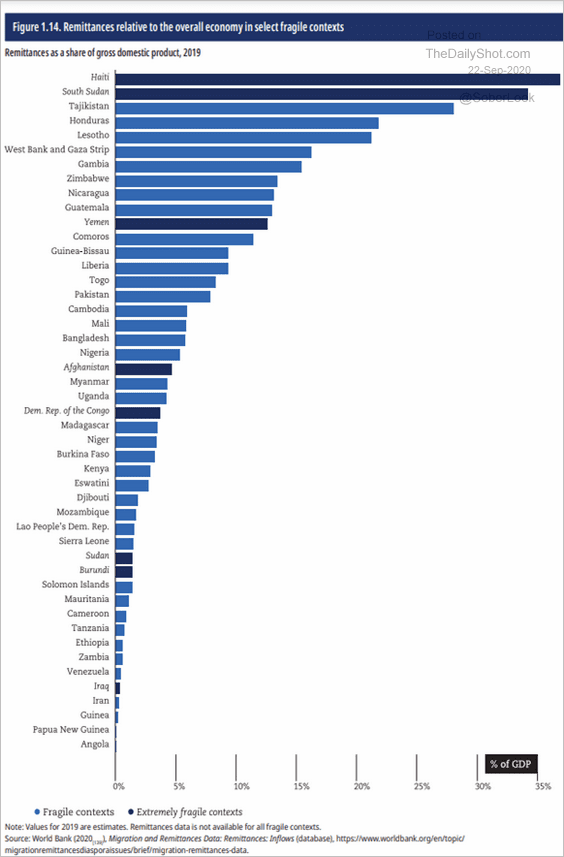
3. This chart shows remittances as a share of each country’s GDP.
 Source: OECD Read full article
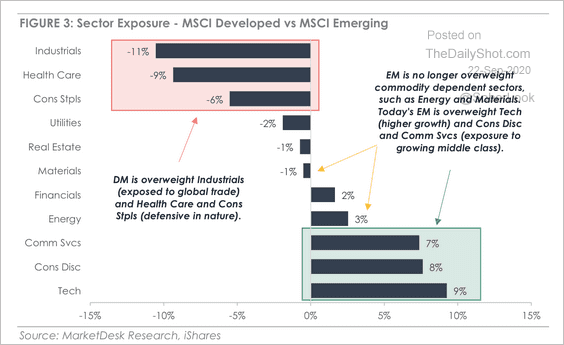
4. The MSCI Emerging Market Index is more exposed to technology and consumer discretionary than the MSCI DM.
 Source: MarketDesk Research
Cryptocurrency
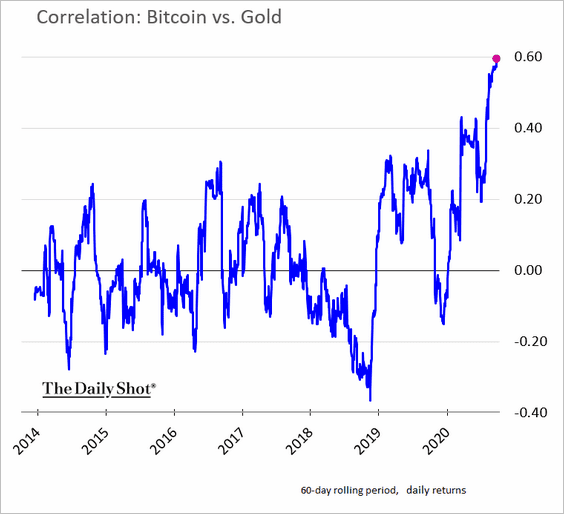
1. The Bitcoin – gold correlation hit the highest level in years.
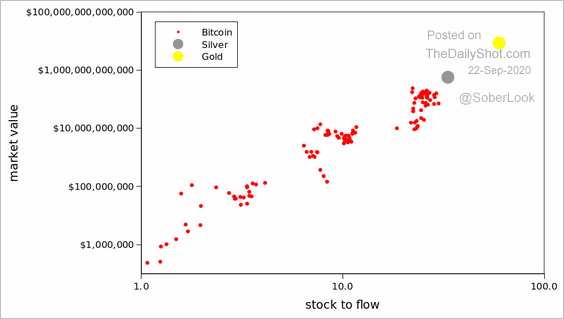
2. Here is Bitcoin’s stock-to-flow trajectory.
 Source: @100trillionUSD
Commodities
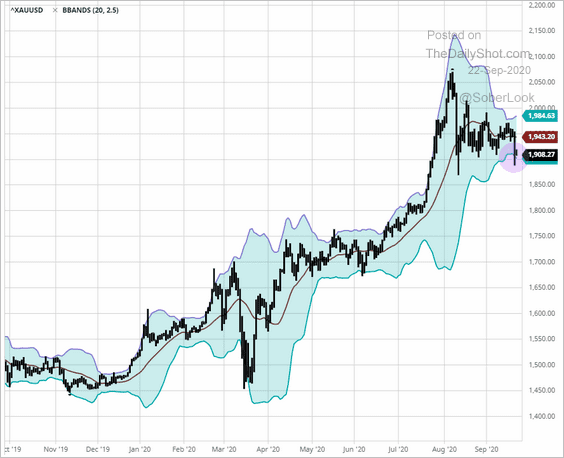
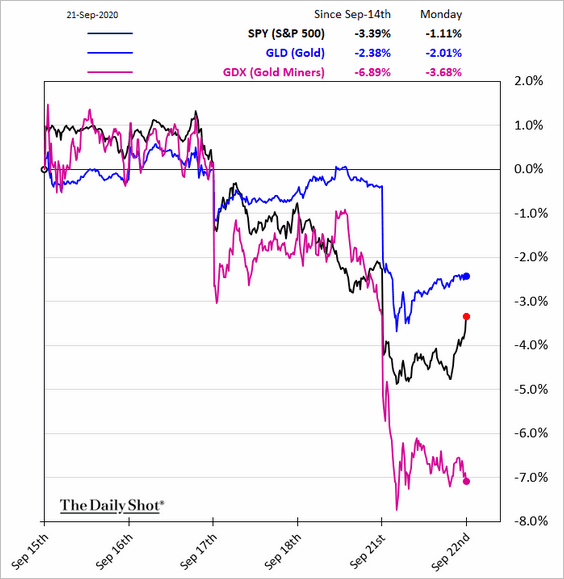
1. The US dollar rebound is putting pressure on commodities.
Gold is at the lower Bollinger band.
 Source: barchart.com
Shares of gold miners took a hit in recent days.
——————–
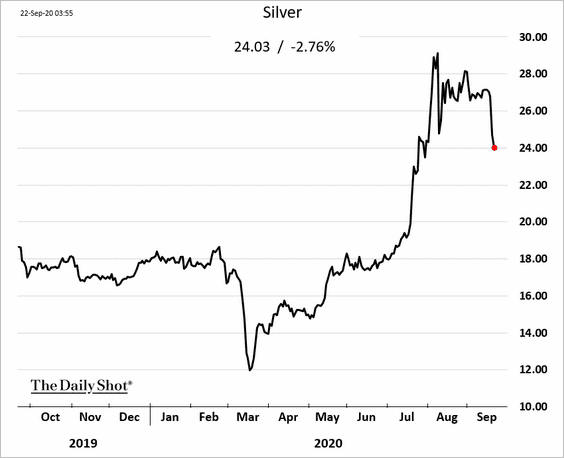
2. Silver is lower again in early trading.
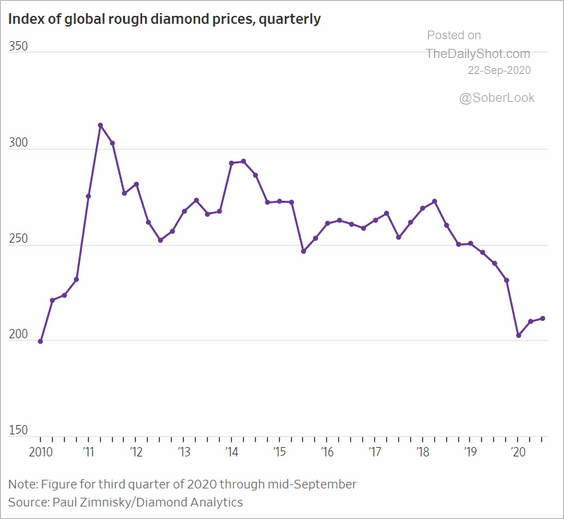
3. Have diamond prices bottomed?
 Source: @WSJ Read full article
Energy
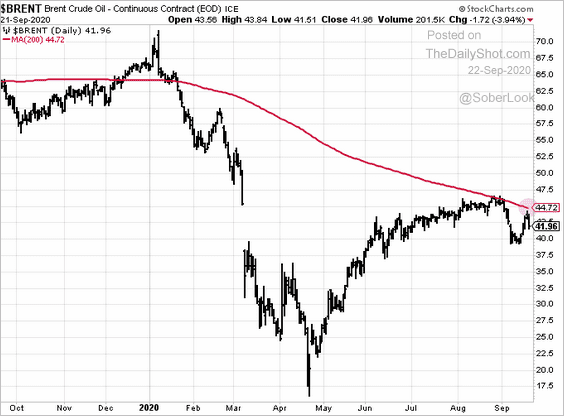
1. Brent held resistance at the 200d moving average.
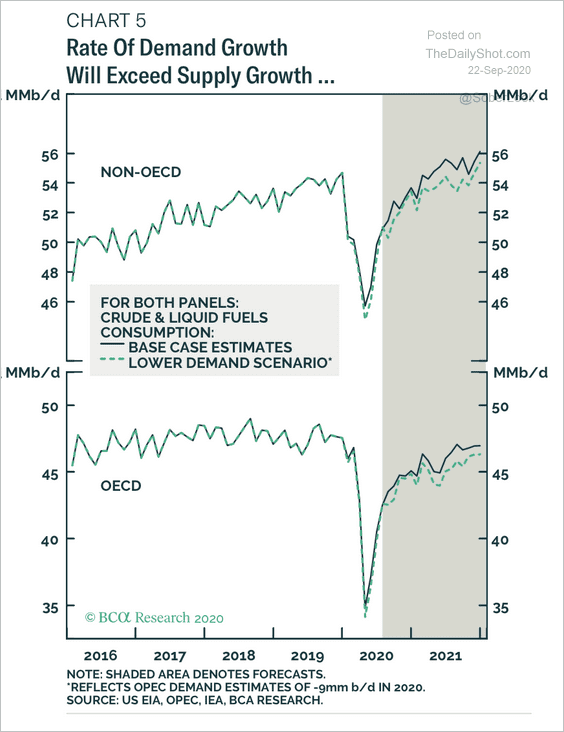
2. BCA Research expects oil demand growth to exceed the increases in supply next year.
 Source: BCA Research
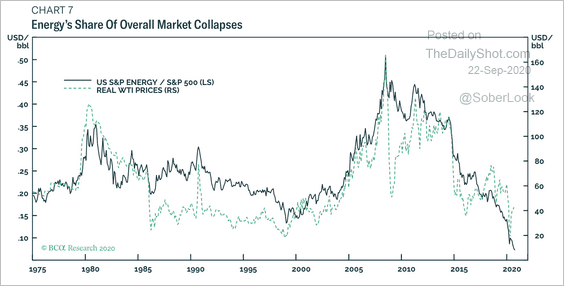
The recovery in oil prices from all-time lows has done little to support energy stocks.
 Source: BCA Research
——————–
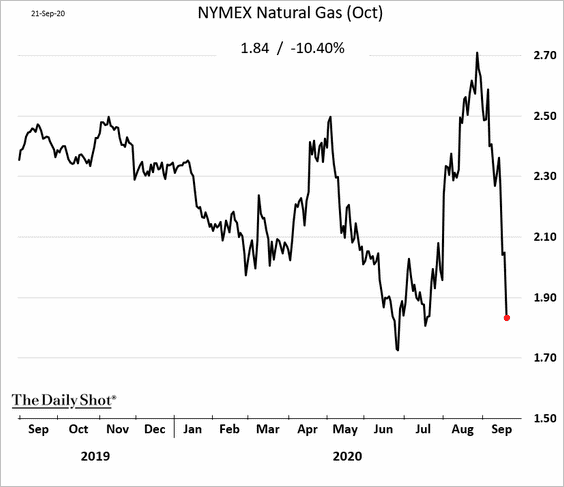
3. US natural gas has cratered in recent days.
4. Here is how Americans view different energy sources.
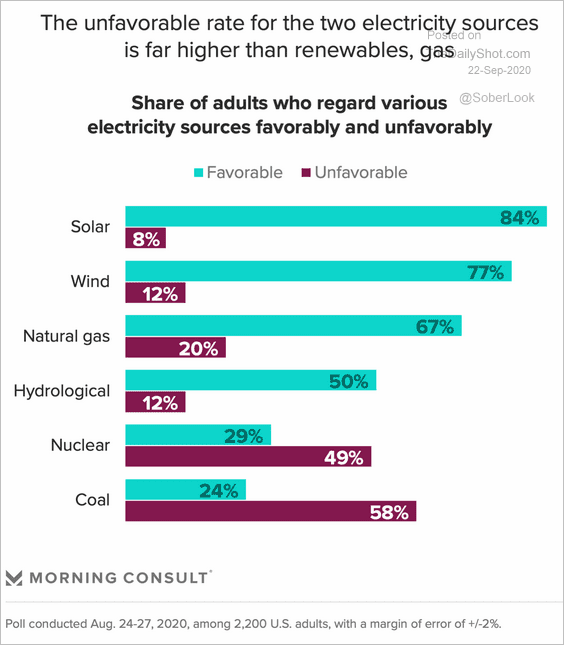 Source: Morning Consult Read full article
Equities
1. QQQ (Nasdaq 100 ETF) experienced some outflows.
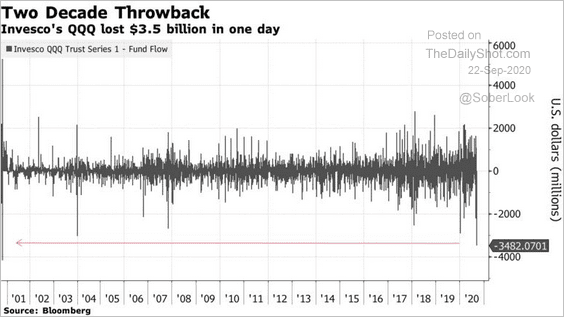 Source: @markets Read full article
However, the 3x leveraged Nasdaq 100 ETF continues to see inflows.
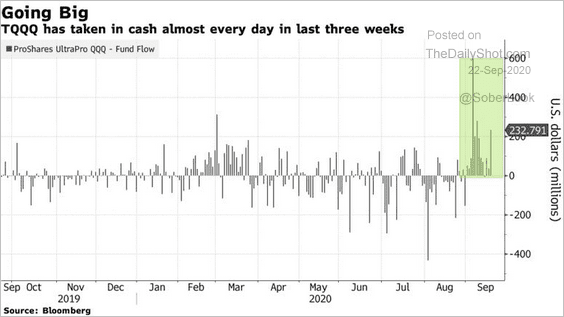 Source: @markets Read full article
——————–
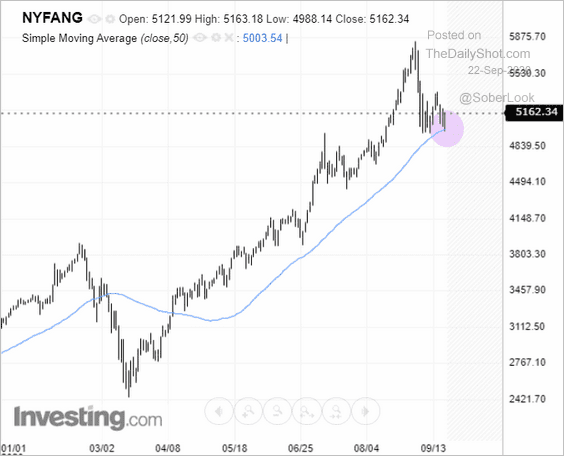
2. FANG stocks are at the 50-day moving average.
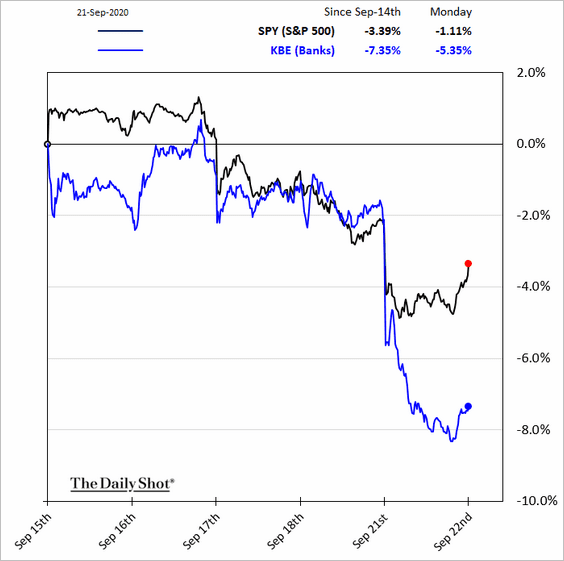
3. Bank shares tumbled on Monday, driven in part by this story.
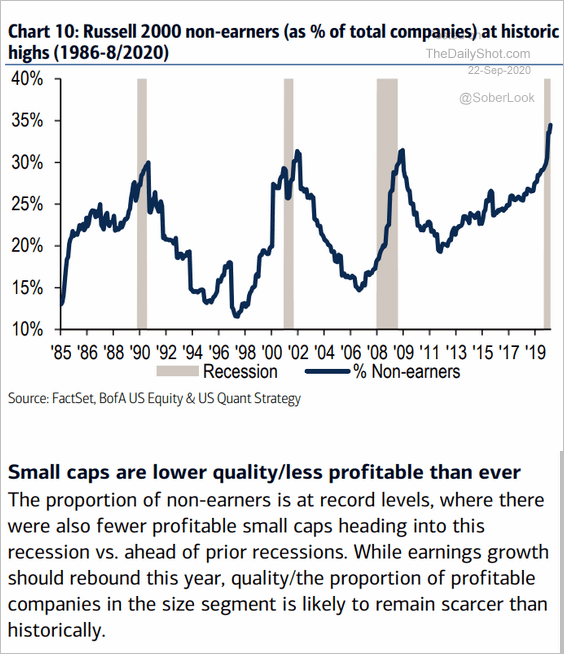
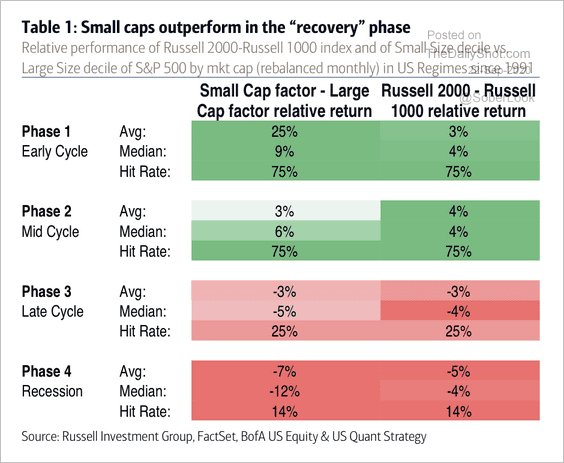
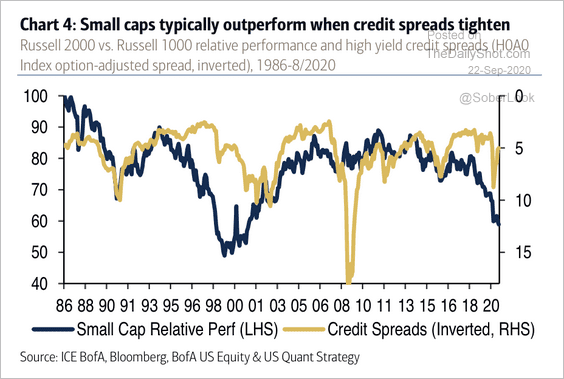
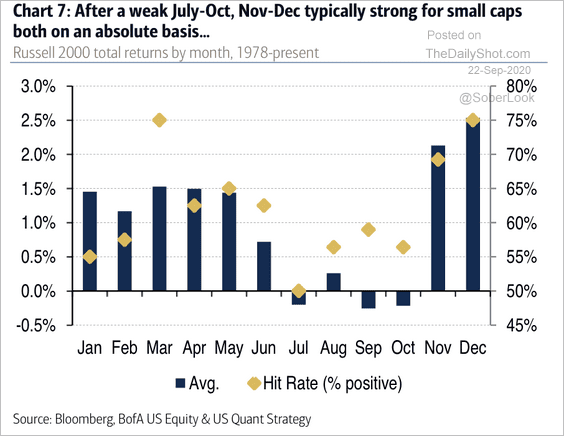
4. Next, we have some updates on small-cap stocks.
• Unprofitable companies are becoming a large component of the market.
 Source: BofA Securities
• Small-cap stocks tend to outperform during an economic recovery …
 Source: BofA Securities
• … and when credit spreads tighten.
 Source: BofA Securities
• Small-caps also have a higher hit-rate in November and December.
 Source: BofA Securities
——————–
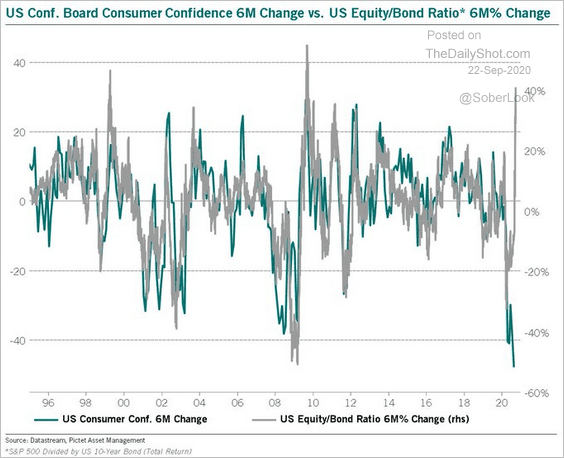
5. The equity-to-bond ratio has diverged from consumer sentiment.
 Source: @BittelJulien
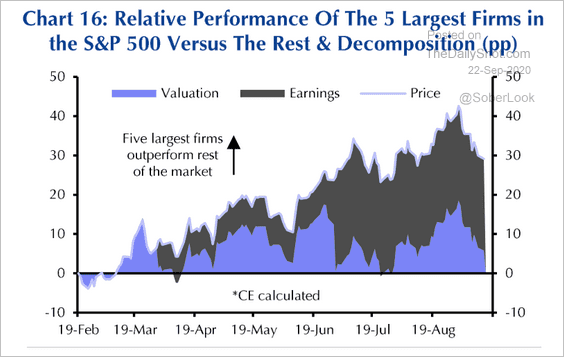
6. The outperformance of the five largest stocks in the S&P 500 has been driven by higher earnings.
 Source: Capital Economics
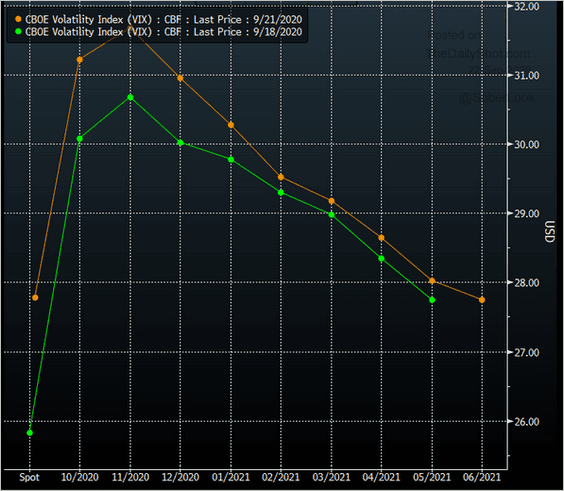
7. Here is the VIX futures curve.
 Source: @tracyalloway
Volatility is expected to remain elevated even after the elections.
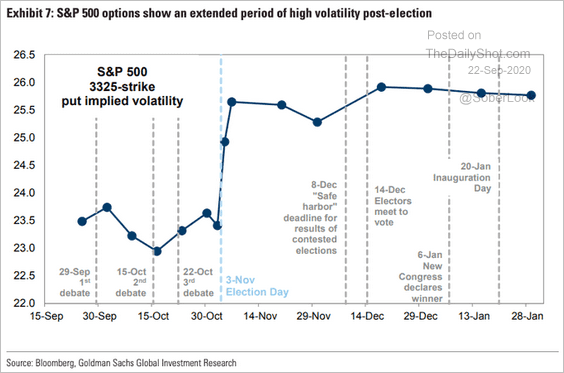 Source: @ISABELNET_SA, @GoldmanSachs
Credit
1. HYG, the largest high-yield ETF is testing support at the 200-day moving average.
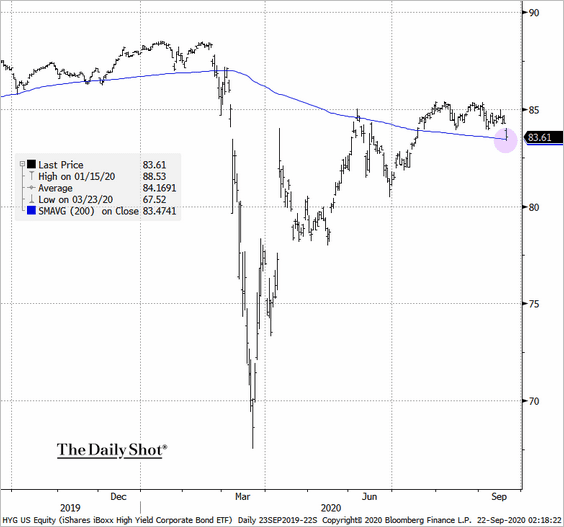 Source: @TheTerminal, Bloomberg Finance L.P.
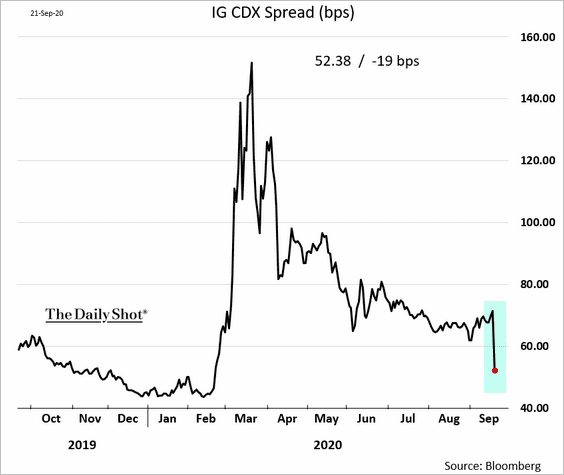
2. The on-the-run investment-grade CDX spread is back near 50 bps after the fallen angels were removed from the index in the latest roll.
3. US small caps are running record leverage.
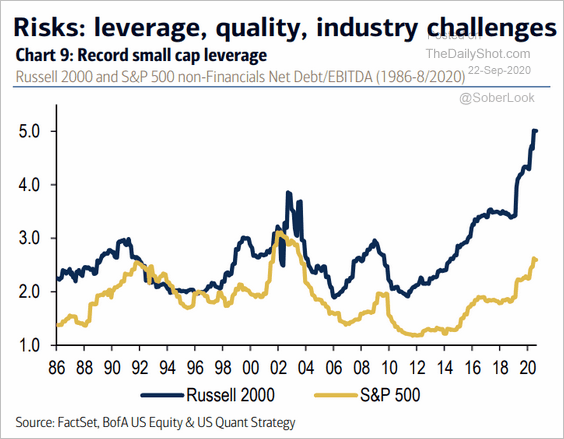 Source: BofA Securities
——————–
Food for Thought
1. Employment by company size:
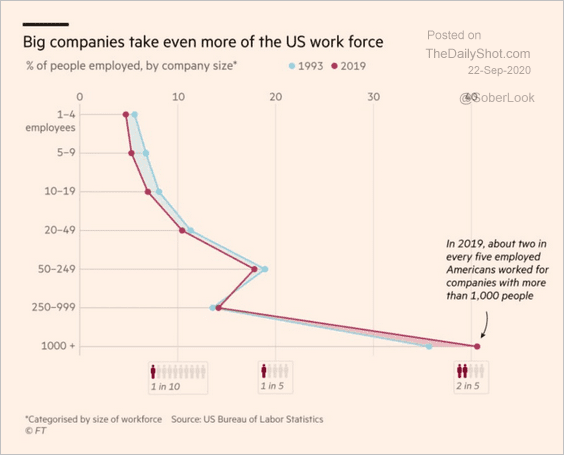 Source: @adam_tooze, @FT Read full article
2. The cost of thriving:
 Source: BofA Merrill Lynch Global Research, @MoHossain
3. Most and least affordable US cities:
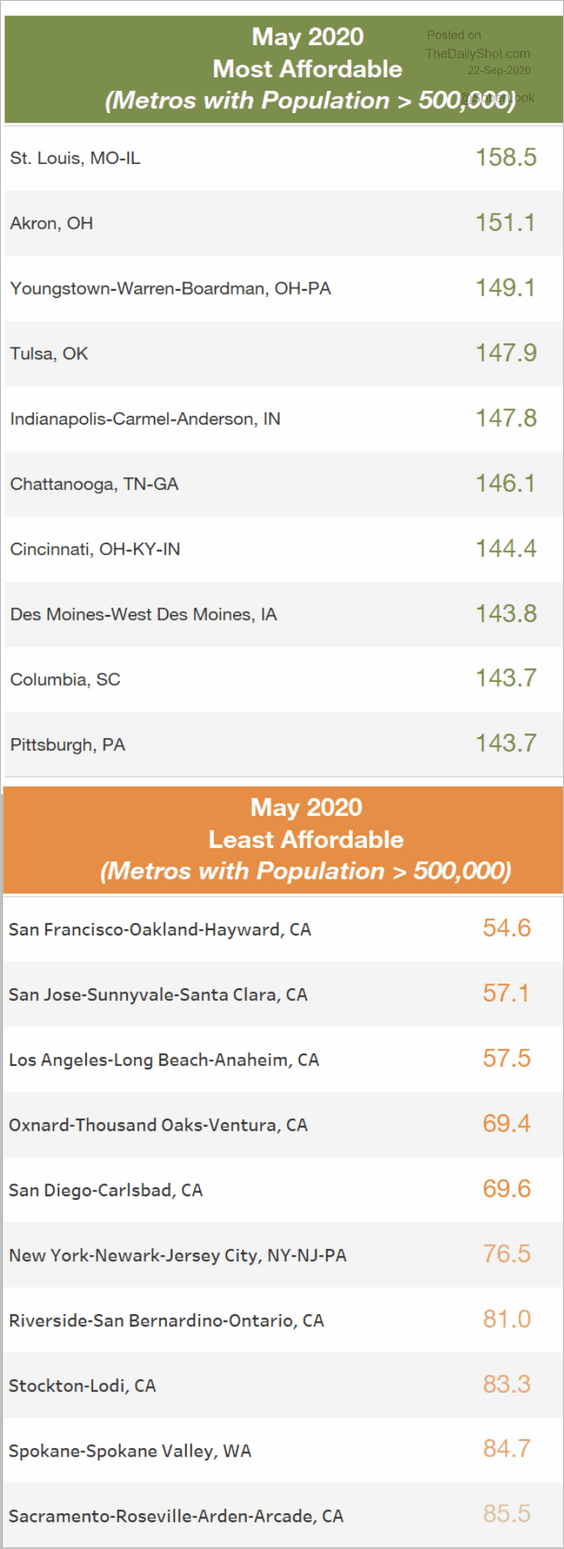 Source: US CARES Unempl Read full article
4. The Spanish Flu impact on births:
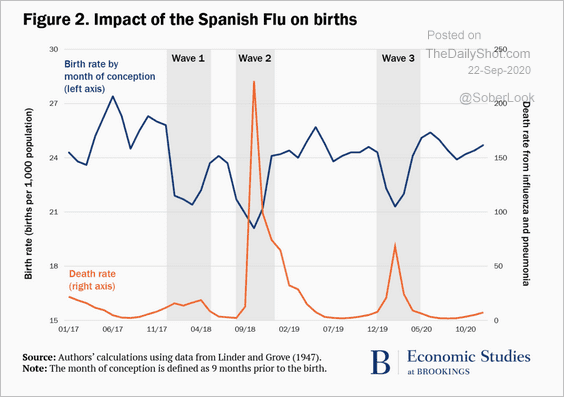 Source: The Brookings Institution Read full article
5. Counting mail-in ballots:
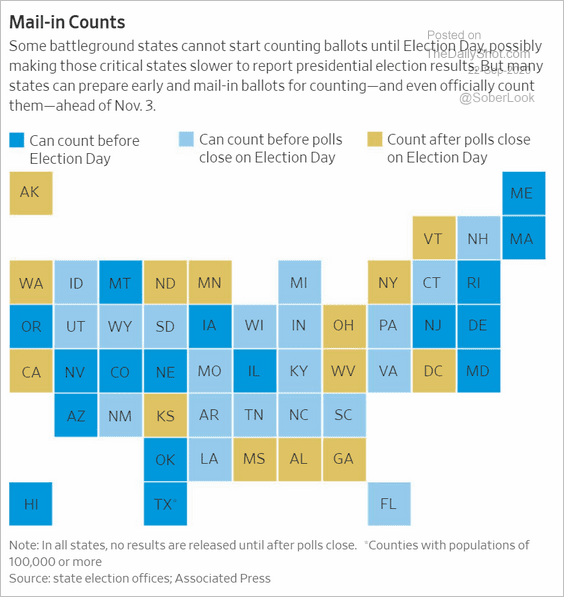 Source: @WSJ Read full article
6. The latest poll results (2 charts):
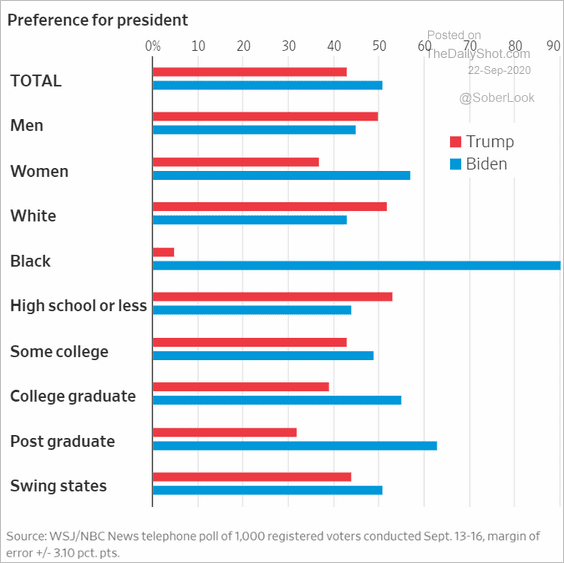 Source: @WSJ Read full article
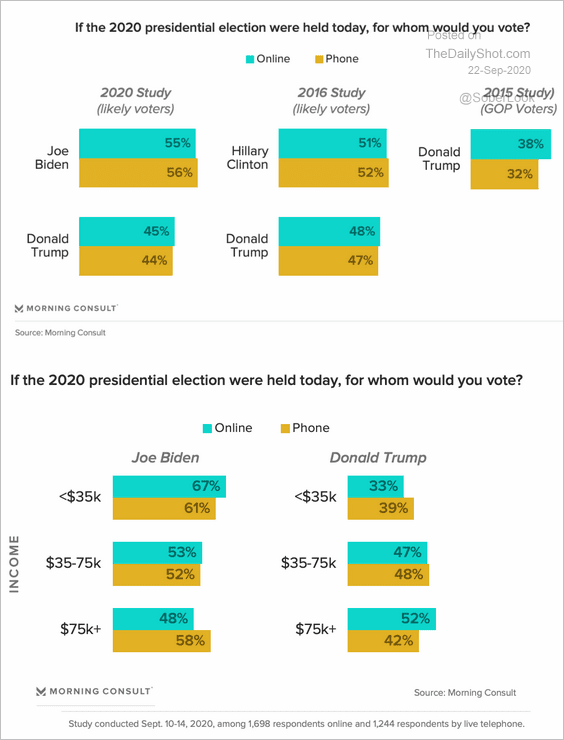 Source: Morning Consult Read full article
• Swing states in 2020 vs. 2016:
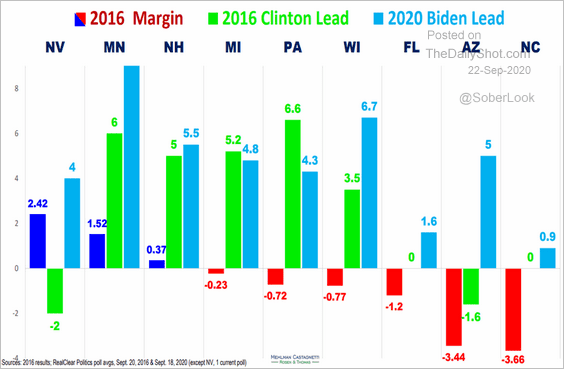 Source: Mehlman Castagnetti Rosen & Thomas
——————–
7. Cyber attacks on utilities:
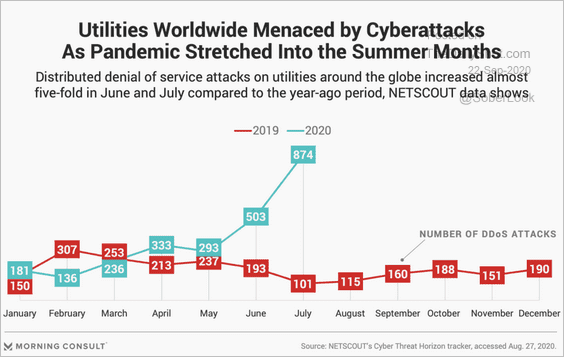 Source: Morning Consult Read full article
8. Electric vehicle costs:
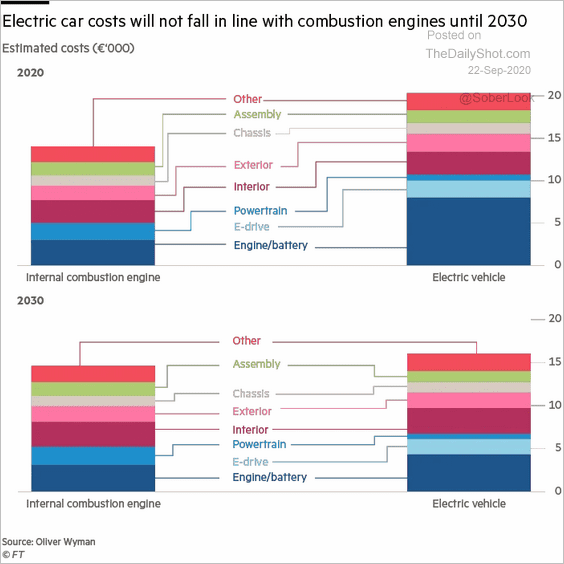 Source: @financialtimes Read full article
9. HBO vs. Netflix:
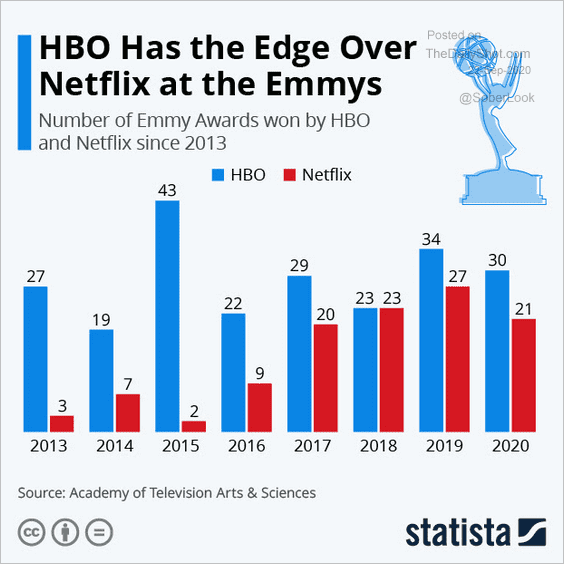 Source: Statista
——————–