
The Daily Shot: 01-Oct-20
• Equities
• Credit
• Rates
• Energy
• Commodities
• Emerging Markets
• China
• Asia – Pacific
• Japan
• The Eurozone
• Canada
• The United States
• Food for Thought
Equities
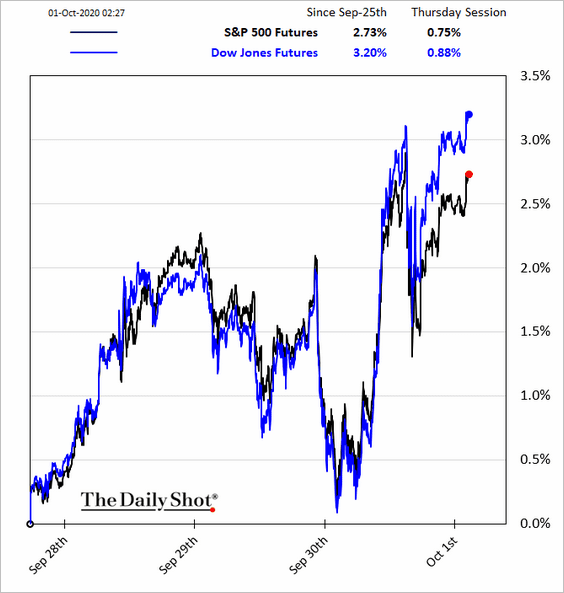
1. Stocks rose on Wednesday, with futures climbing further on Thursday morning in response to a potential relief plan breakthrough.
 Source: @lindsemcpherson, @rollcall Read full article
This development is a necessary condition for the rally to continue.
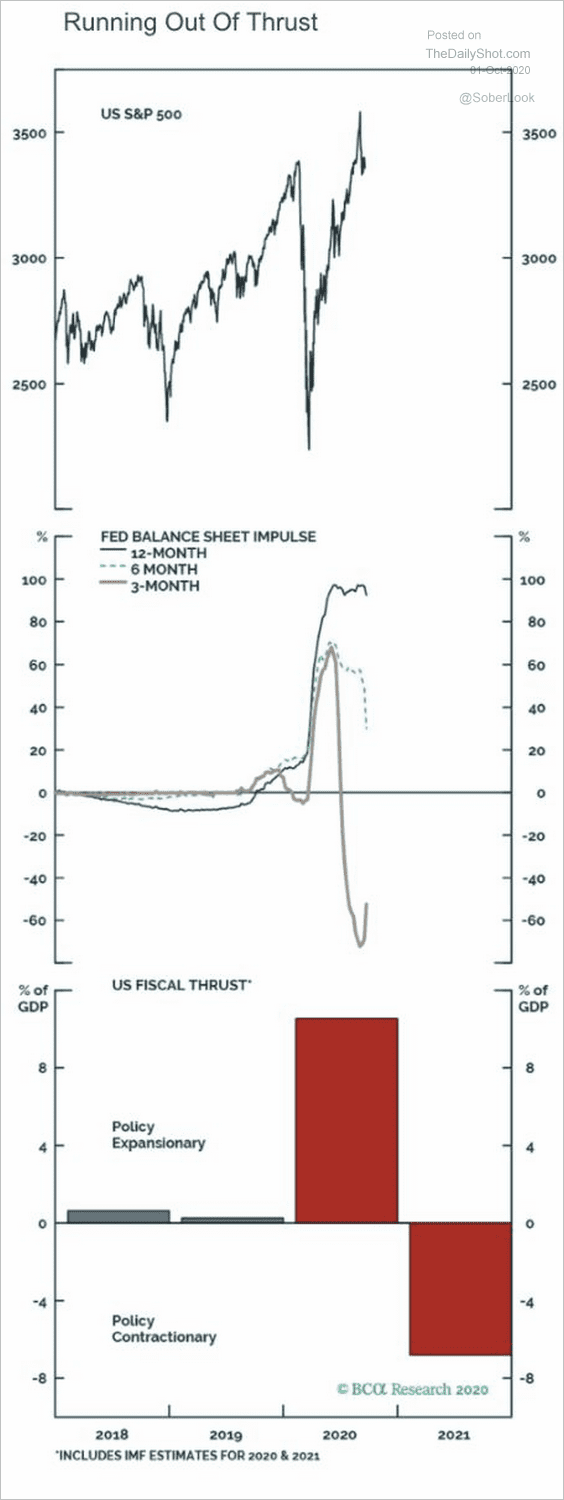 Source: BCA Research
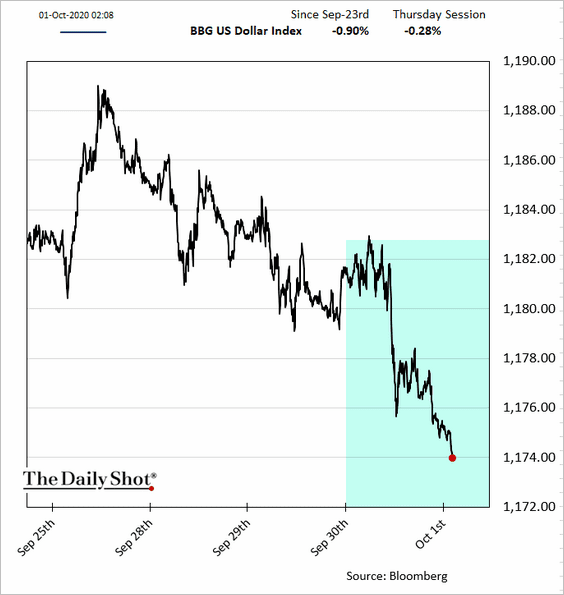
The US dollar tumbled as global markets shifted into risk-on mode.
——————–
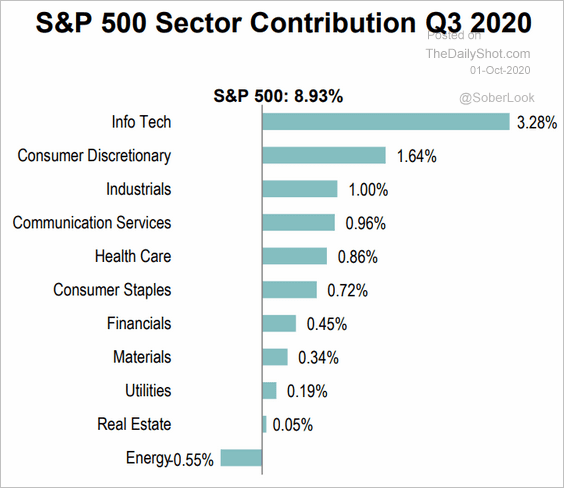
2. The next chart shows the contributions to the Q3 S&P 500 performance by sector.
 Source: S&P Global Market Intelligence
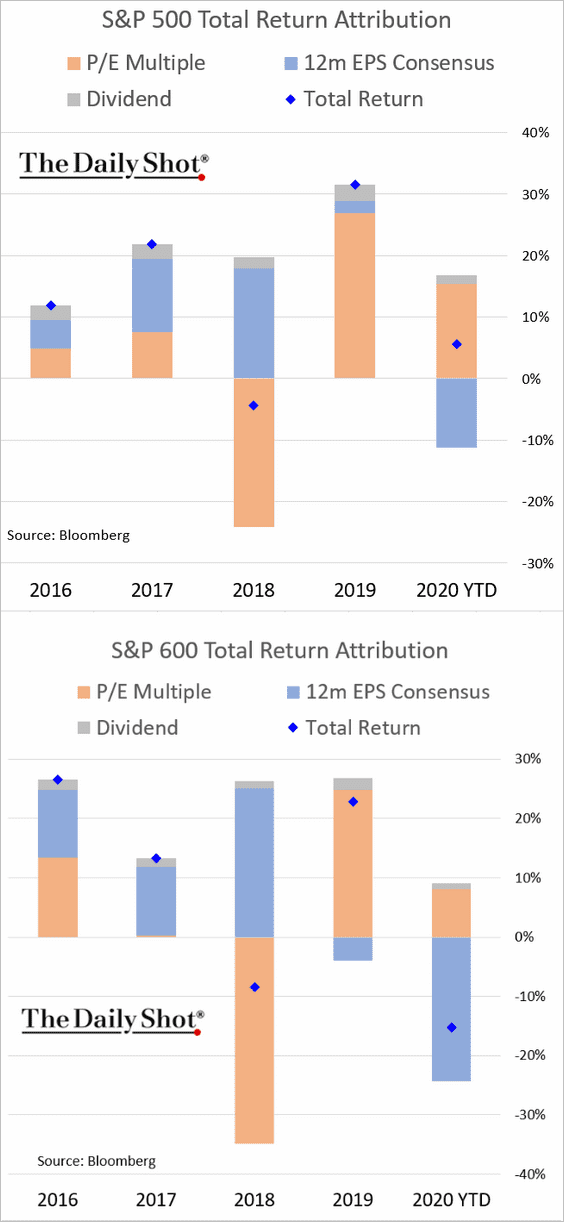
3. Here is the year-to-date total return attribution for the S&P 500 and the S&P 600 (small caps).
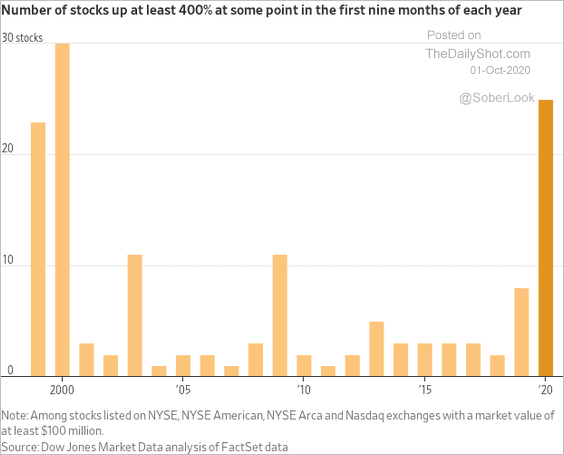
4. We’ve had quite a few stocks with 400%+ gains at some point this year.
 Source: @WSJ Read full article
5. Institutional investors are sitting on a large pile of cash. Will this flow into equities?
 Source: Alpine Macro
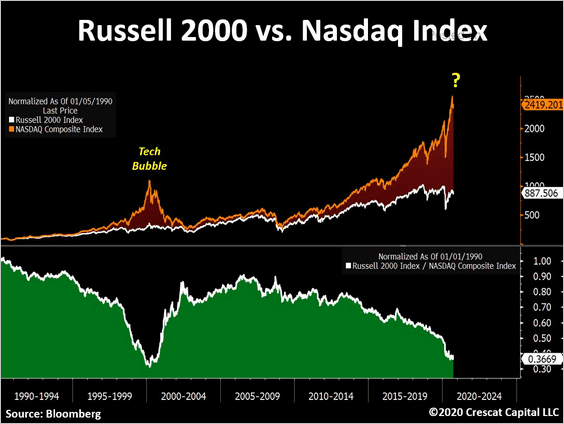
6. The Russell 2000 index has massively underperformed the Nasdaq Composite over the past decade.
 Source: @TaviCosta
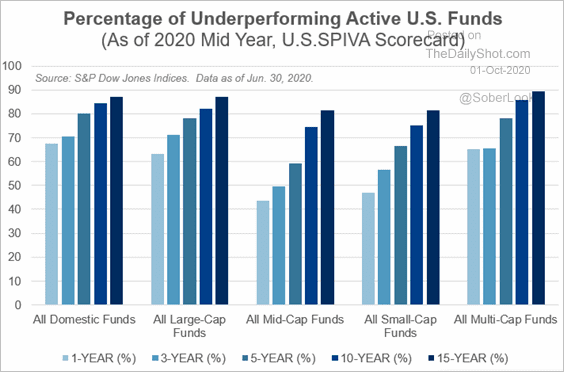
7. Active funds continue to underperform, putting pressure on the industry.
 Source: S&P Global Market Intelligence
8. BofA private clients have “bought the dip” in recent weeks.
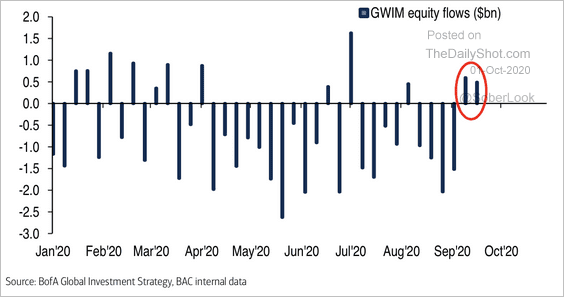 Source: Arbor Research & Trading
They’ve been moving into Japanese equities while reducing defensive bets.
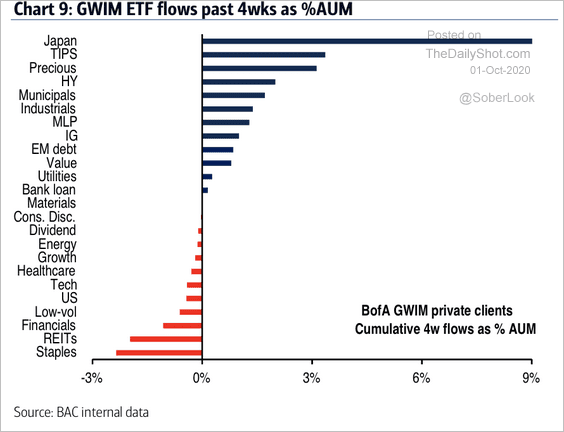 Source: Arbor Research & Trading
——————–
9. CTAs increased their exposure to equities this year.
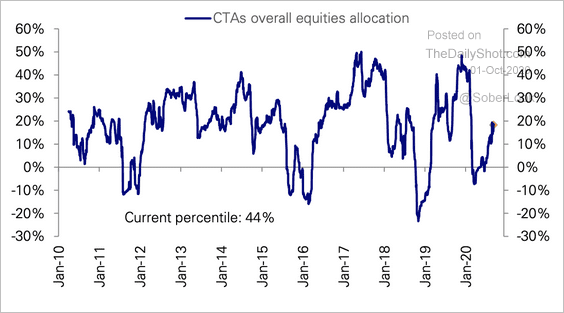 Source: Deutsche Bank Research
10. Public pension funds reduced their allocation to stocks in recent years, which hurt their performance.
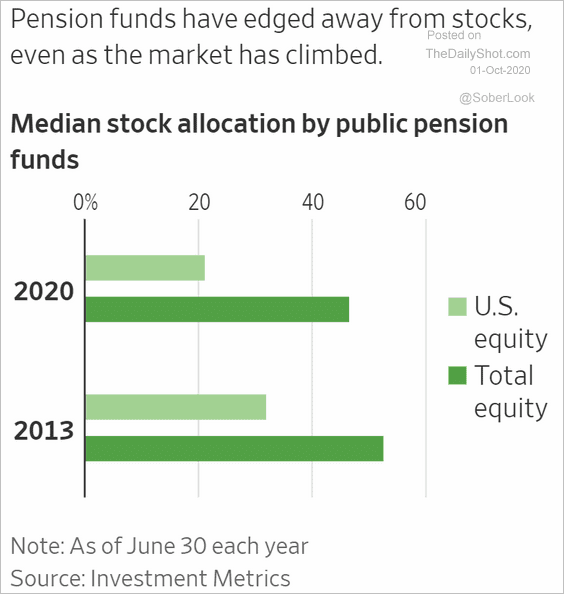 Source: @WSJ Read full article
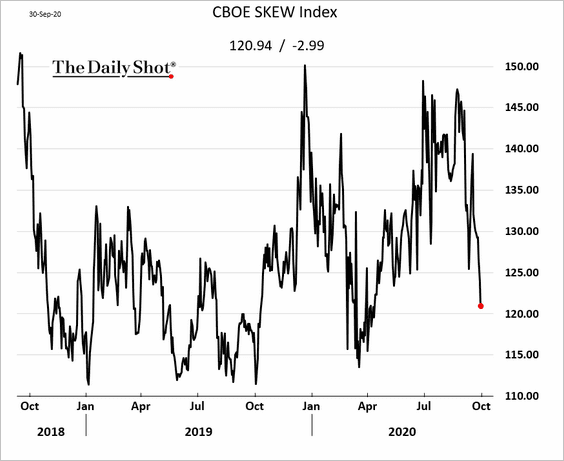
11. The CBOE Skew Index sank on Wednesday, pointing to increased hedging activity ahead of the US elections (demand for downside protection).
12. Finally, we have the share price of the South Sea Company between 1718 and 1720. See the comment from S&P Global below.
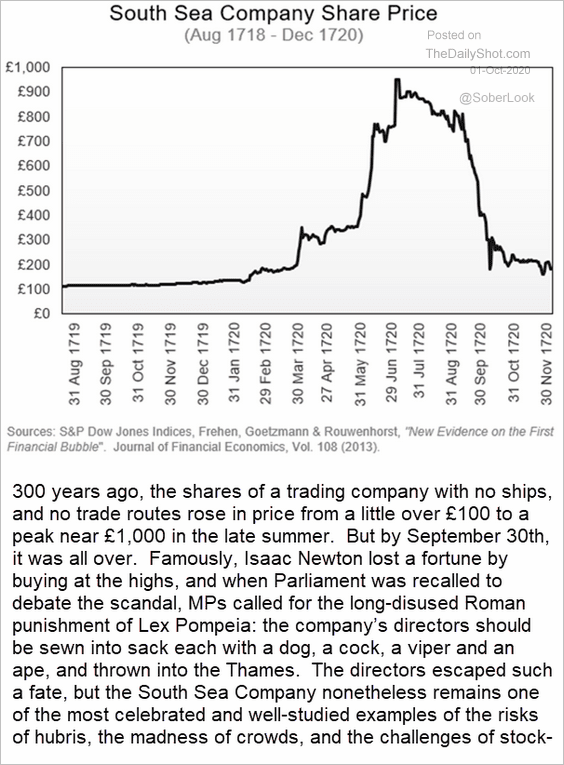 Source: Sherifa Issifu, S&P Global Market Intelligence
Credit
1. Let’s begin with some sector data. The scatterplot shows sector yields vs. durations, while the spider chart represents bond spreads.
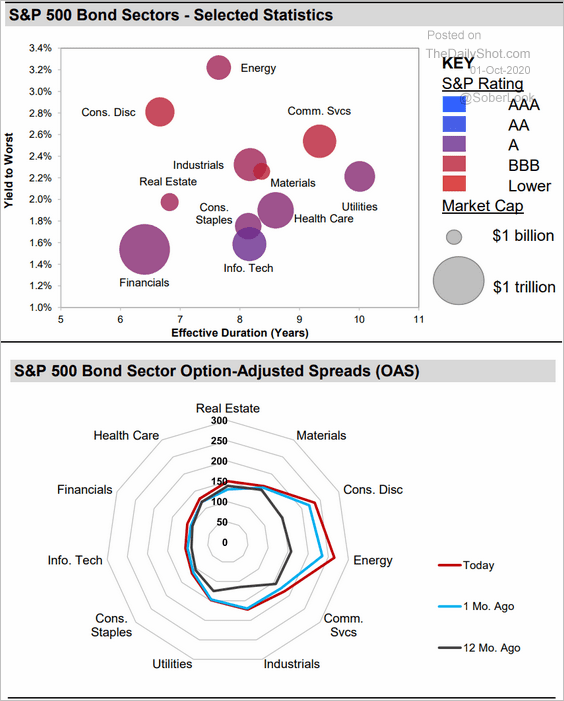 Source: S&P Global Market Intelligence
2. Leveraged loan investors still demand LIBOR floors.
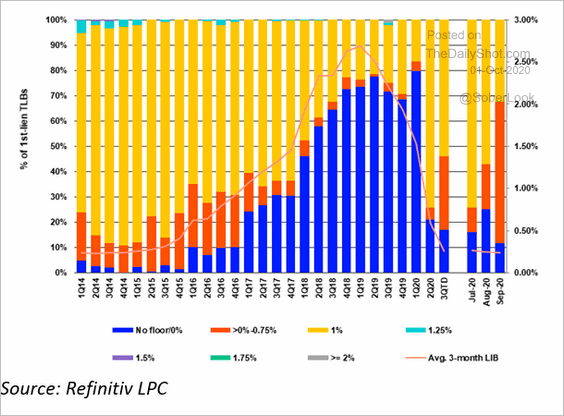 Source: @Refinitiv
3. Loan funds’ AUM declined sharply this year.
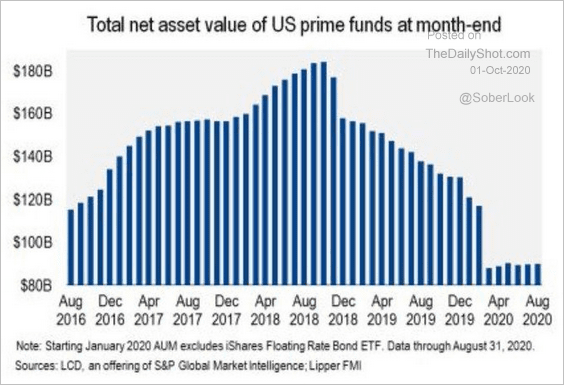 Source: @lcdnews, @Kakourisr
4. Next, let’s take a look at COVID-related corporate failures.
• Chapter 11 filings:
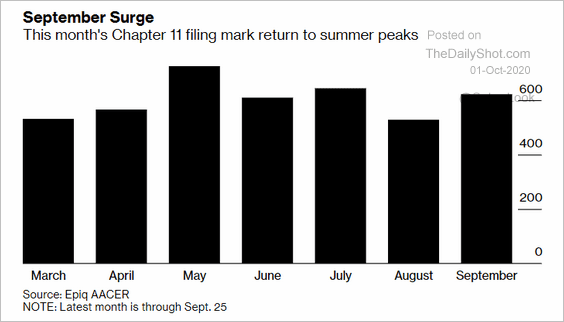 Source: @business Read full article
• Retail closures:
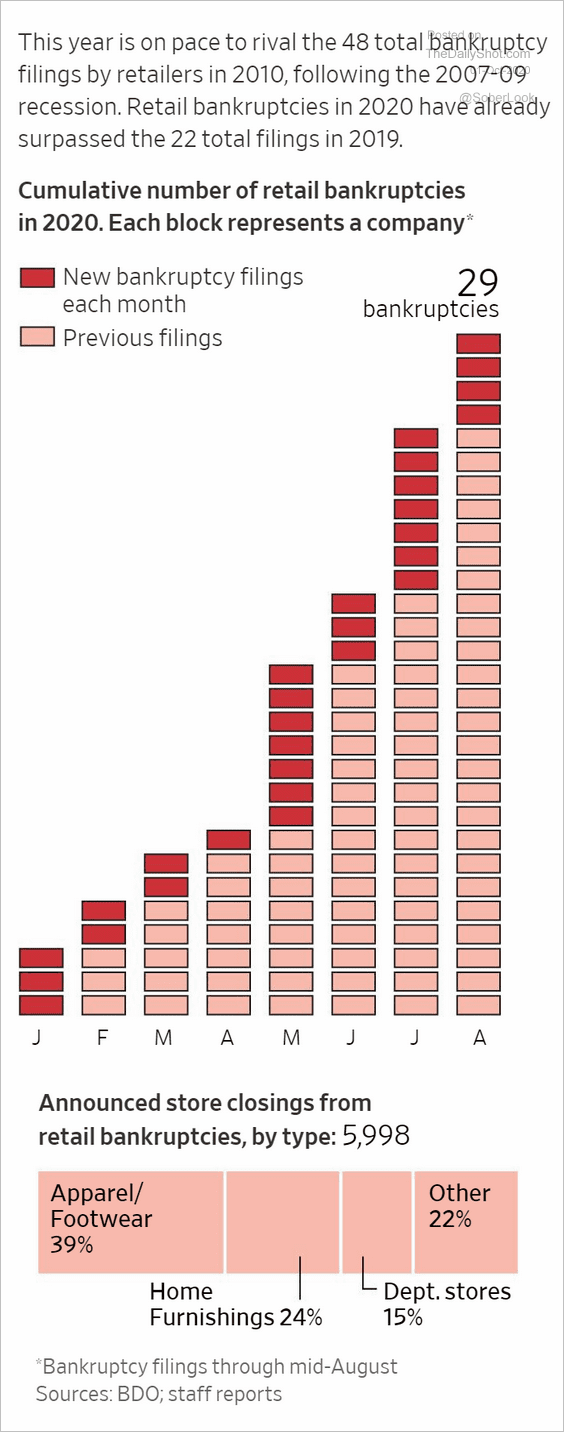 Source: @WSJ Read full article
• Projected global insolvencies in 2021:
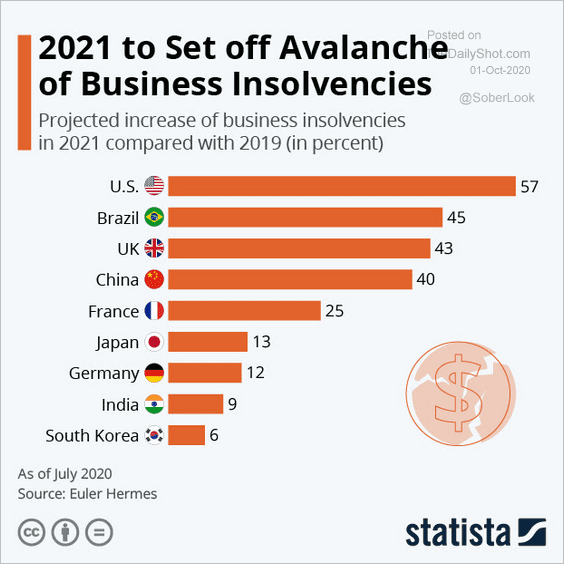 Source: Statista
Rates
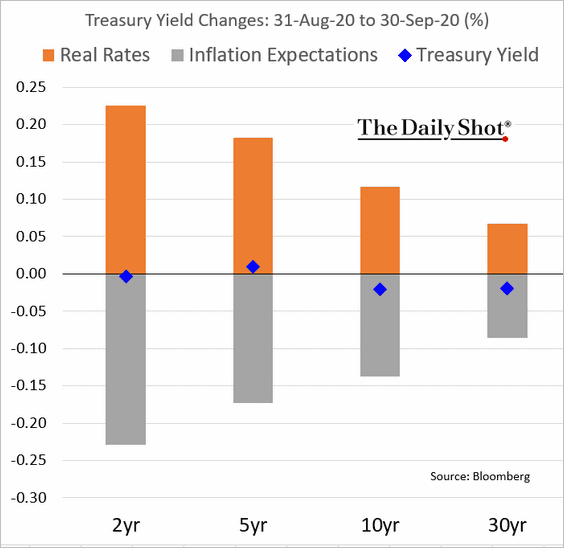
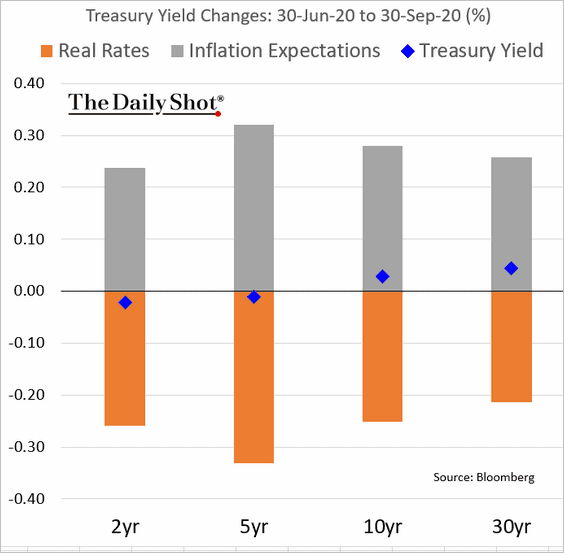
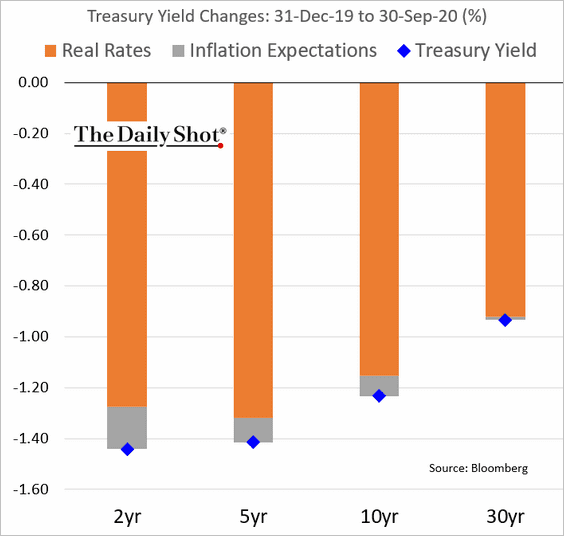
1. Here are the attribution charts for Treasury yield changes.
• Month-to-date:
• Quarter-to-date:
• Year-to-date:
——————–
2. This chart shows the history of CBO’s 10yr Treasury yield forecasts.
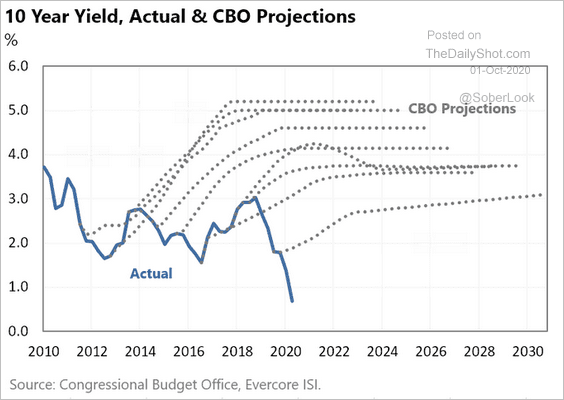 Source: Evercore ISI, @ernietedeschi
3. Over the long run, bond yields are driven by demographics.
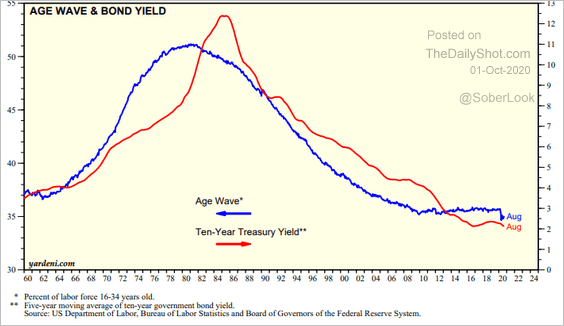 Source: Yardeni Research
Energy
1. Brent has been holding resistance at the 200-day moving average.
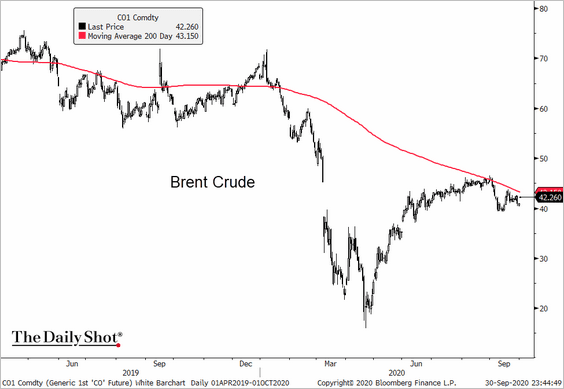 Source: @TheTerminal, Bloomberg Finance L.P.
Brent remains in a long-term downtrend.
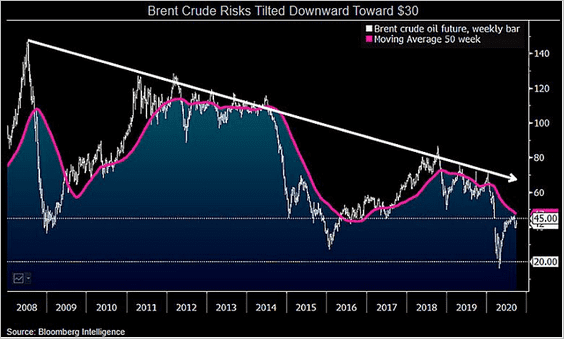 Source: @mikemcglone11
——————–
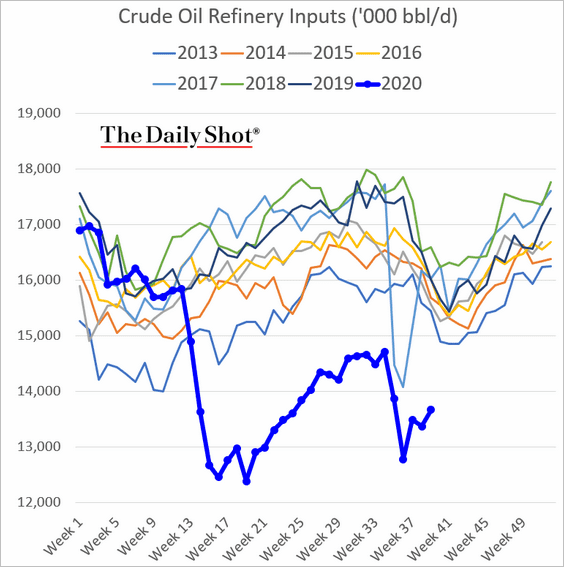
2. US gasoline demand is still at levels we saw in 2013 and 2014.
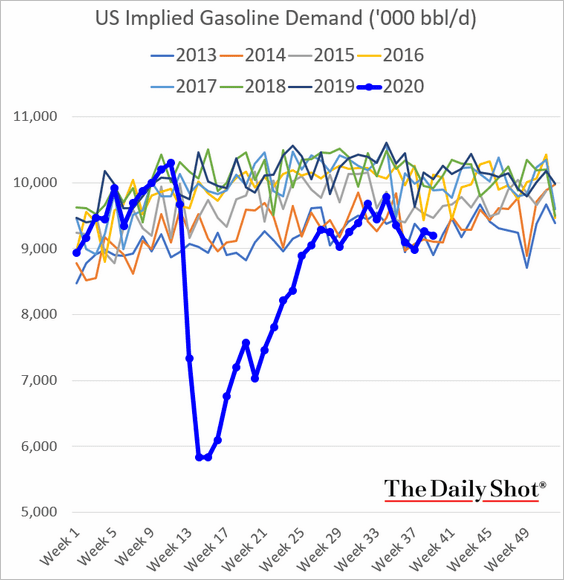
Refinery runs seem to have bottomed.
——————–
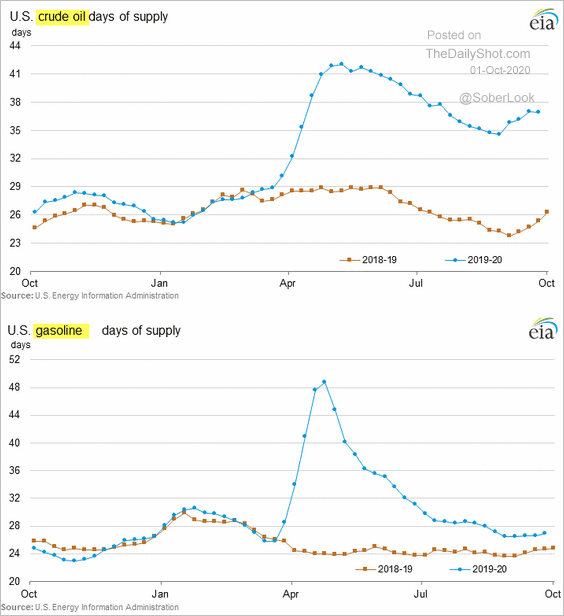
3. US crude oil inventories ticked lower last week.
4. Energy shares continue to underperform.
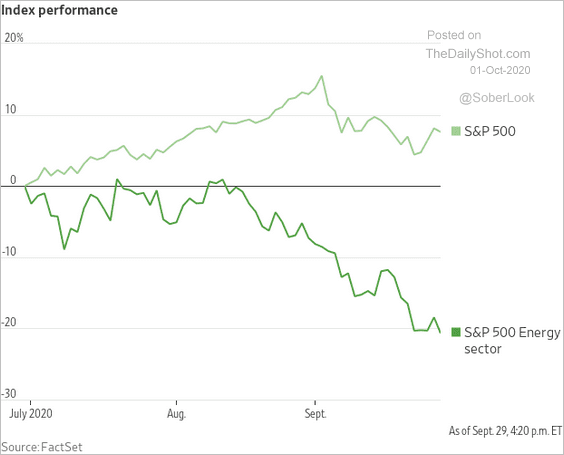 Source: @WSJ Read full article
But the IEA crude oil demand forecast shows a steady recovery over the next two years, which bodes well for energy shares.
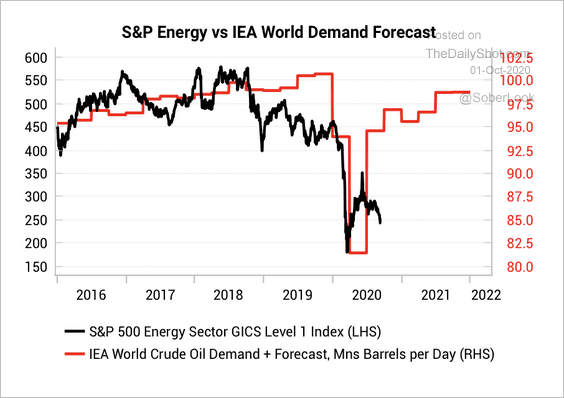 Source: Variant Perception
——————–
5. US energy CapEx plans are recovering.
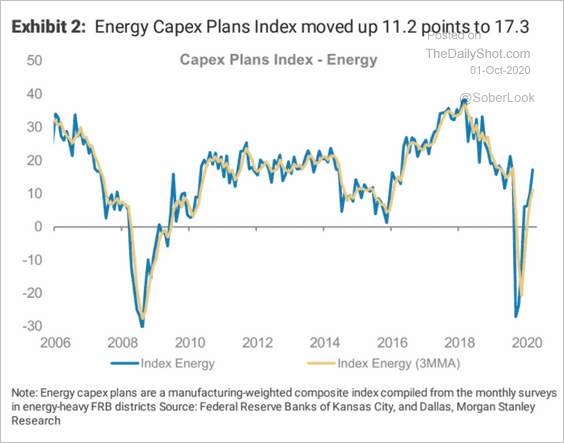 Source: Morgan Stanley Research
6. What instruments do US exploration and production companies use when hedging their oil exposure?
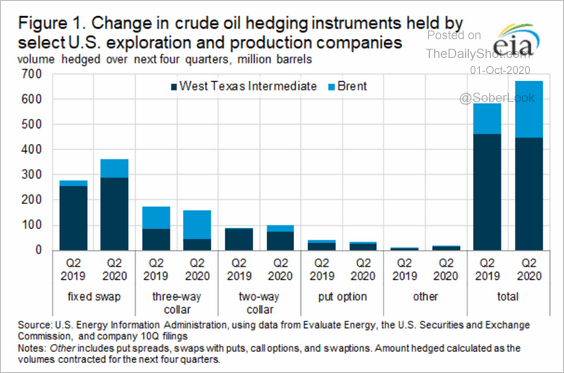 Source: @EIAgov Read full article
Here are the payout profiles for each instrument.

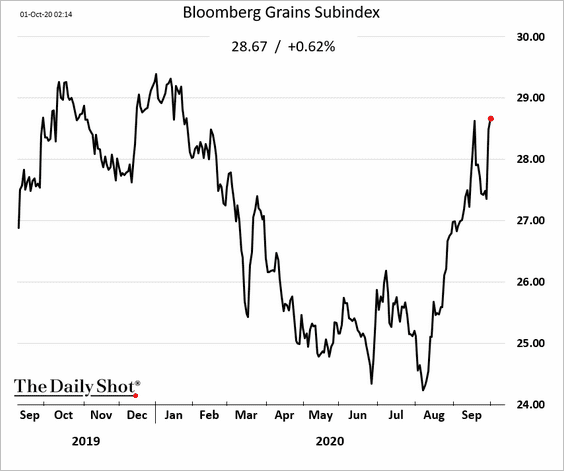
Commodities
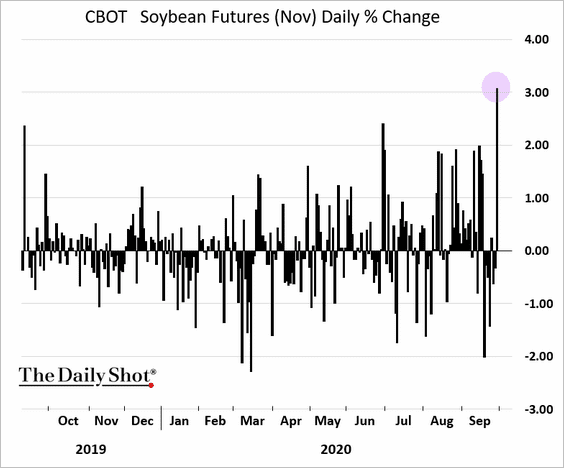
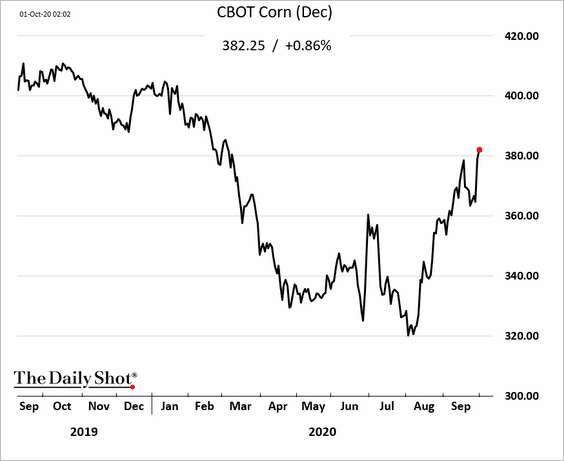
US grains are rallying in response to a bullish USDA report (tighter than expected inventories).
• Soybeans (daily % changes):
• Corn (as of Thursday morning):
• Bloomberg’s grains index:
Emerging Markets
1. Let’s run through the September manufacturing PMI data for Asian economies.
• Strong performers:
– India:
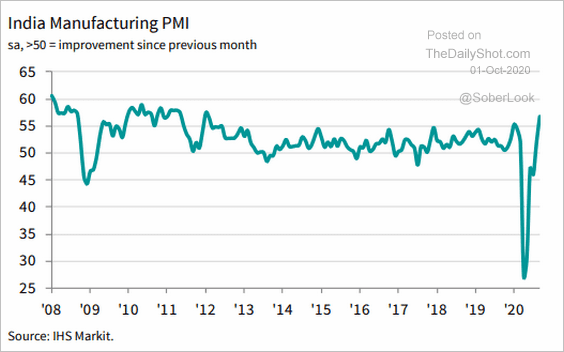 Source: @IHSMarkitPMI Read full article
– Vietnam:
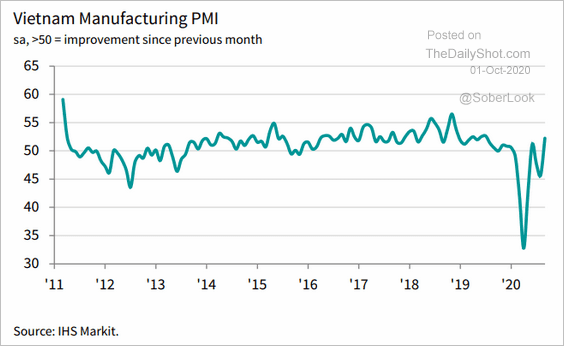 Source: @IHSMarkitPMI Read full article
• Treading water:
– Thailand:
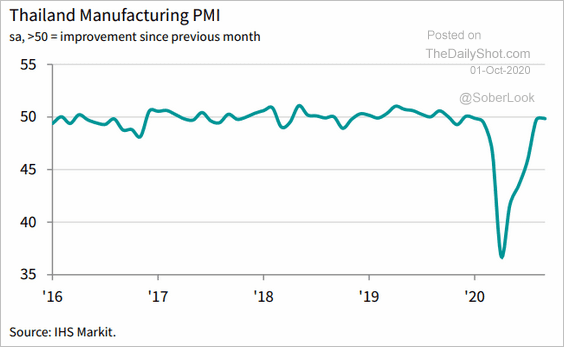 Source: @IHSMarkitPMI Read full article
• Weak performers:
– Indonesia:
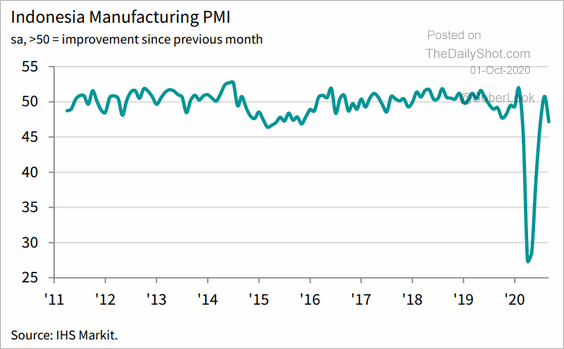 Source: @IHSMarkitPMI Read full article
– Malaysia:
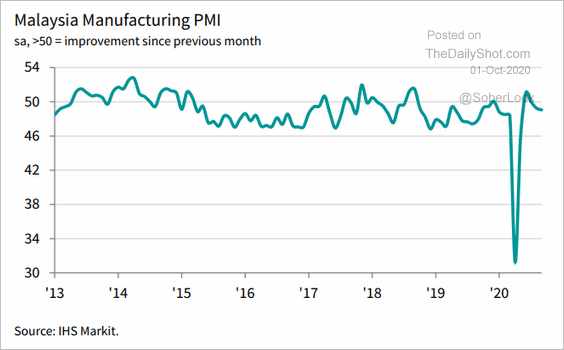 Source: @IHSMarkitPMI Read full article
——————–
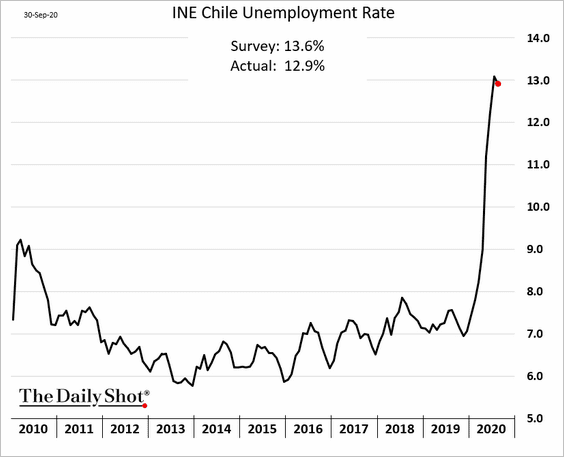
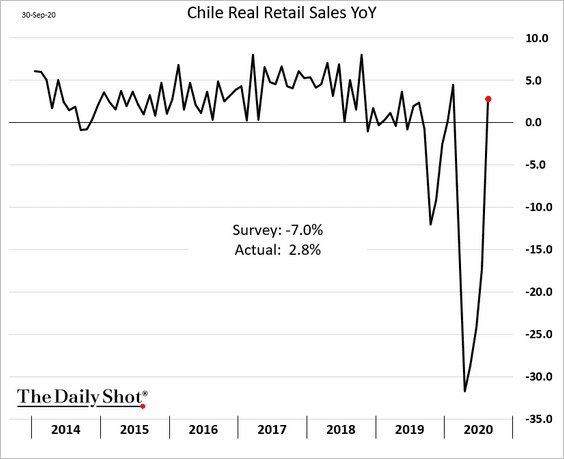
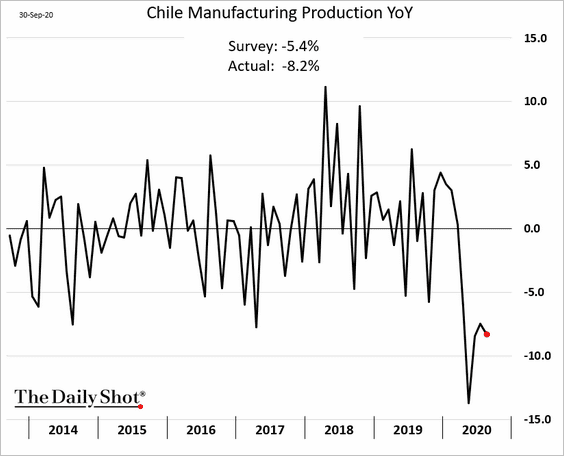
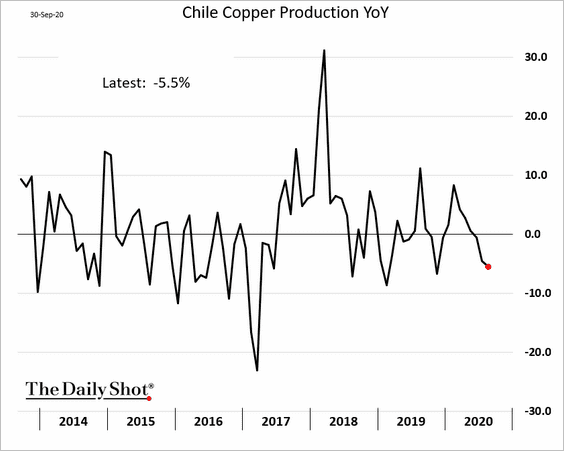
2. Next, we have some updates on Chile’s economy.
• Unemployment appears to have peaked.
• Retail sales are now up vs. last year.
• However, factory output is struggling.
• There have been no improvements in copper production.
——————–
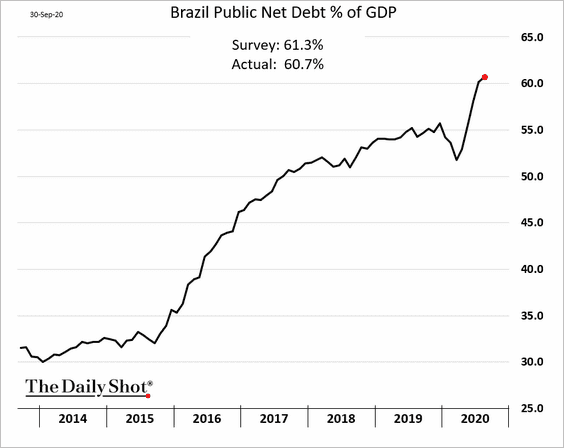
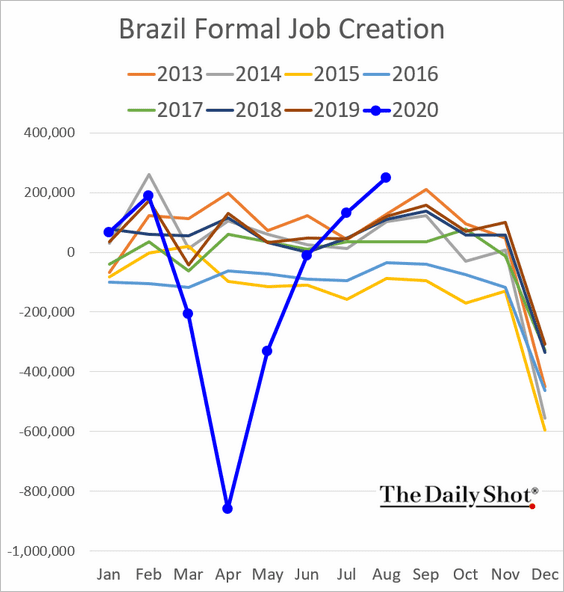
3. Brazil’s fiscal situation remains a concern.
• Debt-to-GDP:
• Fiscal deficit:
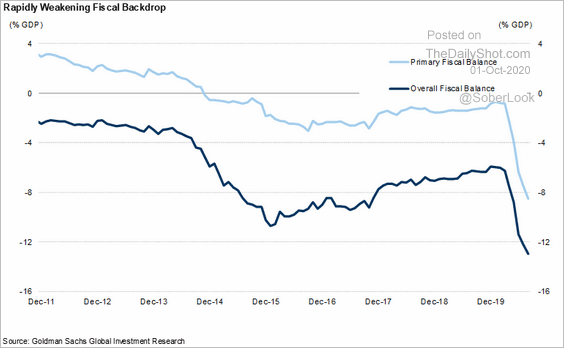 Source: Goldman Sachs
Brazil’s formal job creation has rebounded.
——————–
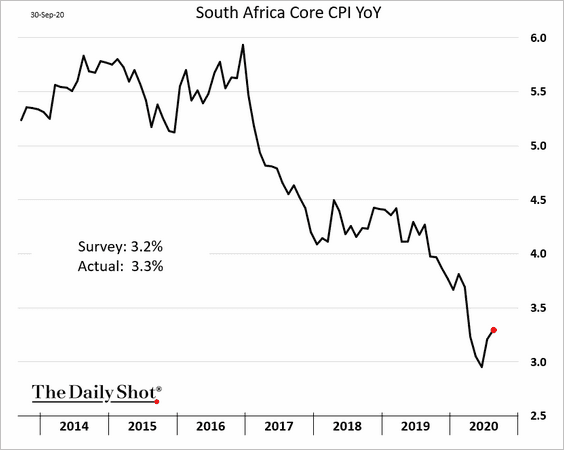
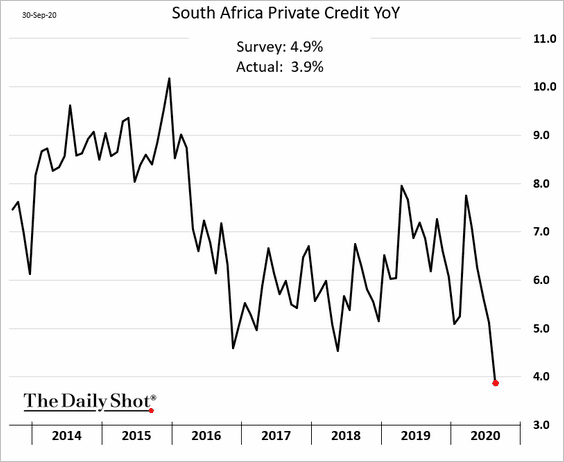
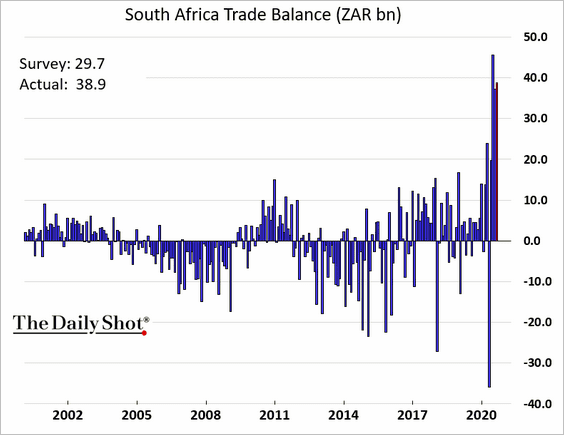
4. Finally, here are some updates on South Africa.
• Core inflation:
• Credit expansion:
• Trade balance:
China
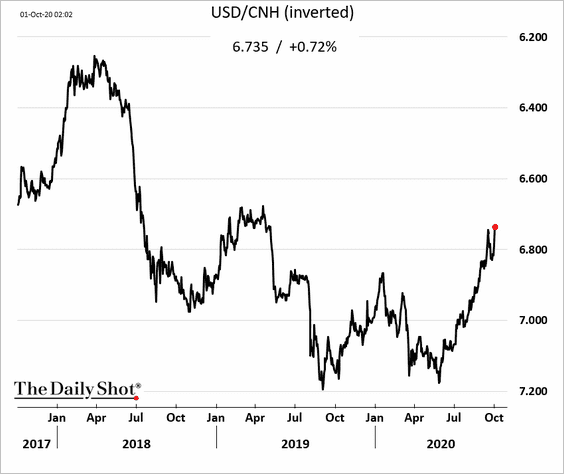
1. The offshore yuan rose sharply in response to the US stimulus hopes (see the equities section).
2. China’s commodity-related sectors have been struggling with margin contraction.
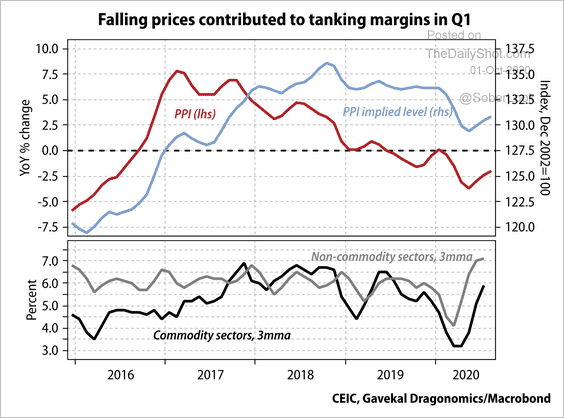 Source: Gavekal
3. Corporate revenues improved sharply in Q3.
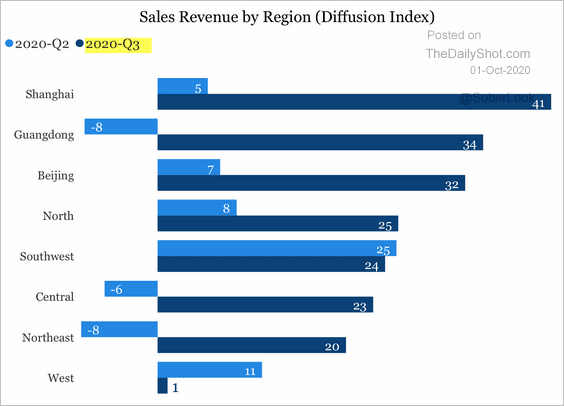 Source: China Beige Book
4. China’s automotive sector has become self-sufficient.
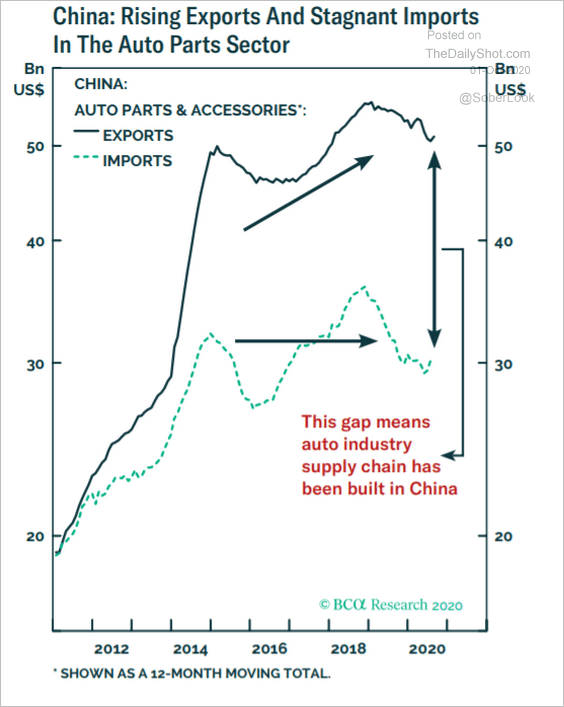 Source: BCA Research
5. Manufacturing employment is expected to decline further.
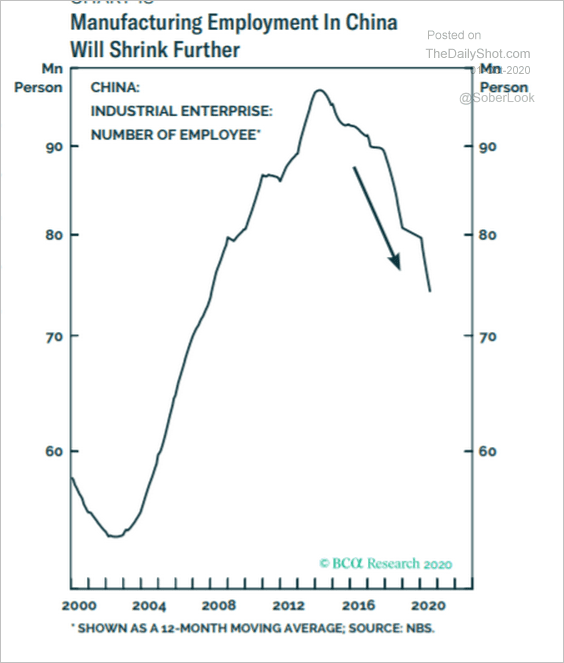 Source: BCA Research
6. Finally, here is a projection of retail sales revenues (vs. the US).
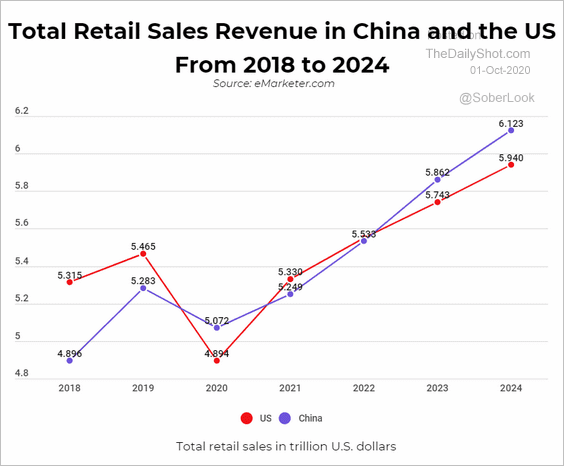 Source: Buyshares Read full article
Asia – Pacific
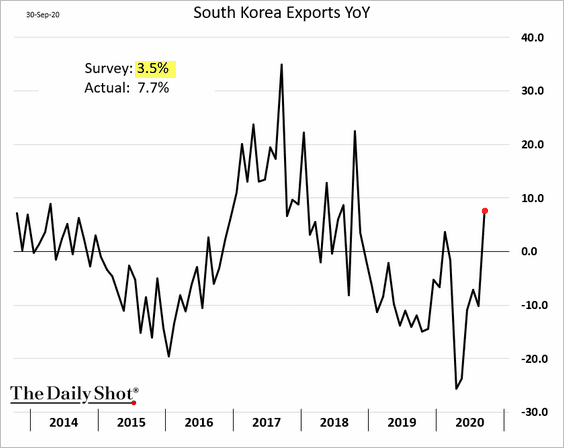
1. South Korean exports surprised to the upside.
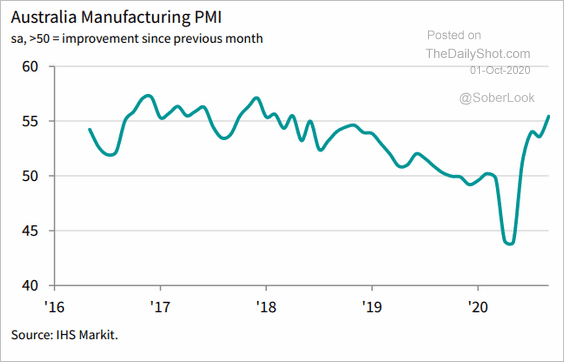
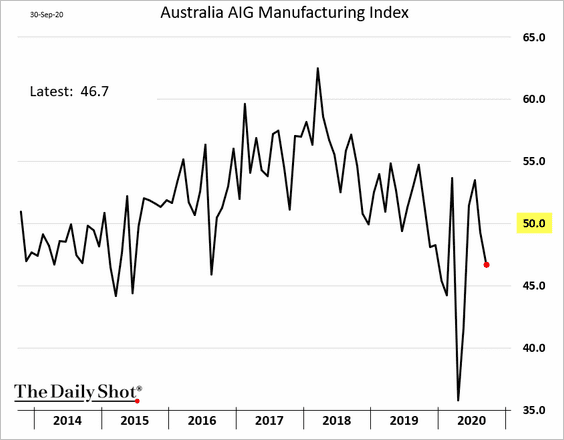
2. Australia’s factory activity indices diverged in September.
• Markit PMI:
 Source: @IHSMarkitPMI Read full article
• AIG index:
Japan
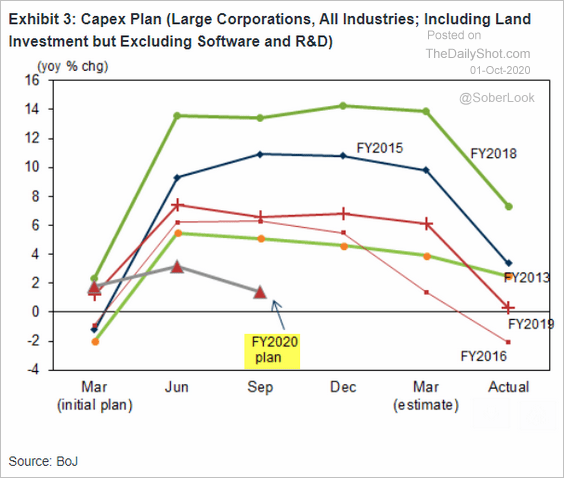
1. The Tankan report showed large manufacturers becoming slightly more upbeat but smaller firms still struggling.
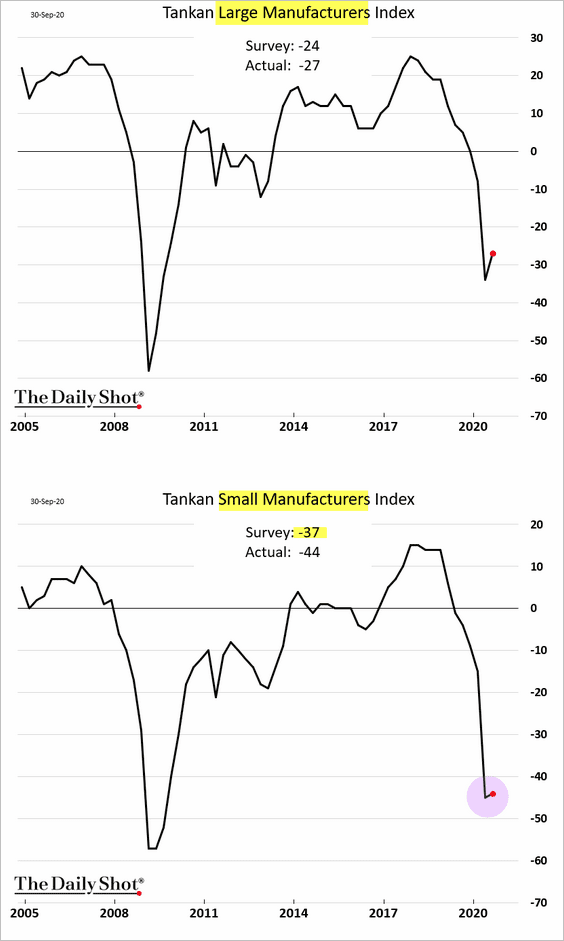
CapEx expectations remain soft.
 Source: Goldman Sachs
——————–
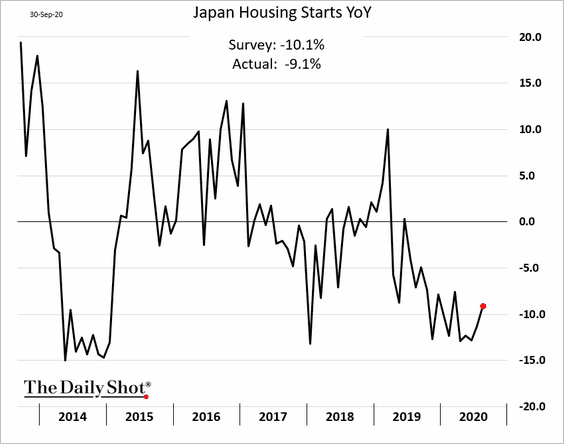
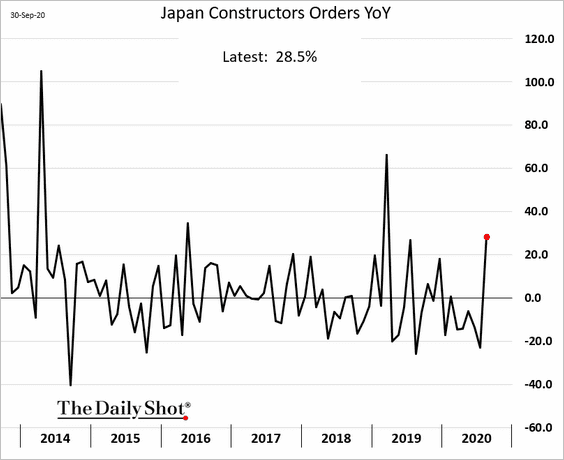
2. Housing starts stabilized, and construction orders rebounded in August.
The Eurozone
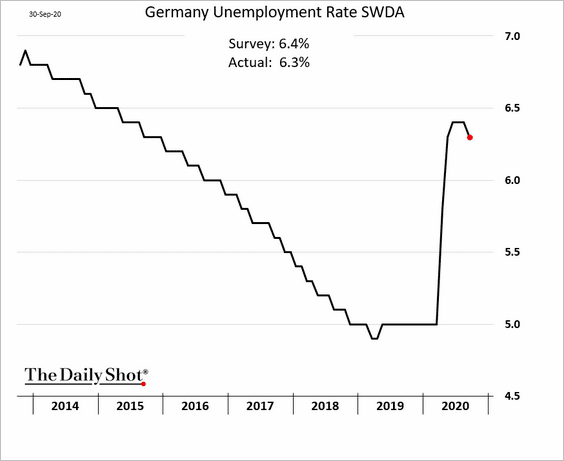
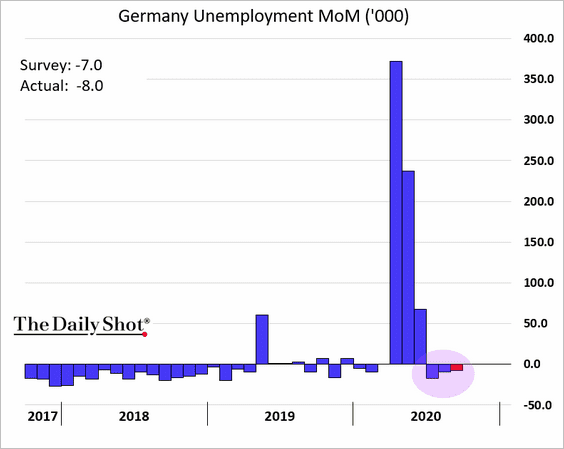
1. Germany’s labor market is recovering.
• The unemployment rate:
• Vacancies:
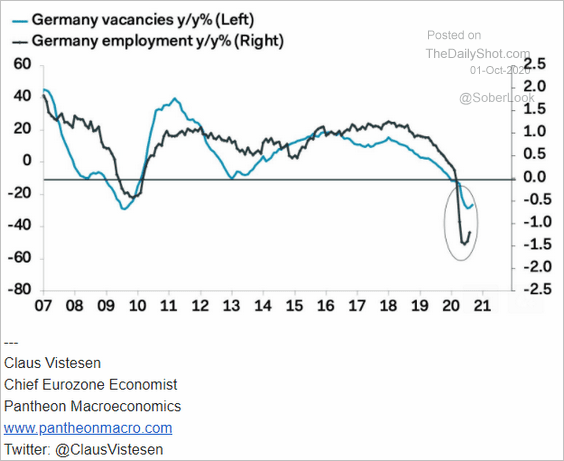 Source: Pantheon Macroeconomics
• Unemployment changes:
——————–
2. Germany’s COVID hospitalizations are increasing again.
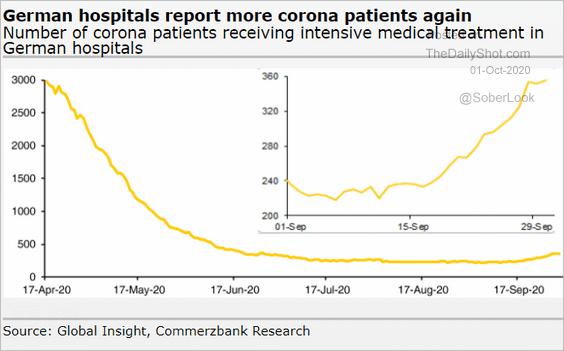 Source: Commerzbank Research
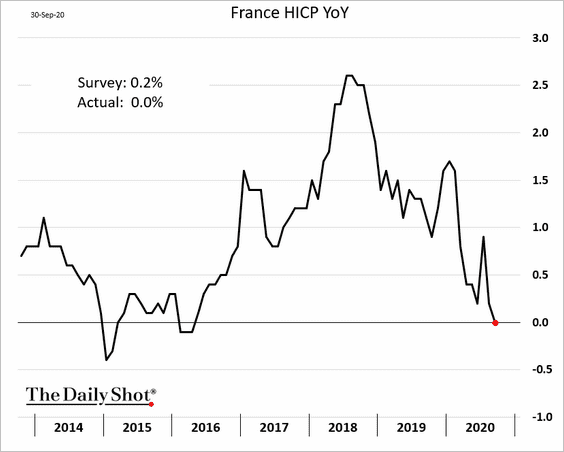
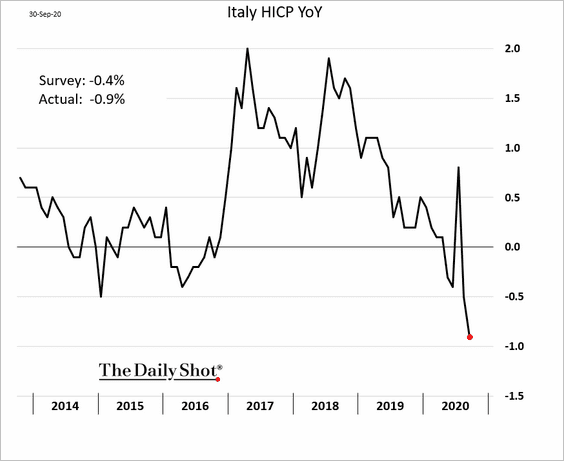
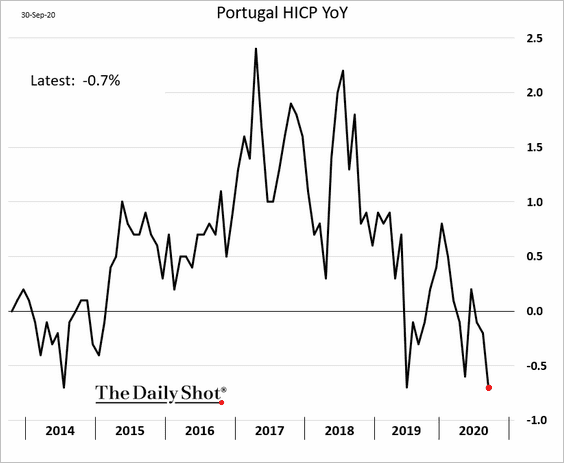
3. The Eurozone’s inflation collapsed in September, coming in below forecasts.
• France:
• Italy:
• Portugal:
——————–
4. This chart shows the Eurozone’s discouraged workers.
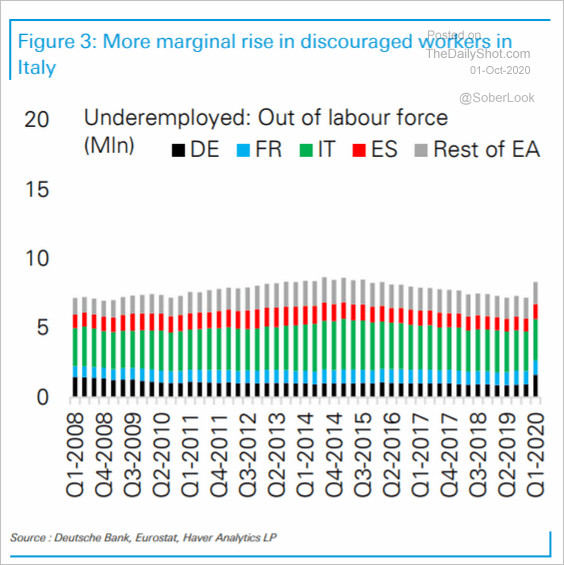 Source: Deutsche Bank Research
Canada
1. The economy continued to grow in July, but the recovery has been uneven.
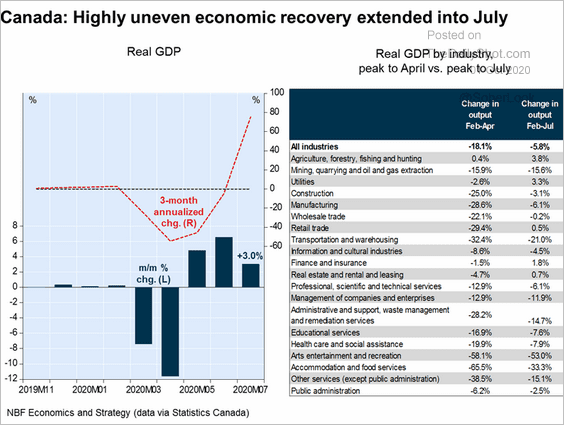 Source: Economics and Strategy Group, National Bank of Canada
Here is the GDP trajectory.
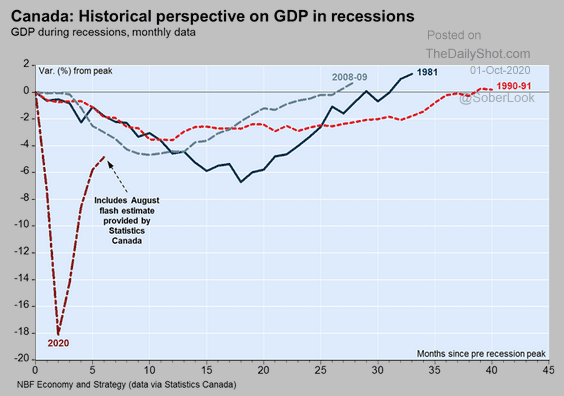 Source: Economics and Strategy Group, National Bank of Canada
——————–
2. The Oxford Economics activity tracker shows recovery stalling.
![]()
3. How did the market perform in Q3?
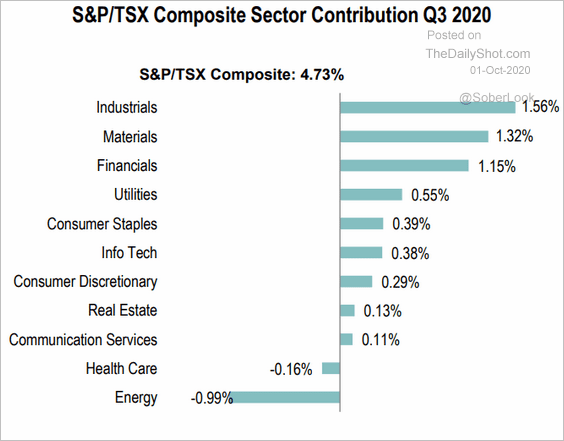 Source: S&P Global Market Intelligence
4. Canada’s energy sector now consists mainly of pipelines.
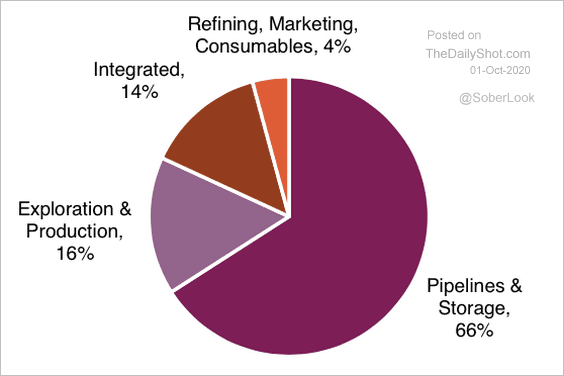 Source: Market Ethos, Richardson GMP
• Both the valuation and price of TSX pipeline stocks are near multi-year lows.
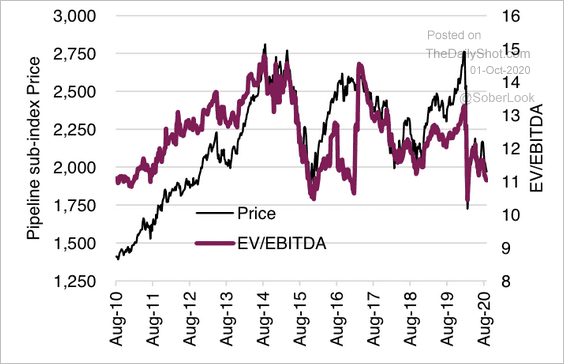 Source: Market Ethos, Richardson GMP
• Energy’s weight in the TSX has declined over the years.
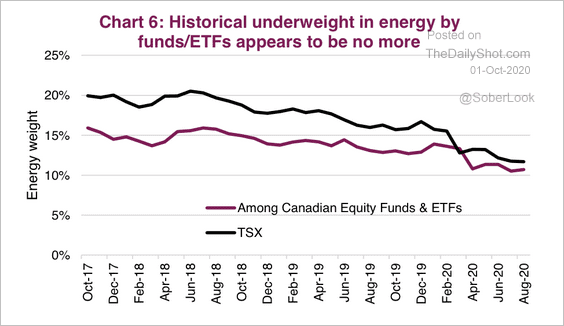 Source: Market Ethos, Richardson GMP
The United States
1. The ADP private payrolls report surprised to the upside, pointing to continuing labor market recovery.
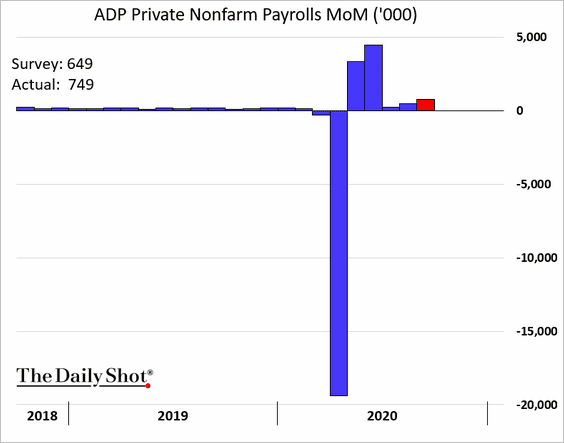
Job growth in September was broad.
 Source: ADP
——————–
2. The Chicago PMI index soared in September.
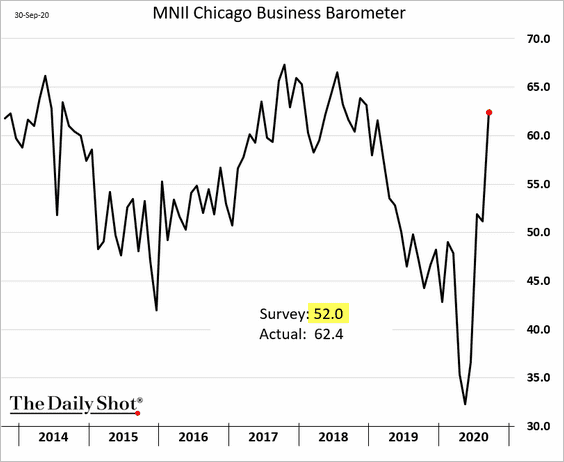
It’s signaling a more robust factory expansion at the national level.
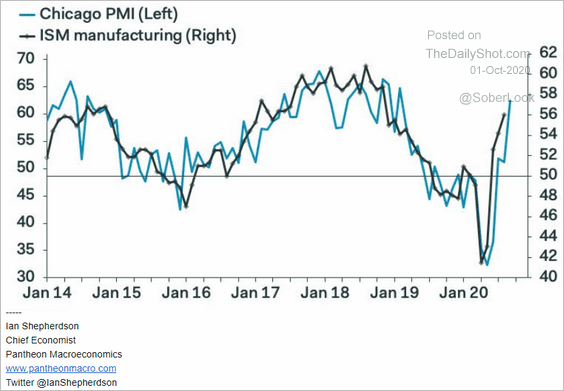 Source: Pantheon Macroeconomics
——————–
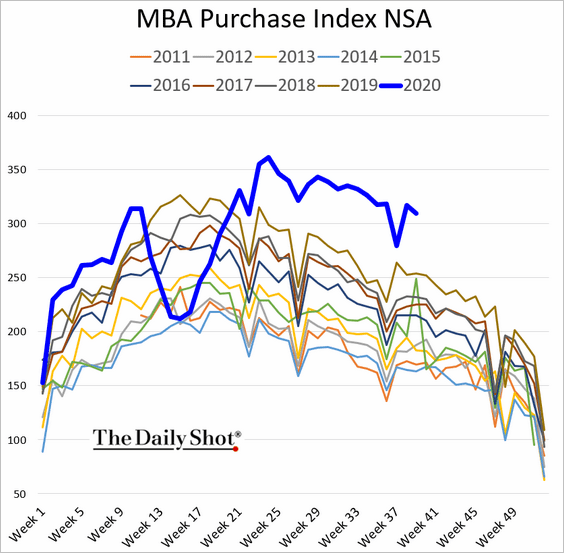
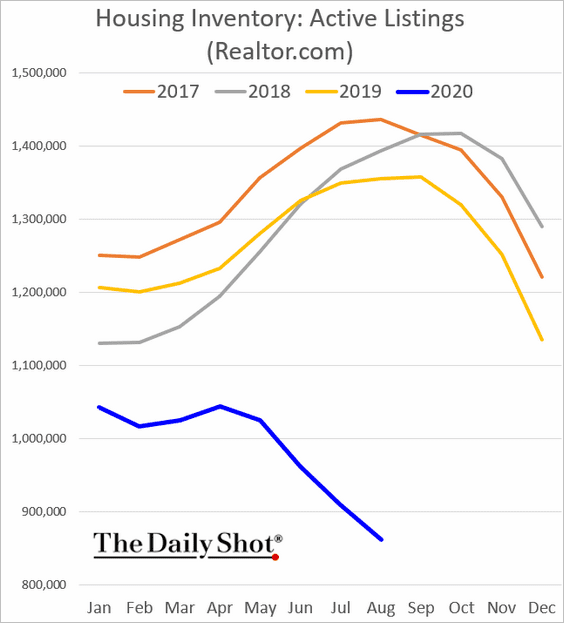
3. Next, we have some updates on the housing market.
• Mortgage applications remain remarkably strong.
• Active listings of homes for sale continue to trend lower.
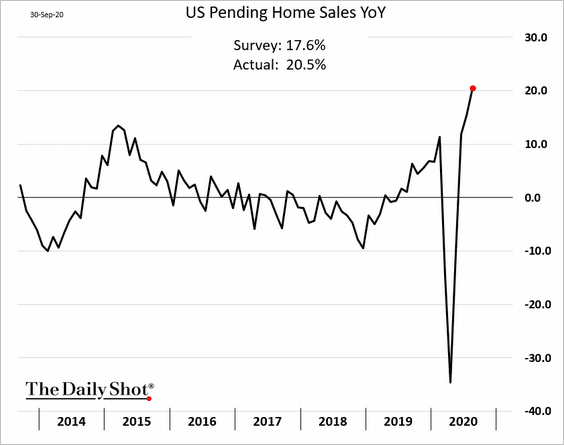
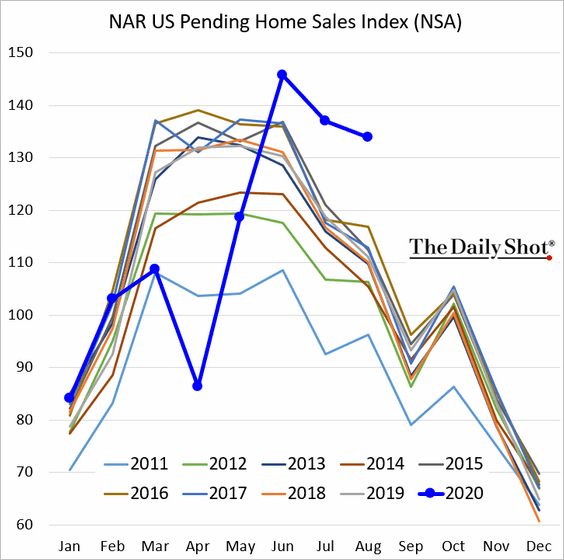
• Despite low inventories, pending home sales surged.
– Year-over-year:
– Level (not seasonally adjusted):
– Seasonally adjusted:
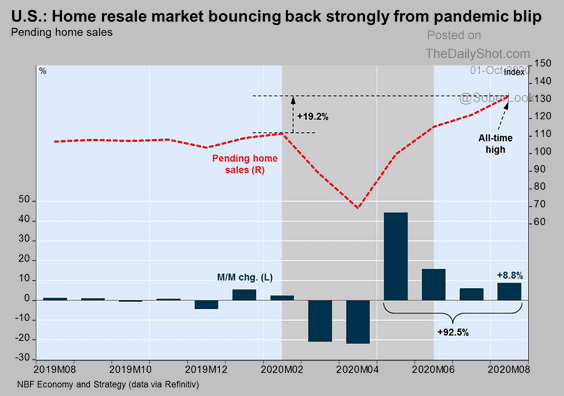 Source: Economics and Strategy Group, National Bank of Canada
——————–
Food for Thought
1. Which consumer items are in and which are out?
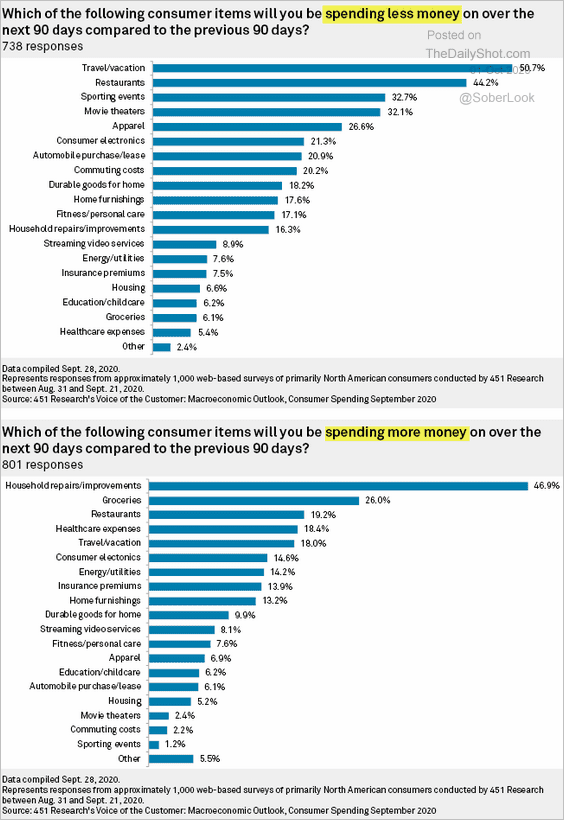 Source: S&P Global Market Intelligence
2. Cities’ GDP per capita vs. population:
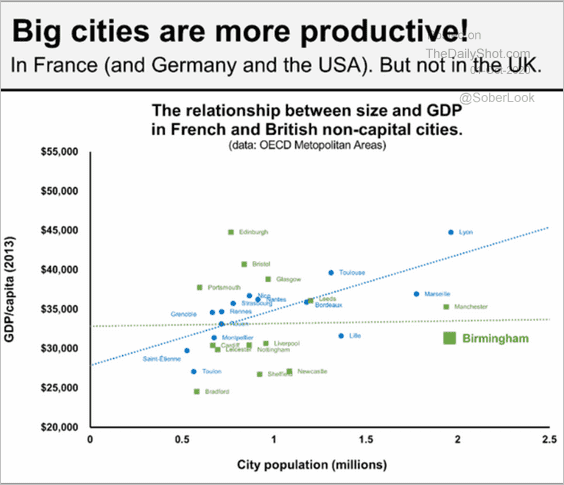 Source: @thomasforth Read full article
3. Solar and wind power, by country:
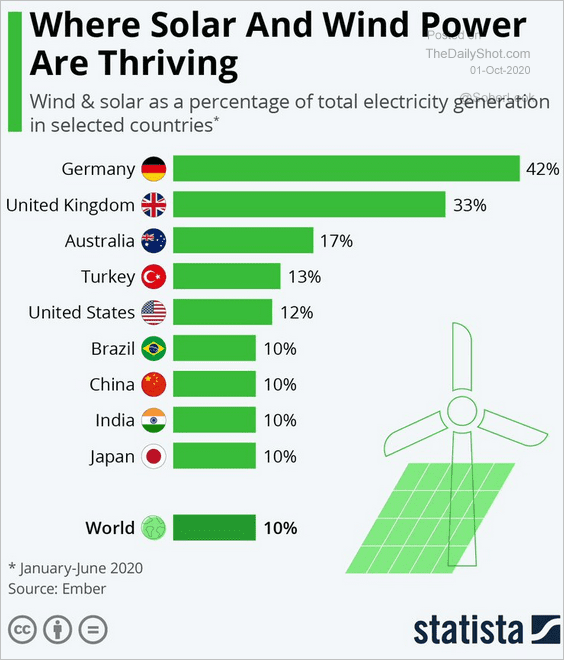 Source: Statista Further reading
4. Weekly death rates among the elderly in France:
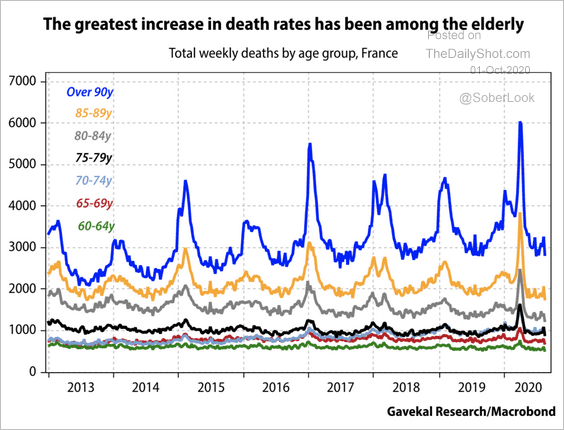 Source: Gavekal
5. International trade vs. foreign-born population, by state:
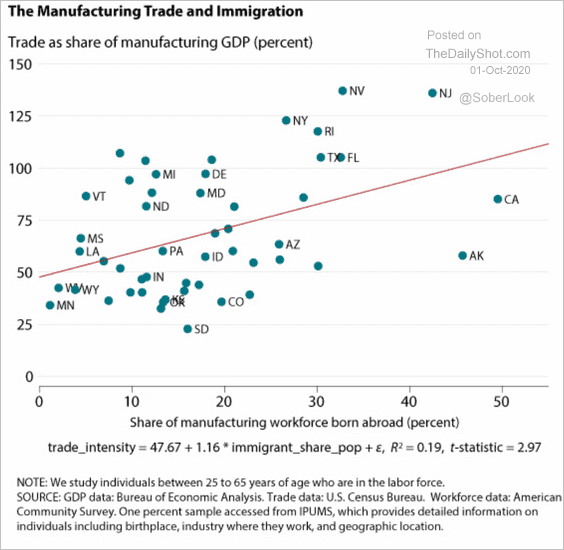 Source: @stlouisfed Read full article
6. Two debate-related charts:
• Crosstalk:
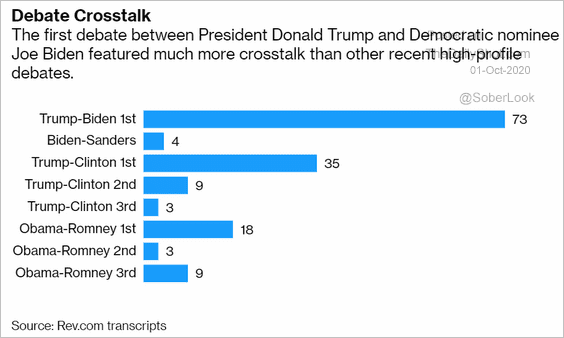 Source: @bpolitics Read full article
• Google search activity for “move to Canada”:
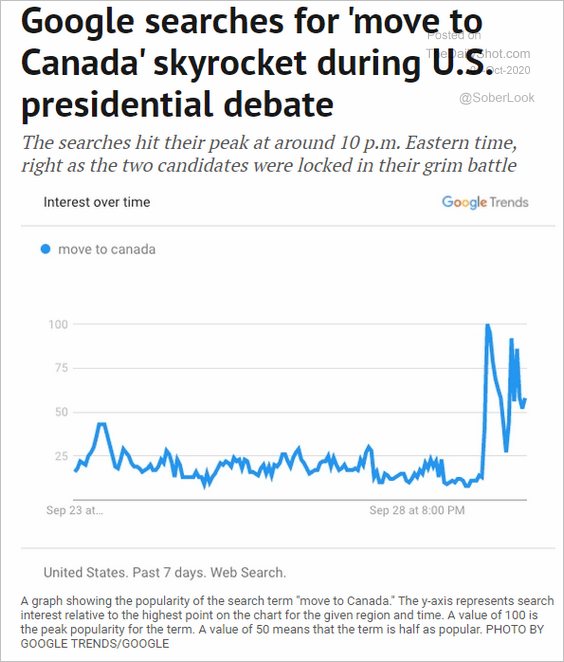 Source: National Post Read full article
——————–
7. Who spreads fake news?
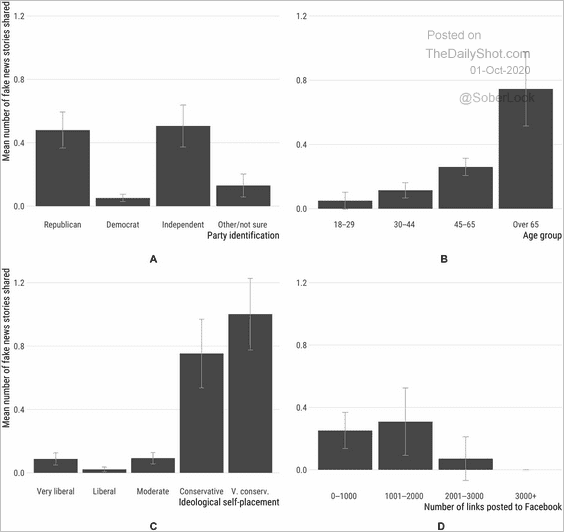 Source: American Association for the Advancement of Science. Read full article
8. Instant noodles:
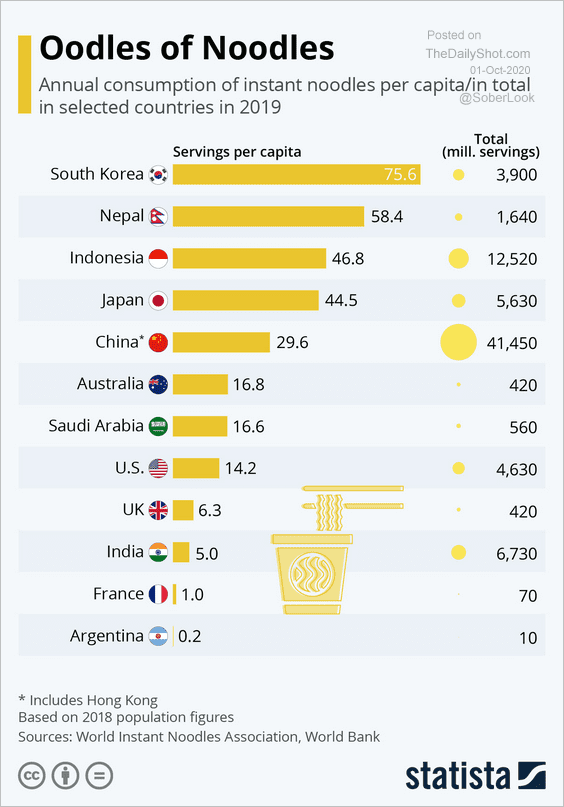 Source: Statista
——————–