The Daily Shot: 12-Oct-20
• Global Developments
• The United States
• Canada
• The United Kingdom
• The Eurozone
• Europe
• Asia – Pacific
• China
• Emerging Markets
• Commodities
• Energy
• Equities
• Rates
• Food for Thought
Global Developments
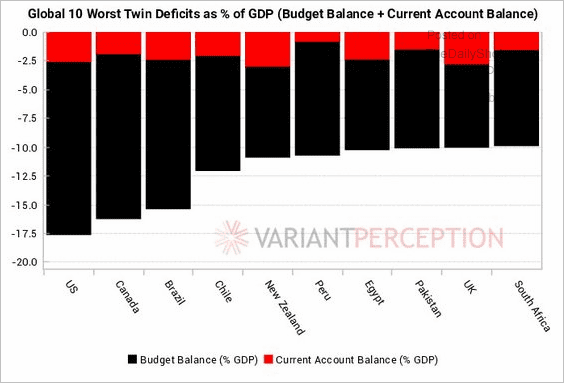
1. Which countries have the highest twin deficits?
 Source: @VrntPerception
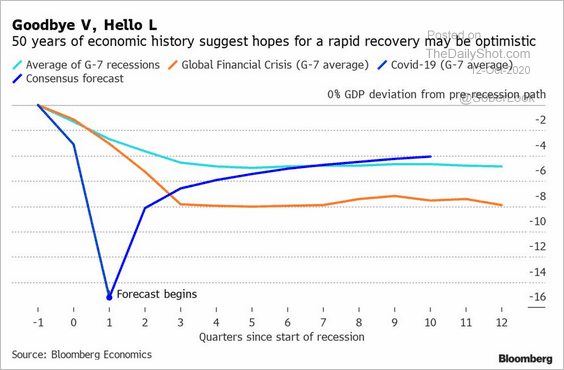
2. Are the latest forecasts for global growth too optimistic? Here is a comparison to previous recoveries (deviation from the pre-recession path).
 Source: @markets Read full article
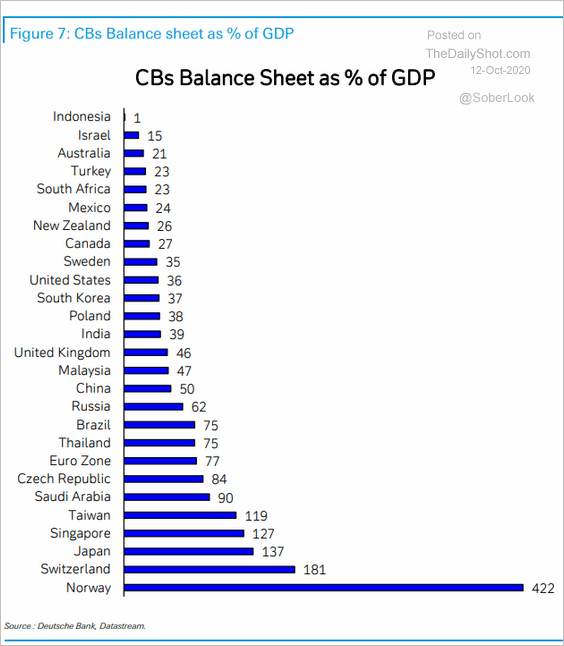
3. This chart shows each central bank’s balance sheet as a percentage of the GDP.
 Source: Deutsche Bank Research
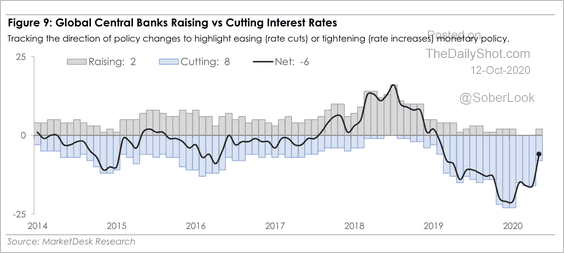
Separately, the pace of net rate cuts globally has been slowing.
 Source: MarketDesk Research
——————–
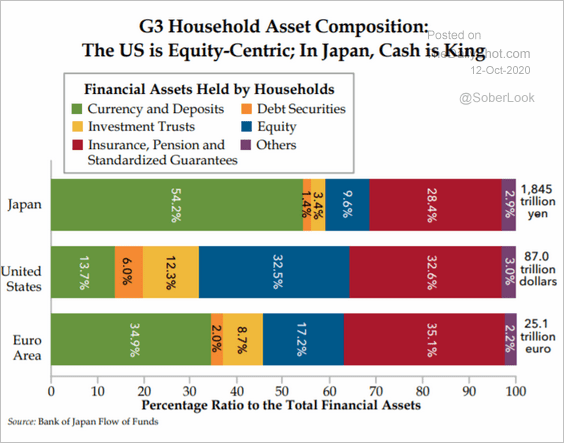
4. Next, we have the composition of the G3 household assets.
 Source: The Daily Feather
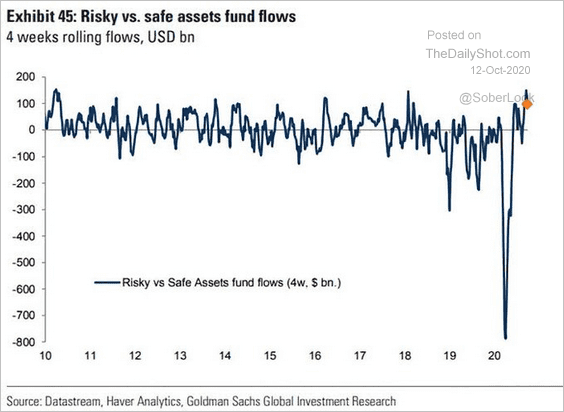
5. Fund flows show an increased appetite for risk assets.
 Source: @ISABELNET_SA, @GoldmanSachs
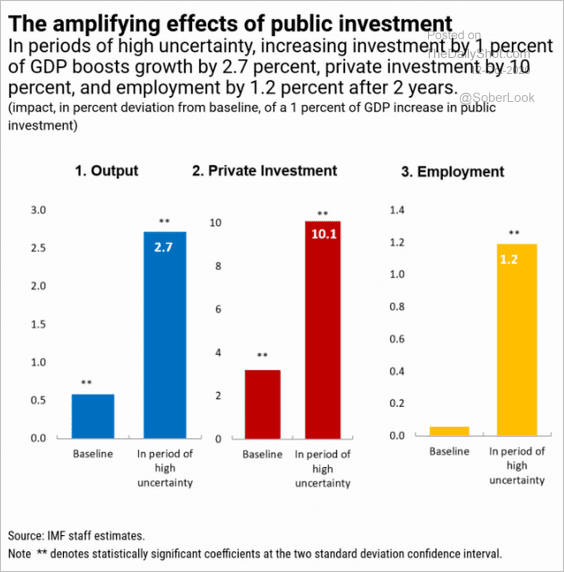
6. How effective is public investment in boosting private-sector activity?
 Source: IMF Read full article
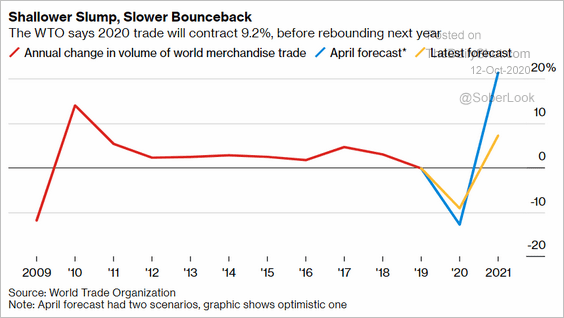
7. Finally, we have a couple of updates on trade.
• The latest WTO forecast for global trade:
 Source: @business Read full article
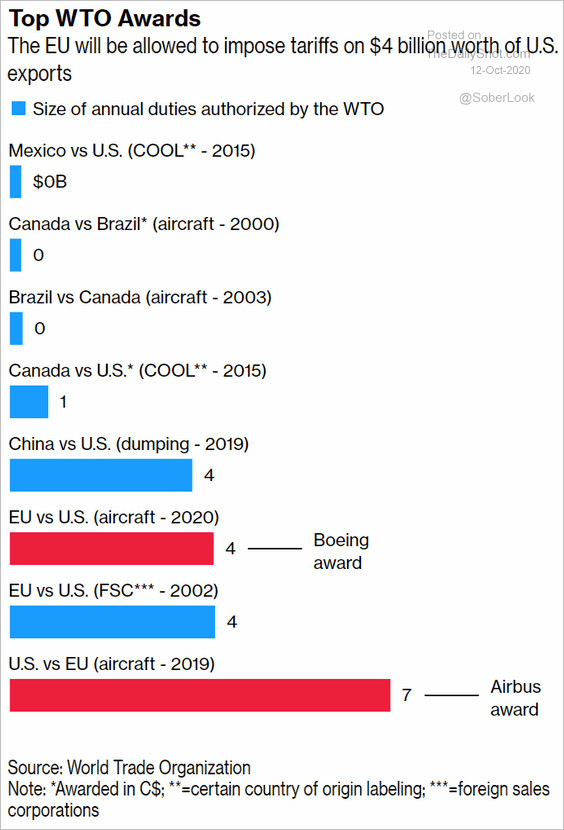
• WTO awards in trade disputes:
 Source: @business Read full article
The United States
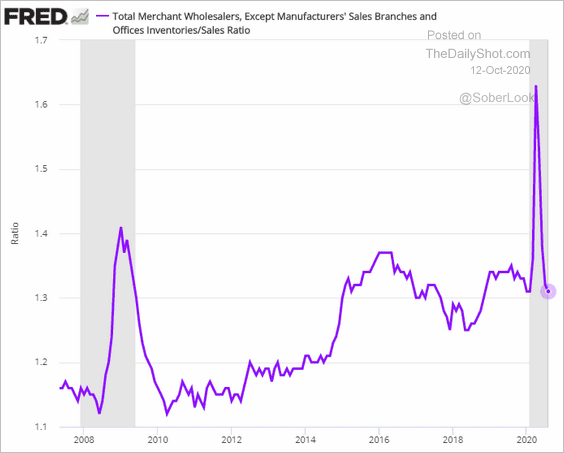
1. The US wholesalers’ inventories-to-sales ratio has returned to pre-crisis levels.
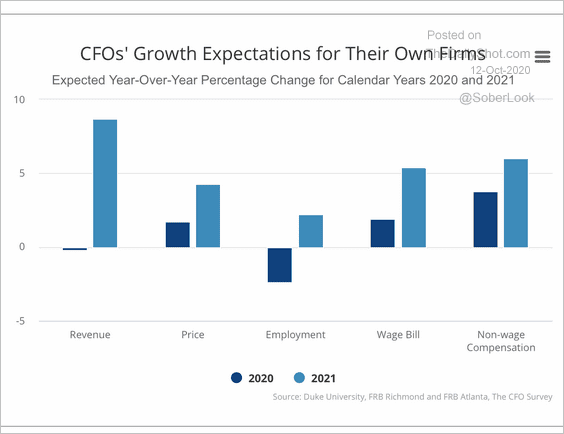
2. US CFOs are optimistic about 2021.
 Source: Richmond Fed Read full article
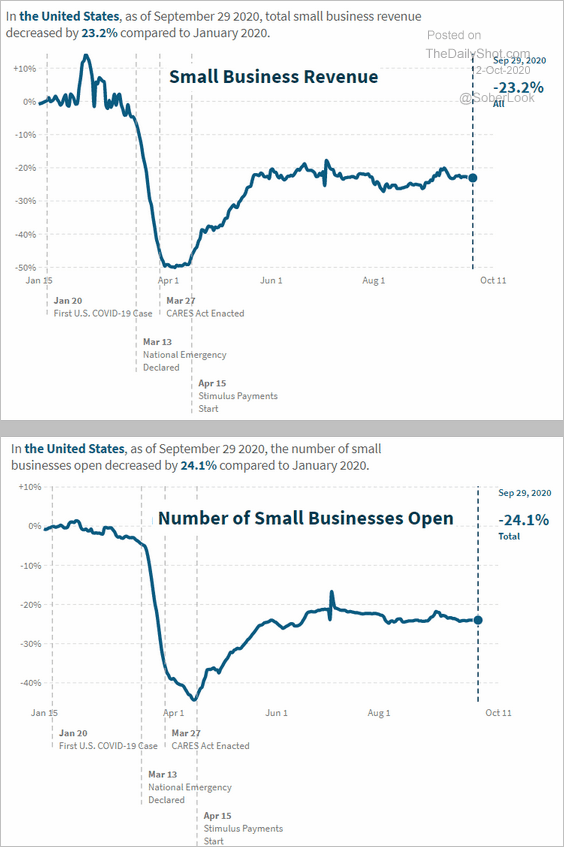
3. Small business activity remains well below last year’s levels.
 Source: Opportunity Insights
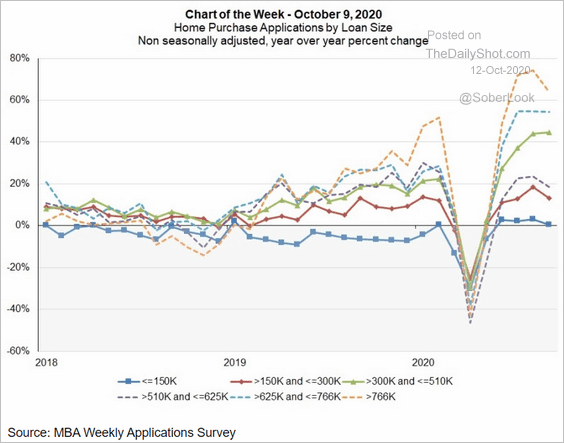
4. Growth in loan applications to purchase higher-end homes has been remarkably strong.
 Source: Mortgage Bankers Association
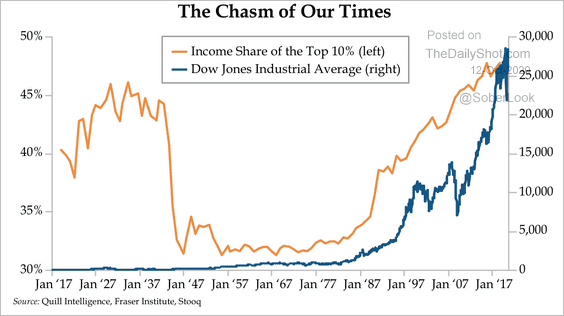
5. Here is the income share of the top 10% vs. the stock market.
 Source: Quill Intelligence
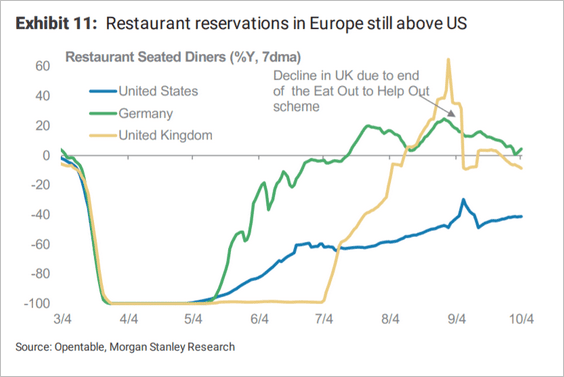
6. US restaurant reservations are still lagging Europe.
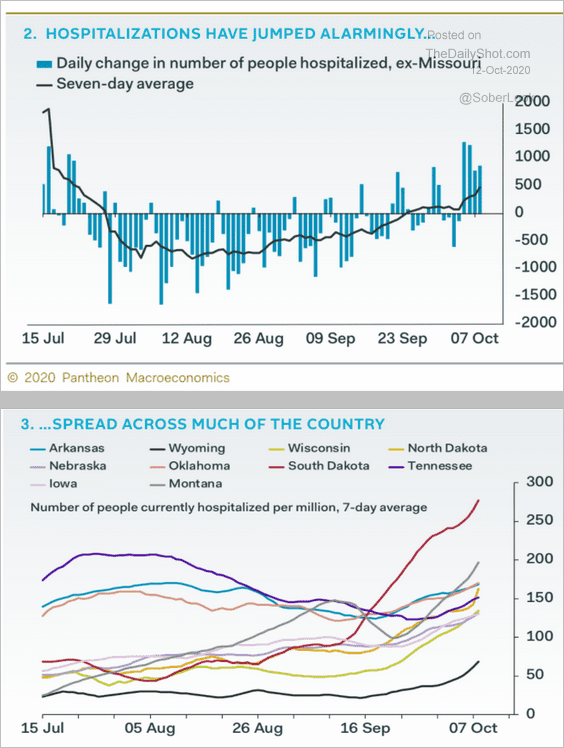
7. US COVID-related hospitalizations are on the rise.
 Source: Pantheon Macroeconomics
Canada
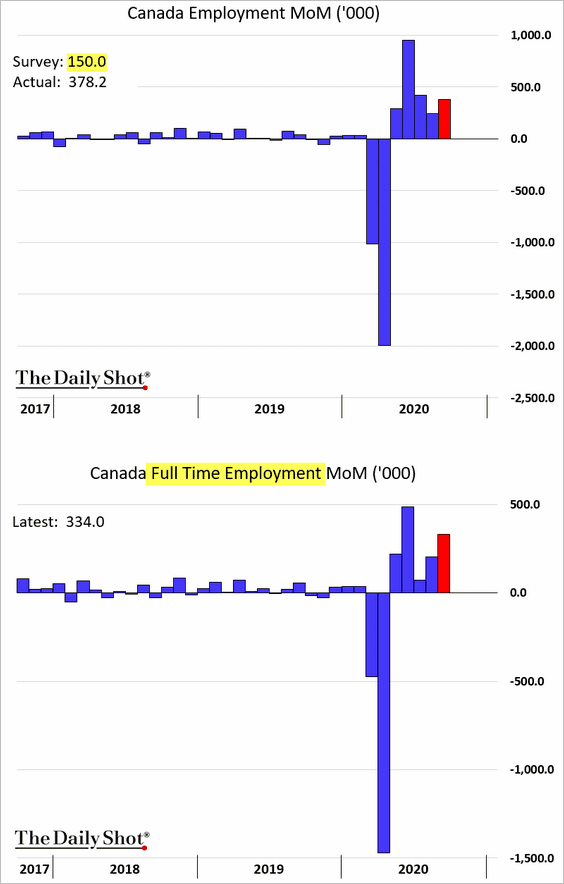
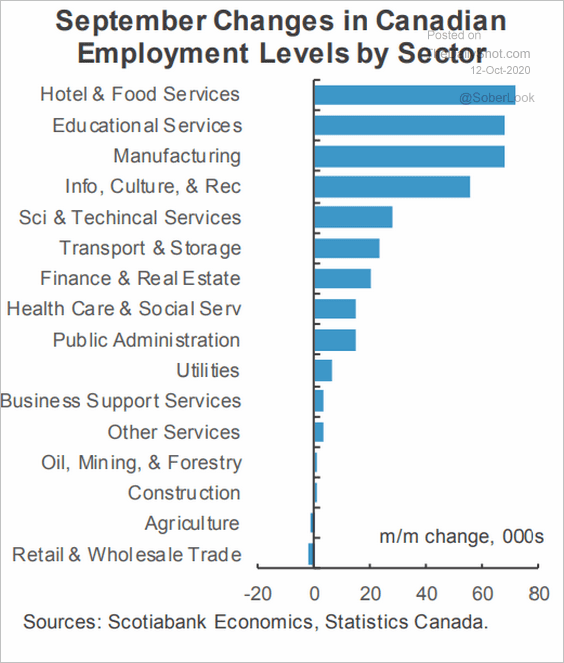
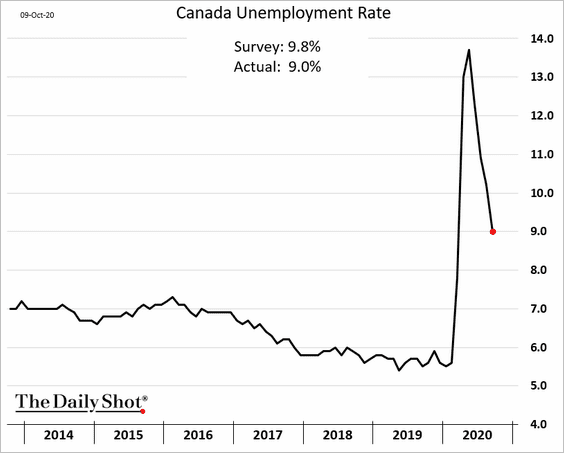
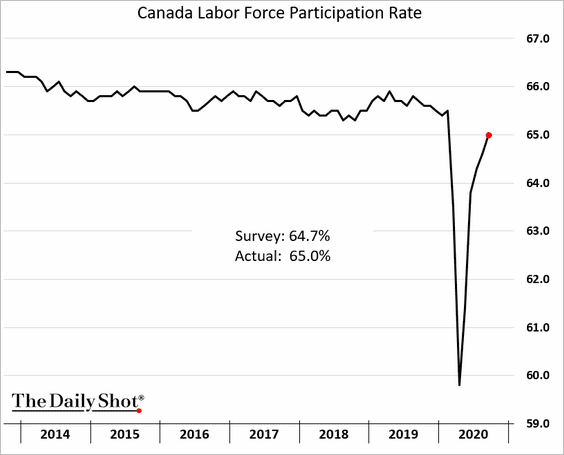
1. The September jobs report surprised to the upside, as Canada’s labor market continues to recover.
• Payrolls (monthly changes):
• Job gains by sector:
 Source: Scotiabank Economics
• The unemployment rate:
• The labor force participation rate:
——————–
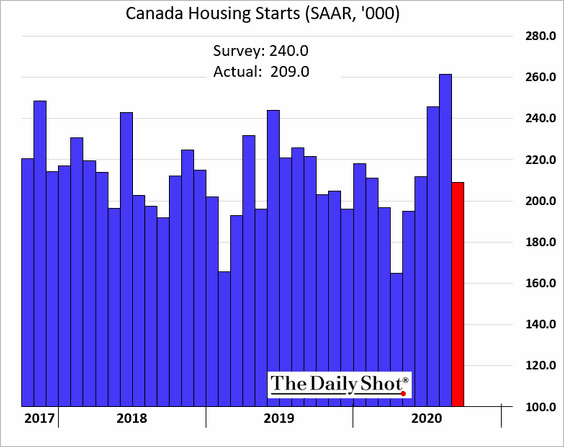
2. Housing starts pulled back from the recent highs.
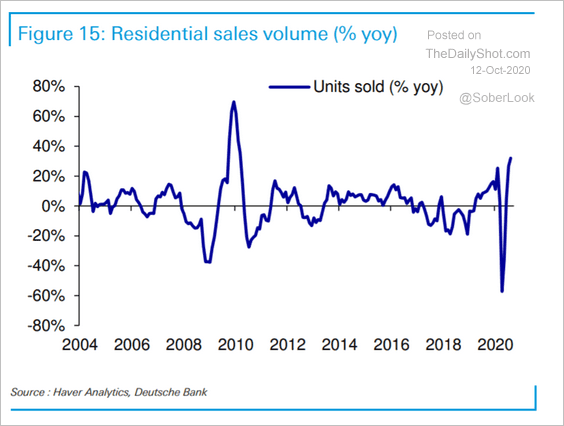
Home sales have been robust.
 Source: Deutsche Bank Research
——————–
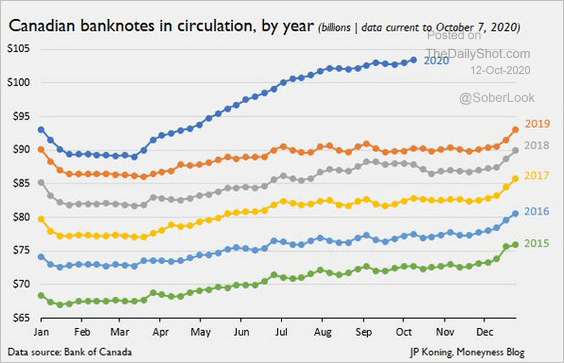
3. Banknotes in circulation rose sharply this year. Some have suggested that slower retail activity reduced criminals’ ability to launder drug money, increasing cash holdings.
 Source: @jp_koning
The United Kingdom
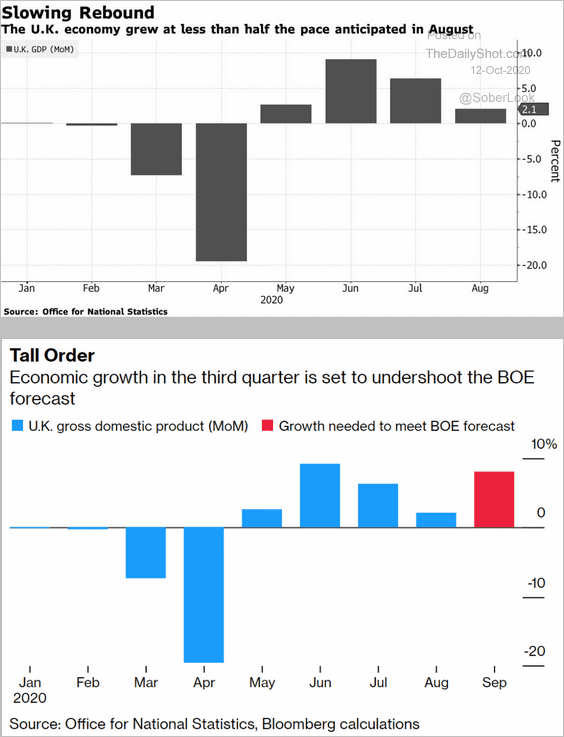
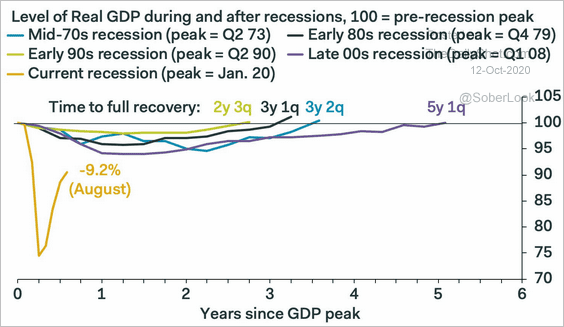
1. The August monthly GDP estimate was disappointing, raising doubts about the BoE’s Q3 GDP forecast.
 Source: @markets Read full article
Here is the GDP trajectory vs. previous recoveries.
 Source: Pantheon Macroeconomics
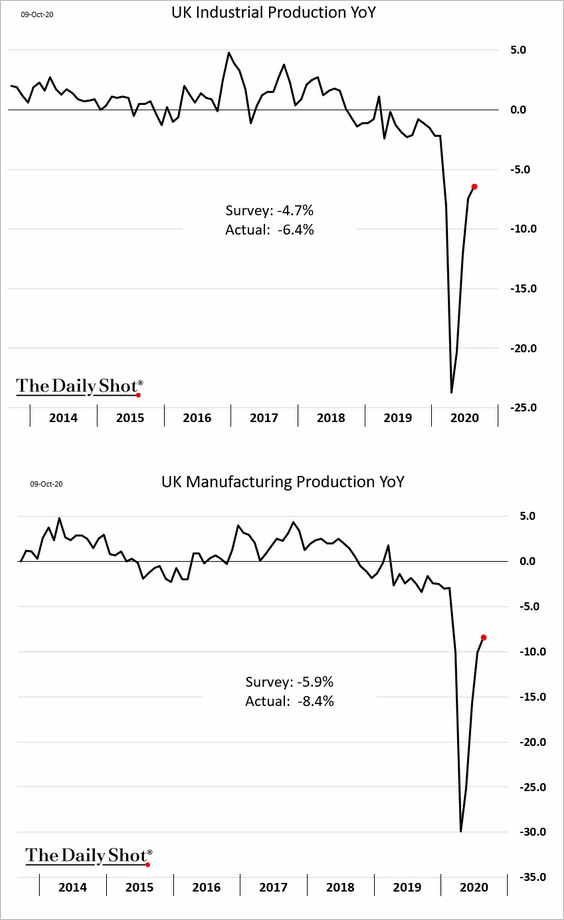
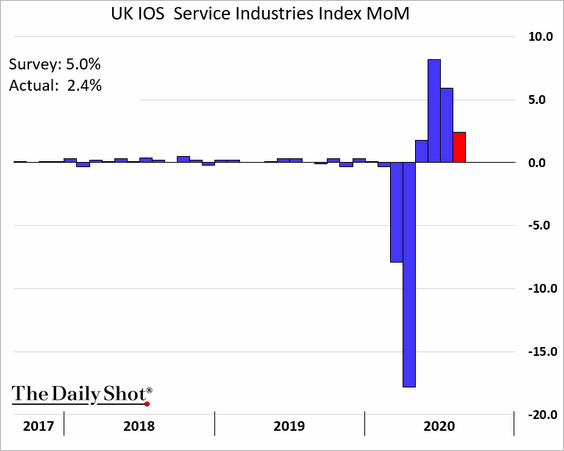
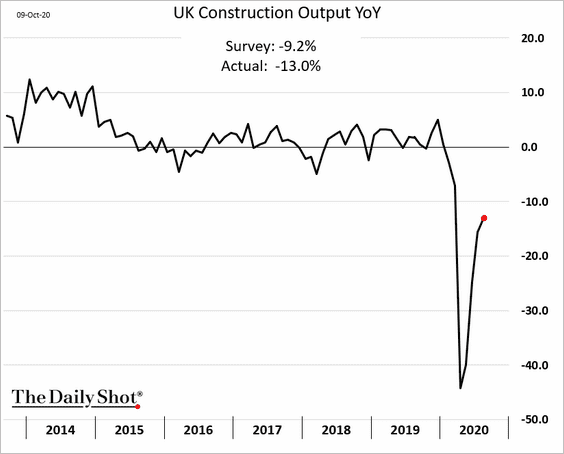
2. August industrial production came in below economists’ estimates.
So did the nation’s service-sector activity, …
… and construction output.
——————–
3. Residential sector investment has collapsed this year.
 Source: Deutsche Bank Research
Residential property price gains have accelerated (2 charts).
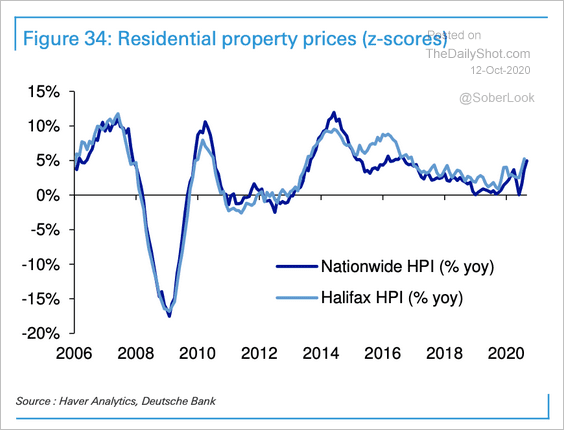 Source: Deutsche Bank Research
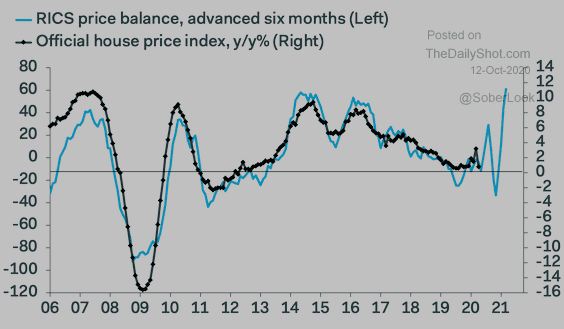 Source: Pantheon Macroeconomics
——————–
4. This chart shows real wage trends by age group.
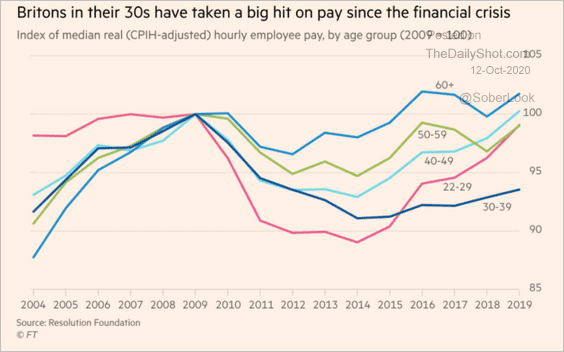 Source: @financialtimes Read full article
The Eurozone
1. French August industrial output came in below market expectations. The recovery momentum is slowing.
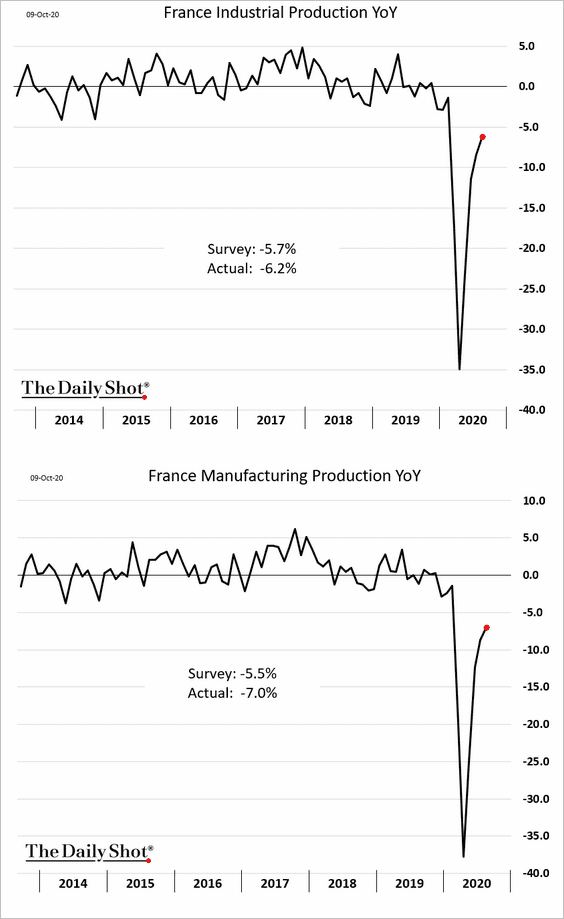
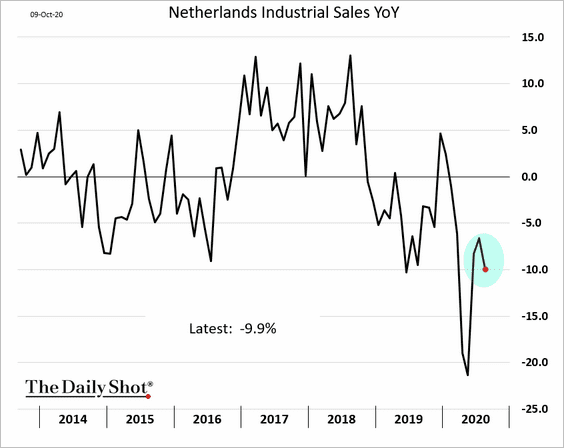
2. Dutch industrial sales deteriorated in August.
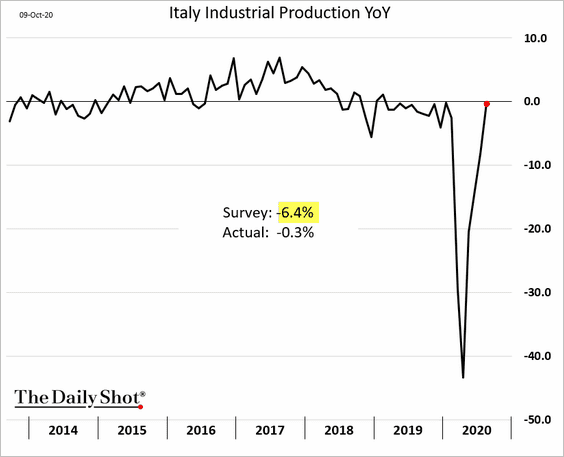
3. On the other hand, Italian industrial production topped economists’ forecasts and is now nearly flat vs. last year.
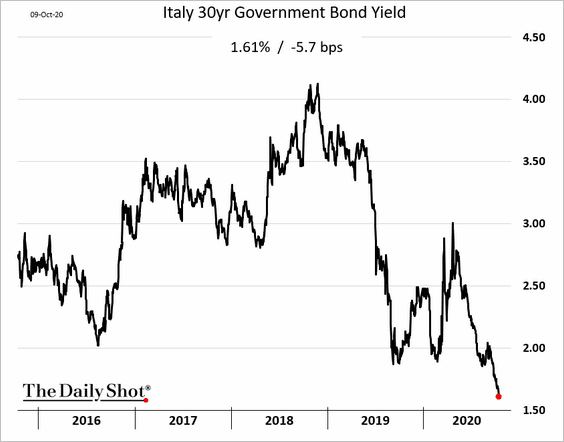
Separately, Italian bond yields continue to drift lower.
——————–
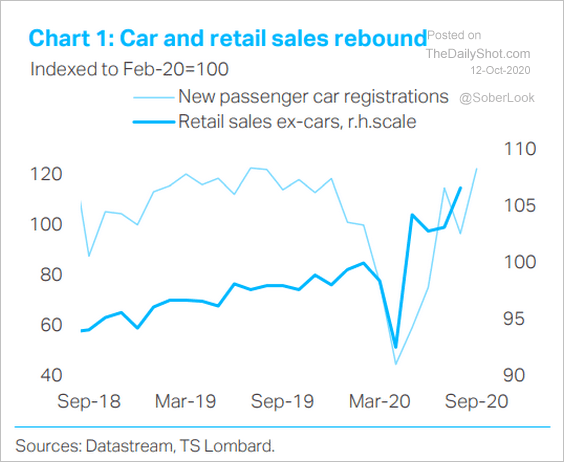
4. German car and retail sales keep climbing.
 Source: TS Lombard
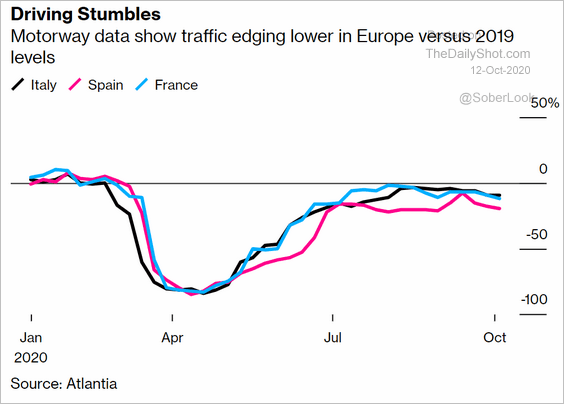
5. Car traffic is edging lower, pressured by increased COVID rates.
 Source: @markets Read full article
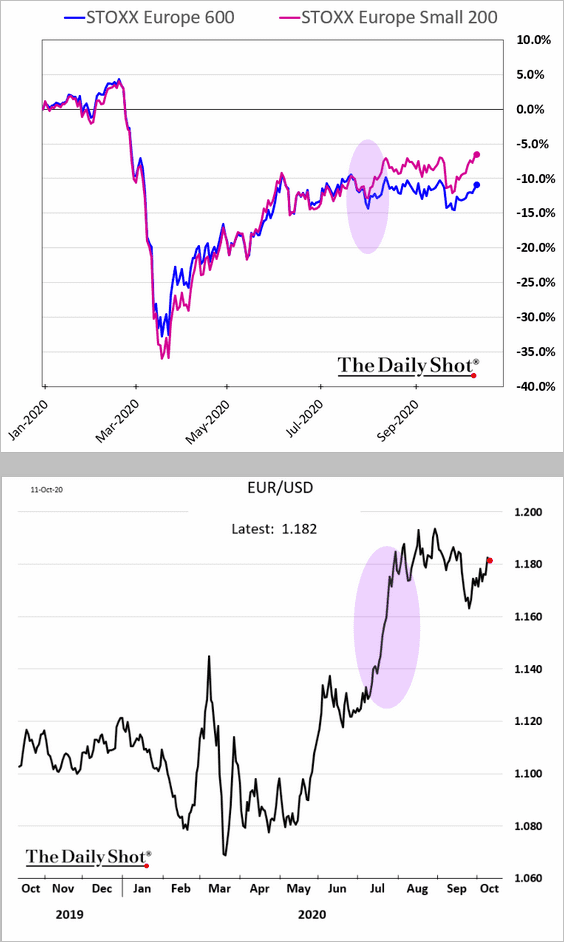
6. A stronger euro helped European small caps outperform larger firms this year.
Europe
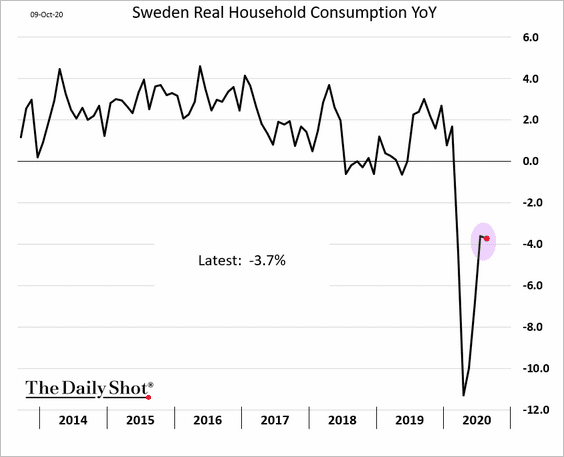
1. The recovery in Sweden’s household spending has stalled.
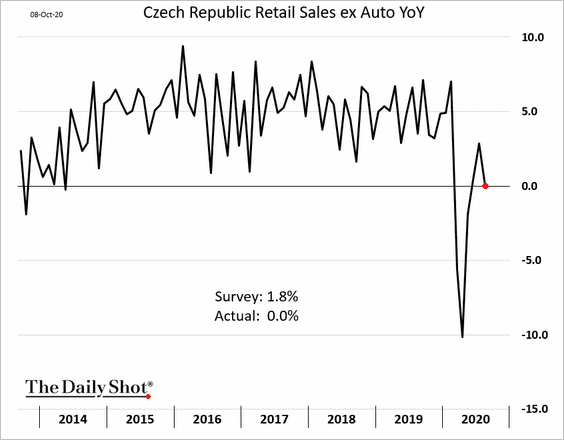
2. Czech retail sales have slowed.
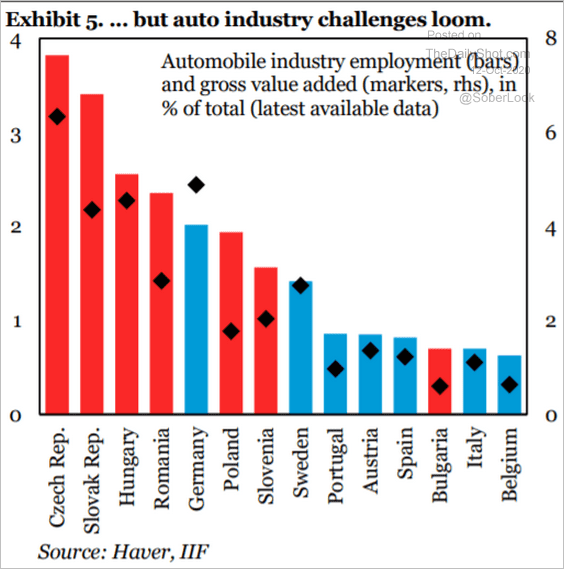
3. How much does Europe rely on the auto industry?
 Source: IIF
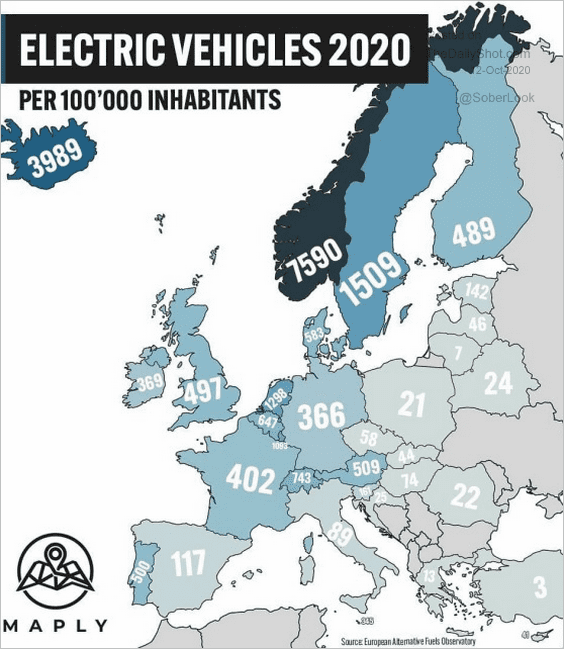
4. Which countries have the highest concentration of electric vehicles?
 Source: @onlmaps
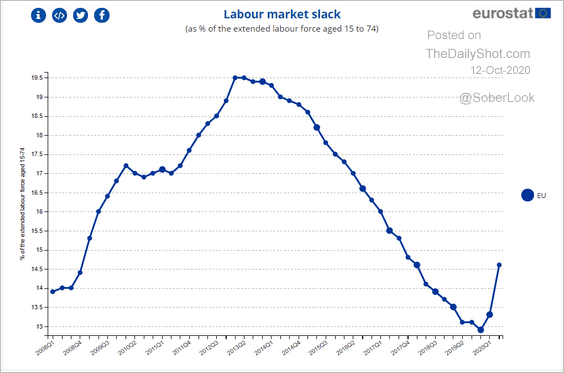
5. Labor market slack in the EU is well below the levels we saw after the Eurozone debt crisis.
 Source: Eurostat Read full article
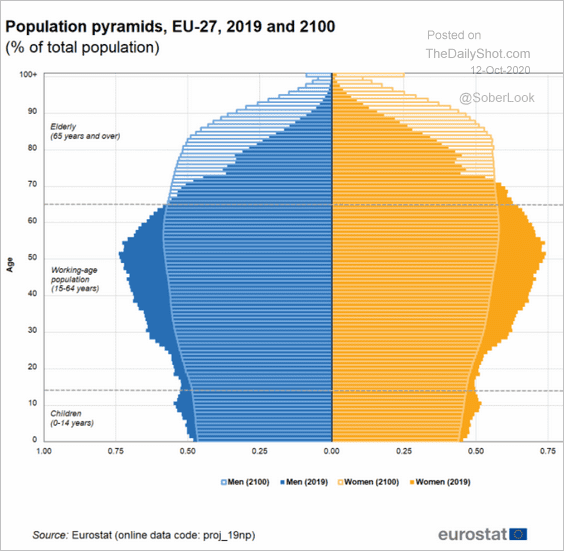
6. Here is the EU’s population pyramid – now and in 2100.
 Source: Eurostat Read full article
Asia – Pacific
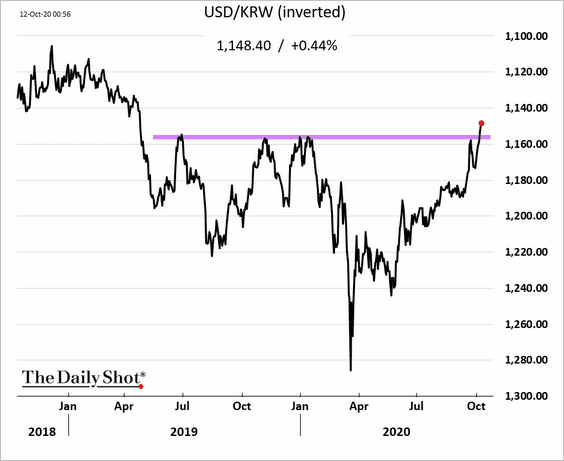
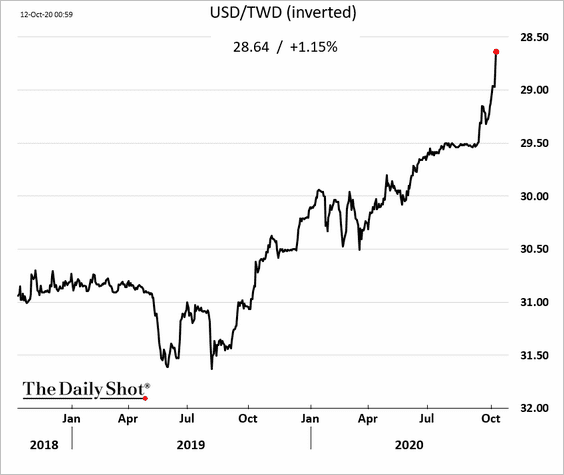
Asian currencies continue to rally vs. USD.
• The South Korean won:
• The Taiwan dollar:
China
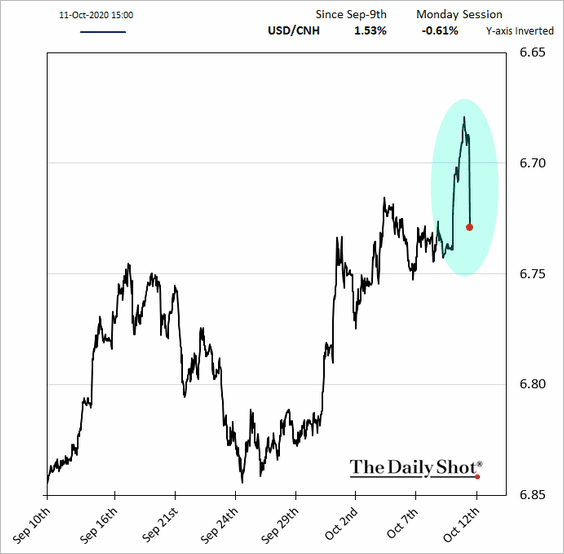
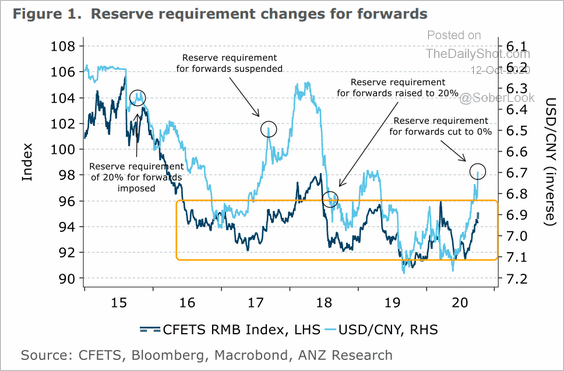
1. Alarmed by the yuan’s rapid rise, the PBoC eliminated the capital requirements it had imposed on banks when they sold USD forwards to their clients.
 Source: @markets Read full article
The PBoC’s action halted the renminbi’s rally.
In 2016, the central bank was concerned about traders selling the RMB (buying dollars), and it imposed a 20% reserve requirement on these transactions.
 Source: ANZ Research
——————–
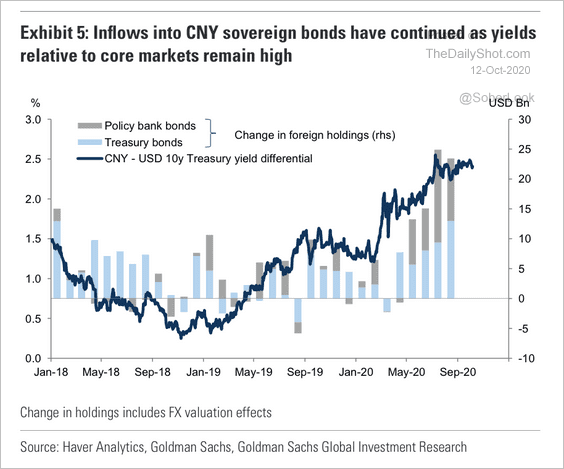
2. Inflows into sovereign bonds remain high, which has been supporting China’s currency.
 Source: Goldman Sachs
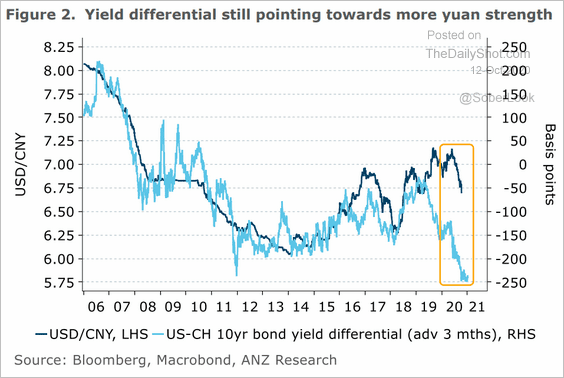
Despite the central bank’s move to eliminated the 20% reserve requirement, the rate differential will continue putting upward pressure on the yuan.
 Source: ANZ Research
——————–
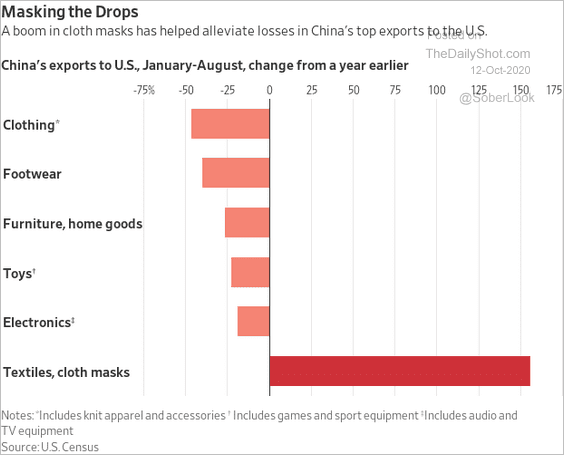
3. COVID-related sales helped China offset the loss of exports to the US.
 Source: @WSJ Read full article
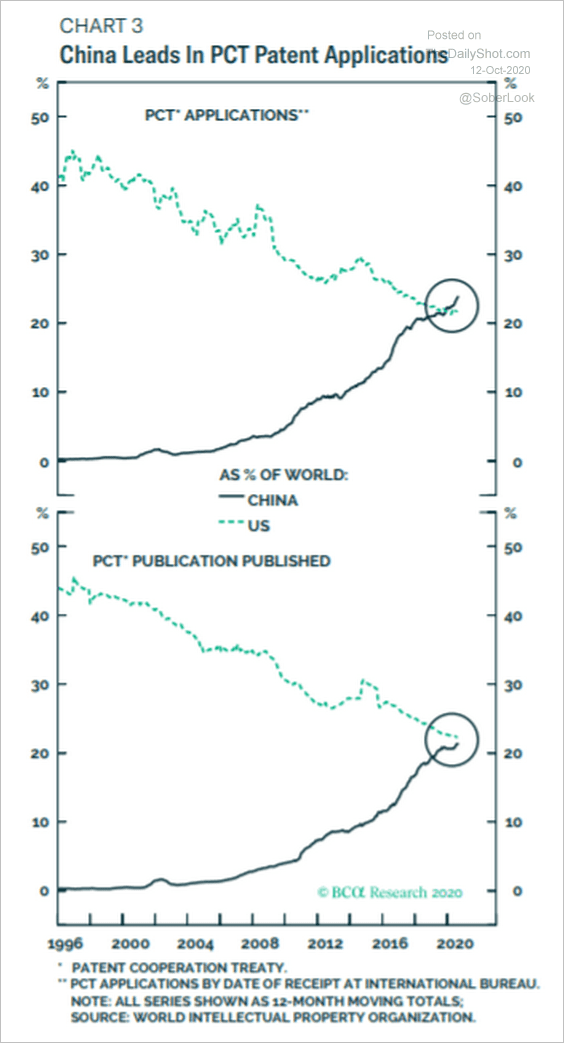
4. China is currently the world’s number one source of the Patent Cooperation Treaty (PCT) patent applications.
 Source: BCA Research
Emerging Markets
1. Let’s begin with Brazil.
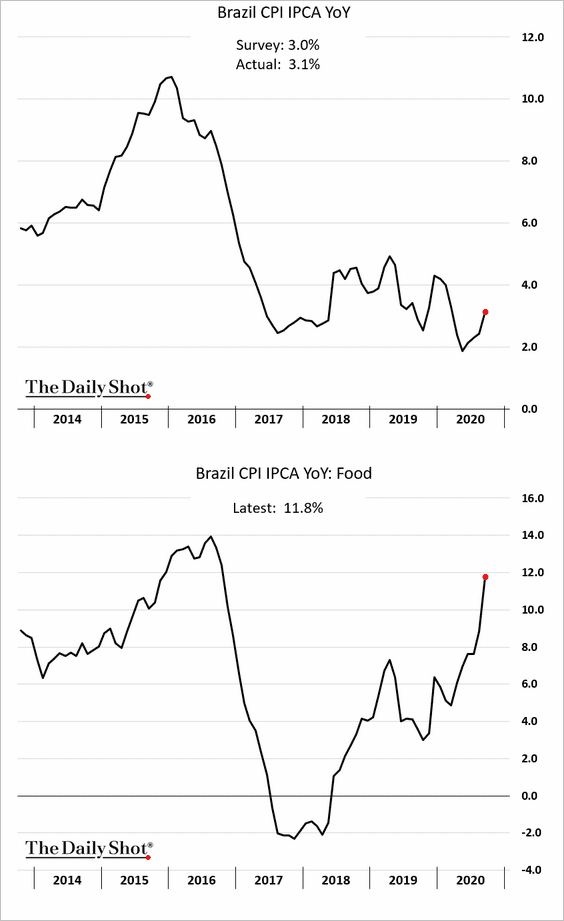
• The CPI has been rebounding, driven by food prices. But the core CPI remains soft.
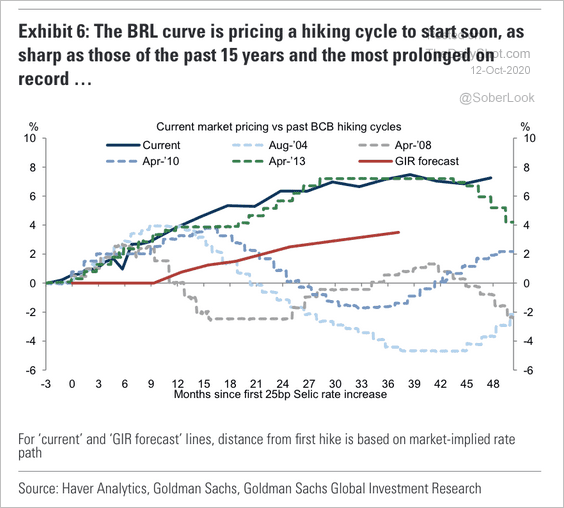
• The currency market is pricing in a sharp hiking cycle …
 Source: Goldman Sachs
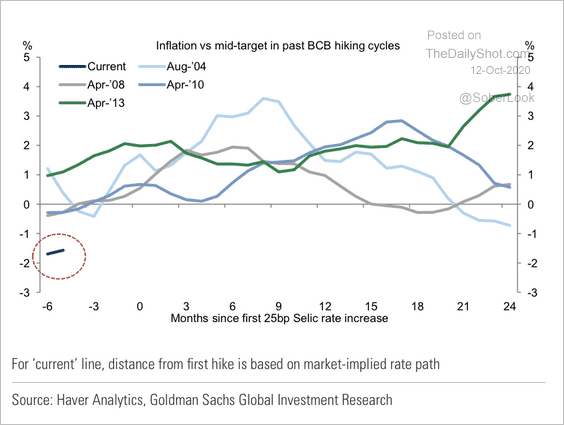
…even though inflation has been subdued relative to the central bank’s target.
 Source: Goldman Sachs
——————–
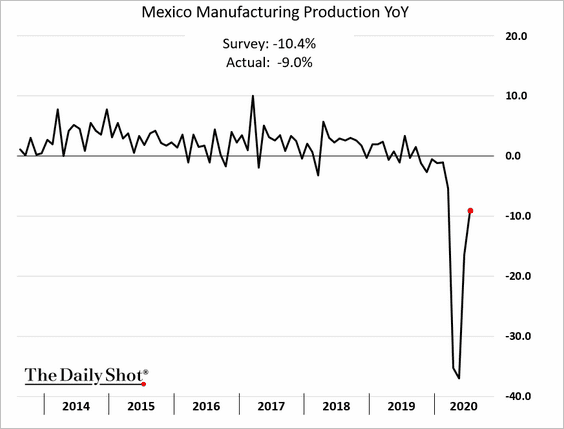
2. Mexico’s factory output continues to recover.
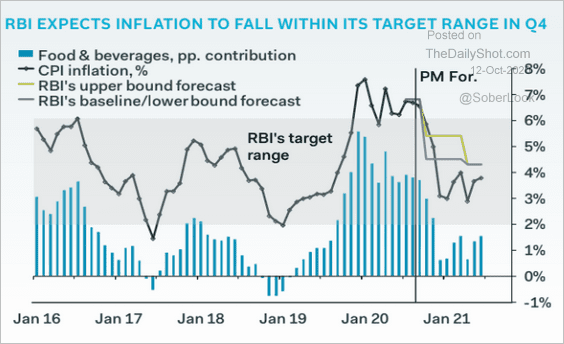
3. With India’s inflation moderating, the central bank is likely to cut rates later this year.
 Source: Pantheon Macroeconomics
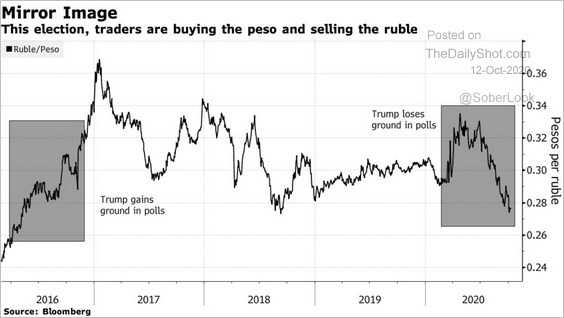
4. Traders are betting on a Biden victory in the US, selling the ruble, and buying the Mexican peso.
 Source: @markets Read full article
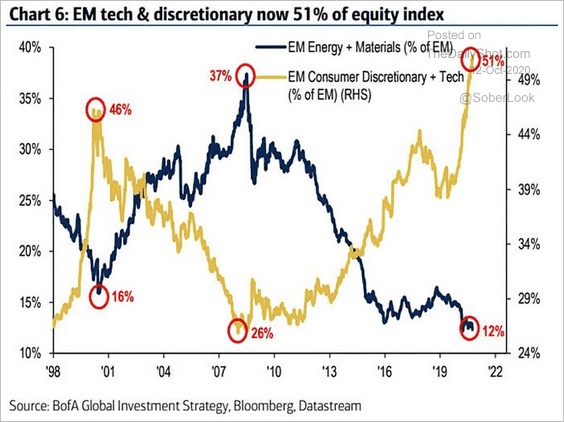
5. Tech and discretionary sectors are now 51% of the EM equity index.
 Source: @ISABELNET_SA, @BofAML
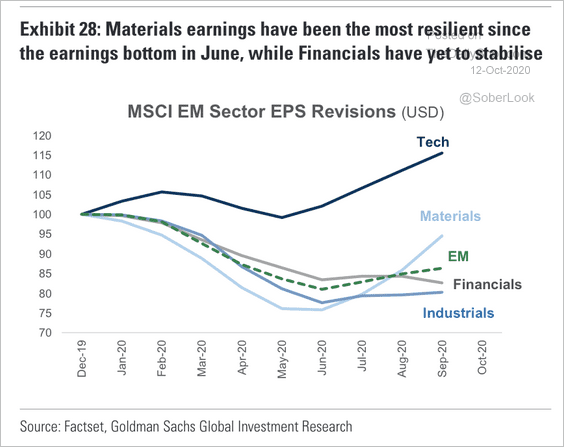
Separately, EM tech and materials have seen the highest earnings-per-share revisions this year.
 Source: Goldman Sachs
Commodities
1. Gold’s valuation premium to “fair-value” is near the 2008 peak, according to Deutsche Bank.
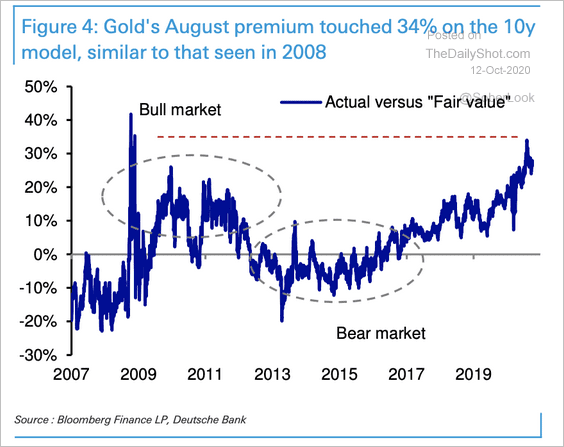 Source: Deutsche Bank Research
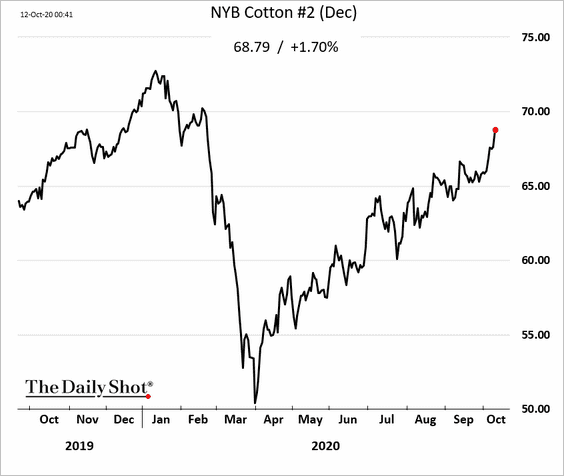
2. Hurricane Delta has flooded parts of Louisiana, sending cotton prices higher.
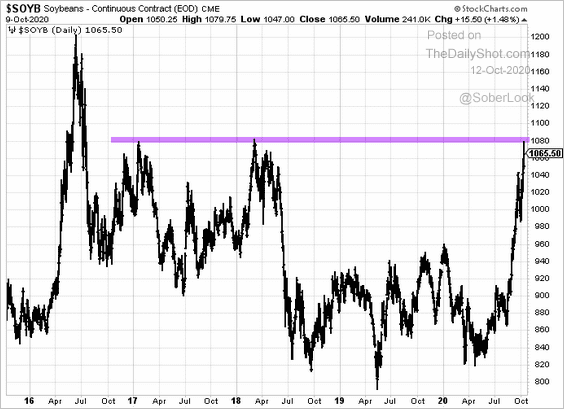
3. Managed money net-long positions in grain futures are significantly higher than the previous five years, particularly in soybeans. (two charts)
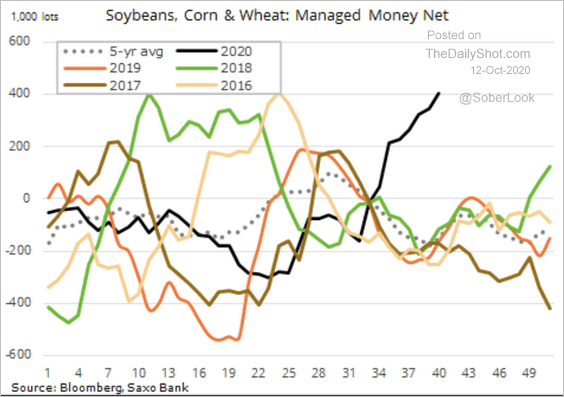 Source: @Ole_S_Hansen
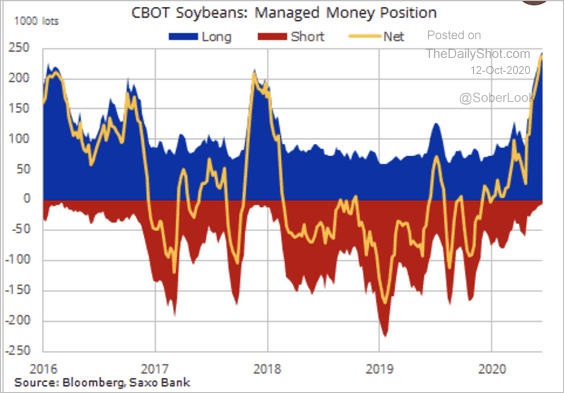 Source: @Ole_S_Hansen
US soybean futures are testing resistance.
——————–
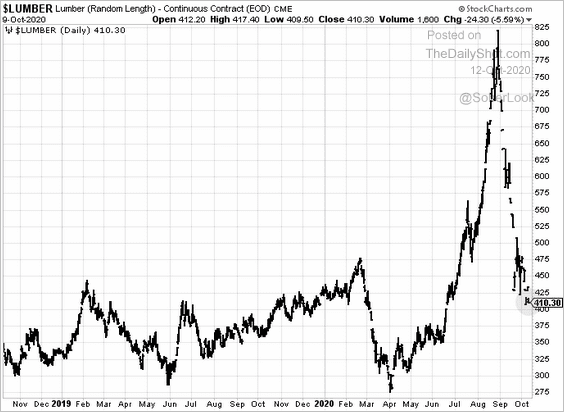
4. US lumber futures are down sharply.
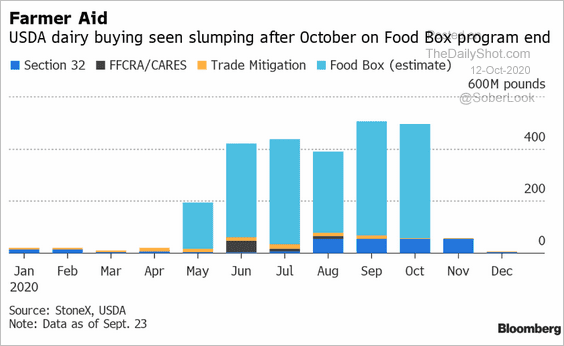
5. US government’s support for dairy has slumped.
 Source: @business Read full article
Energy
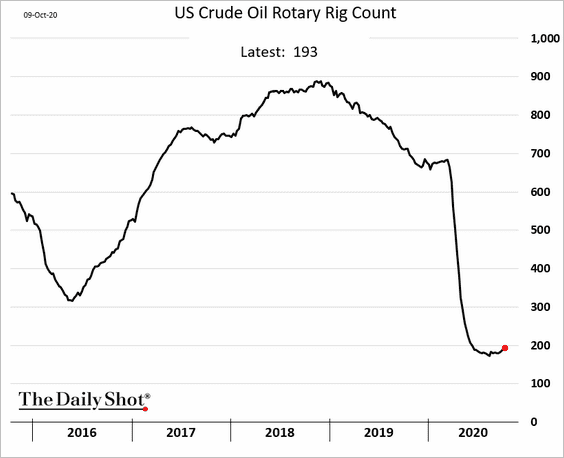
1. The US rig count has bottomed.
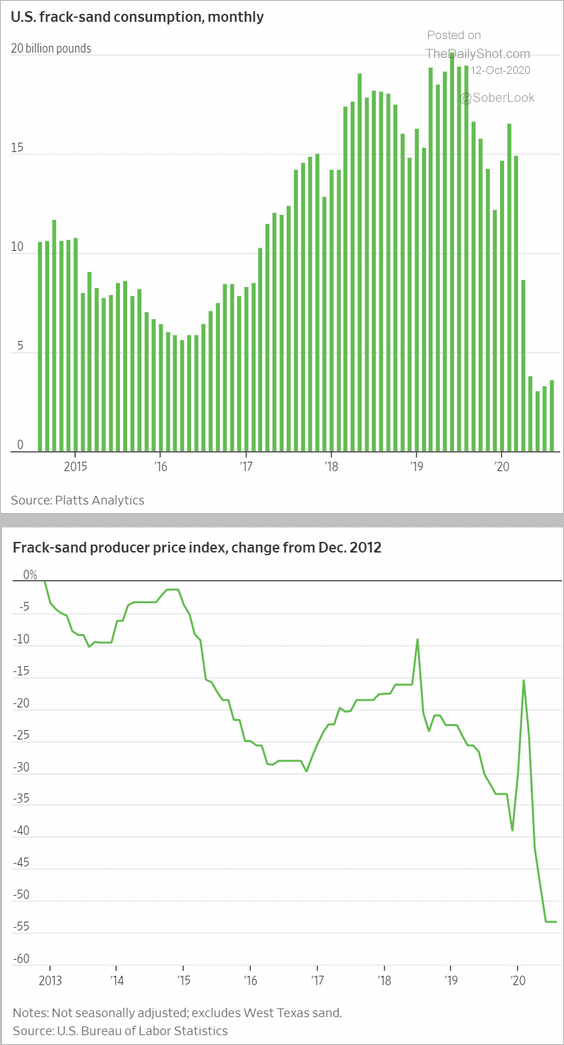
2. The pullback in US crude oil production has been pressuring the frack-sand market.
 Source: @WSJ Read full article
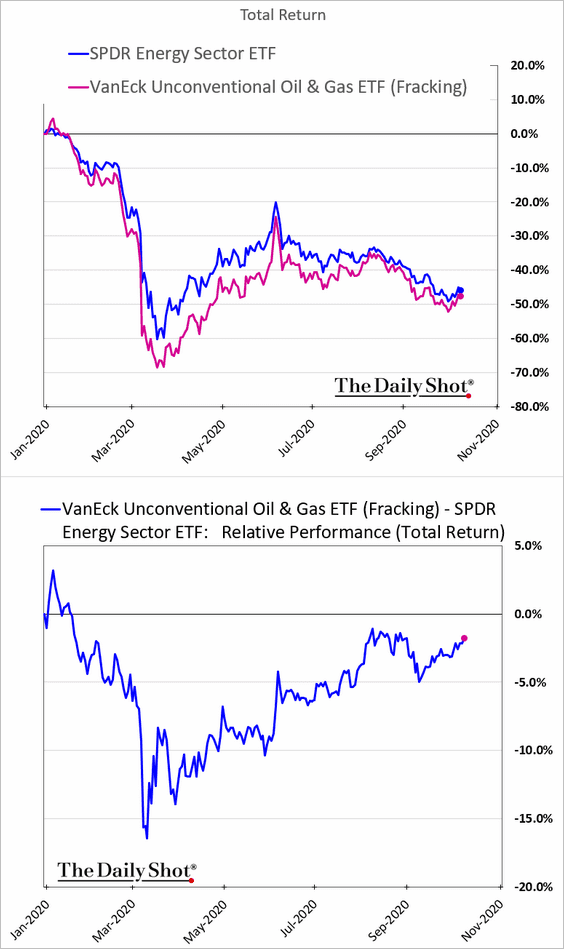
3. Despite a higher likelihood of a Biden win, fracking companies have been outperforming in recent weeks. The market doesn’t seem to be concerned about the risk of fracking restrictions.
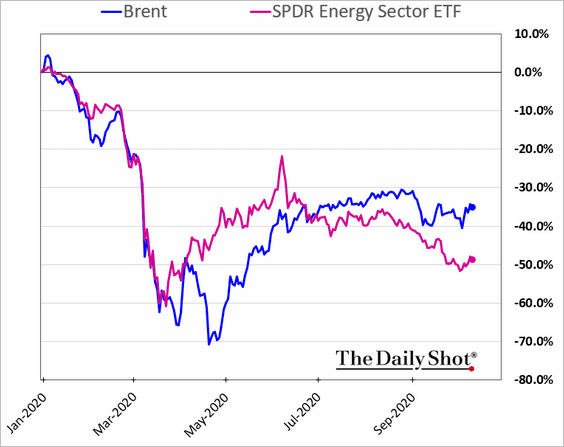
4. The energy sector has been underperforming crude oil. The stock market is not convinced that the rebound in oil prices can be sustained.
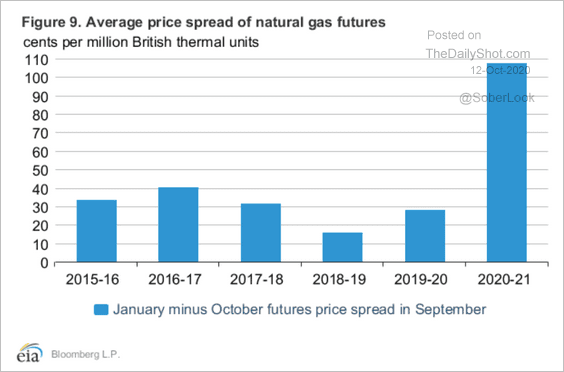
5. The spread between henry hub natural gas prices for October 2020 delivery and January 2021 delivery was more than three times the 5-year average in September. The wide gap reflects an oversupply situation that will likely recede in the next few months.
 Source: @EIAgov
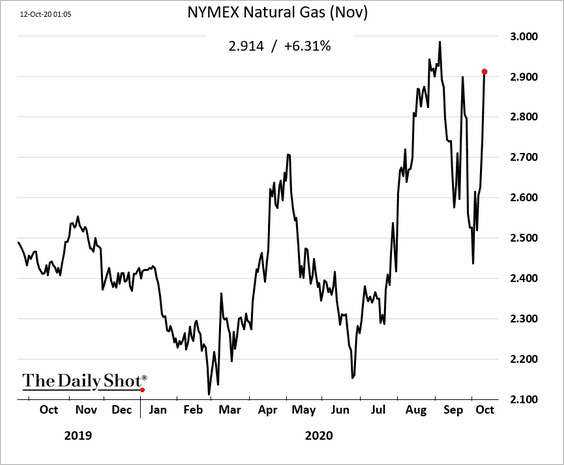
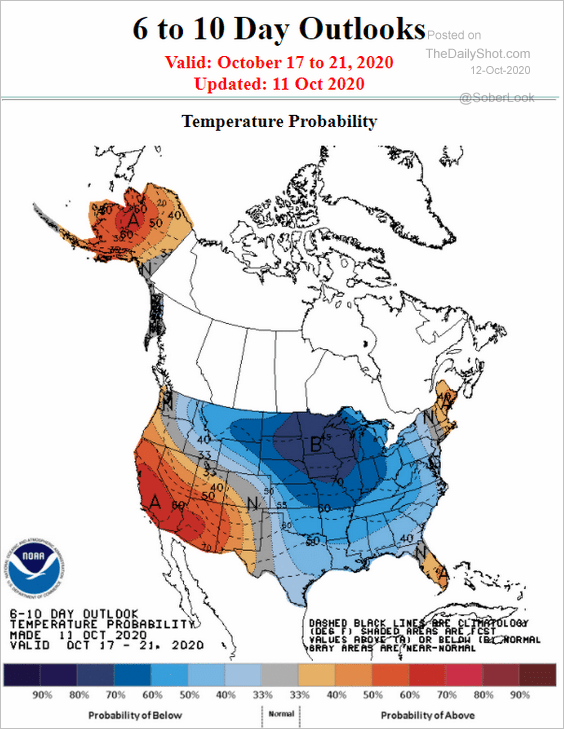
6. Natural gas futures are up sharply amid forecasts for cold weather in the Midwest.
 Source: NOAA
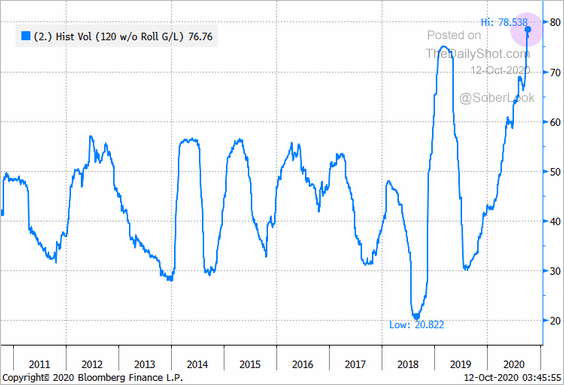
Natural gas volatility has been unusually high this year.
 Source: @TheTerminal, Bloomberg Finance L.P.
Equities
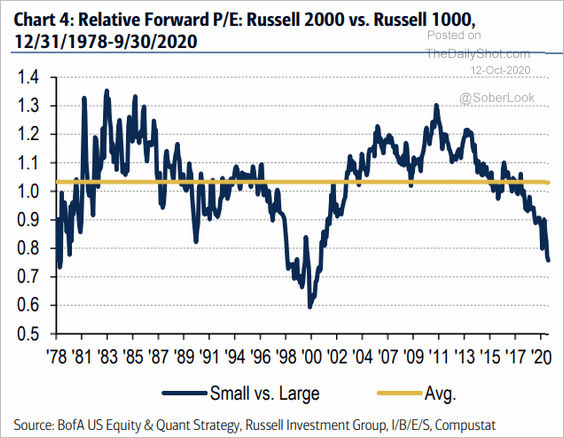
1. US small caps’ relative valuations look increasingly cheap.
 Source: BofA Global Research
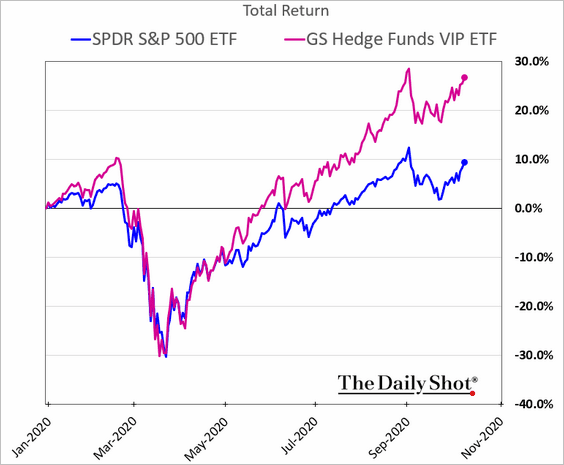
2. Hedge funds’ stock picks continue to outperform.
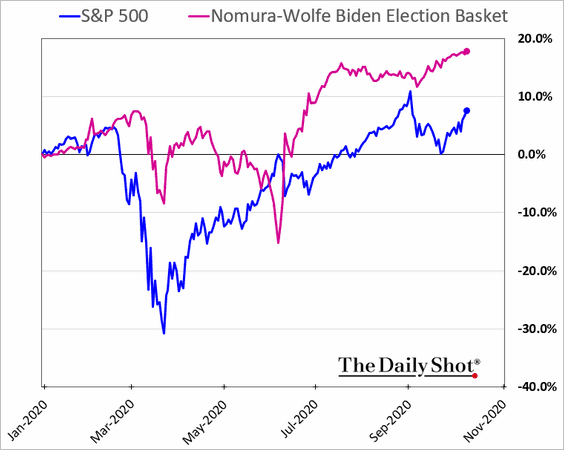
3. The market is pricing in a Biden victory in November. Here is the relative performance of the “Biden basket.”
 Further reading
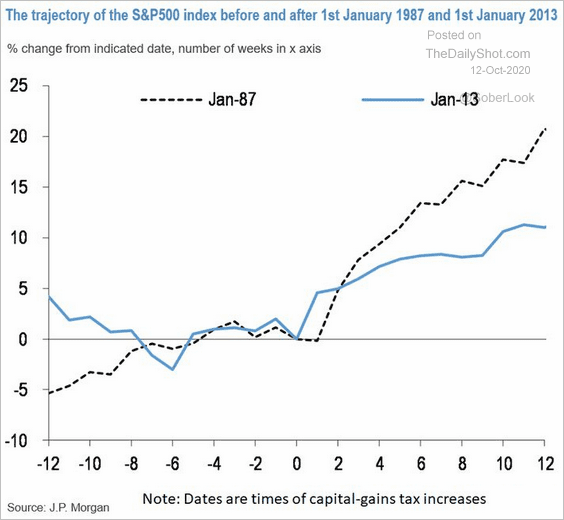
4. How will a capital-gains tax hike impact the stock market?
 Source: JP Morgan, @markets Read full article
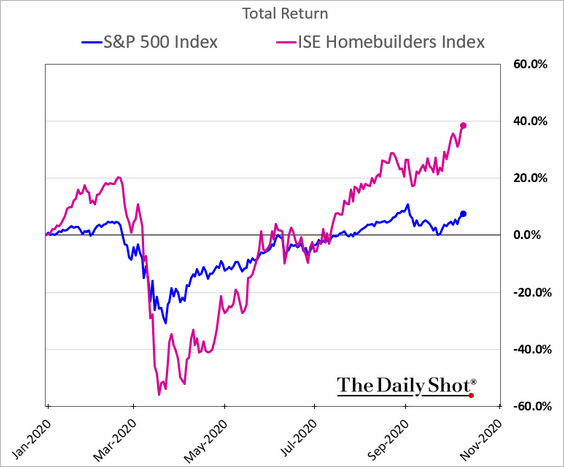
5. Shares of homebuilders are widening their outperformance.
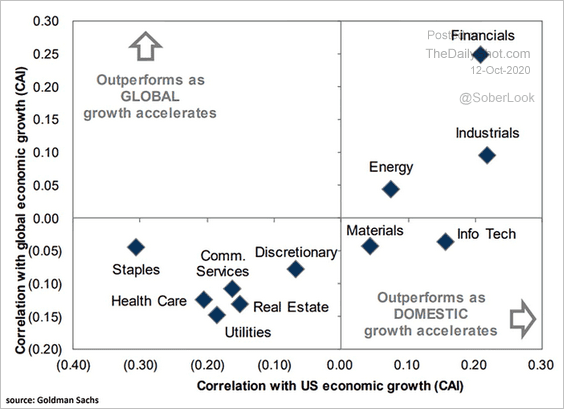
6. Which sectors are most correlated with economic growth?
 Source: @ISABELNET_SA, @GoldmanSachs
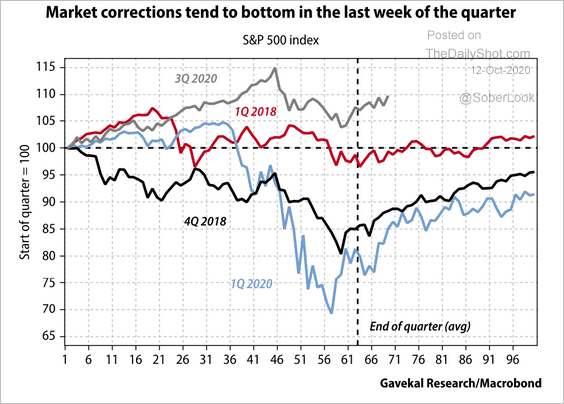
7. Market pullbacks tend to bottom at the end of the quarter.
 Source: Gavekal
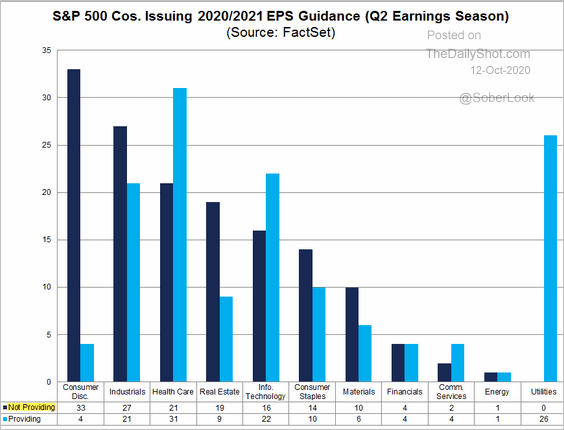
8. Many companies are still not providing earnings guidance.
 Source: @FactSet
Rates
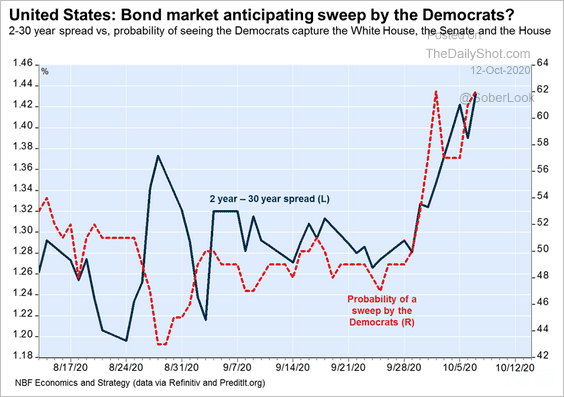
1. A Democratic sweep probably means a steeper Treasury curve.
 Source: Economics and Strategy Group, National Bank of Canada
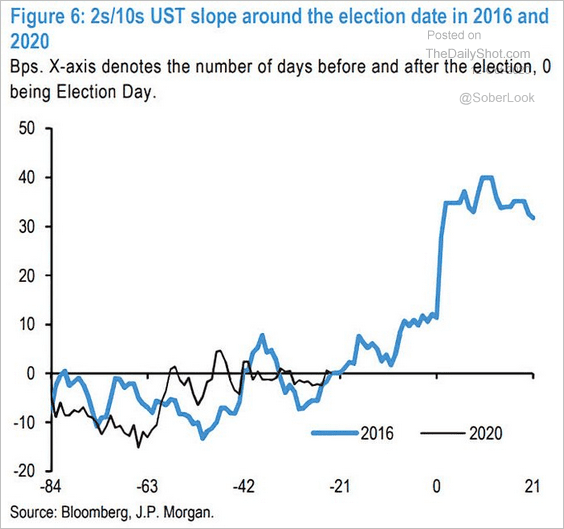
By the way, the curve steepened sharply after the 2020 election (“reflation” bets).
 Source: @ISABELNET_SA, @jpmorgan
——————–
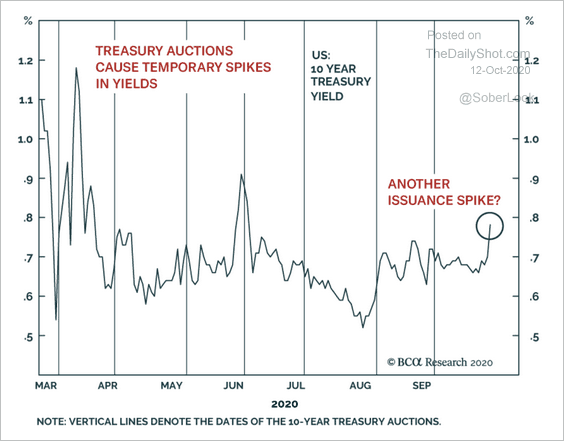
2. According to BCA Research, Treasury yields rose in the days ahead of previous auctions with large issuance. The market is anticipating another big package.
 Source: BCA Research
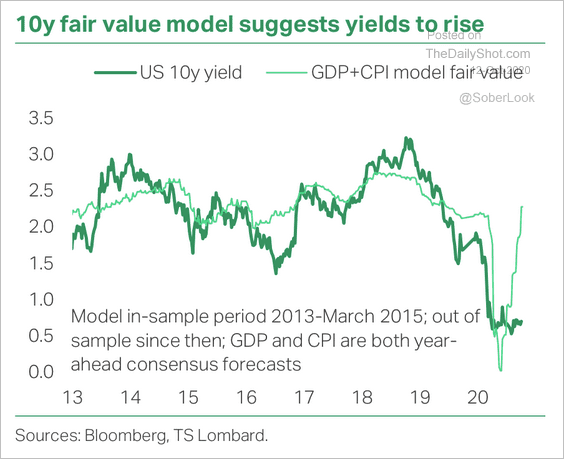
3. TS Lombard is forecasting higher Treasury yields as inflation and growth pick up (boosted by stimulus).
 Source: TS Lombard
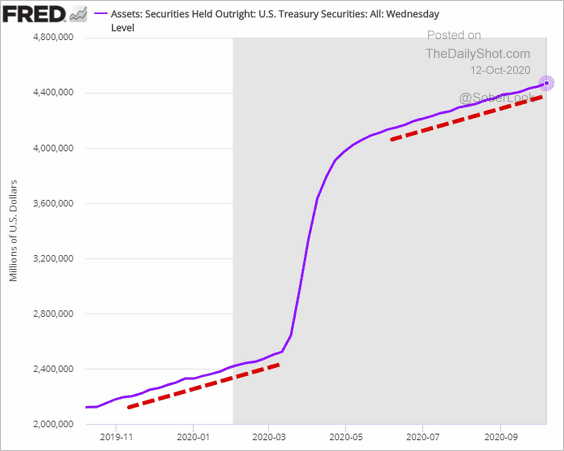
4. The Fed is currently purchasing securities at the same pace it did before the crisis. Back then, the central bank was just buying T-Bills to boost reserves in response to the repo squeeze.
Food for Thought
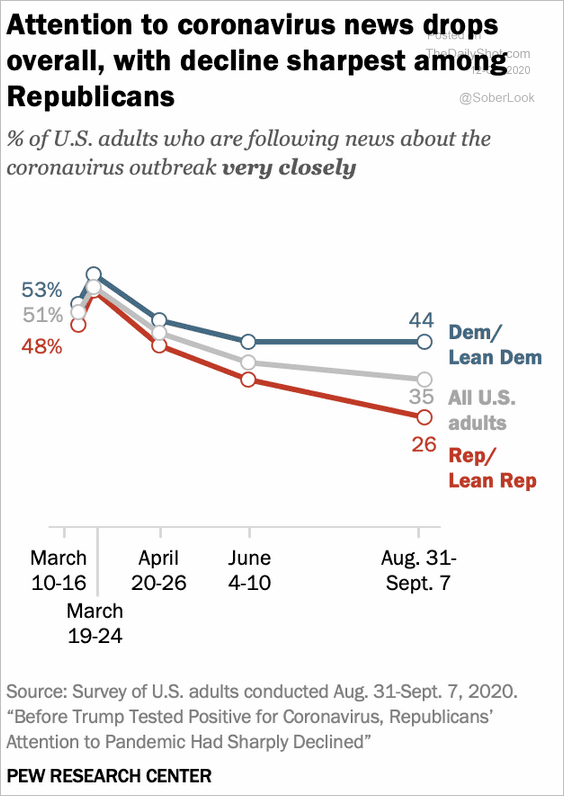
1. Following the coronavirus outbreak:
 Source: Pew Research Center
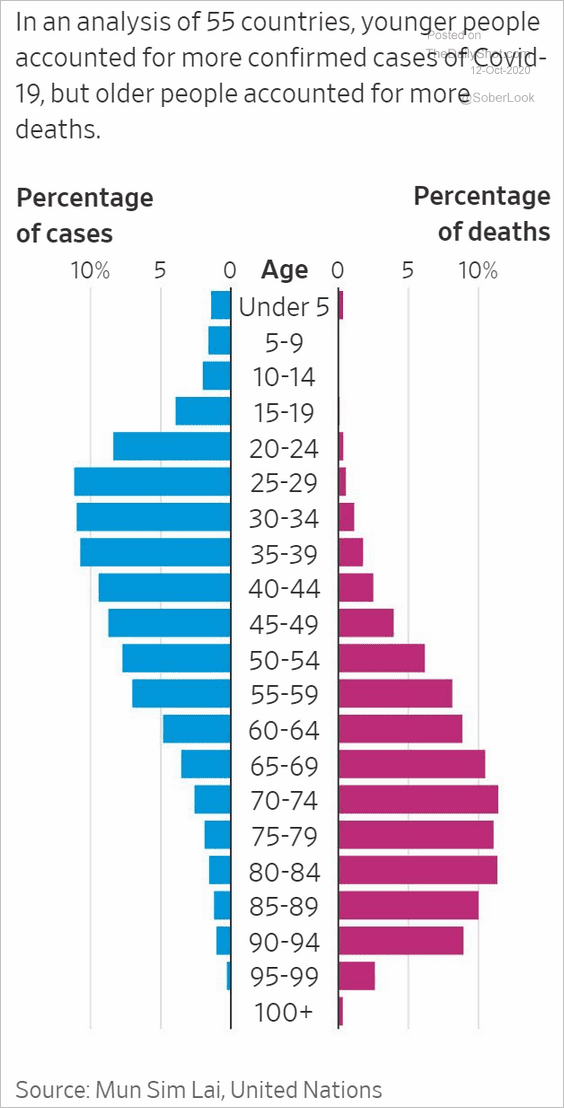
2. New cases vs. deaths, by age:
 Source: @WSJ Read full article
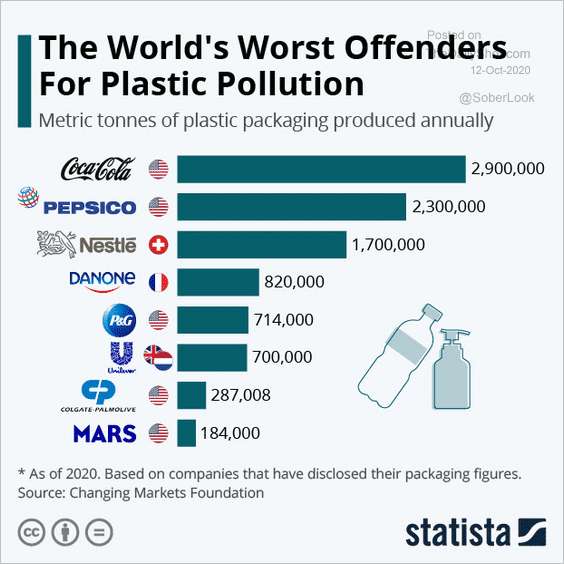
3. Plastic packaging:
 Source: Statista
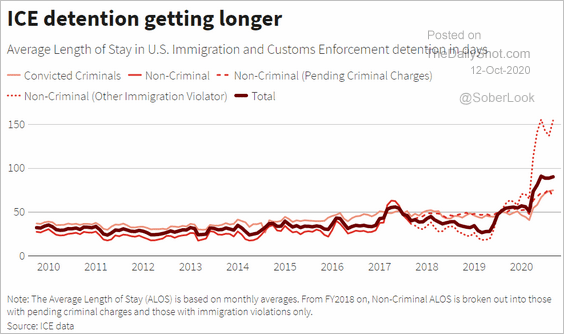
4. ICE detentions:
 Source: Reuters Read full article
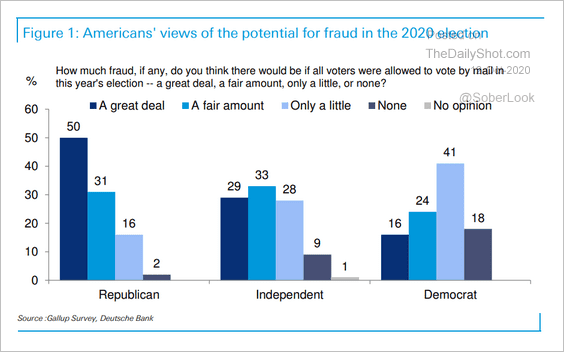
5. Views on fraud risk in voting by mail:
 Source: Deutsche Bank Research
6. Polls in battleground states vs. 2016:
 Source: ANZ Research
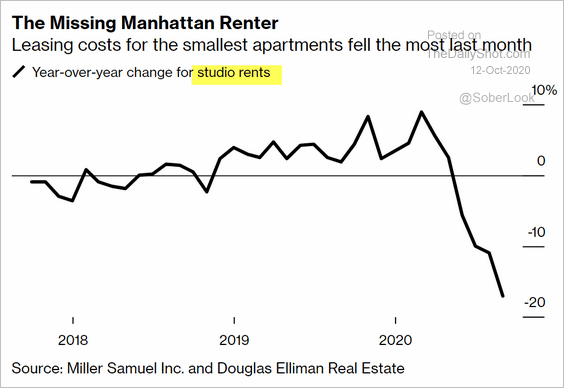
7. Manhattan studio rents:
 Source: @business Read full article
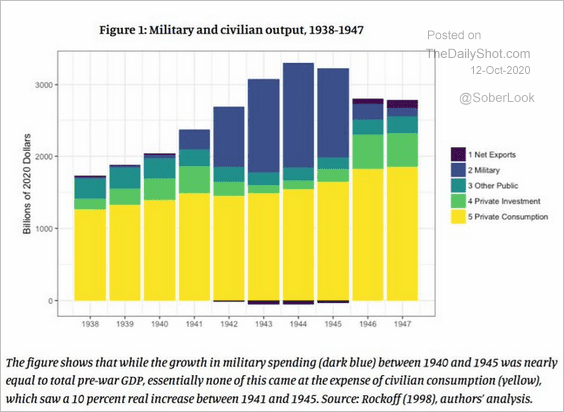
8. WWII mobilization’s impact on private consumption:
 Source: @jdcmedlock, @JWMason1 Read full article
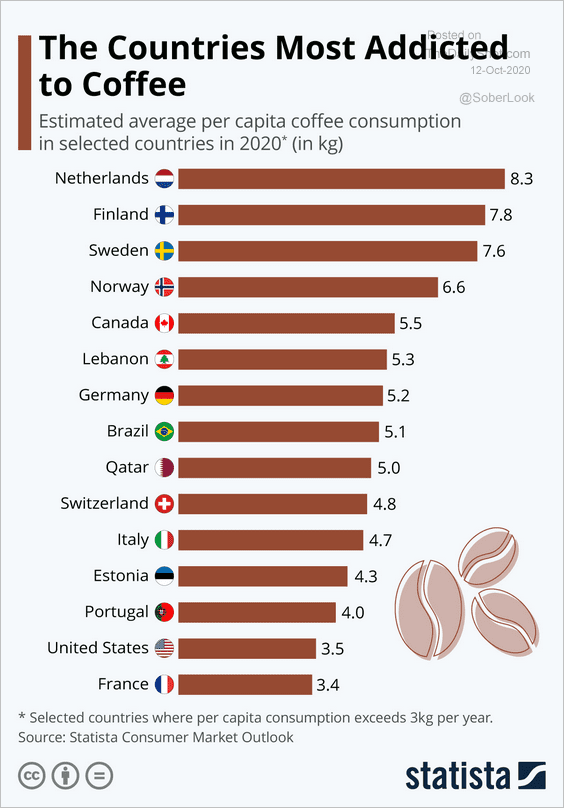
9. Coffee consumption:
 Source: Statista
——————–
