
The Daily Shot: 19-Oct-20
• The United States
• The Eurozone
• Europe
• Asia -Pacific
• China
• Emerging Markets
• Commodities
• Energy
• Equities
• Credit
• Rates
• Global Developments
• Food for Thought
The United States
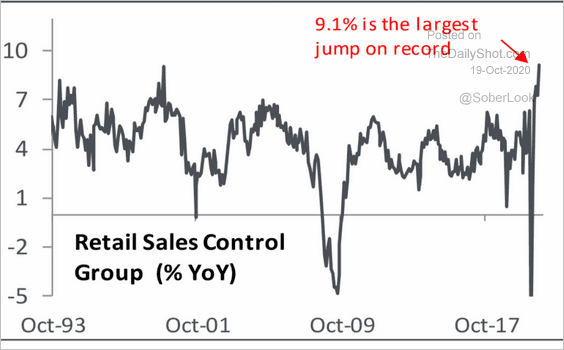
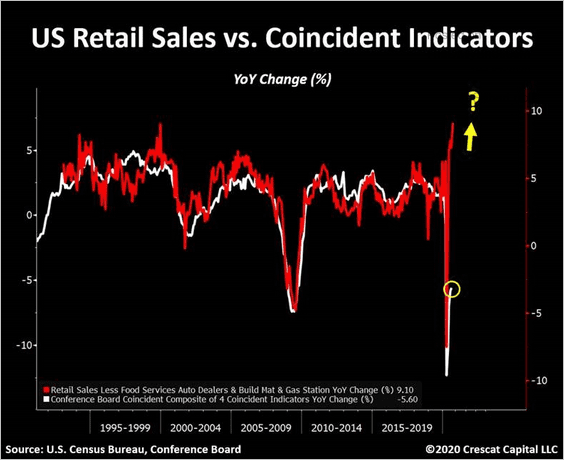
1. Supported by “excess savings,” US retail sales continue to power on, exceeding economists’ expectations. The second chart shows the year-over-year changes.
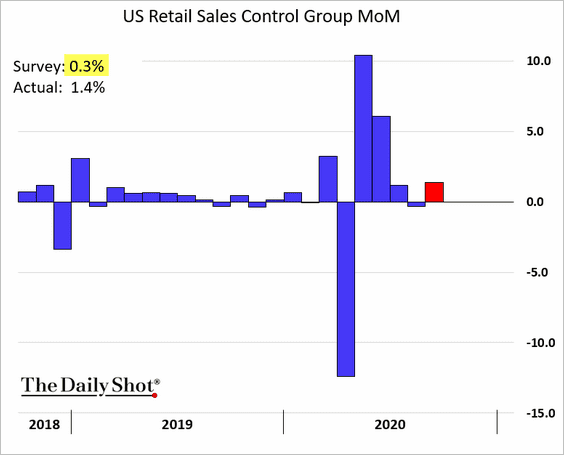
 Source: Piper Sandler
Here is a comparison to the 2008 cycle.
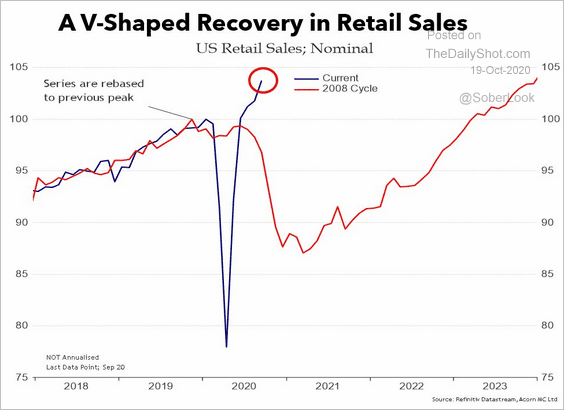 Source: @RichardDias_CFA
Retail sales have been strong despite …
• income uncertainty …
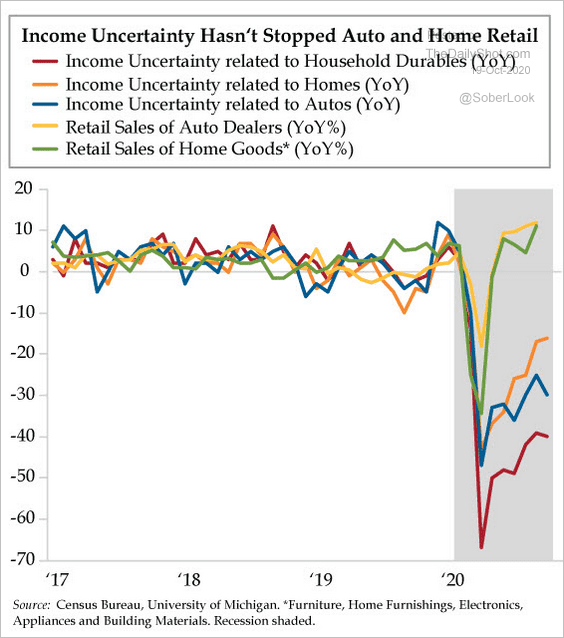 Source: The Daily Feather
• … and relatively soft economic activity.
 Source: @TaviCosta
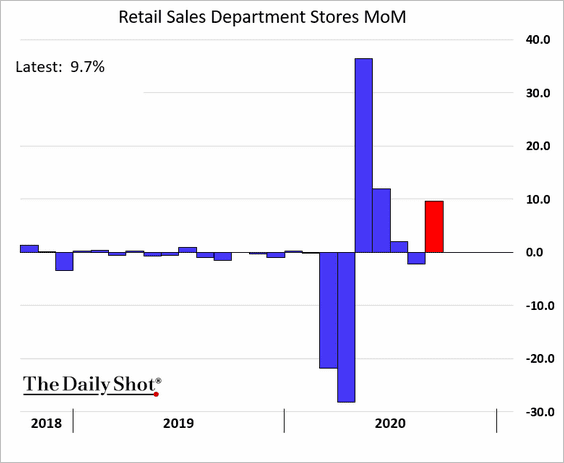
Department store sales jumped nearly 10% vs. August.
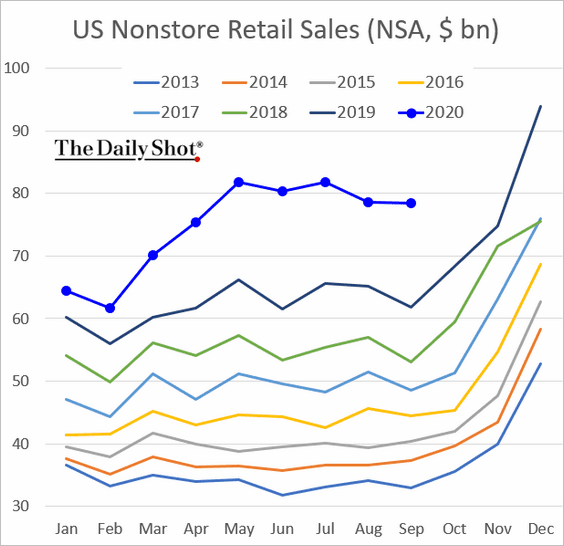
Internet sales remain robust, with October expected to be another good month due to Amazon’s Prime Day (see story).
Vehicle purchases have been especially strong since the end of the lockdowns.
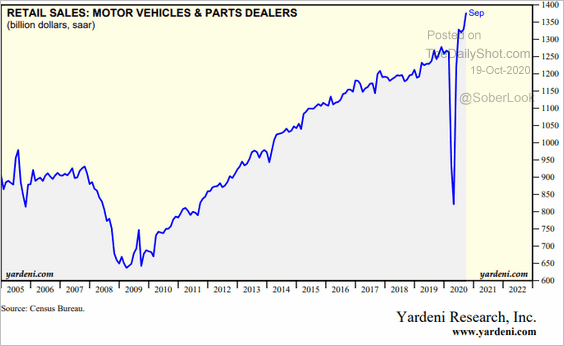 Source: Yardeni Research
Here is the breakdown by sector (for September).
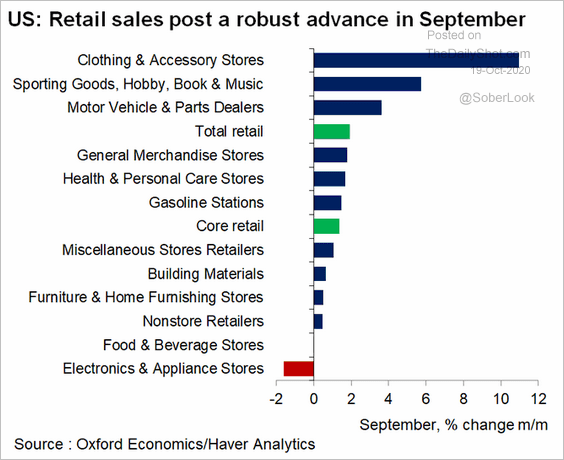 Source: @GregDaco
And this chart shows debit- and credit-card spending vs. 2019.
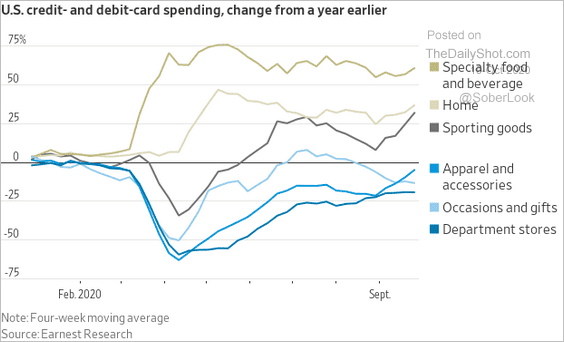 Source: @WSJ Read full article
——————–
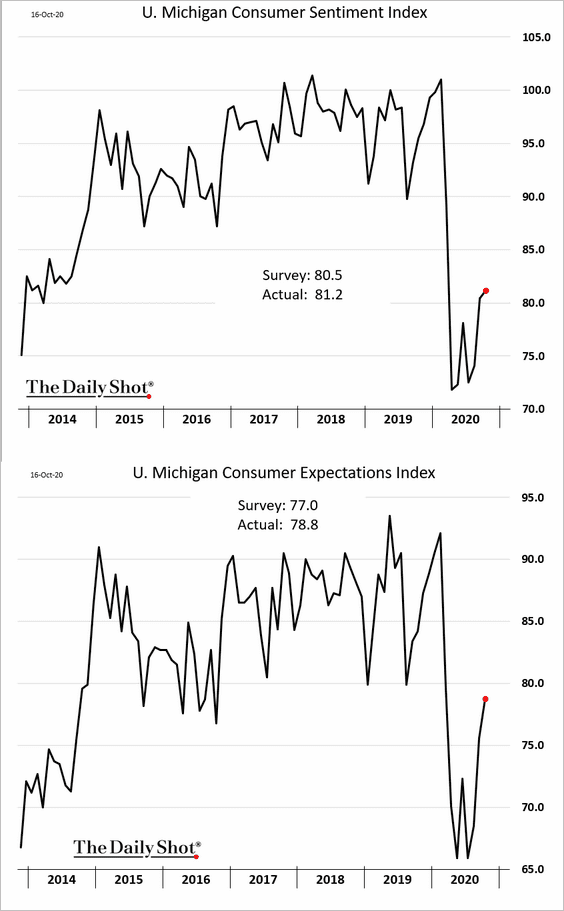
2. Consumer sentiment is grinding higher.
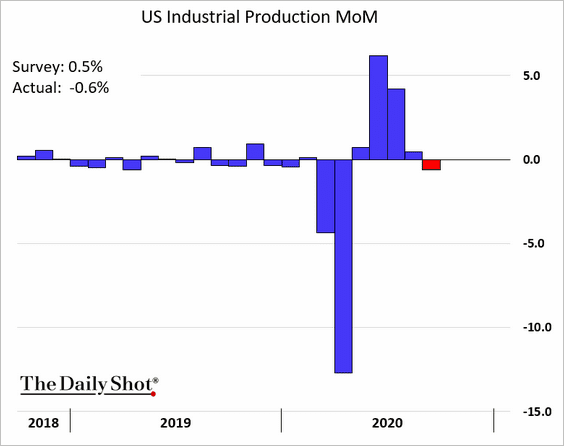
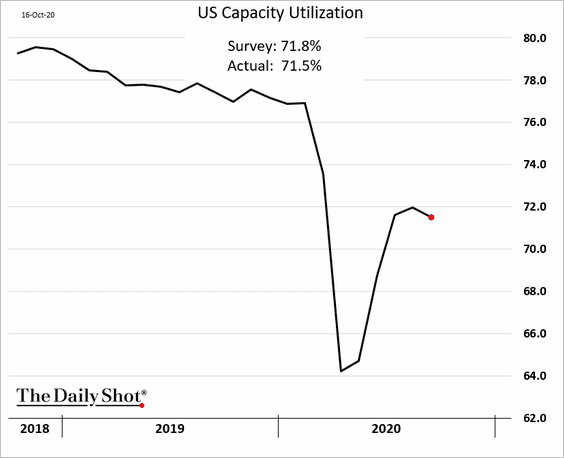
3. Industrial production unexpectedly declined in September as the post-lockdown demand slowed.
Capacity utilization eased.
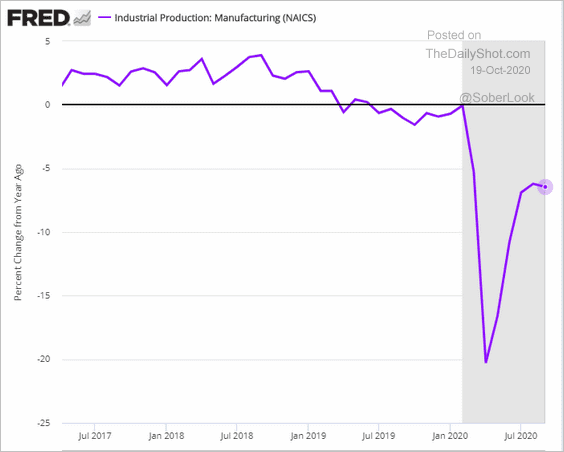
Here are the year-over-year changes in manufacturing output.
There is a disconnect between hard and soft data in manufacturing (output vs. the ISM survey).
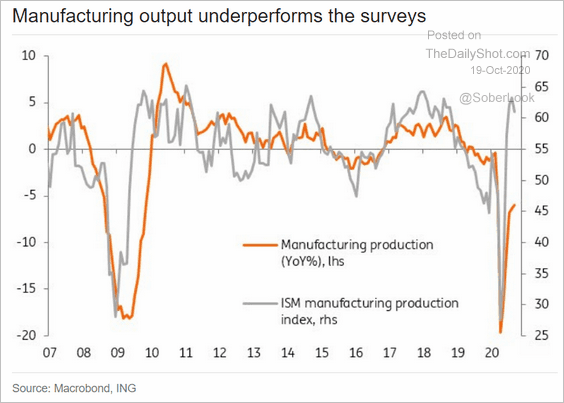 Source: ING
There is also a disconnect between manufacturing and retail sales (#1 above).
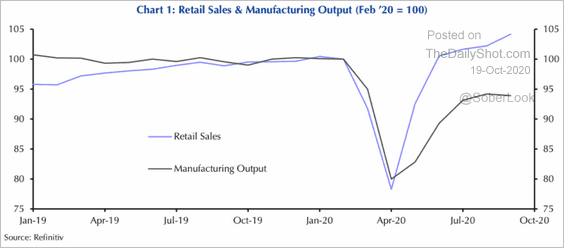 Source: Capital Economics
——————–
4. The good news for manufacturing is that inventories are relatively low. Here is the total inventories-to-sales ratio.
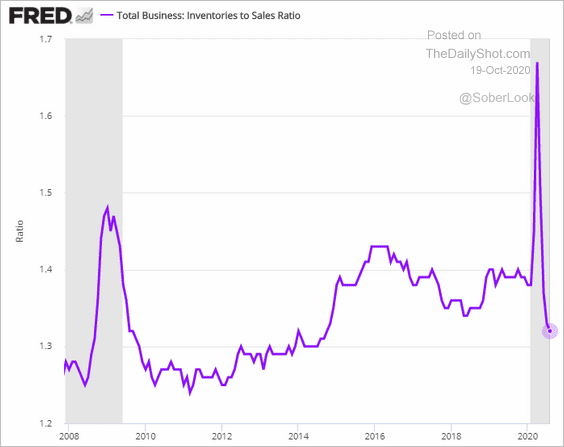
And this is the ratio for retailers.
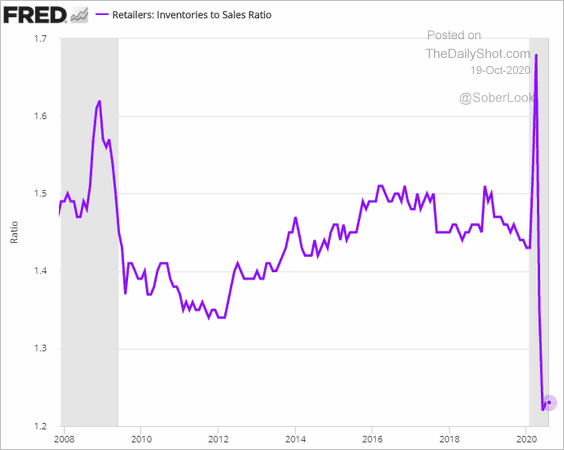
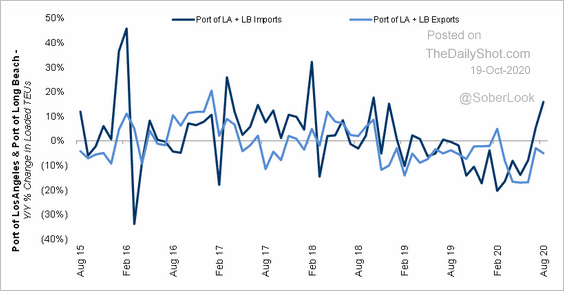
Low inventories are the reason for the robust import activity we see at LA ports.
 Source: Cass Information Systems
——————–
5. US freight activity has nearly recovered.
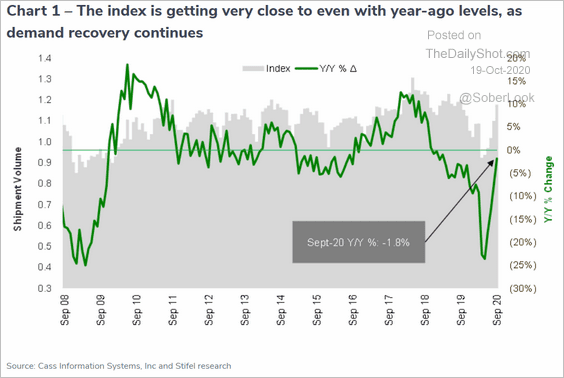 Source: Cass Information Systems
However, intermodal shipping prices remain depressed.
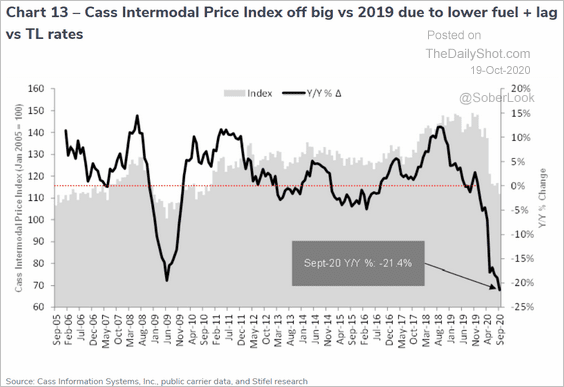 Source: Cass Information Systems
——————–
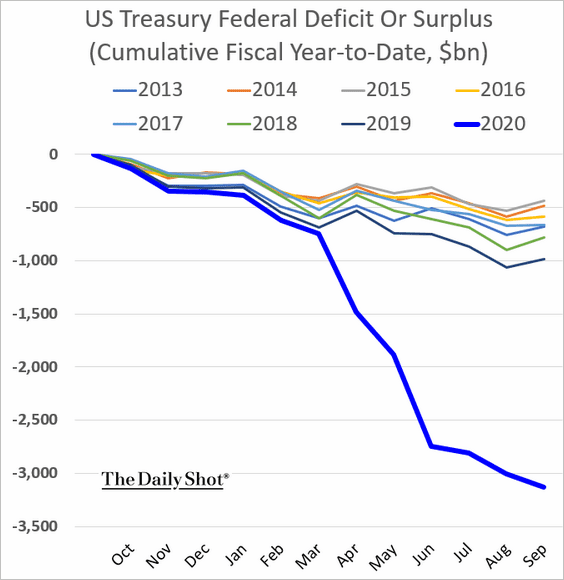
6. The federal deficit exceeded $3 trillion in fiscal 2020.
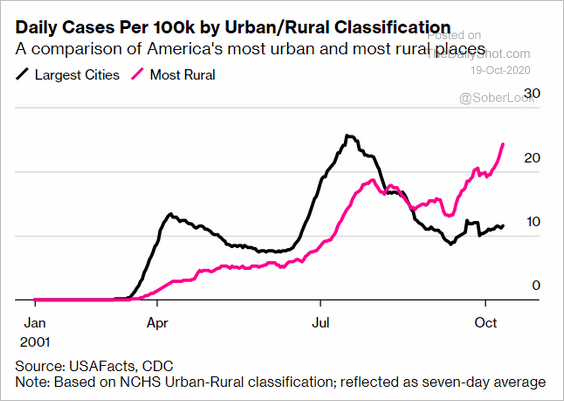
7. New COVID cases have been surging in rural America.
 Source: @bpolitics Read full article
The Eurozone
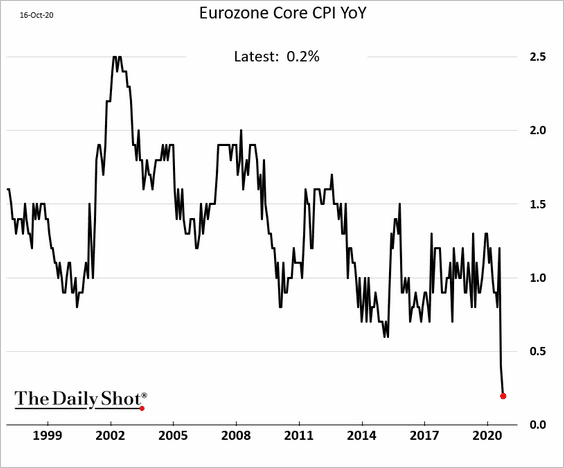
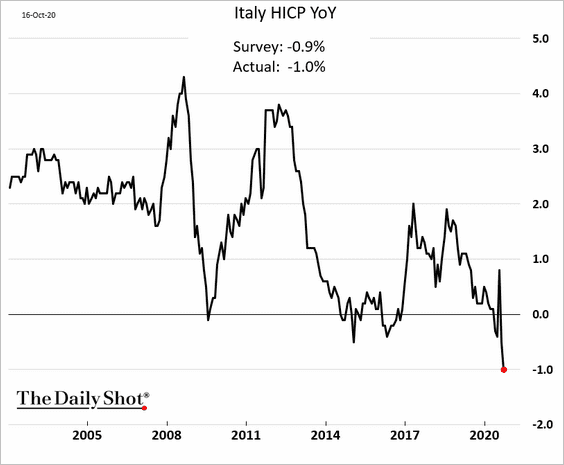
1. Euro-area core CPI hit the lowest level on record.
Italian inflation is at a record low and firmly in deflation territory.
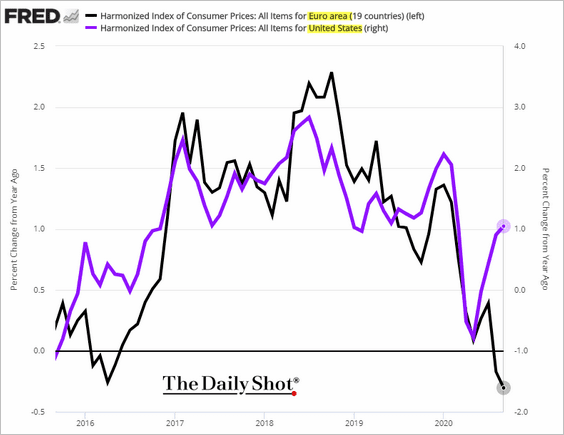
The Eurozone-US CPI gap has been unusually wide and is unlikely to persist.
——————–
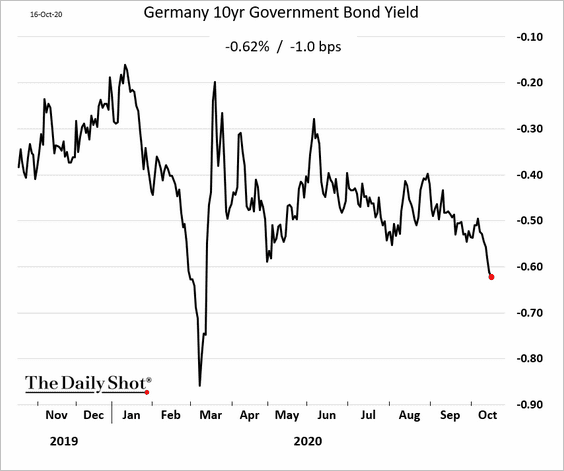
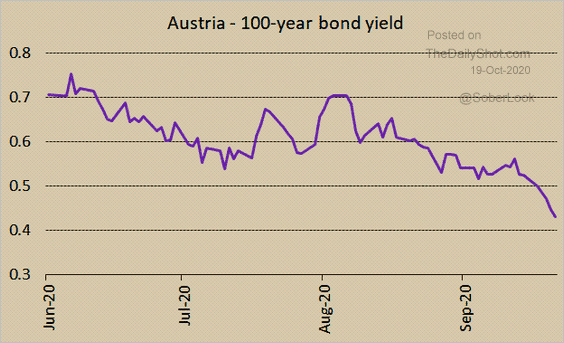
2. Eurozone sovereign yields have been drifting lower.
Here is the yield on Austria’s 100-year bond.
 Source: @jsblokland
——————–
3. Did Eurozone’s car registrations overshoot to the upside?
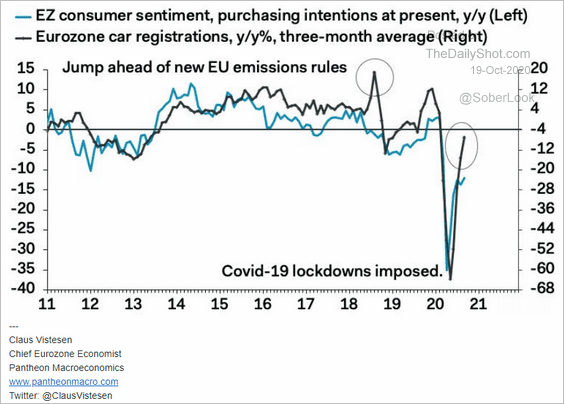 Source: Pantheon Macroeconomics
4. Euro-area exports to the US and UK haven’t fully recovered.
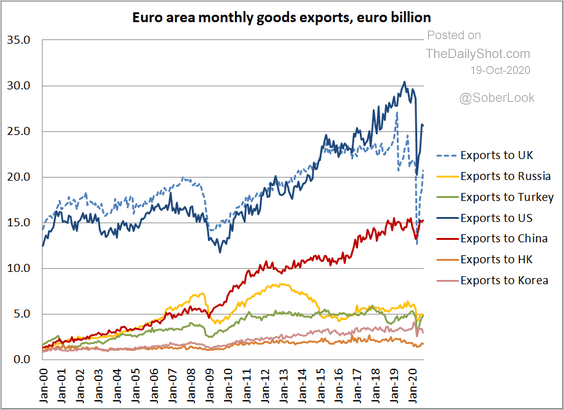 Source: @Brad_Setser
5. This chart shows sector contributions to GDP versus the 08-09 recession.
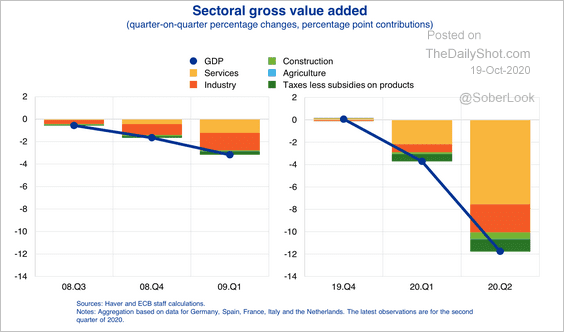 Source: ECB
Europe
1. Markets aren’t too concerned about the latest Brexit brinkmanship. Has this become a “cry wolf” situation?
 Source: Reuters Read full article
2. Two-thirds of the STOXX 600 firms have not fully recovered from the March losses.
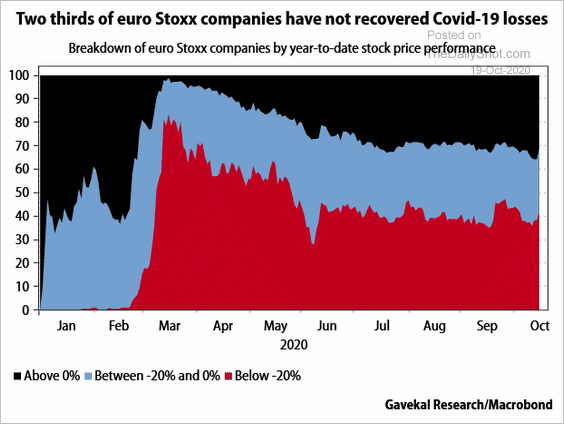 Source: Gavekal
3. This scatterplot shows the declines in H1 GDP vs. total COVID deaths.
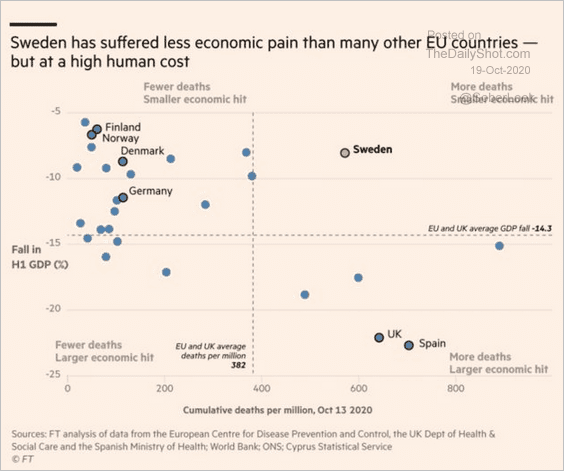 Source: @adam_tooze, @FT Read full article
Asia -Pacific
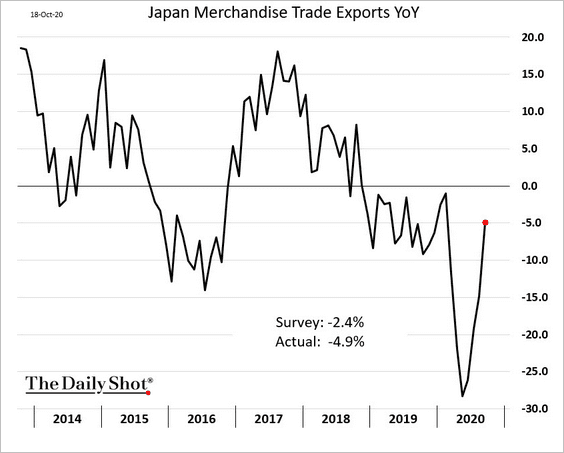
1. Japan’s exports are recovering but remain below last year’s levels.
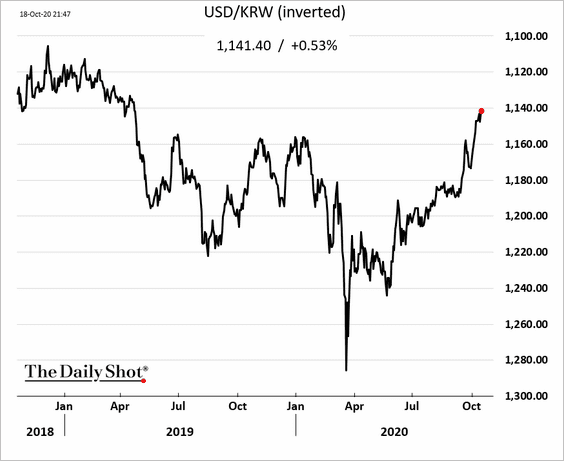
2. The South Korean won is grinding higher.
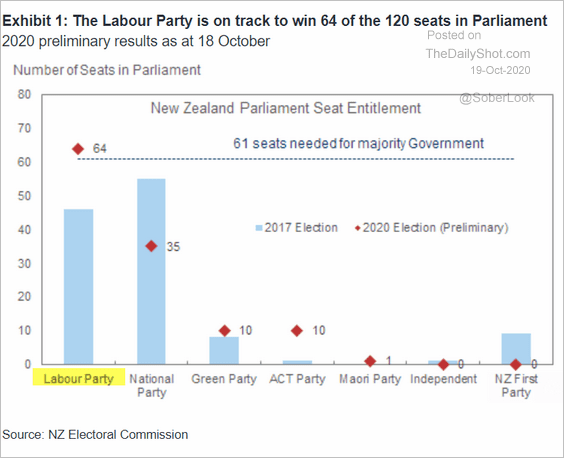
3. New Zealand’s ruling Labour Party scored an impressive win.
 Source: Goldman Sachs
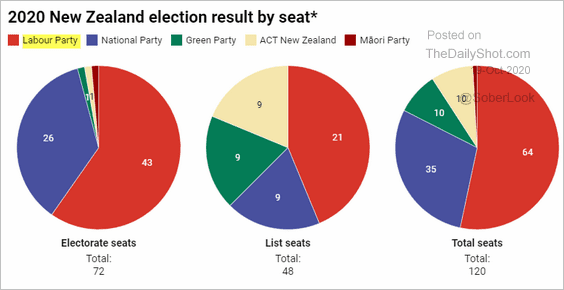 Source: The Conversation Read full article
China
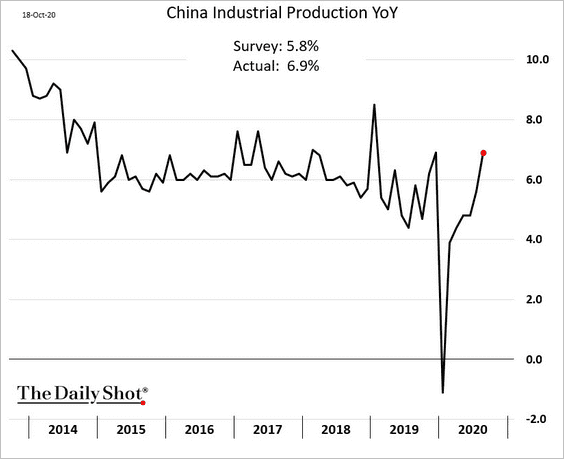
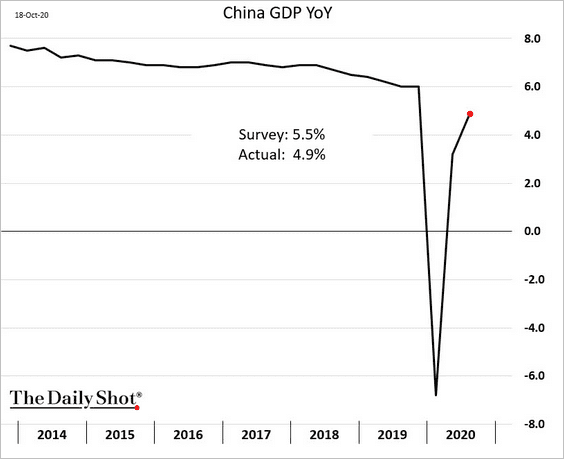
1. China continues to post strong economic results.
• Industrial production:
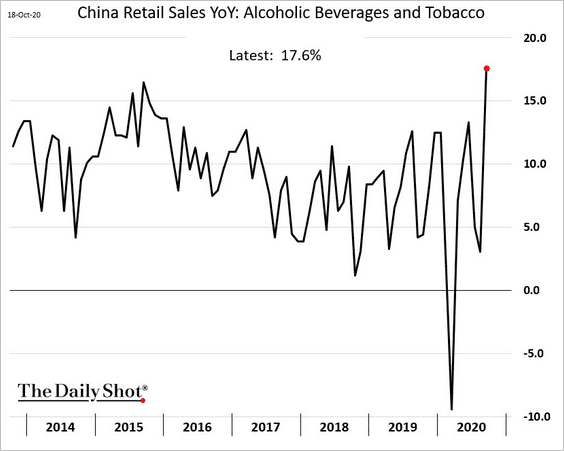
• Retail sales:
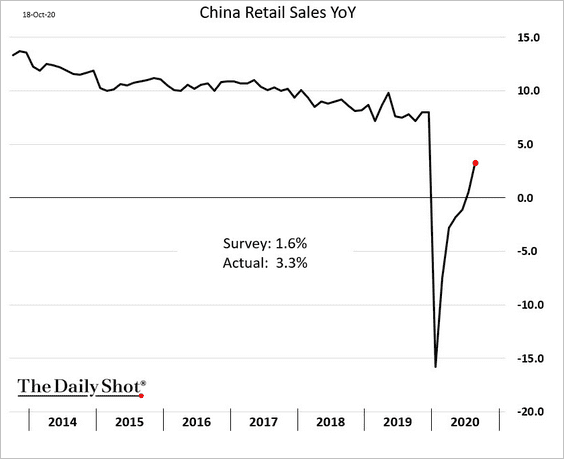
More festivities?
• Fixed-asset investments:
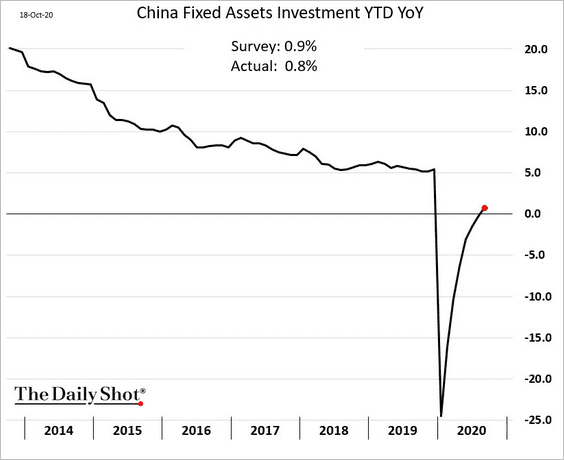
• The GDP growth was a bit below consensus, but China’s economy continues to outperform other nations.
——————–
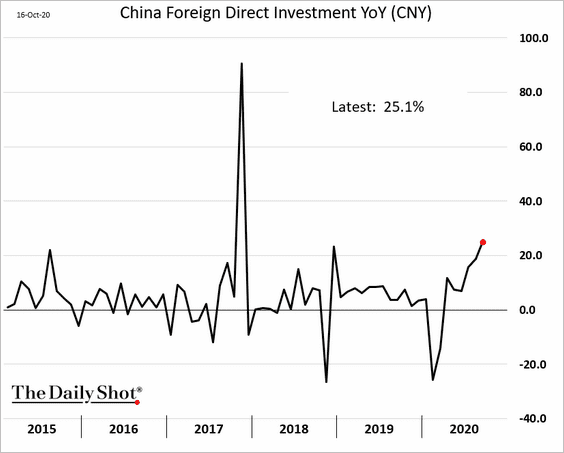
2. Foreign direct investment is up 25% vs. last year.
3. Corporate borrowing has slowed.
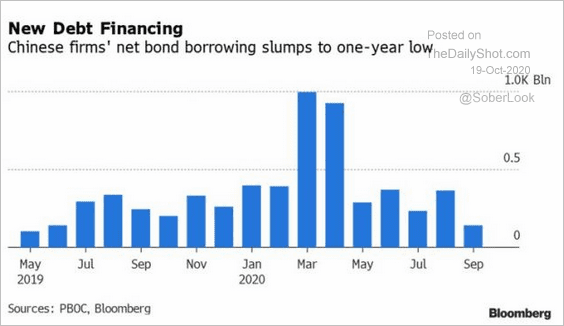 Source: @BLaw Further reading
But funding for firms in strategic industries (such as semiconductors) is booming.
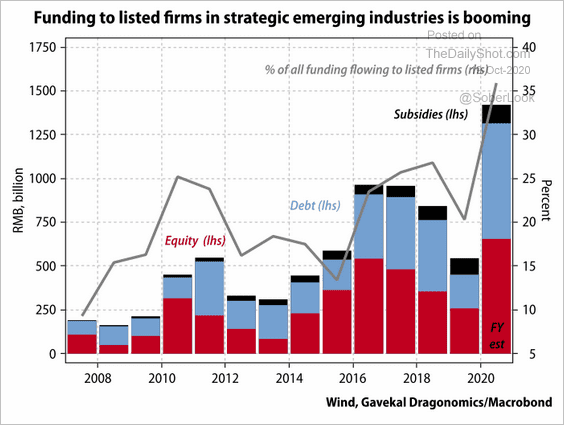 Source: Gavekal
——————–
4. The stock market remains at the upper end of the recent trading range.
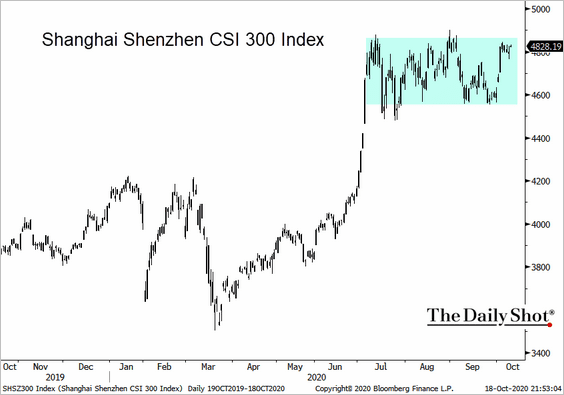 Source: @TheTerminal, Bloomberg Finance L.P.
Emerging Markets
1. Turkey’s home prices are 26% above last year’s levels.

2. The black-market Argentine peso discount to the official exchange rate continues to widen.
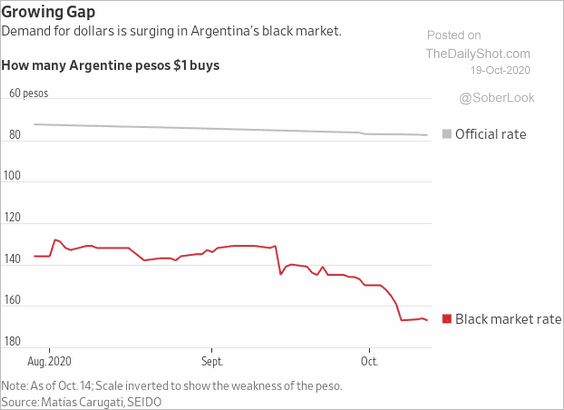 Source: @WSJ Read full article
Demand for US dollars keeps climbing.
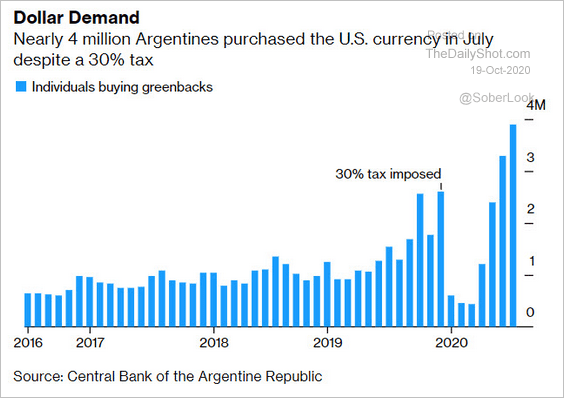 Source: @markets Read full article
Commodities
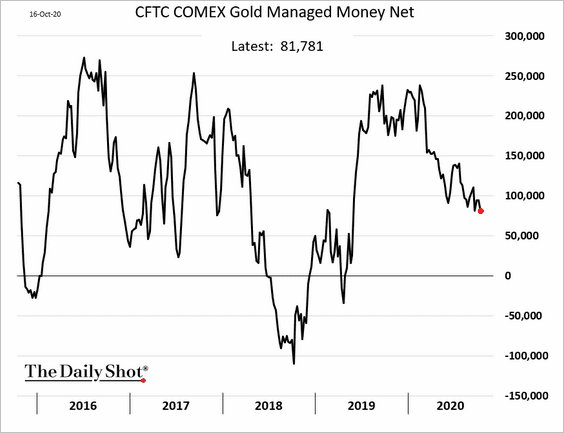
1. Hedge funds are becoming less bullish on gold.
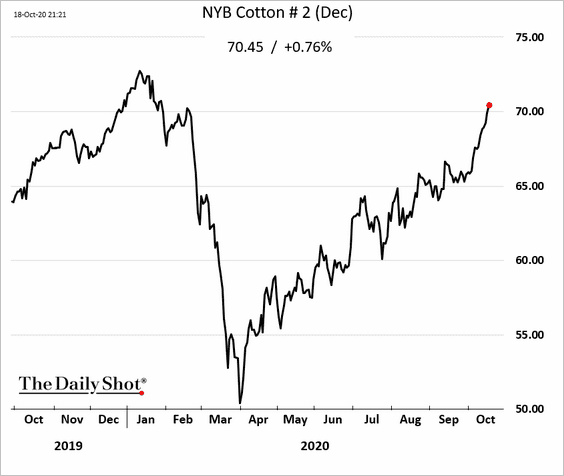
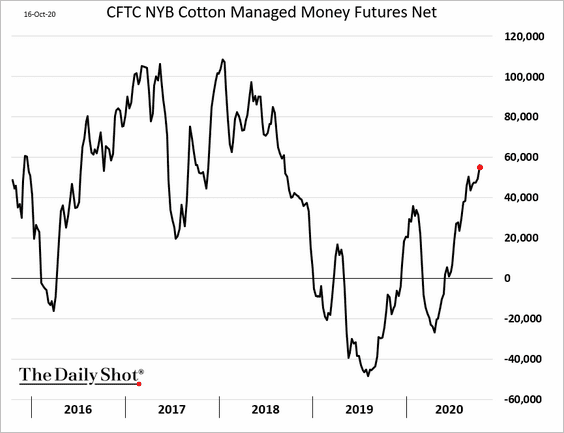
2. US cotton futures continue to climb as funds boost their bets (2nd chart).
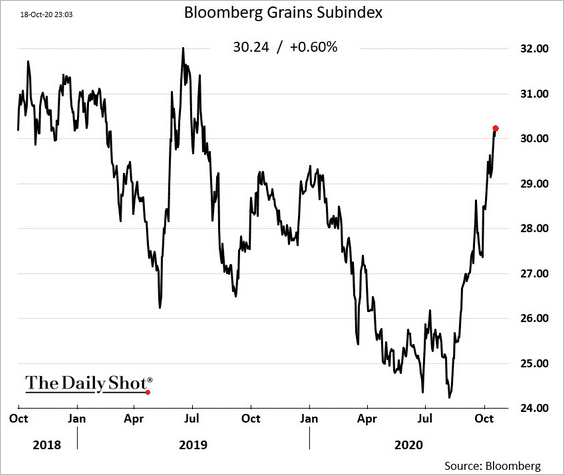
3. Speculative long positions in grain futures appear stretched.
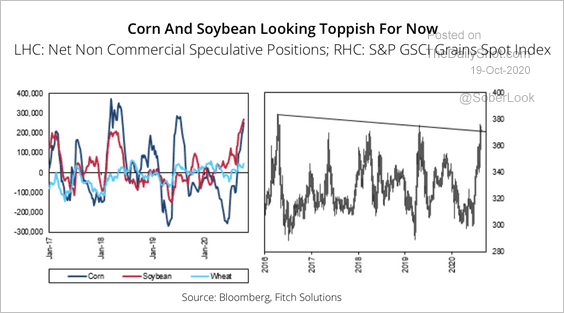 Source: Fitch Solutions Macro Research
Here is Bloomberg’s grains index.
——————–
4. The Invesco Agricultural ETF (DBA) is at resistance.
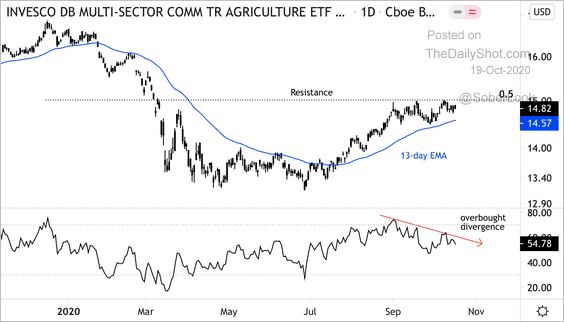 Source: @DantesOutlook
Energy
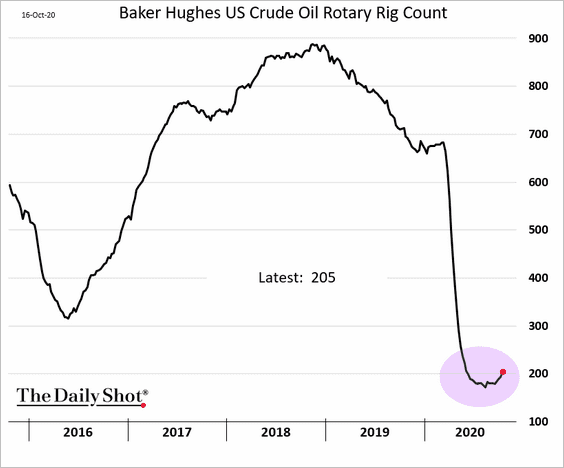
1. US rigs are back above 200.
2. Global coal prices are rebounding.
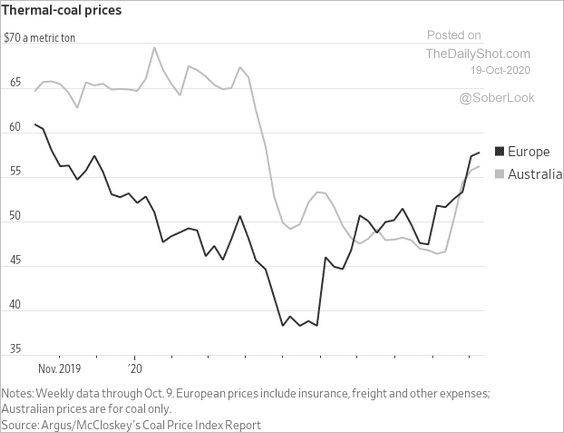 Source: @WSJ Read full article
3. CO2 emissions limits for passenger cars continue to tighten.
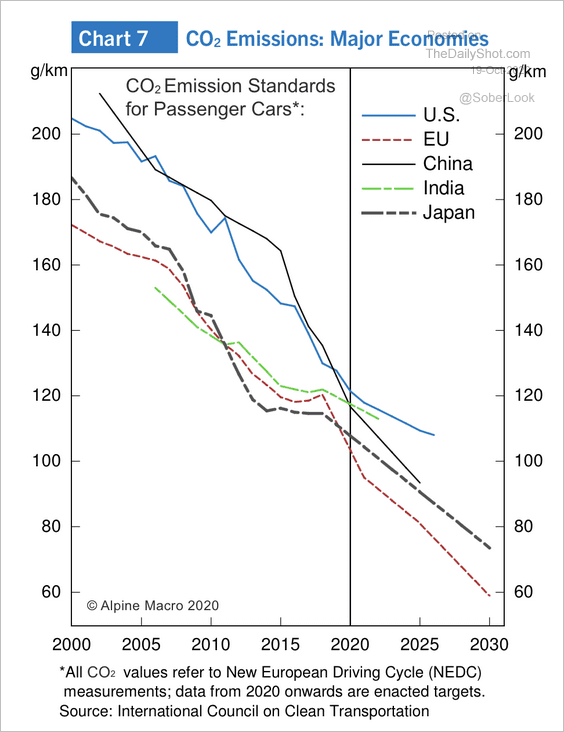 Source: Alpine Macro
Equities
1. Is stimulus back on?
 Source: Fox Business Read full article
——————–
2. Cyclical sectors have been quite strong since the March low.
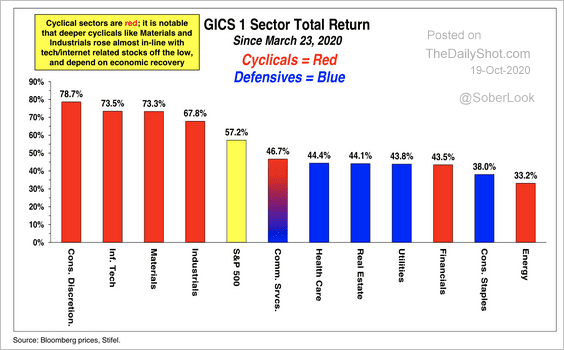 Source: Stifel
But equal-weighted cyclicals now appear stretched versus defensives.
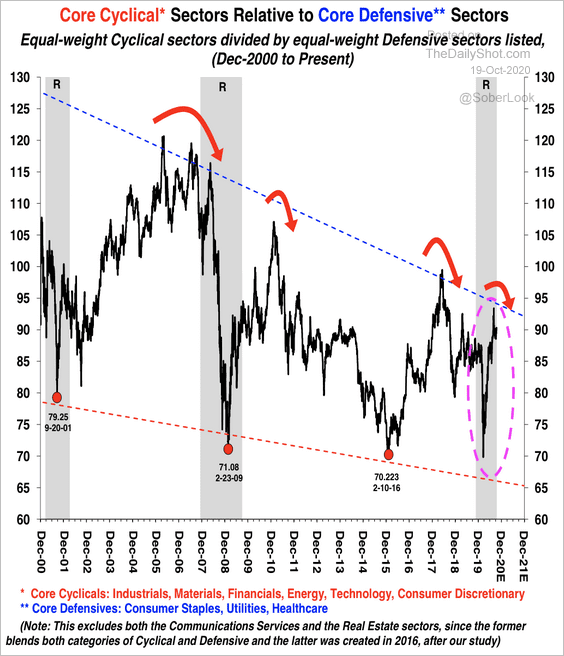 Source: Stifel
——————–
3. Sentiment indicators are increasingly bullish.
• Short-term market timers:
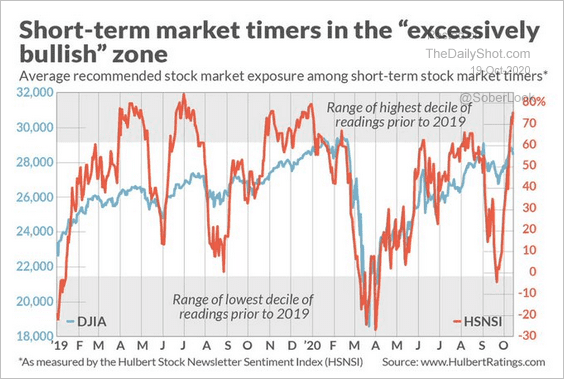 Source: @jessefelder, @MacroCharts, Hulbert Ratings Read full article
• Investment managers:
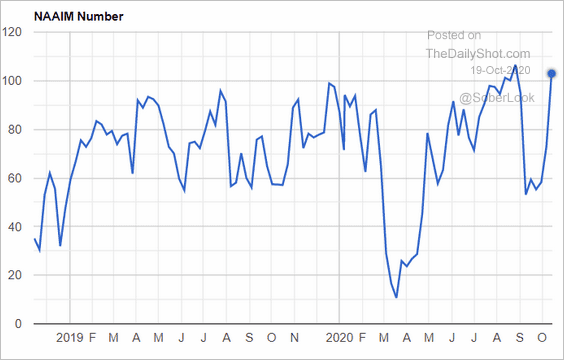 Source: NAAIM
——————–
4. Increased retail activity boosted demand for low-price stocks.
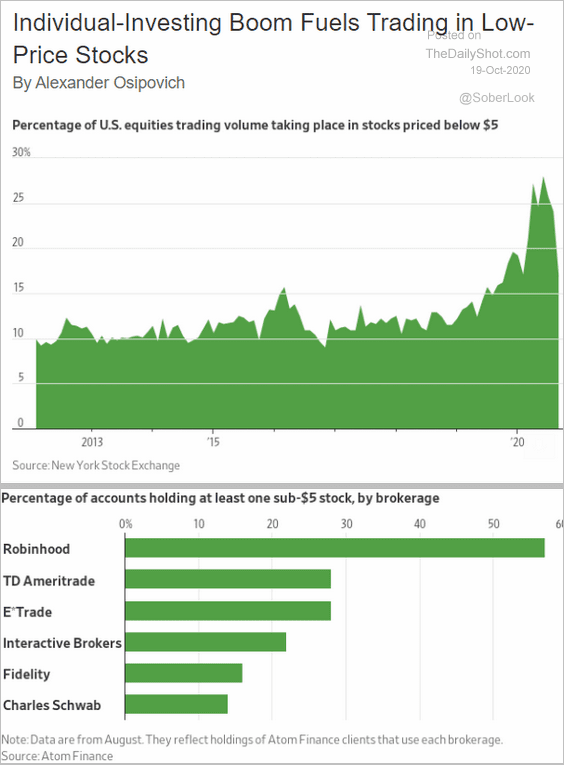 Source: @WSJ Read full article
5. Finally, this chart shows stock ownership by generation.
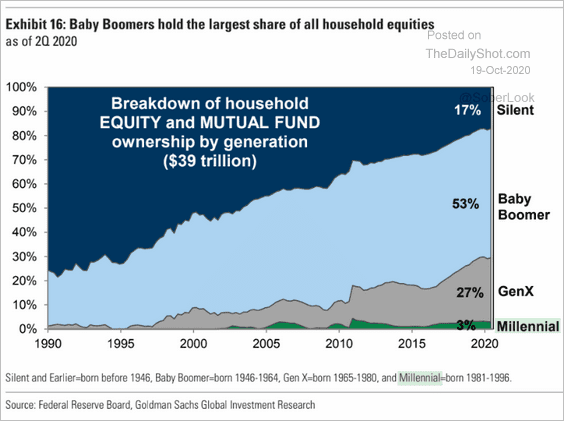 Source: Goldman Sachs, @GunjanJS
Credit
1. Fund flows into US corporate credit have been robust.
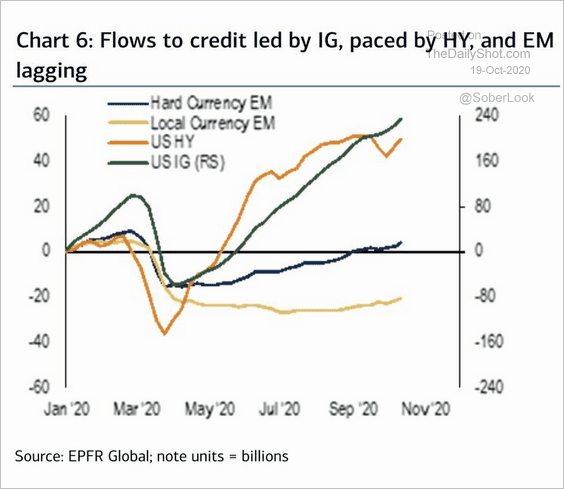 Source: BofA Global Research
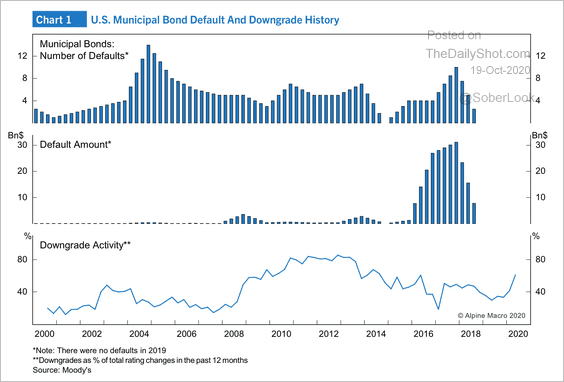
2. The cumulative default rate for municipal bonds has only been 0.21% since 2010, according to Alpine Macro. However, as a result of the pandemic, downgrade activity has increased.
 Source: Alpine Macro
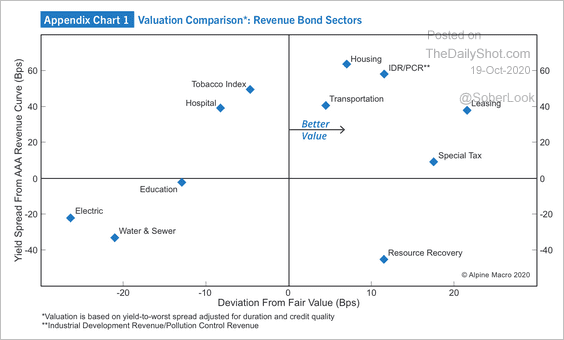
Here is a valuation comparison of revenue bond sectors. They tend to outperform general obligation munis in an economic recovery, according to Alpine Macro.
 Source: Alpine Macro
Rates
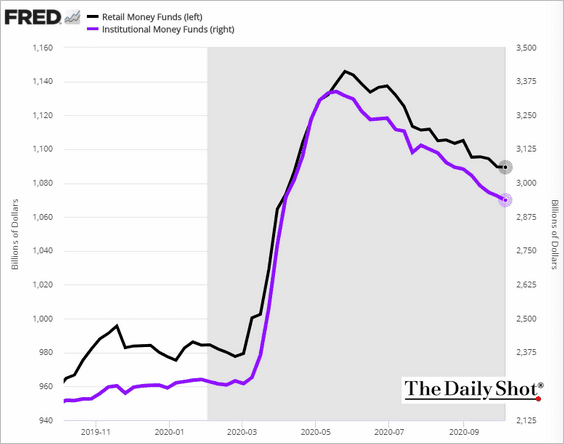
1. Money market funds continue to see outflows.
2. Traders are betting on higher US longer-term yields.
• Large speculators’ bets against the long bond:
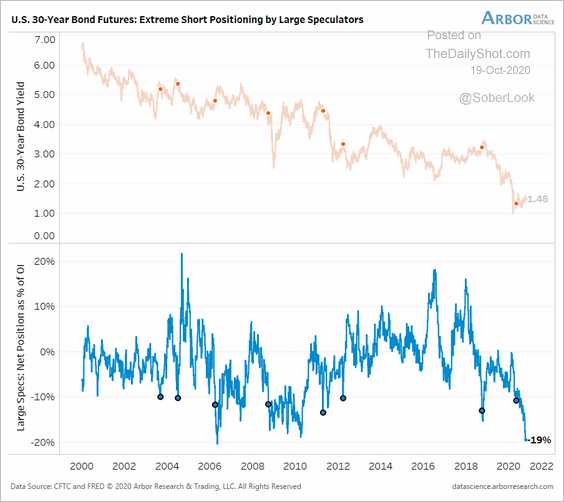 Source: Arbor Research & Trading
• Swaption skew:
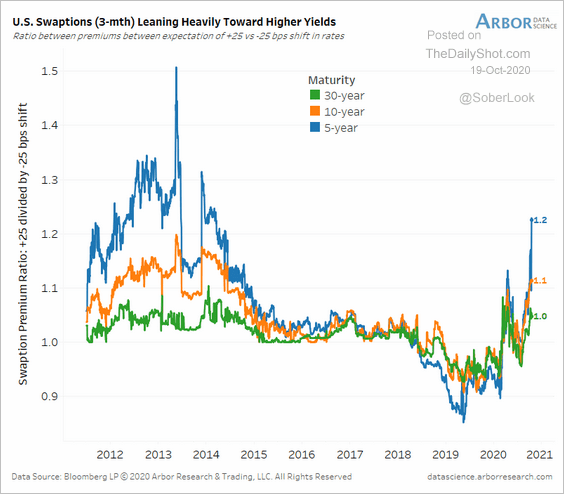 Source: Arbor Research & Trading
——————–
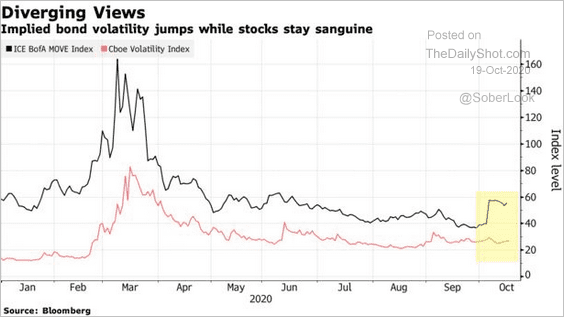
3. Implied volatility in Treasuries remains elevated relative to stocks ahead of the election. The bet is that Democrats will increase spending sharply via another massive stimulus bill. That’s good for stocks but not for bonds.
 Source: @markets Read full article
4. The amount of negative-yielding debt globally is approaching the 2019 highs.
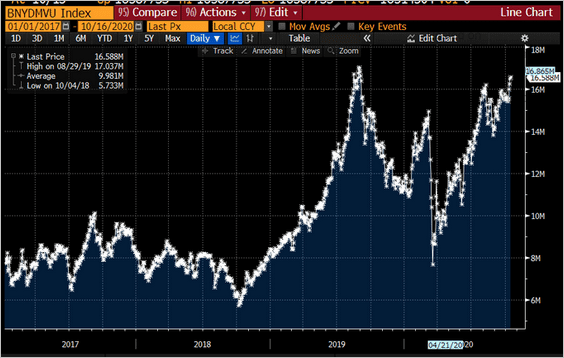 Source: @lisaabramowicz1
Global Developments
1. Let’s begin with the working hours lost this year.
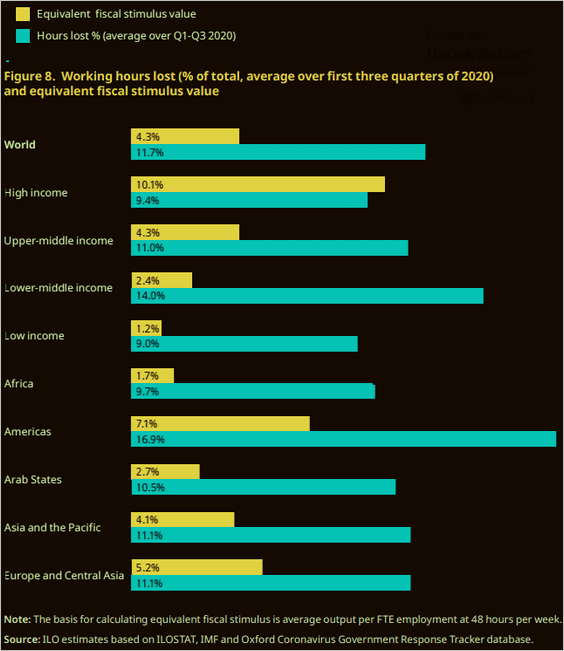 Source: WEF, ILO Read full article
2. This chart shows the unemployment rate for select economies.
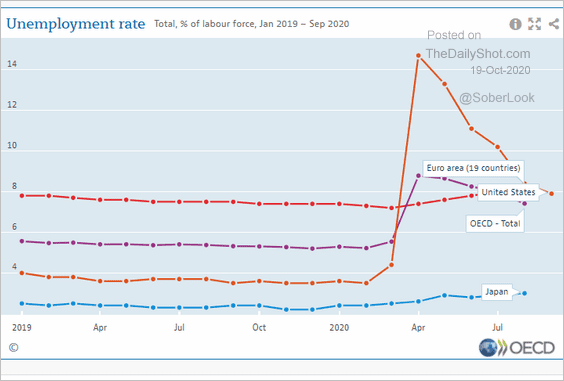 Source: OECD Read full article
3. Long-term GDP growth forecasts continue to decline.
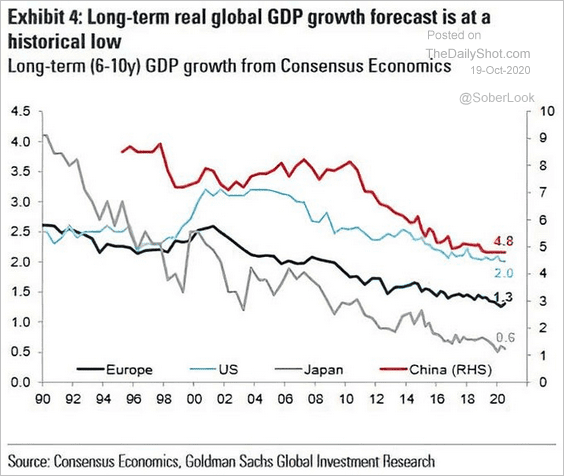 Source: @ISABELNET_SA, @GoldmanSachs
4. Limited shipping capacity and improvements in global trade boosted container rates this year.
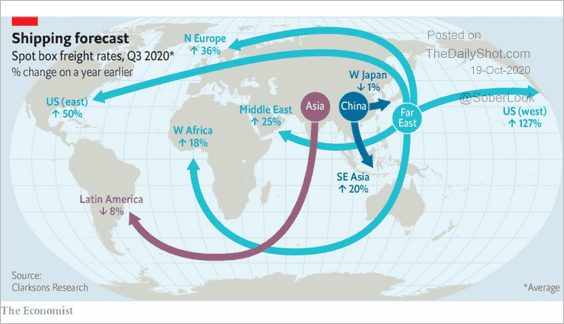 Source: @adam_tooze Read full article
5. Caterpillar’s sales point to a divergence between Asia’s and North America’s recovery.
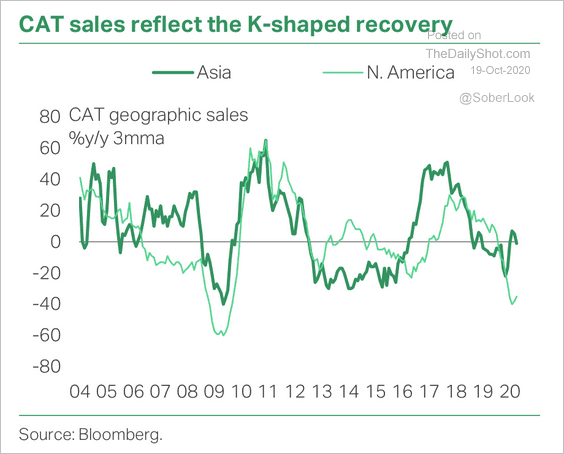 Source: TS Lombard
——————–
Food for Thought
1. Share of residents aged 65 and older (by state):
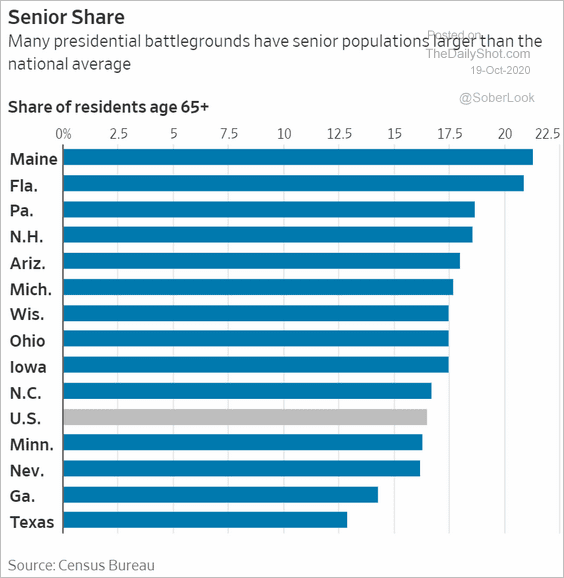 Source: @WSJ Read full article
2. President Trump’s tweets in capital letters:
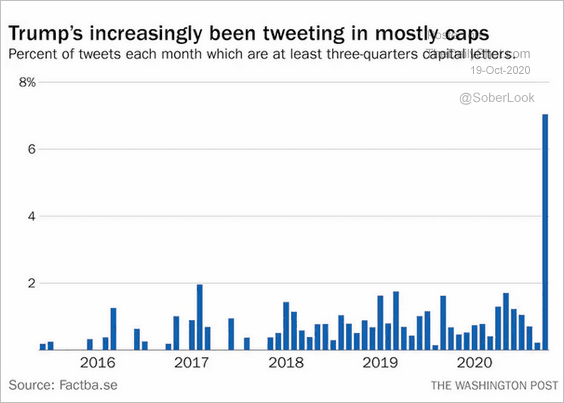 Source: @aedwardslevy Read full article
3. Joe Biden’s proposed spending initiatives:
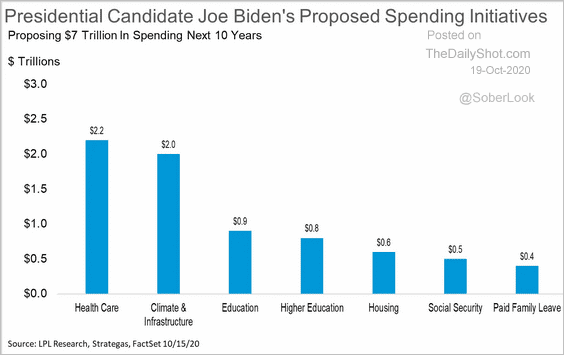 Source: LPL Research
4. Interest in moving to Canada:
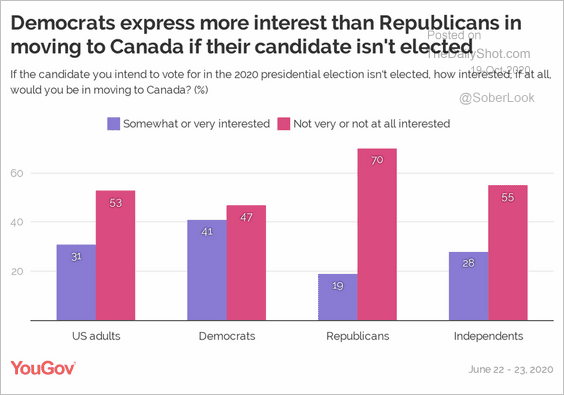 Source: @YouGovAmerica Read full article
5. How close are the last polling estimates to the actual outcome?
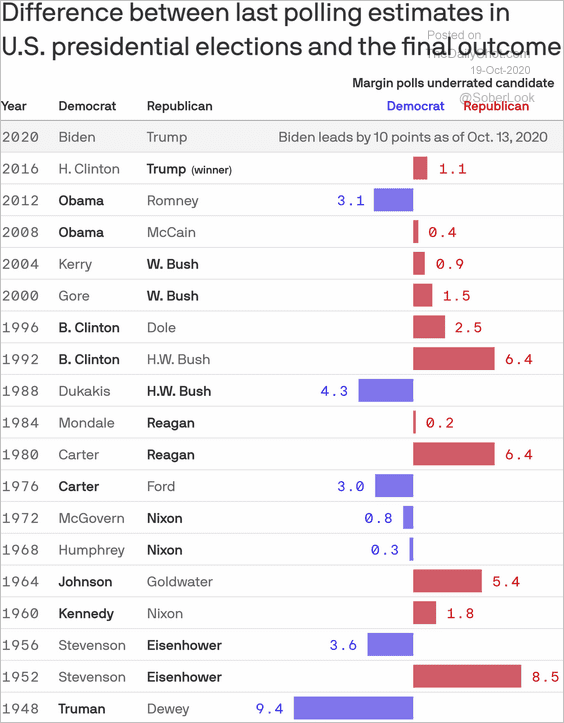 Source: @axios Read full article
6. Likely sources of infection in the US:
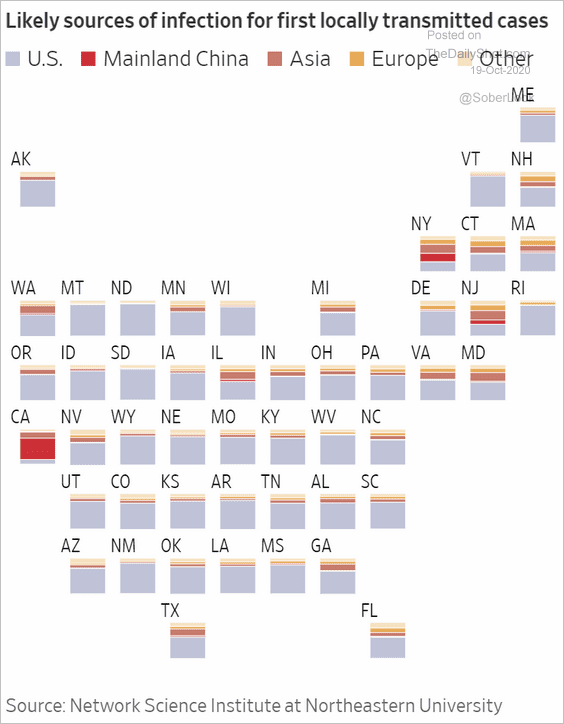 Source: @WSJ Read full article
7. The biggest tech deals:
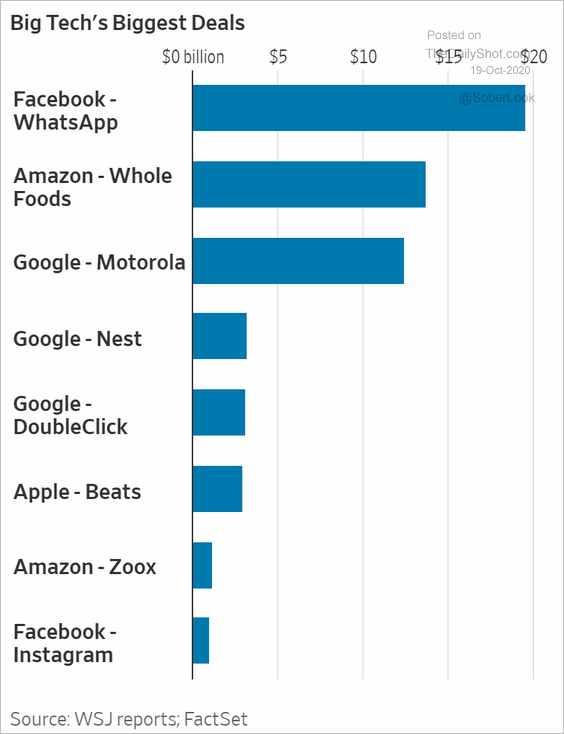 Source: @WSJ Read full article
8. How far does $100 go in your metro area?
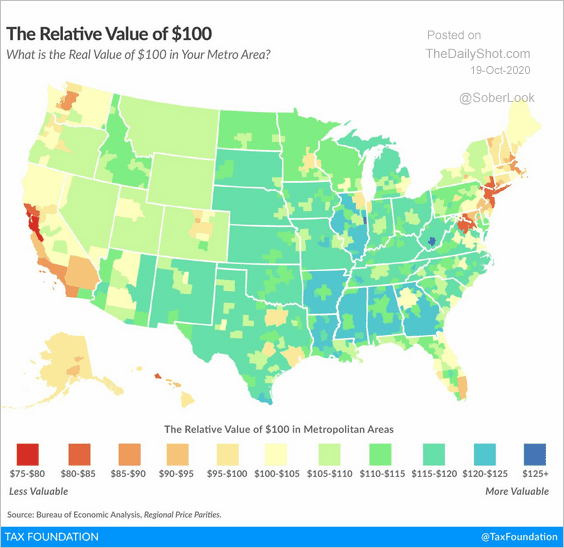 Source: @TaxFoundation Read full article
9. The internet in 1973 (ARPANET):
 Source: @VisualCap Read full article
——————–