
The Daily Shot: 28-Oct-20
• The United States
• The United Kingdom
• The Eurozone
• Asia – Pacific
• China
• Emerging Markets
• Commodities
• Energy
• Equities
• Rates
• Food for Thought
The United States
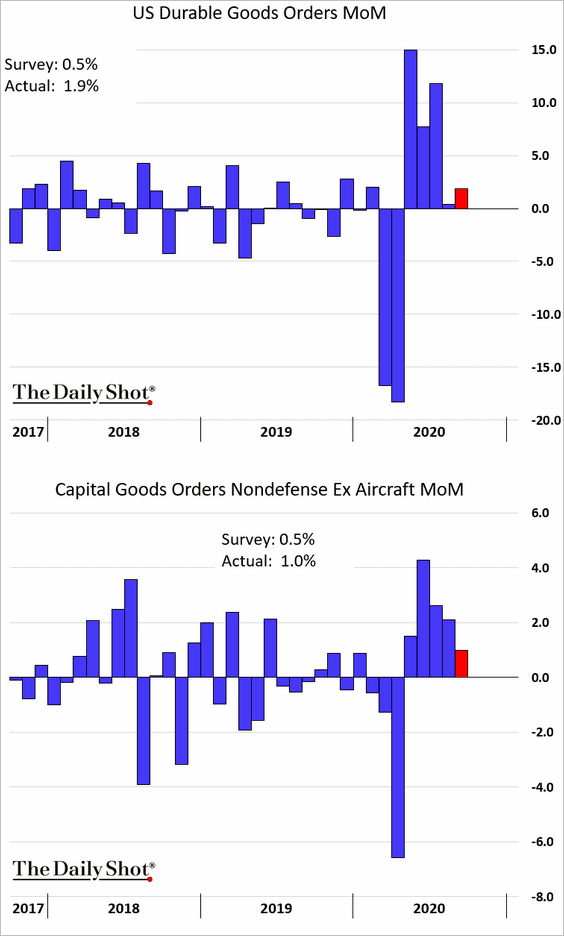
1. Durable goods orders rose more than expected last month, boosted by aircraft sales. Capital goods demand, which tends to be a proxy for business investment, also topped economists’ forecast.
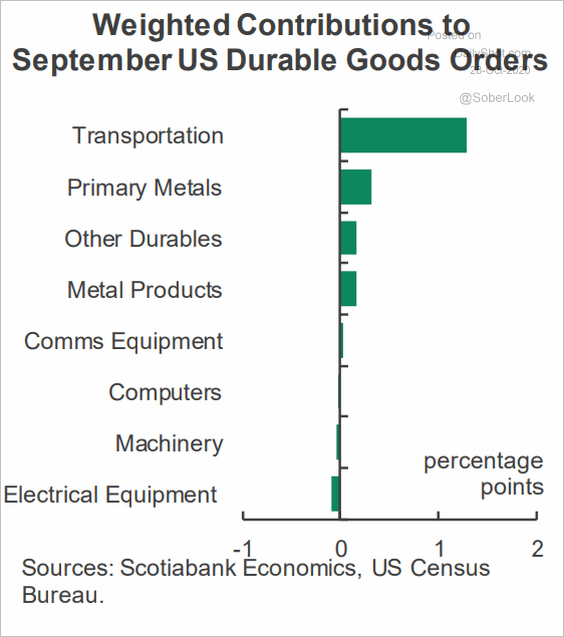 Source: Scotiabank Economics
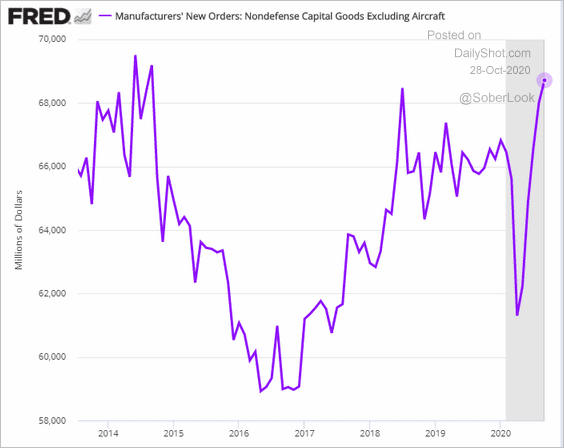
This chart shows US capital goods orders in dollar terms.
——————–
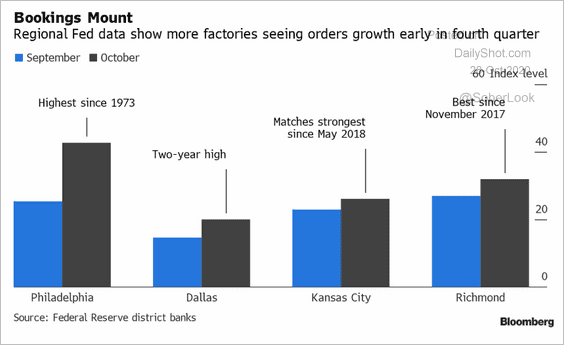
2. Manufacturing momentum has carried over into the fourth quarter, with regional Fed indicators pointing to robust factory orders in October.
 Source: @DoubleTGolle, Bloomberg Finance L.P.
The combination of the regional Fed surveys indicates a strong month for manufacturing at the national level (ISM).
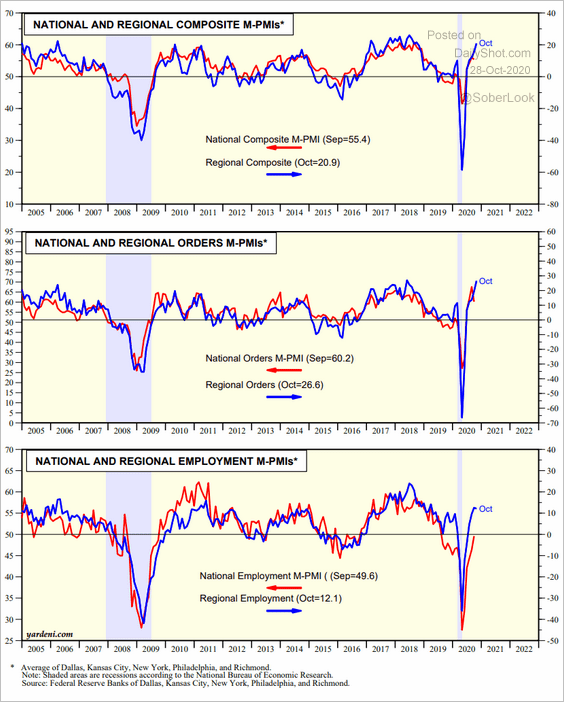 Source: Yardeni Research
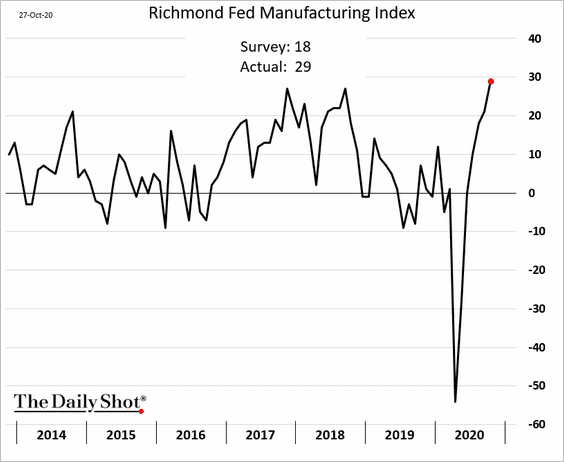
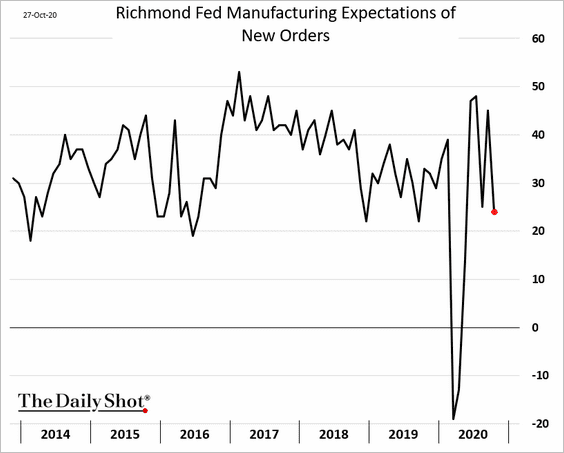
Below is the Richmond Fed’s regional manufacturing indicator.
• The headline index:
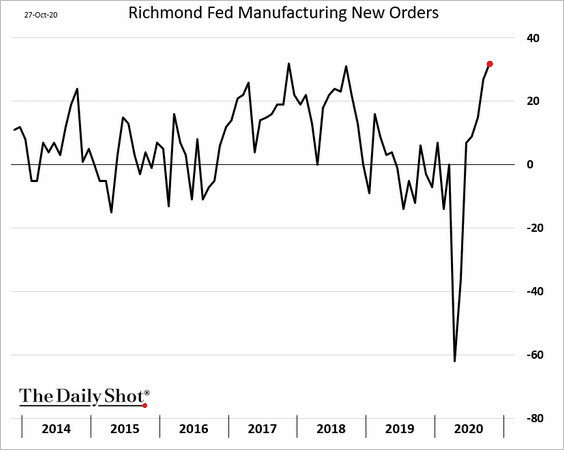
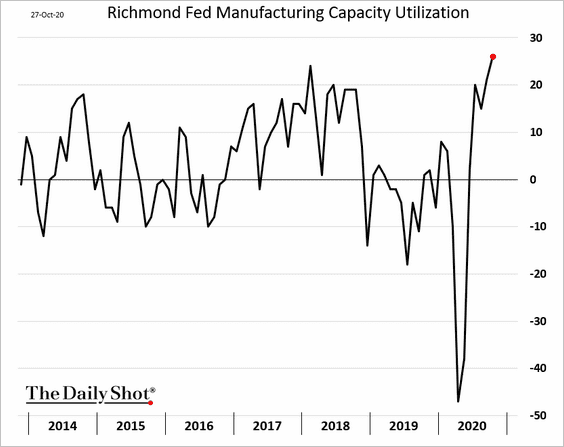
• New orders and capacity utilization:
• Expectations of future activity have been less upbeat.
——————–
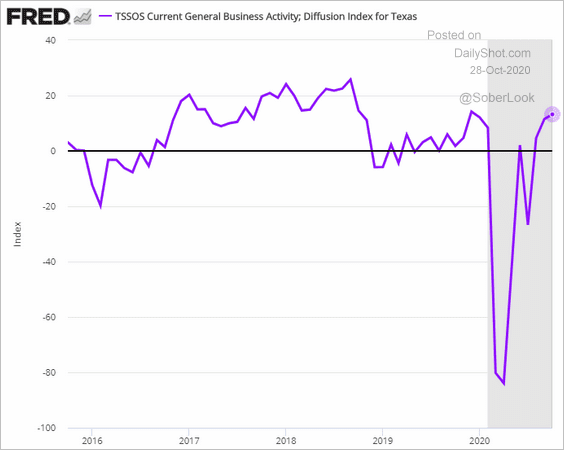
3. The Dallas Fed’s service-sector index shows robust business activity in the region.
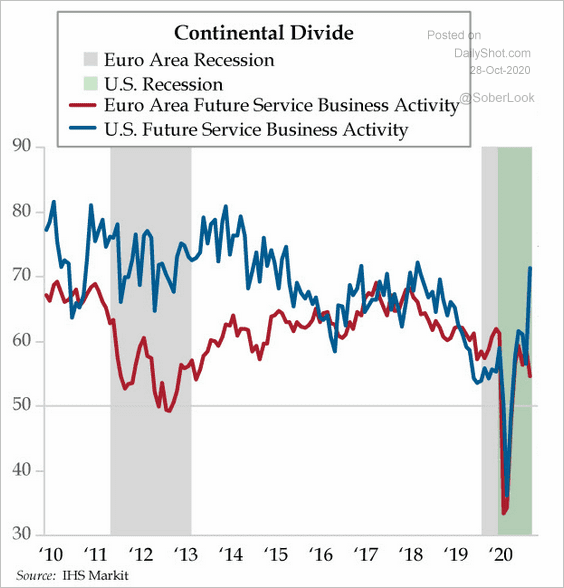
US services have performed remarkably well, given the pandemic spike. Will we see a pullback in November? Here is a comparison between the US and Eurozone service business activity (PMI).
 Source: The Daily Feather
——————–
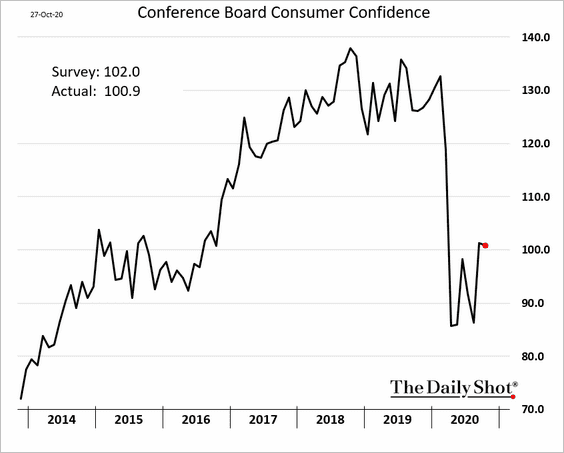
4. Consumer confidence softened in the second half of October but remains stable in the face of the COVID spike.
5. Many Americans have been using credit cards to pay rent.
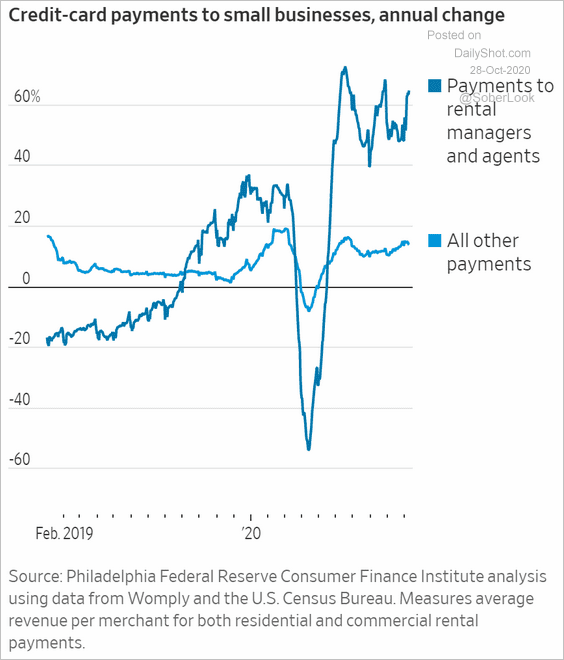 Source: @WSJ Read full article
6. The sharp drop in money velocity points to slower inflation ahead.
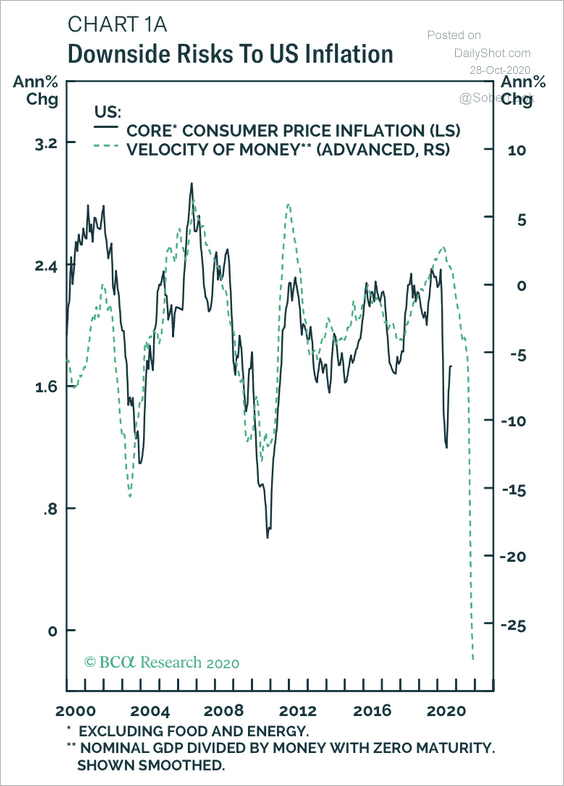 Source: BCA Research
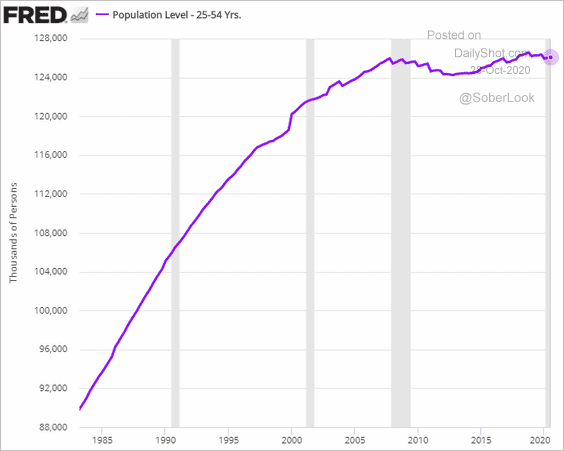
7. The nation’s prime-age population has been relatively flat since 2007. This development has been (and will continue to be) a drag on the GDP growth.
8. It may be a while before the GDP trajectory returns to its pre-crisis trend.
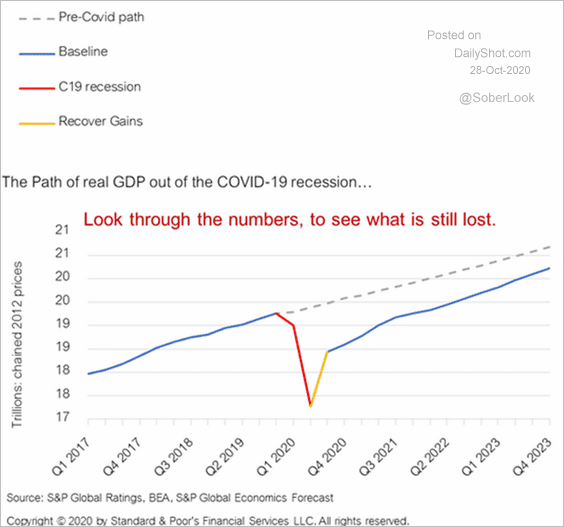 Source: S&P Global Market Intelligence
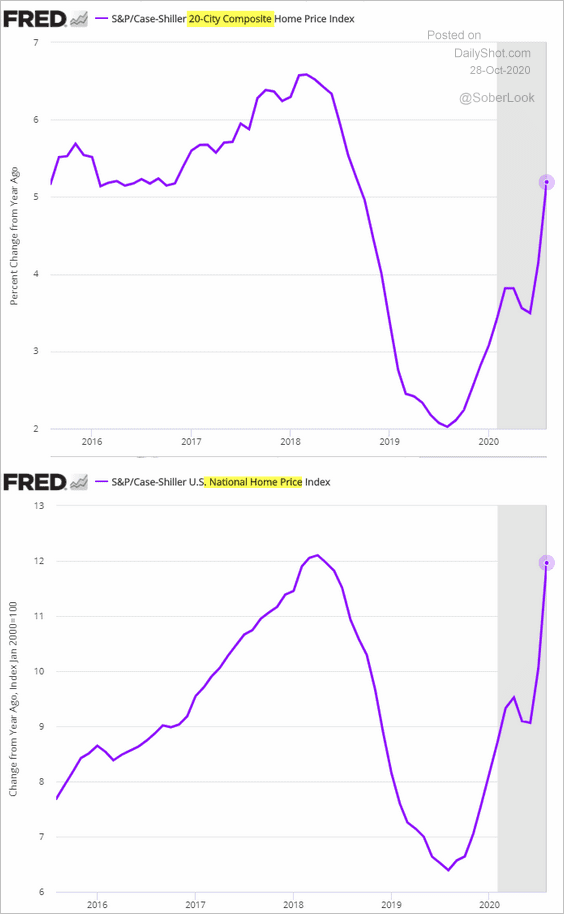
9. Finally, we have some updates on the housing market.
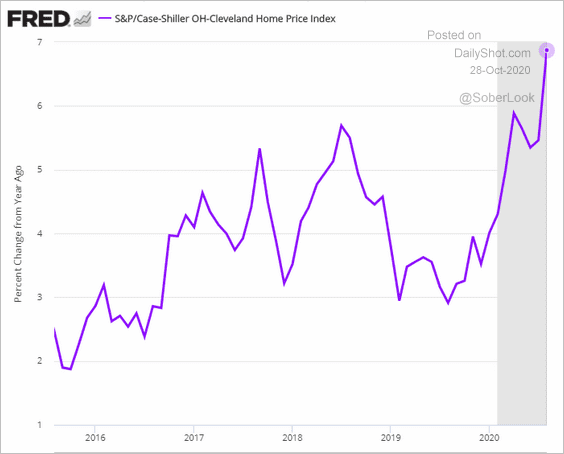
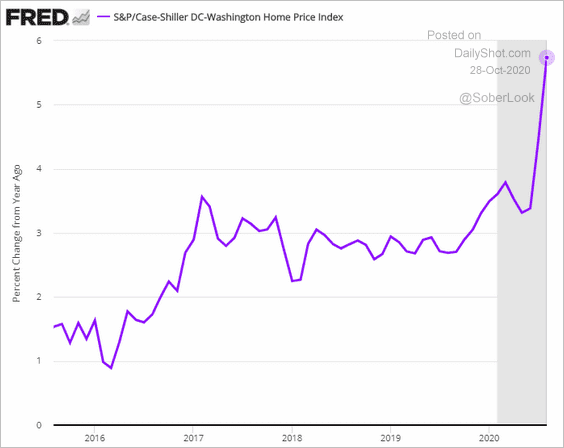
• Home price appreciation based on Case-Shiller data:
– Examples (DC and Cleveland):
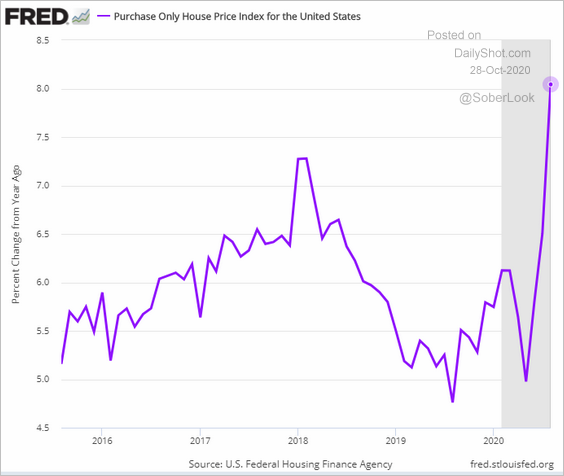
• Home price appreciation based on FHFA data:
• The median age of housing inventory (for sale):
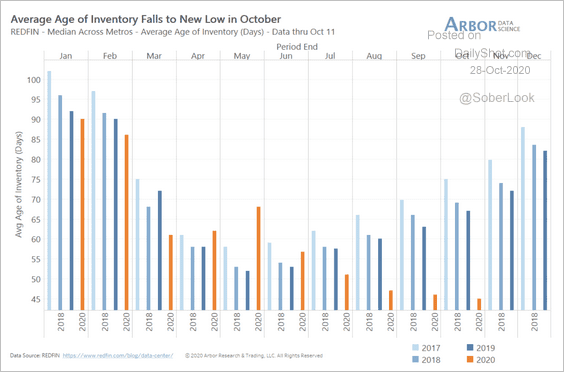 Source: Arbor Research & Trading
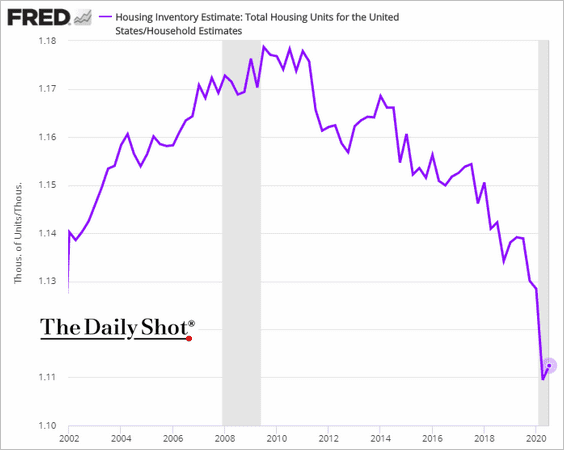
• Total housing inventory per household (tight supply):
• New single-family houses sold but not yet started:
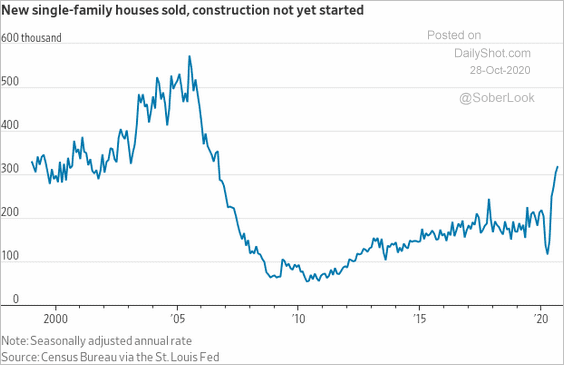 Source: @jeffsparshott
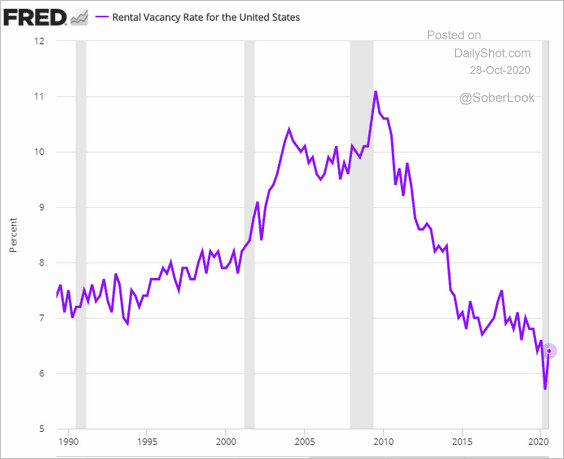
• Rental vacancy rate:
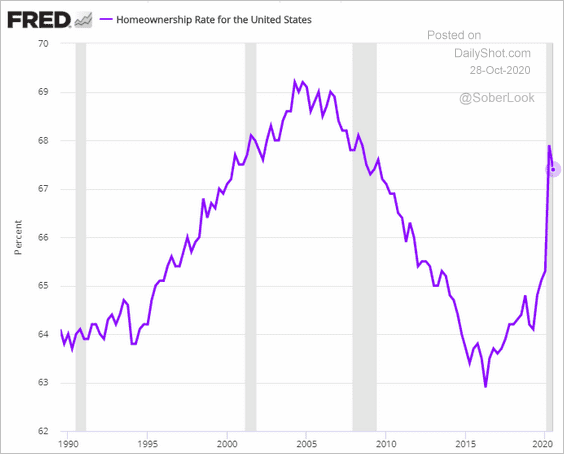
• Homeownership rate:
The United Kingdom
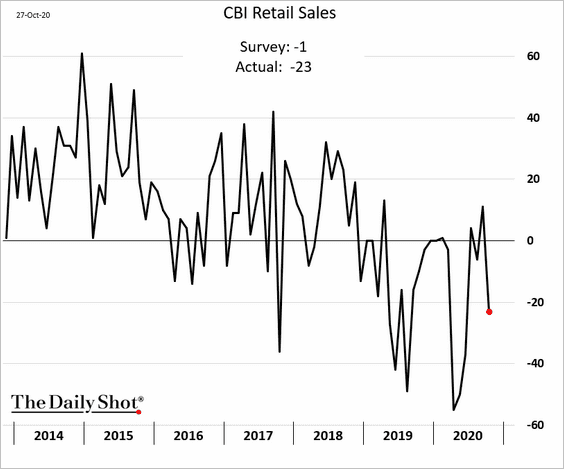
1. The September gains in retail sales did not carry into October.
 Source: Reuters Read full article
——————–
2. Customer traffic at foodservice companies has deteriorated.
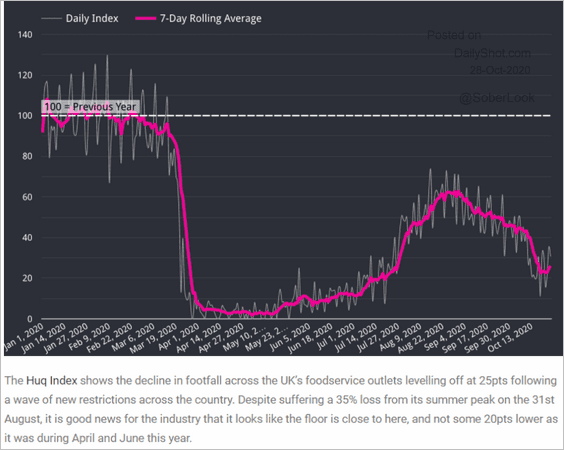 Source: huq Read full article
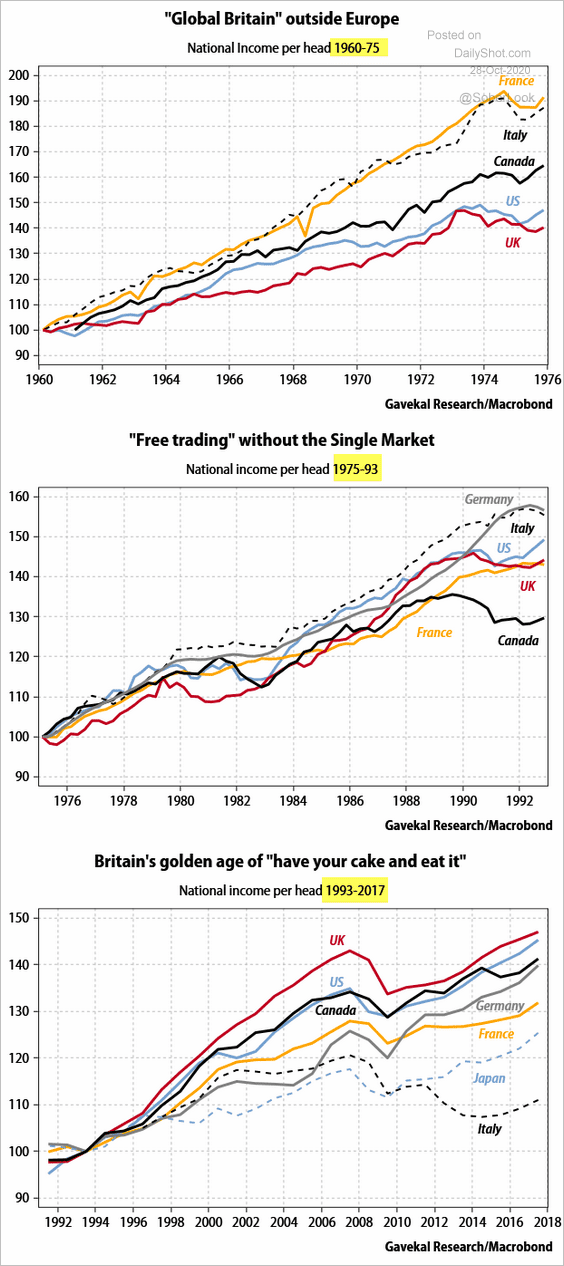
3. Here is a comment from Anatole Kaletsky (Gavekal Research) on the UK – EU history.
In the first period, when Britain was trying to re-establish itself as a global power, outside European economic structures, it was by far the world’s worst-performing major economy. During the second period, when Britain was inside the customs union, but before it enjoyed the single market in services, Britain’s performance was middling, roughly in line with France but well behind Italy and Germany. Of course, Britain’s fortunes in each of these periods of differing European engagement were shaped by many other forces. That objection can always be made when we try to draw lessons from history. Yet those who do not learn from history are often condemned to repeat it.
 Source: Gavekal
The Eurozone
1. The broad money supply is now up 10% vs. last year.
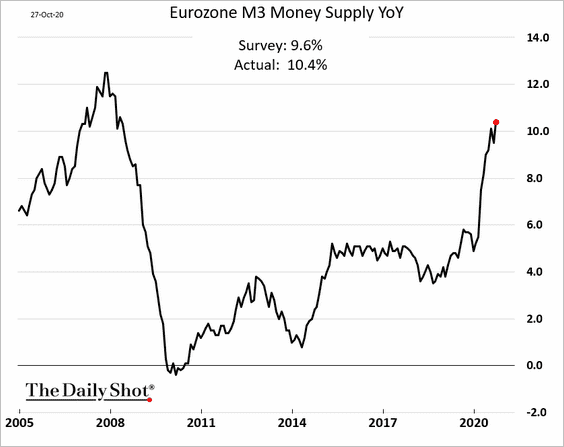
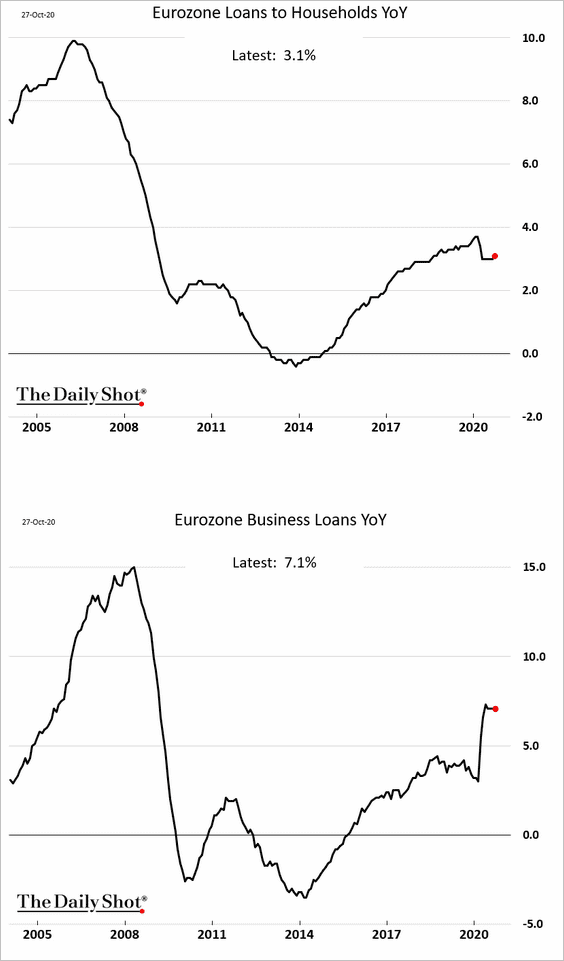
Most of the money supply gains have been driven by the ECB rather than bank lending.
This chart shows growth in private deposits.
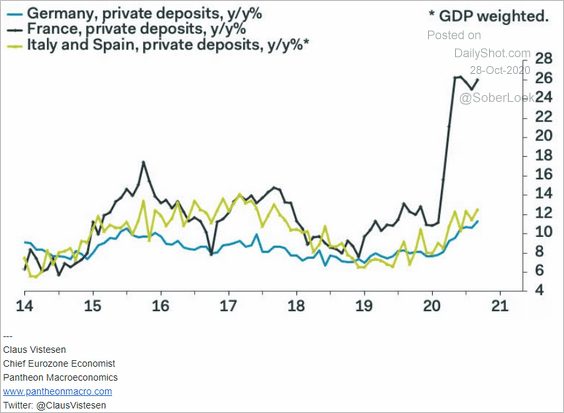 Source: Pantheon Macroeconomics
——————–
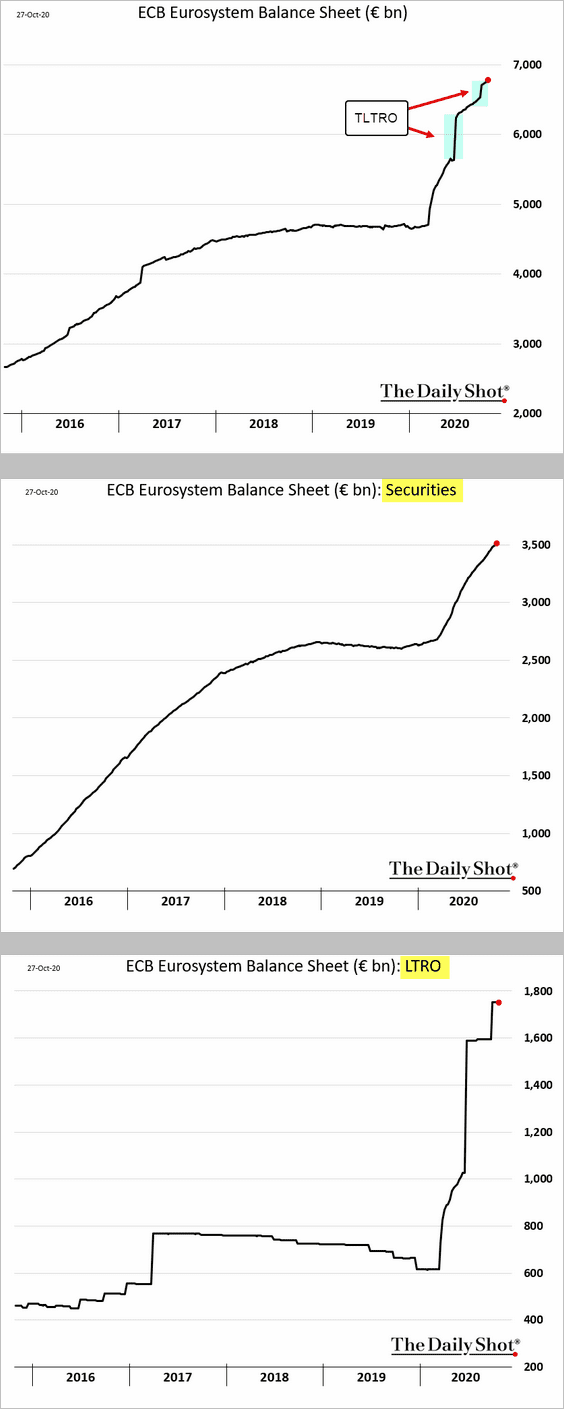
2. The ECB’s balance sheet is approaching €7 trillion. The LTRO program and securities purchases contributed to the recent growth.
3. The euro has been in a tight range versus the dollar.
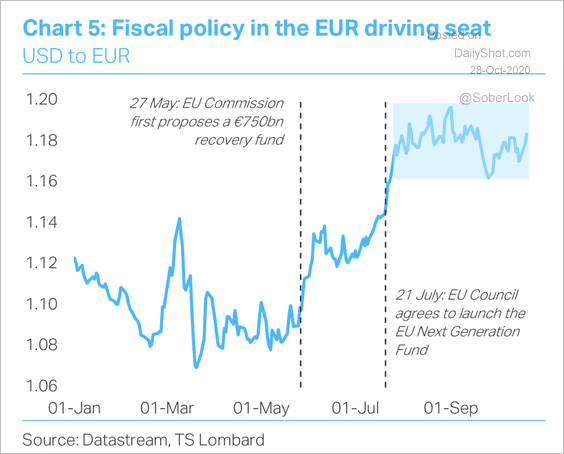 Source: TS Lombard
4. Here are the contributions to core inflation, which slowed rapidly. Is this the bottom?
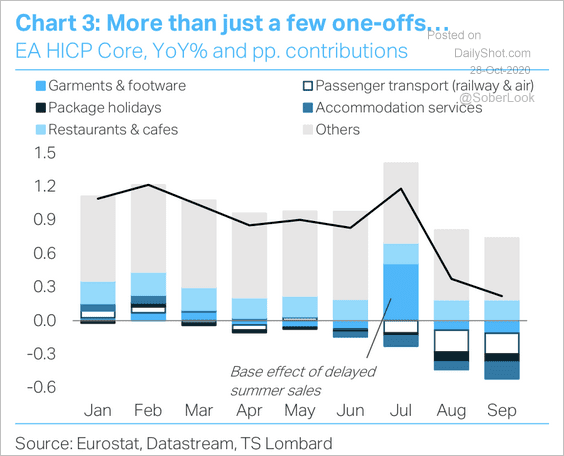 Source: TS Lombard
5. The graphic below illustrates the public’s attitudes toward the European Monetary Union (EMU).
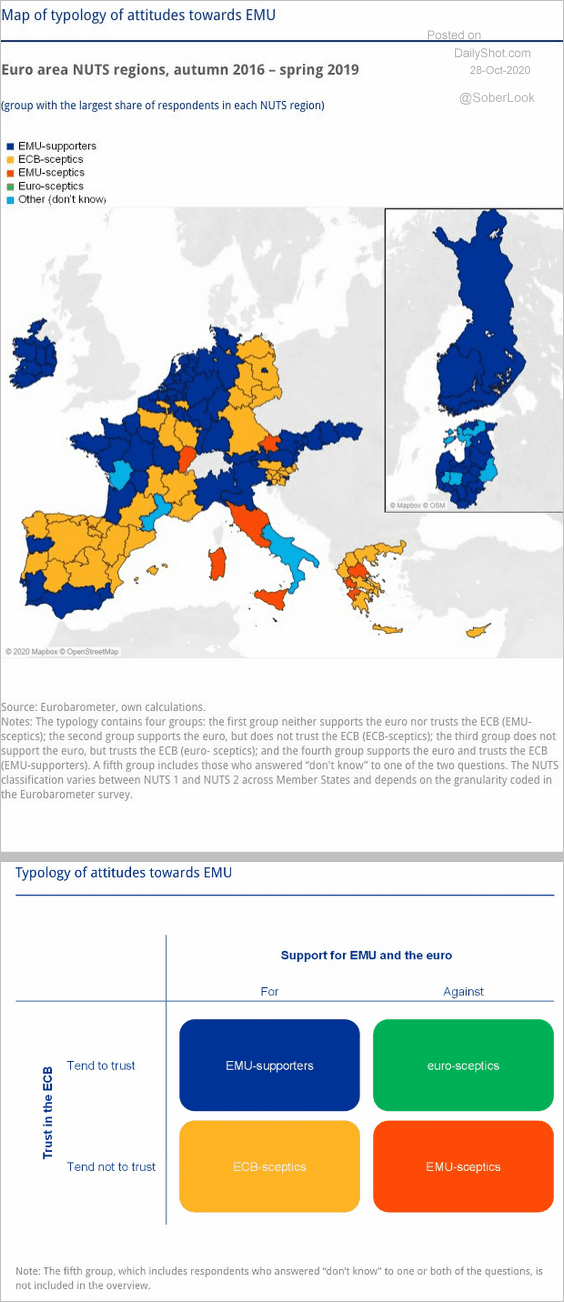 Source: @adam_tooze, @ecb Read full article
Asia – Pacific
1. Will the BoJ boost its ETF purchases?
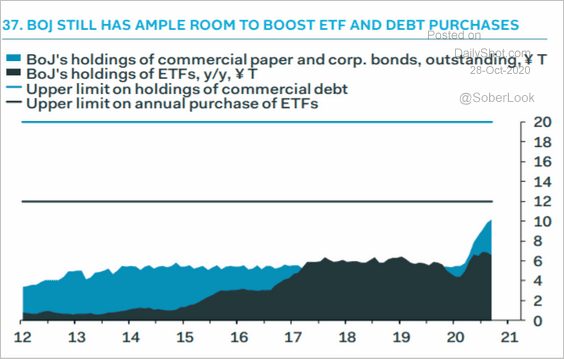 Source: Pantheon Macroeconomics
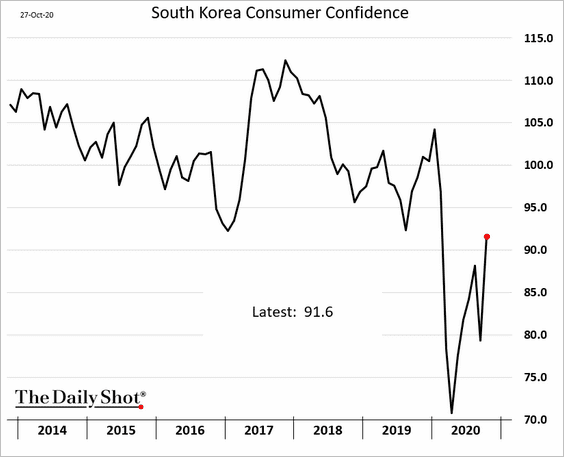
2. South Korea’s consumer confidence is recovering.
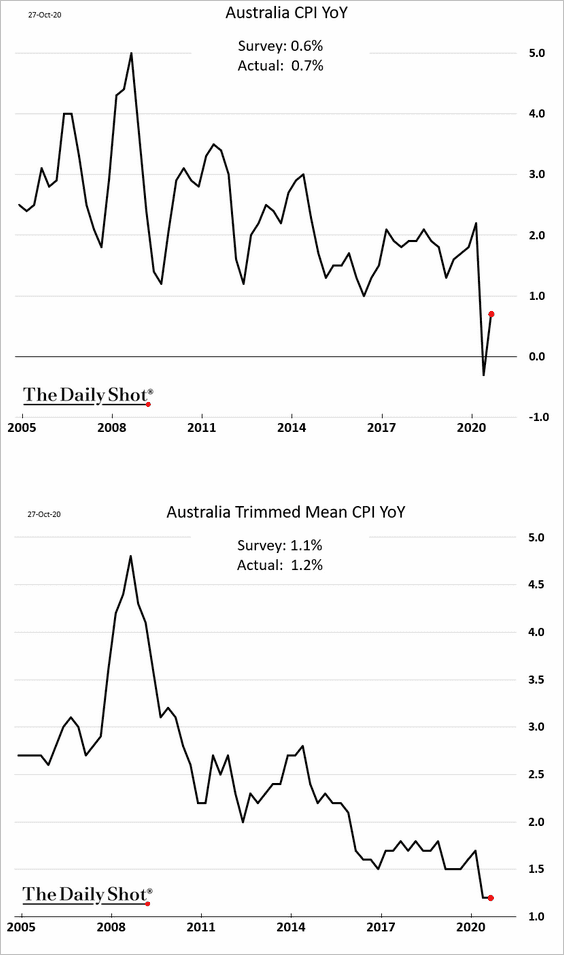
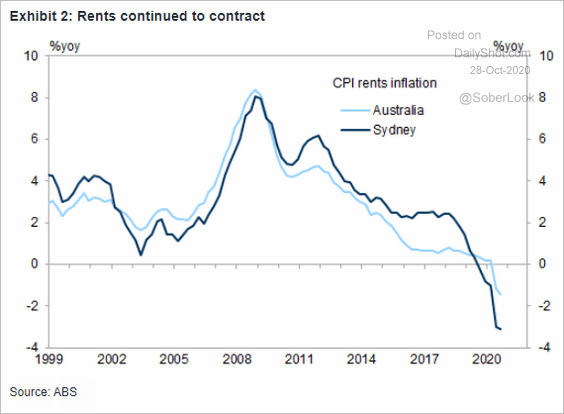
3. Australia’s inflation bounced from the lows (slightly ahead of market expectations). The trimmed-mean CPI remains subdued.
Rents have been declining.
 Source: Goldman Sachs
China
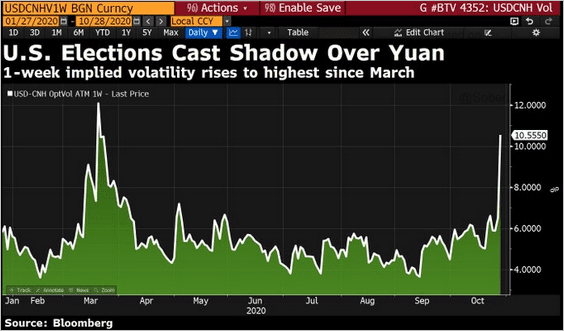
1. The 1-week yuan implied vol spiked ahead of the US election.
 Source: @DavidInglesTV
2. Here is a comparison of China’s imports from the US vs. 2017.
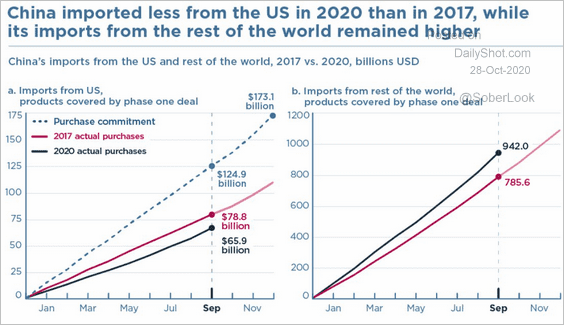 Source: @GregDaco, @ChadBown, @PIIE Read full article
3. This chart shows China’s mobile payments as a percentage of mobile users.
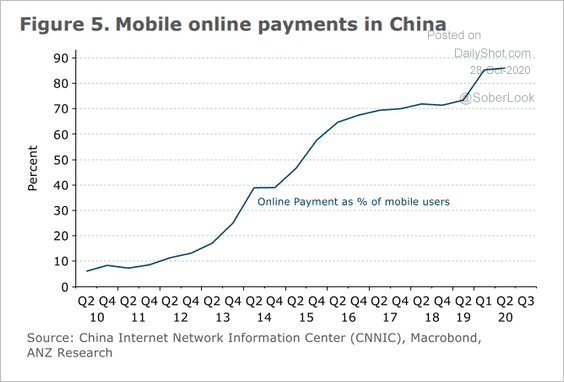 Source: ANZ Research
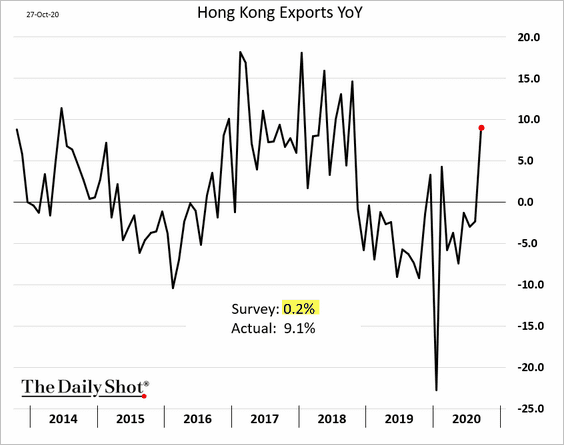
4. Hong Kong’s exports soared in September.
Emerging Markets
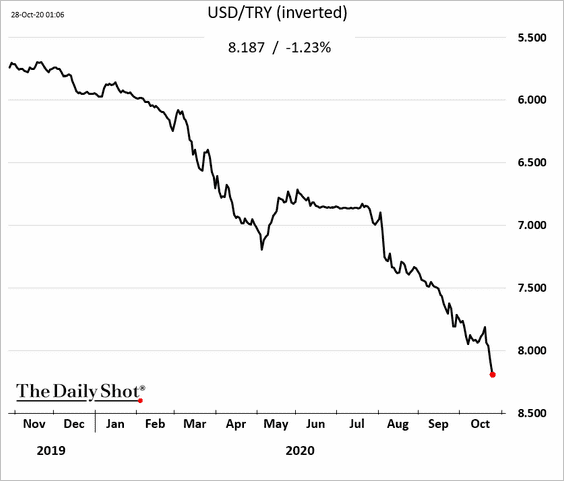
1. The Turkish lira continues to tumble.
2. Russia’s consumer spending has been slowing.
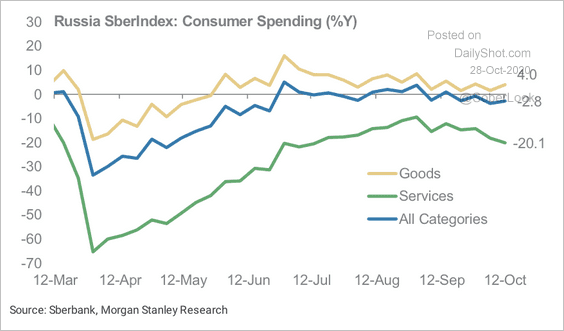 Source: Morgan Stanley Research
3. According to the World Economics SMI report, India’s business activity remains in contraction mode.
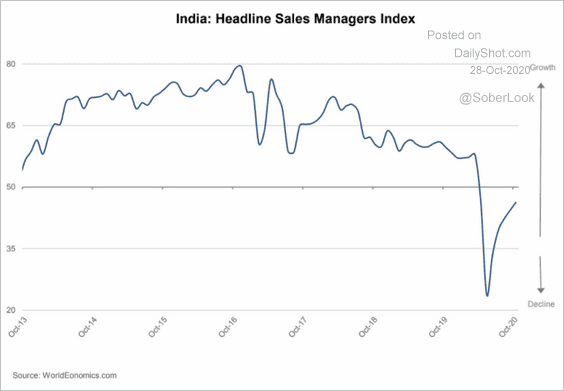 Source: World Economics
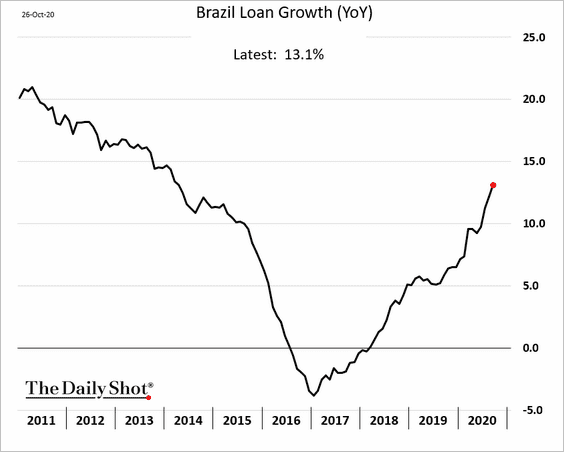
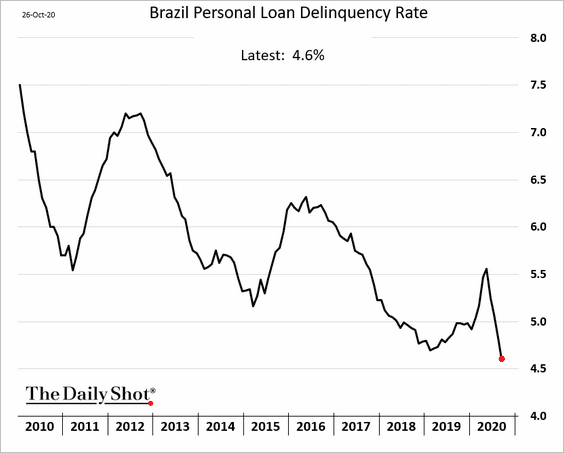
4. Next, we have some updates on Brazil.
• Loan growth:
• Consumer loan delinquencies:
• Government debt:
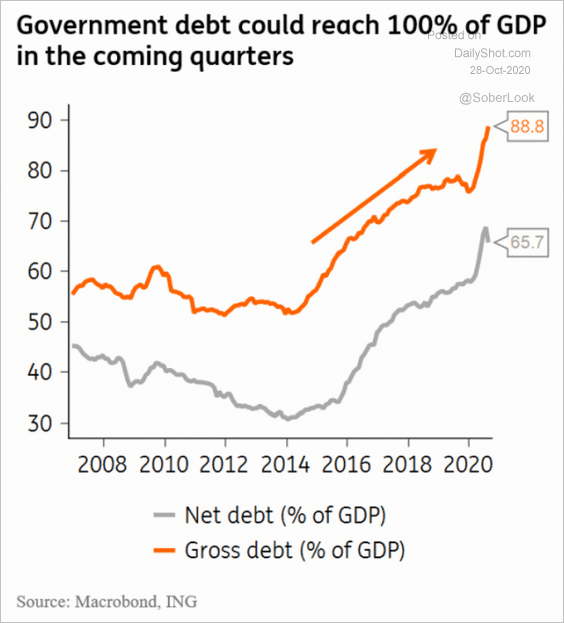 Source: ING
• Electricity consumption growth:
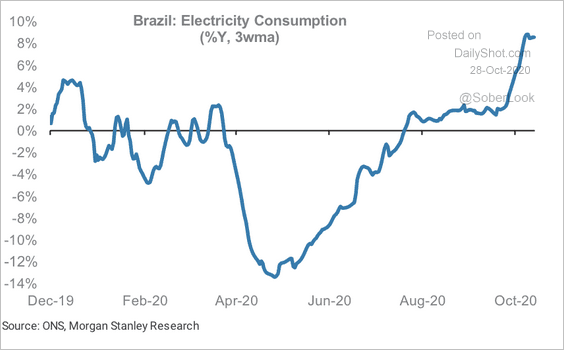 Source: Morgan Stanley Research
• Negative real rates:
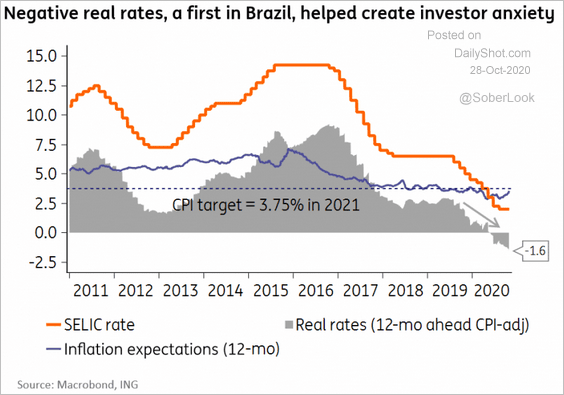 Source: ING
• Economic growth vs. peers:
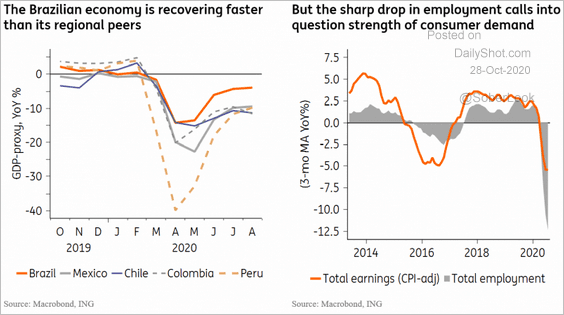 Source: ING
——————–
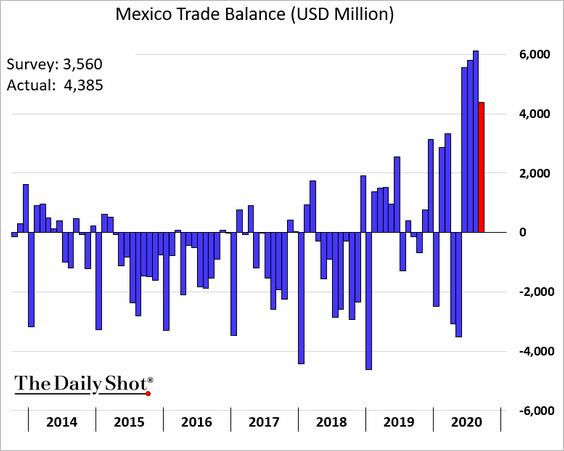
5. Mexico’s trade surplus continues to surprise to the upside.
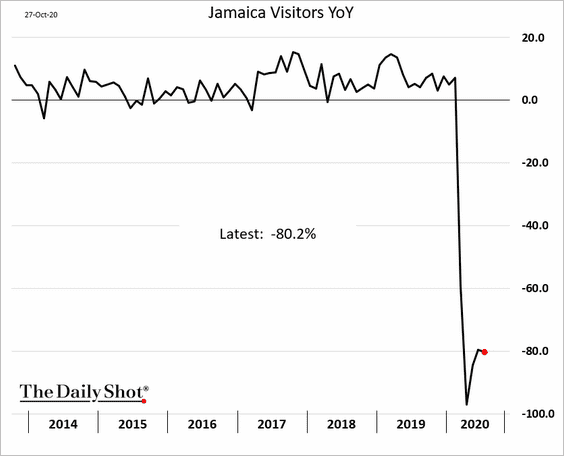
6. Finally, this chart shows visitors to Jamaica (vs. previous year).
Commodities
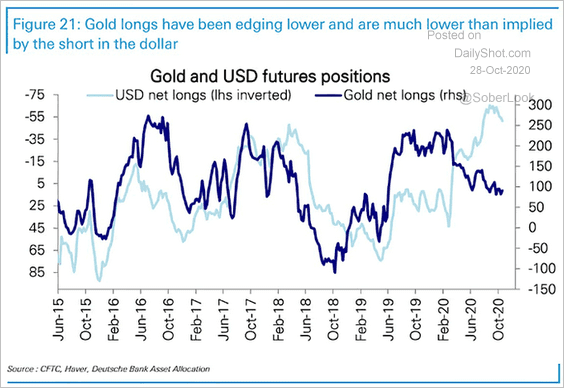
1. Gold and US dollar speculative positioning trends have diverged.
 Source: @ISABELNET_SA, @DeutscheBank
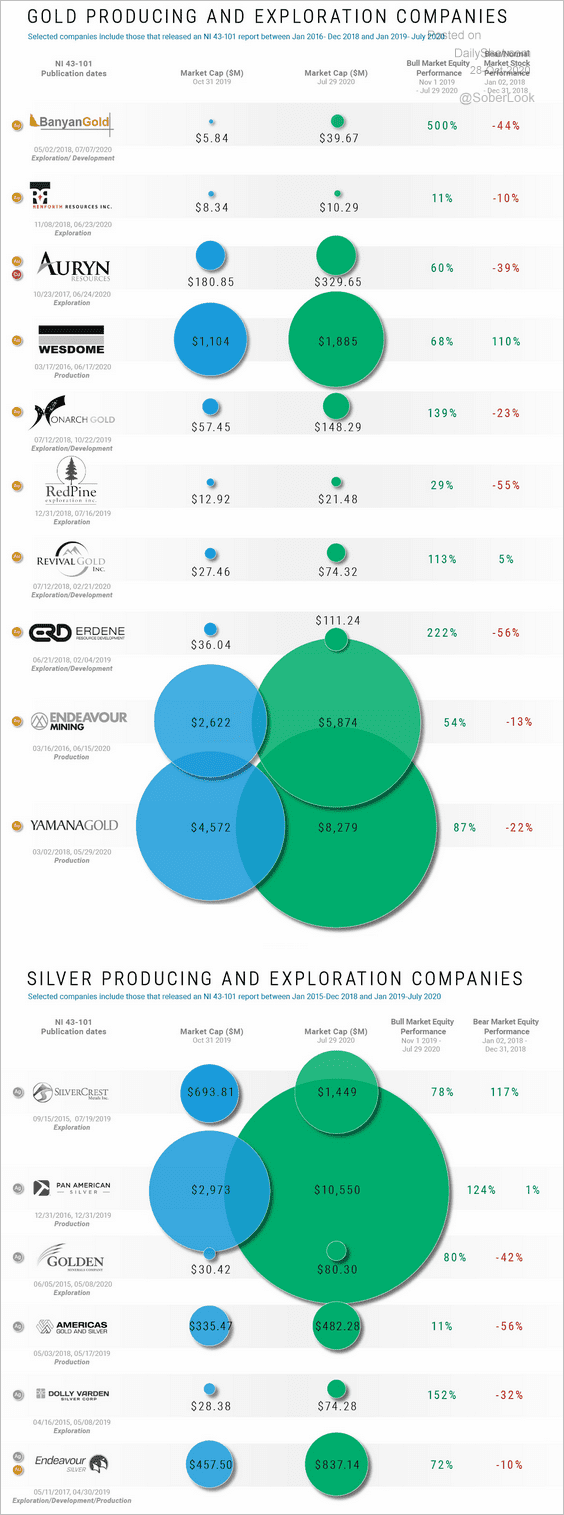
2. The graphic below shows gold and silver production and exploration companies.
 Source: Visual Capitalist Read full article
3. China’s rubber futures are soaring on concerns about supply/demand imbalance.

Energy
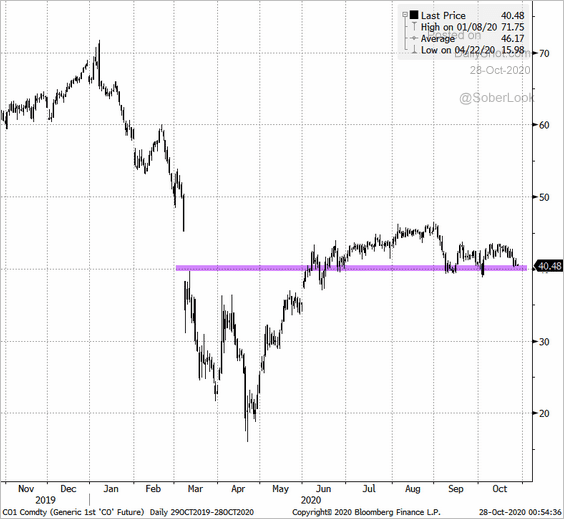
1. Will Brent crude hold the $40/bbl support?
 Source: @TheTerminal, Bloomberg Finance L.P.
 Source: @TheTerminal, Bloomberg Finance L.P.
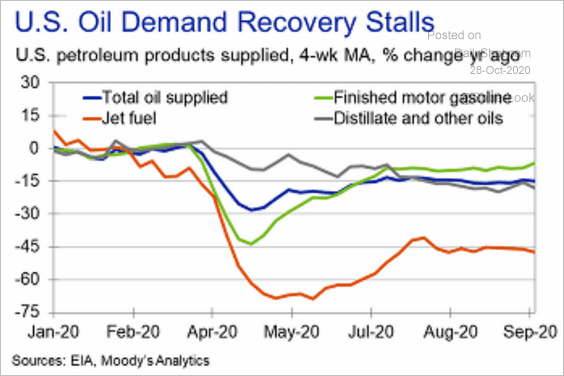
2. Oil demand recovery appears to have stalled.
 Source: Moody’s Analytics
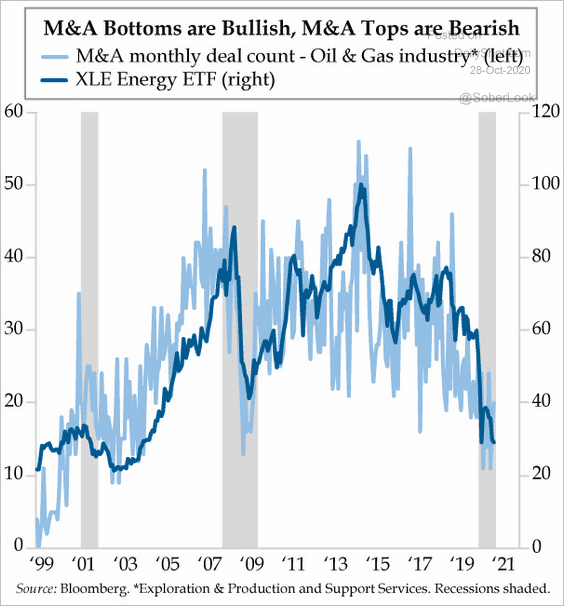
3. This chart shows Oil & Gas M&A activity vs. the XLE energy ETF price.
 Source: The Daily Feather
Equities
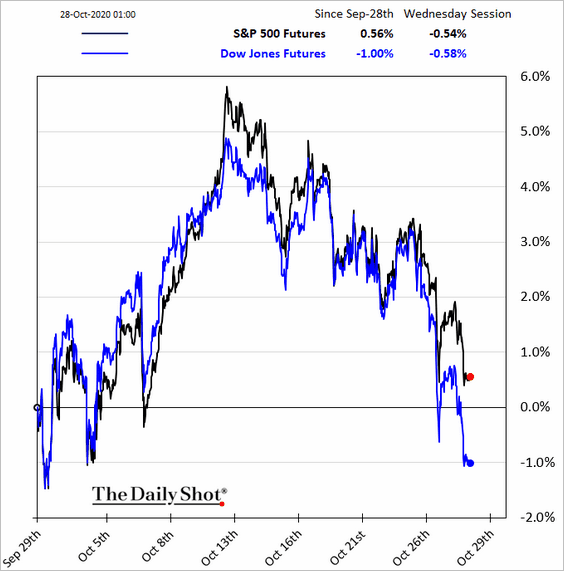
1. Stocks have been under some pressure, giving up most of the October gains.
2. Next, we have some sector updates.
• Drawdowns over the past three decades:
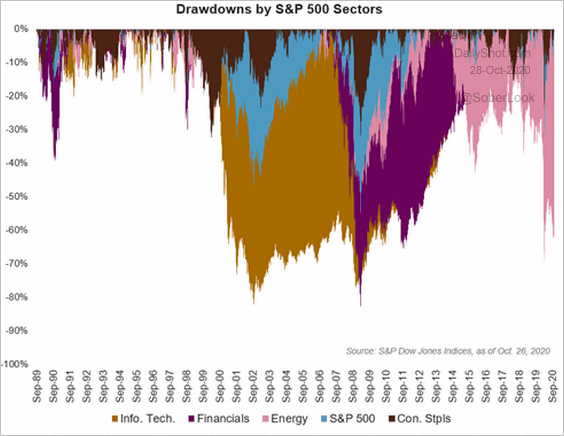 Source: S&P Global Market Intelligence
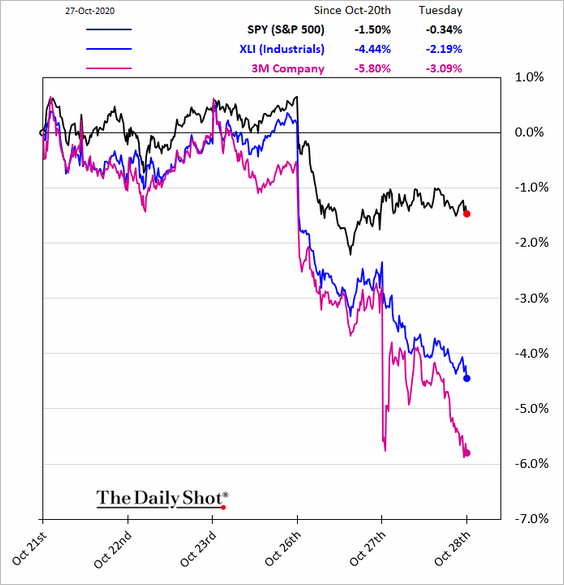
• Industrials:
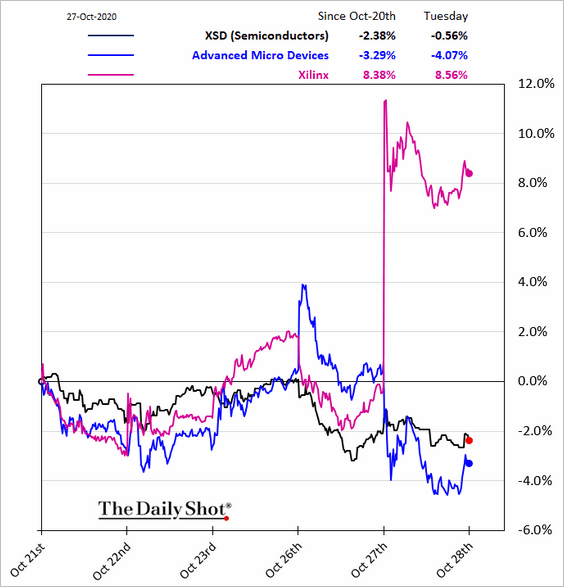
• Semiconductors:
• Invesco’s solar energy ETF options outstanding:
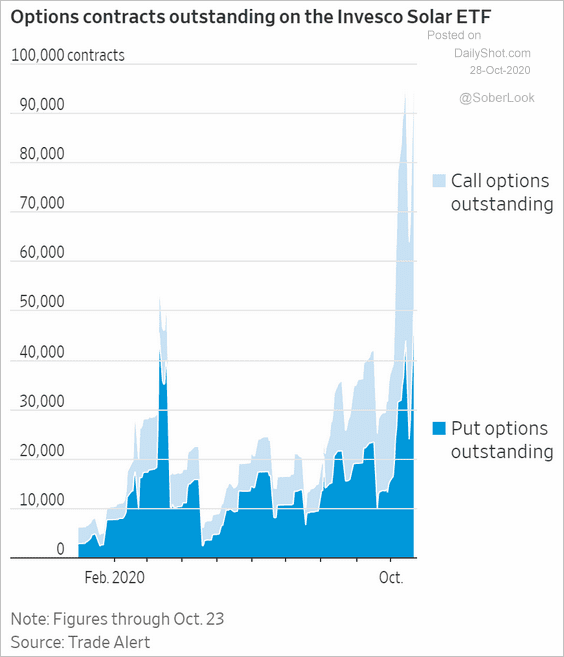 Source: @WSJ Read full article
——————–
3. Intangible assets now dominate S&P 500 corporate balance sheets.
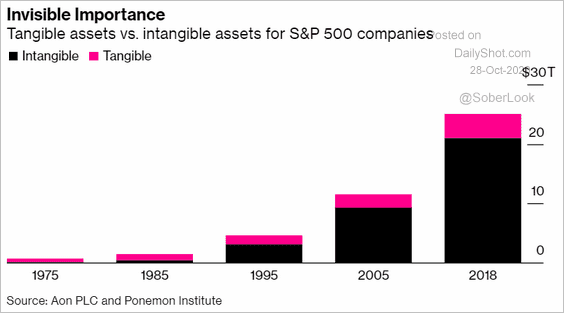 Source: @markets Read full article
4. A survey from Investopedia shows persistent expectations of a significant market drop within the next three months.
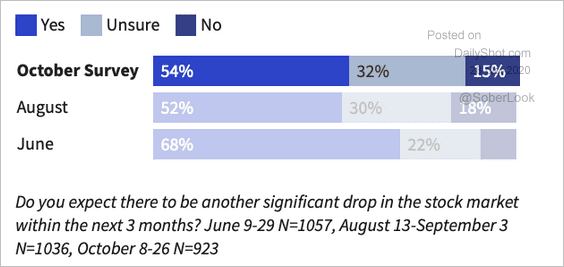 Source: Investopedia Read full article
5. Next, we have some updates on asset management.
• Low-fee ETF clones:
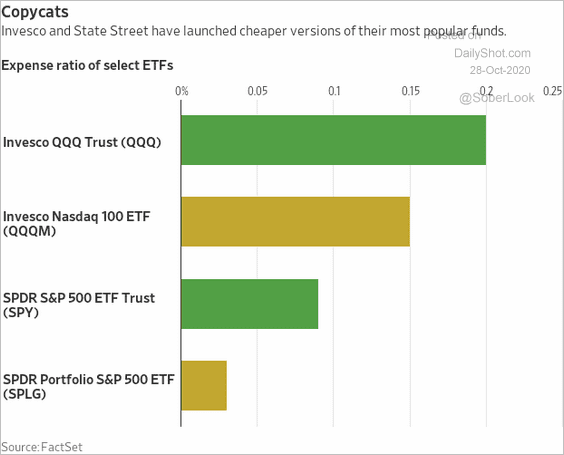 Source: @WSJ Read full article
• Domestic equity fund survival rates:
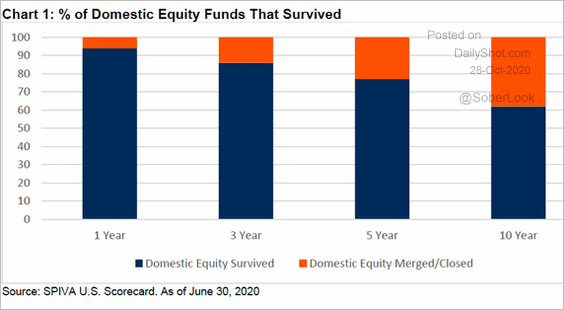 Source: @ToddCFRA
• Asset management deals:
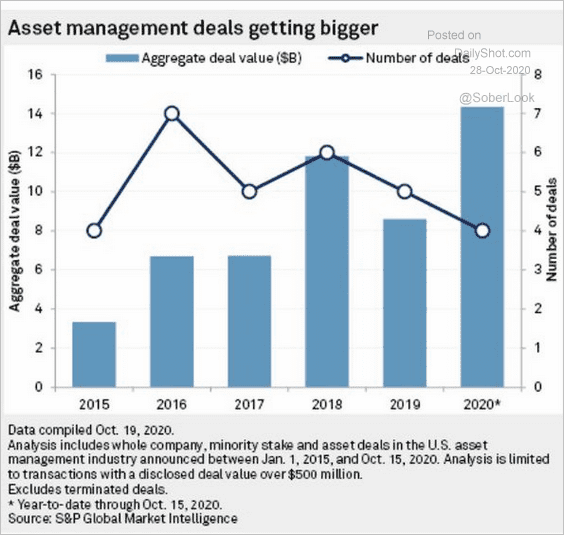 Source: @ToddCFRA, @cfraresearch, @SPGMarketIntel, @SPGlobal Read full article
Rates
1. How much coupon debt (Treasury noted and bonds) will the government be able to issue over the next couple of years?
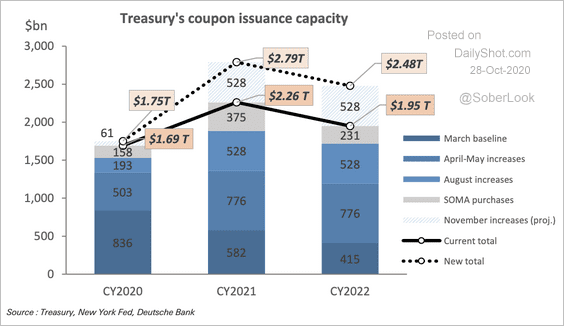 Source: Deutsche Bank Research
2. Nominal Treasury yields have decoupled from breakevens this year
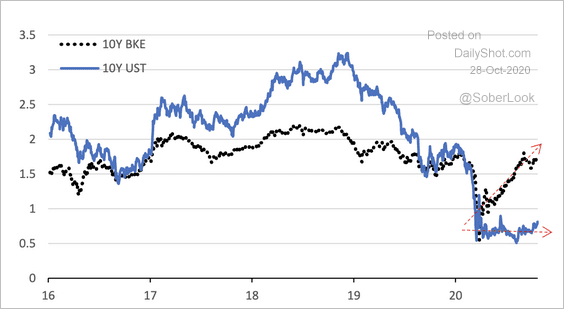 Source: Deutsche Bank Research
3. The iShares TIPS ETF (TIP) has bottomed relative to the iShares 20+ year Treasury bond ETF (TLT).
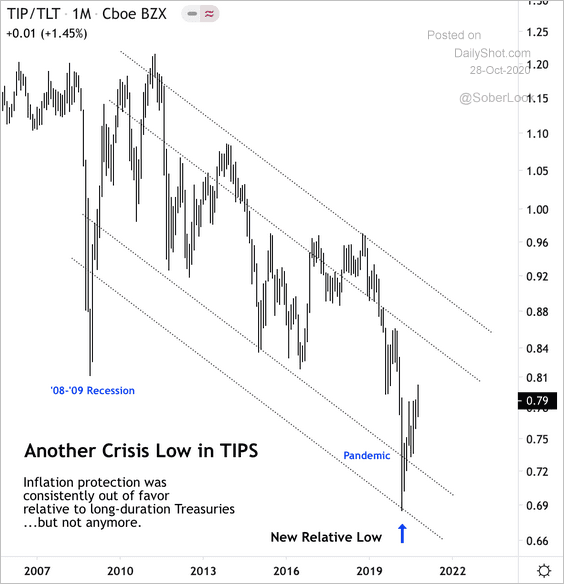 Source: @DantesOutlook
Food for Thought
1. Background checks to purchase firearms:
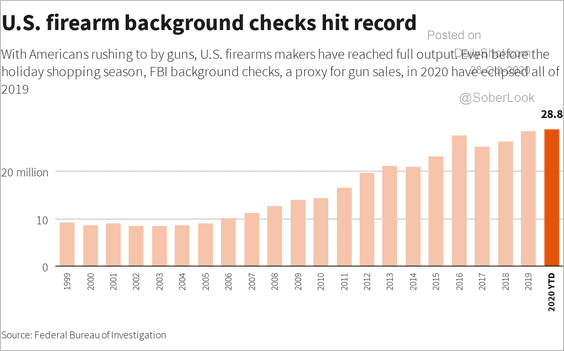 Source: Reuters Read full article
2. Early voting:
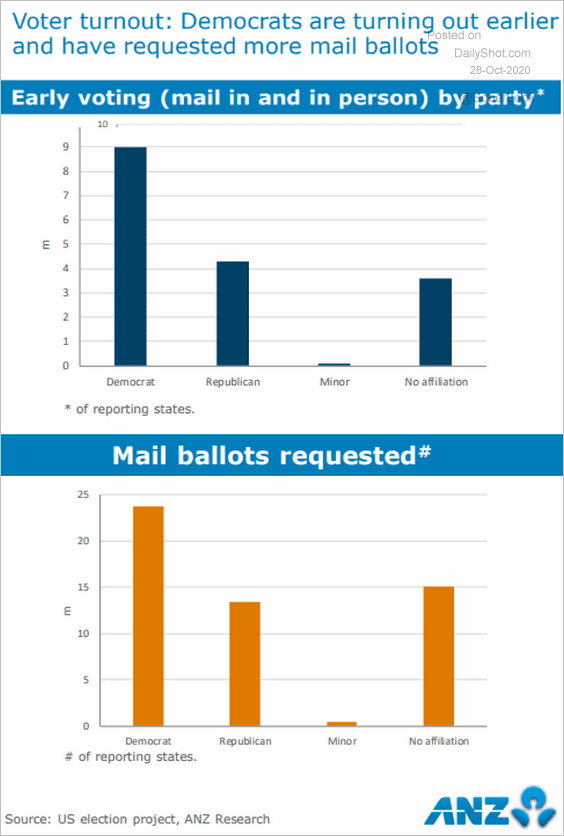 Source: Morning Consult Read full article
3. Concerns about media bias:
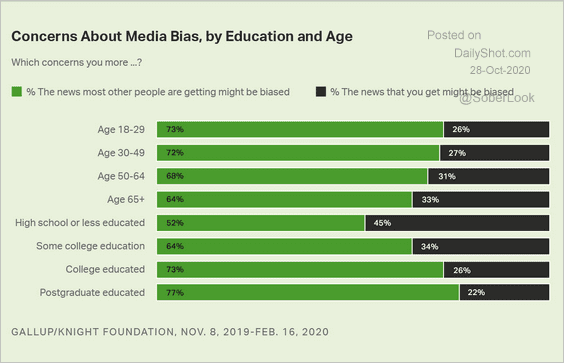 Source: Gallup Read full article
4. Top election concerns:
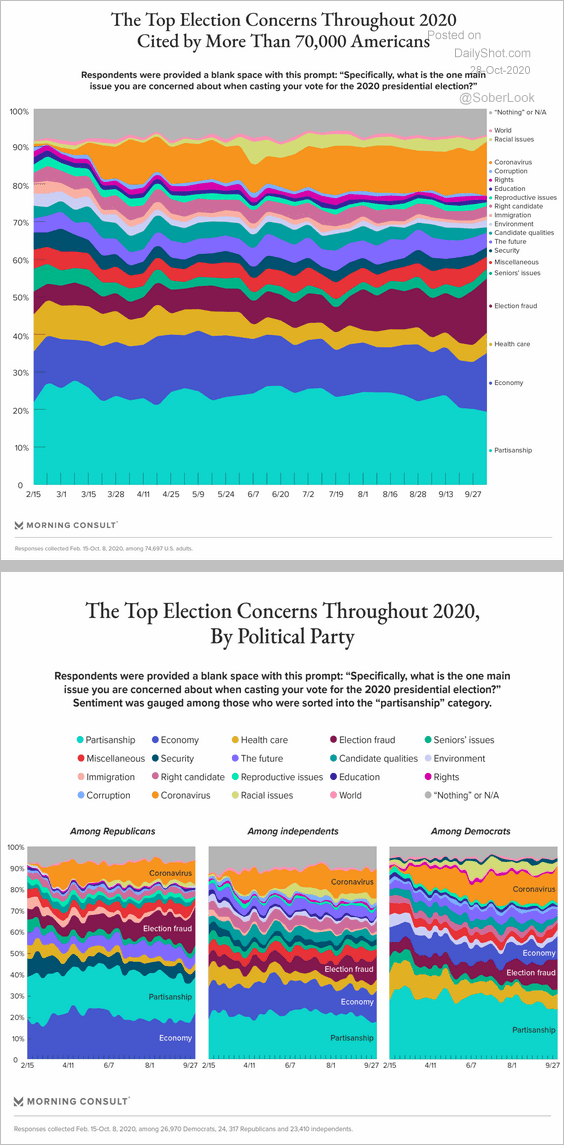 Source: Morning Consult Read full article
5. Election spending:
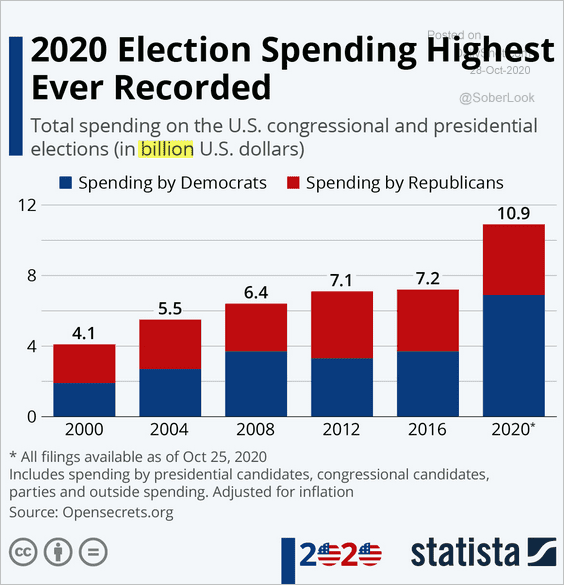 Source: Statista
6. Wind power in Texas:
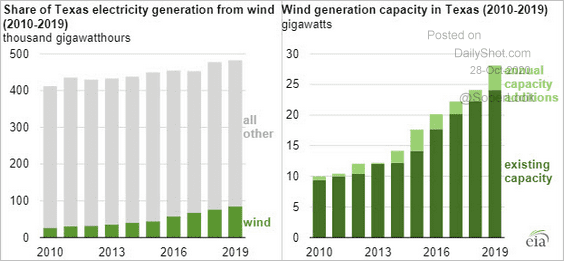 Source: EIA Read full article
7. The ozone hole over Antarctica:
 Source: @wef Read full article
8. COVID-related hospitalizations:
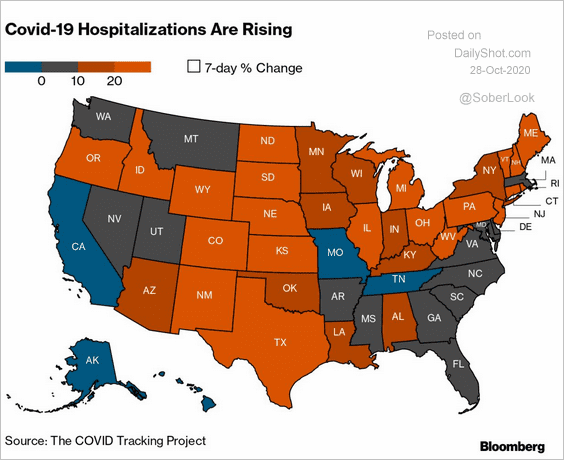 Source: @bpolitics Read full article
9. This year’s shift in supermarket shopping behavior:
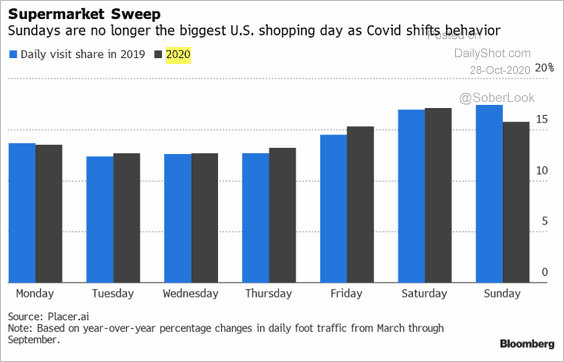 Source: @A_Riley17, Bloomberg Finance L.P.
——————–