
The Daily Shot: 02-Nov-20
• The United States
• Canada
• The Eurozone
• Europe
• Asia – Pacific
• China
• Emerging Markets
• Cryptocurrency
• Commodities
• Energy
• Equities
• Rates
• Food for Thought
The United States
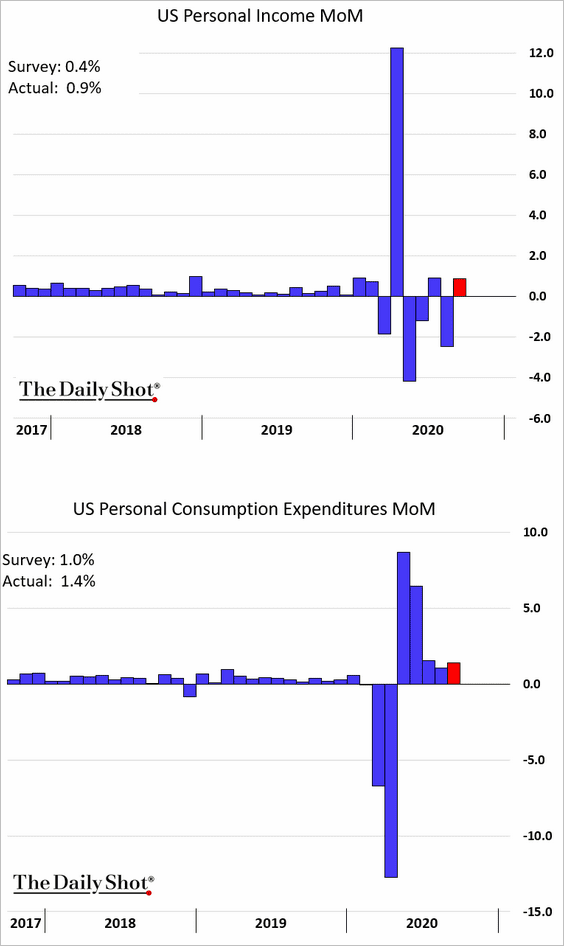
1. Personal income and spending in September topped economists’ expectations.
This chart shows the evolution of consumer spending since February.
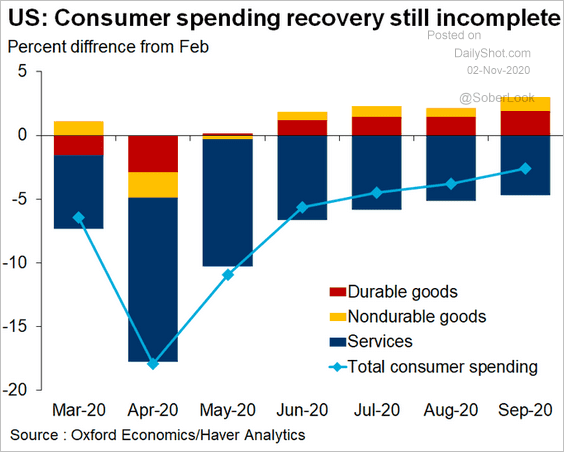 Source: @GregDaco
——————–
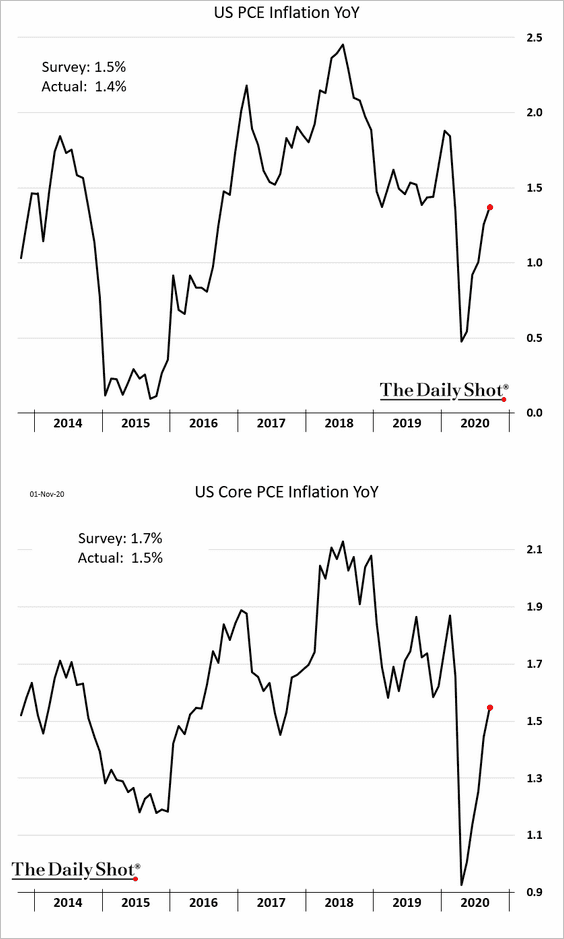
2. Inflation continues to recover, but the latest PCE price report was below consensus estimates.
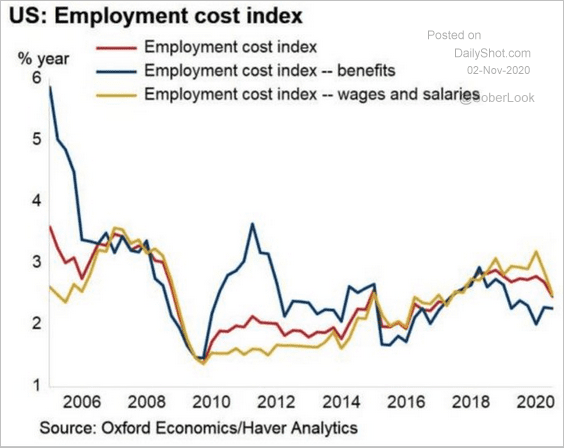
3. The employment cost index growth was stable last quarter (well below the recent highs).
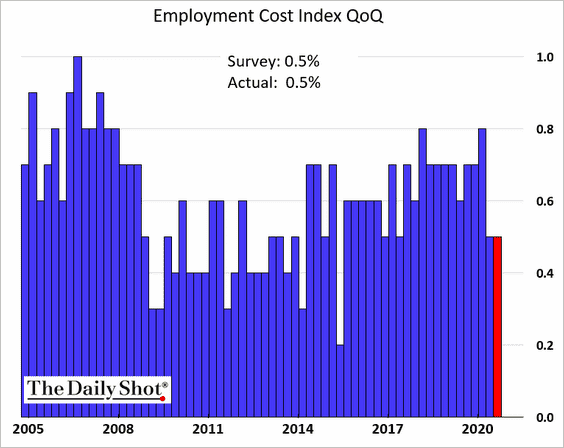
Here is the year-over-year chart.
 Source: @GregDaco
——————–
4. The NMI Chicago business activity index surprised to the upside.
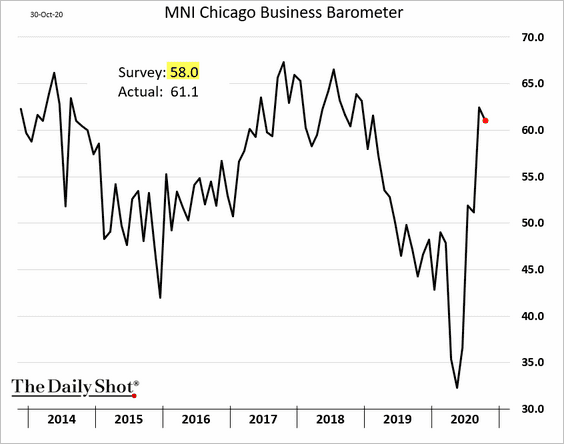
The above result, combined with the regional Fed surveys, points to a robust ISM manufacturing report (at the national level).
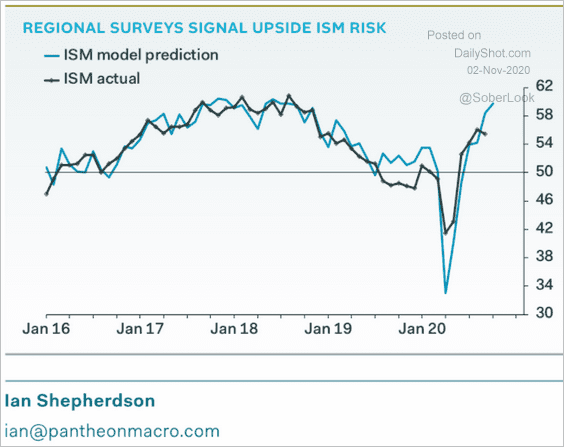 Source: Pantheon Macroeconomics
——————–
5. According to BCA Research, the US needs another $1.5 trillion in government stimulus just to maintain a neutral “fiscal thrust.”
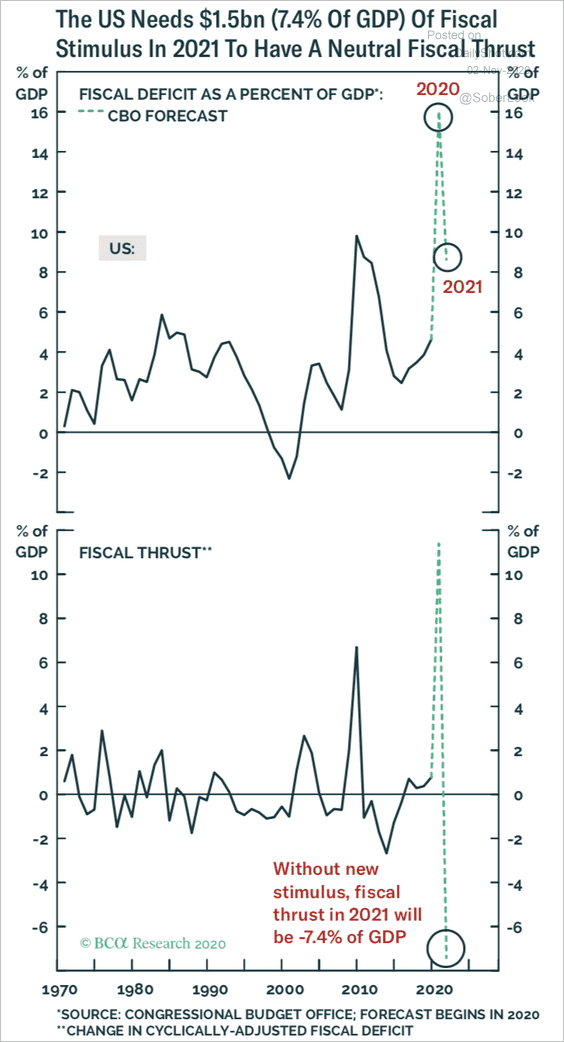 Source: BCA Research
Here is what we could expect from a Biden/Democratic “clean sweep,” according to Morningstar.
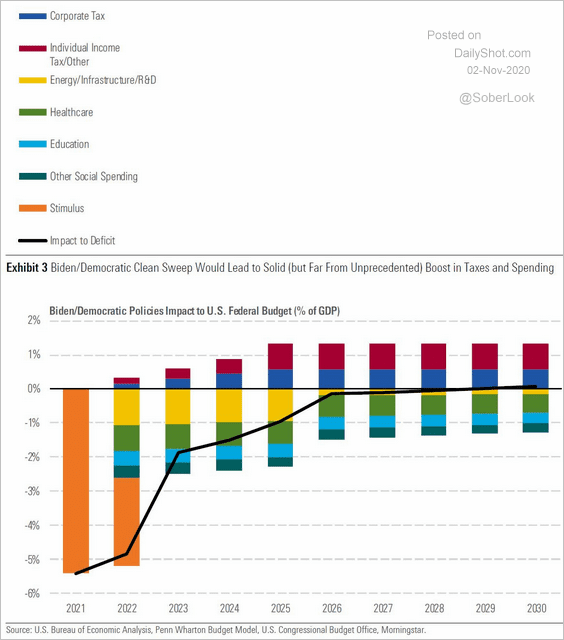 Source: Morningstar
According to Bridgewater, we will see more focus on direct government spending.
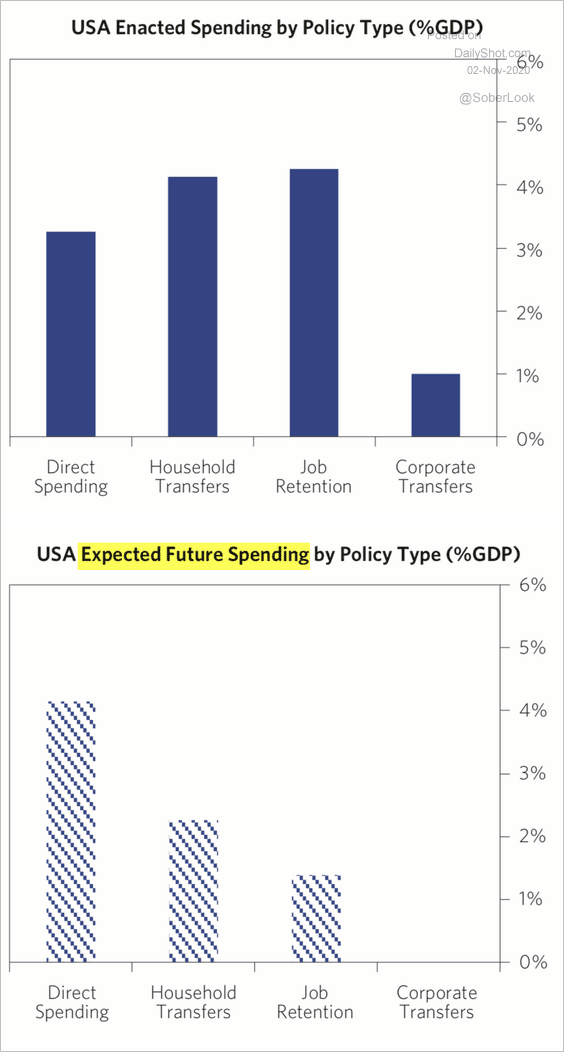 Source: Bridgewater Associates
——————–
6. The Homebase small business data point to some deterioration in recent weeks amid the latest spike in infections.
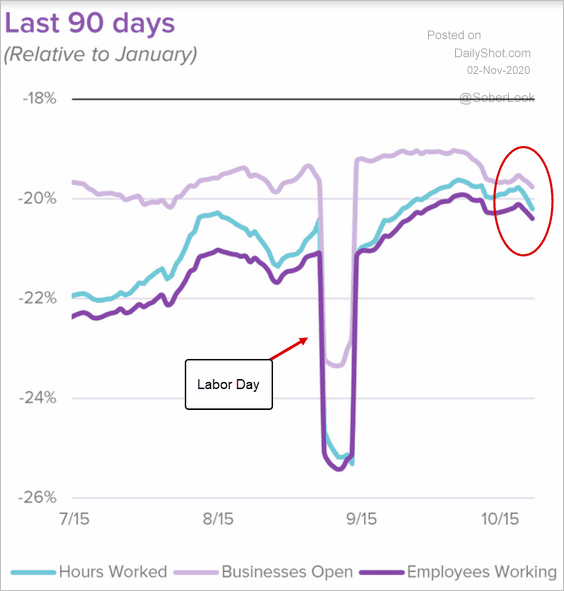 Source: Homebase
Here is the Dallas Fed’s Mobility and Engagement Index (MEI) vs. new COVID cases.
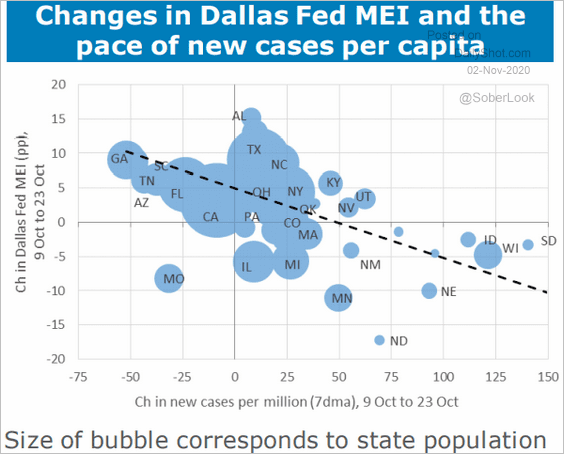 Source: ANZ Research
And this chart shows ANZ’s activity tracker.
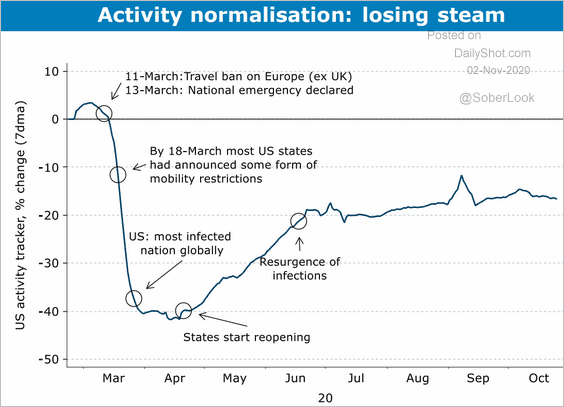 Source: ANZ Research
——————–
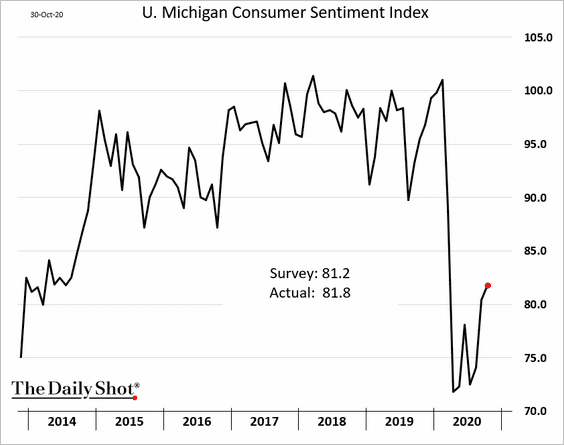
7. The updated U. Michigan consumer sentiment index showed improvement.
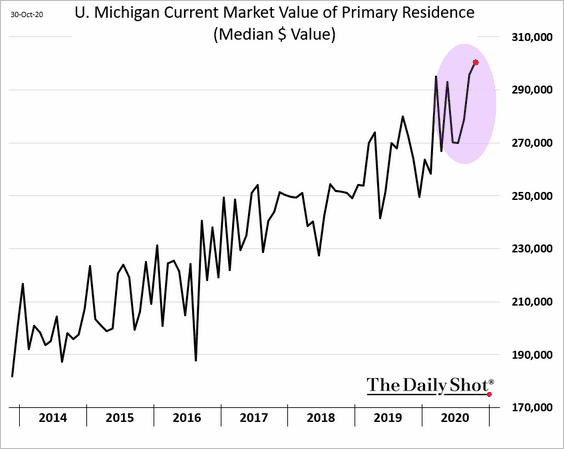
The housing market has been supporting consumer confidence in recent months.
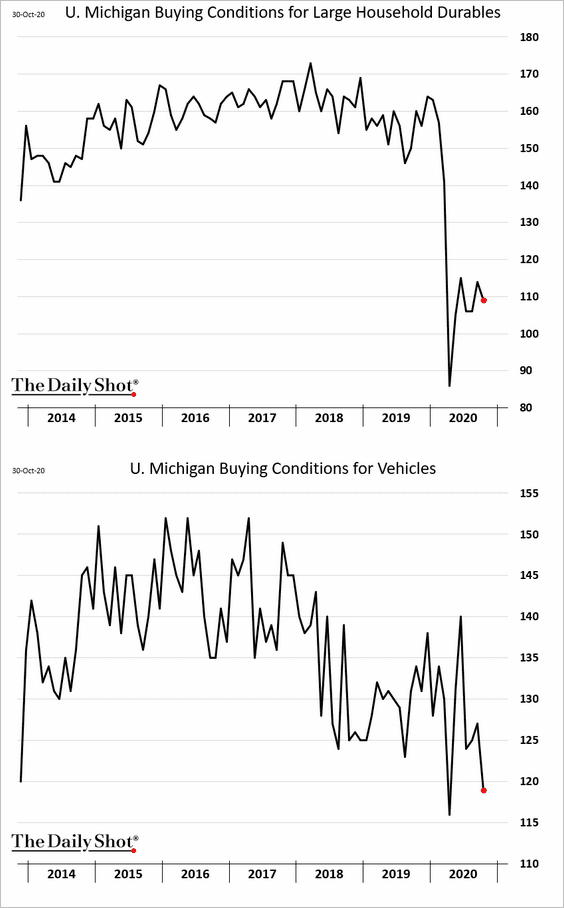
It’s not clear if the rebound will translate into further gains in spending. Here is the buying conditions index for large household durables.
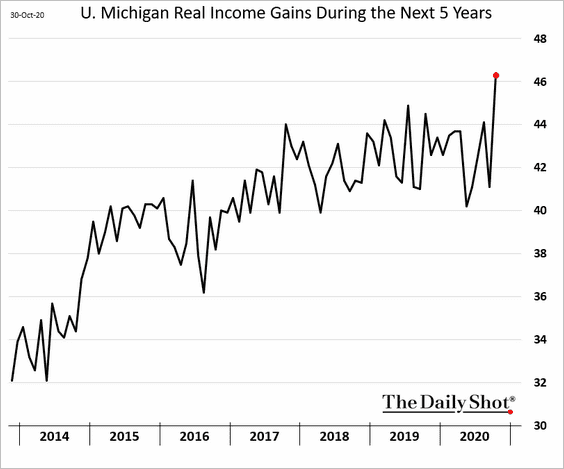
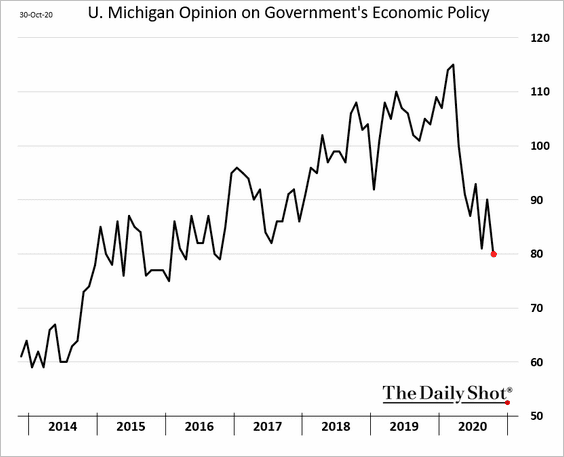
Below are some additional trends from the U. Michigan report.
• Income expectations five years out are soaring.
• Views on the government’s economic policy continue to deteriorate.
• Democrats’ and Republicans’ consumer expectations have diverged sharply over the past couple of months.
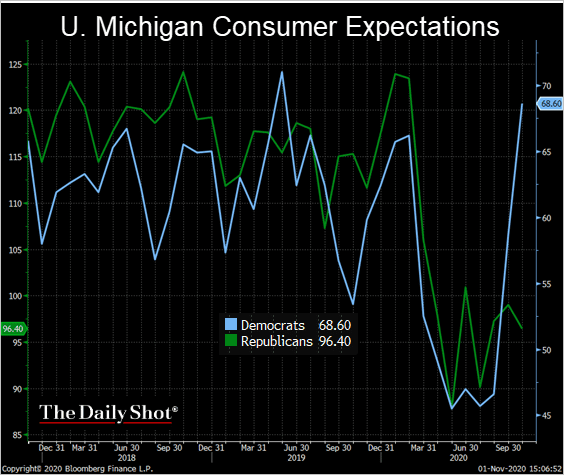 Source: @TheTerminal, Bloomberg Finance L.P.
——————–
8. Americans who had been laid off or furloughed during the pandemic were the most likely to make an impulse purchase.
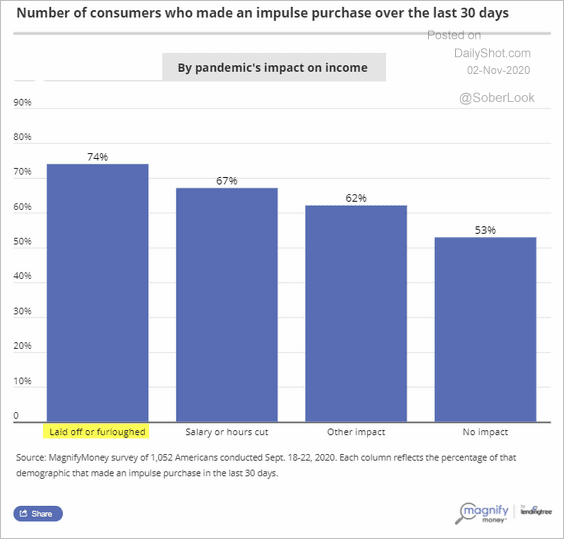 Source: MagnifyMoney
Below are some additional results on impulse buying during the pandemic (from MagnifyMoney).
• Reasons for impulse buys:
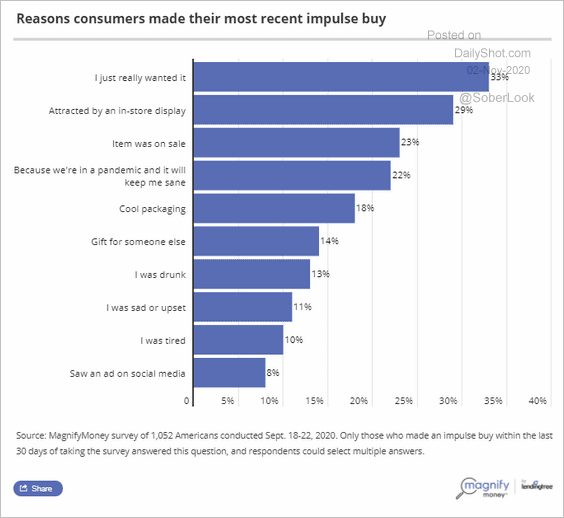 Source: MagnifyMoney
• Most common products:
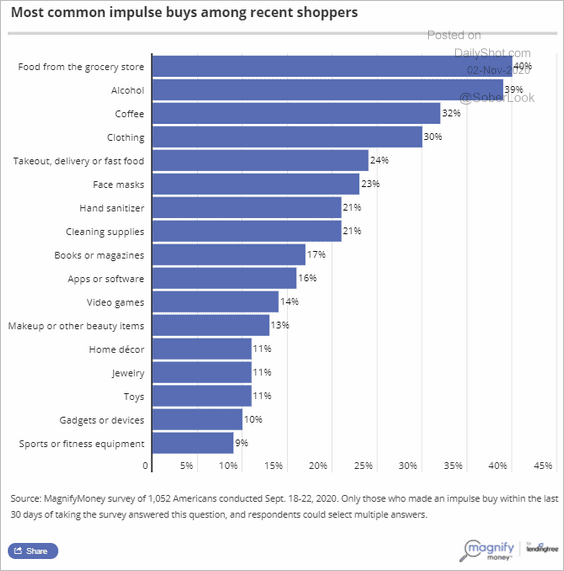 Source: MagnifyMoney
• By generation:
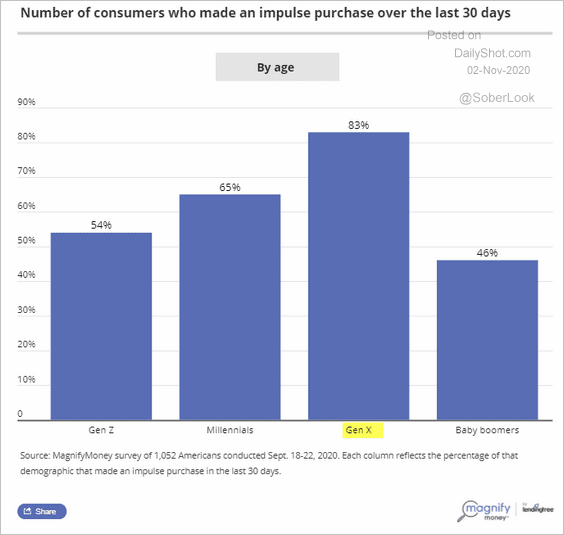 Source: MagnifyMoney
• By gender:
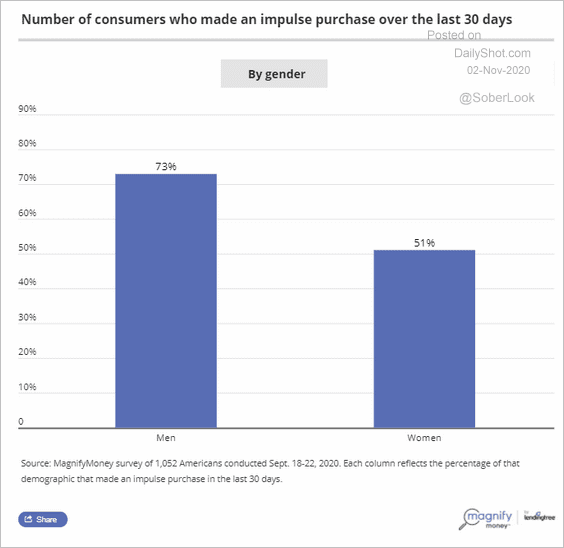 Source: MagnifyMoney
Canada
1. The economy continued to recover in August.

2. What’s limiting growth for Canada’s small and medium-sized firms?
 Source: Hugo Ste-Marie, Portfolio & Quantitative Strategy Global Equity Research, Scotia Capital
3. Here is Canada’s October stock market performance by sector.
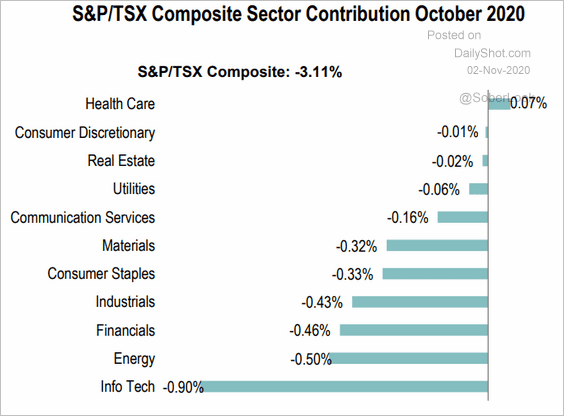 Source: S&P Global Market Intelligence
The Eurozone
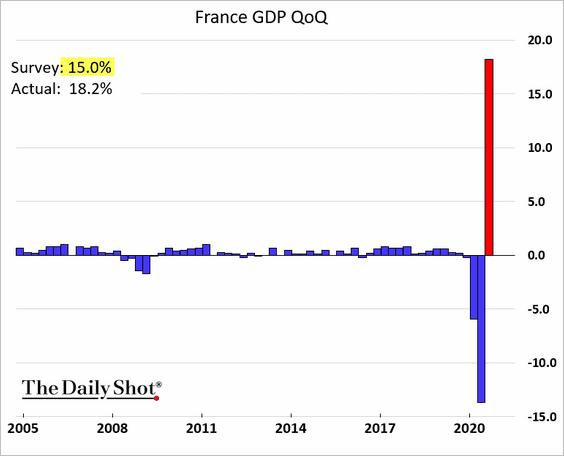
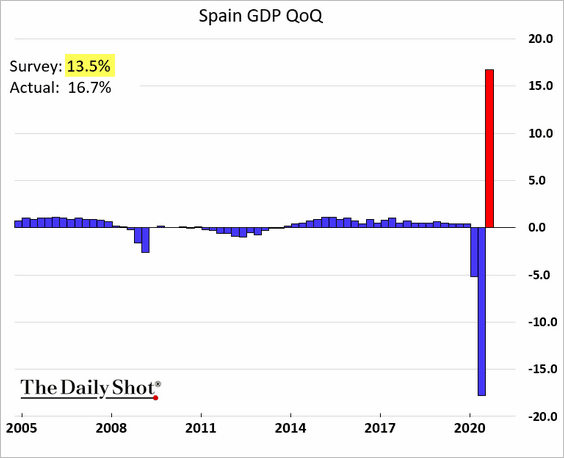
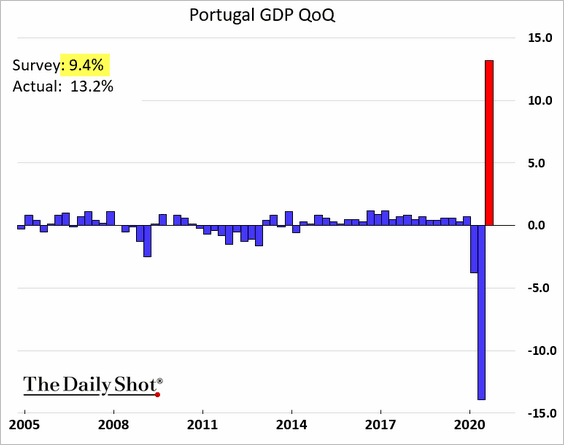
1. The Q3 GDP rebound surprised to the upside.
• France:
• Spain:
• Portugal:
• The Eurozone:
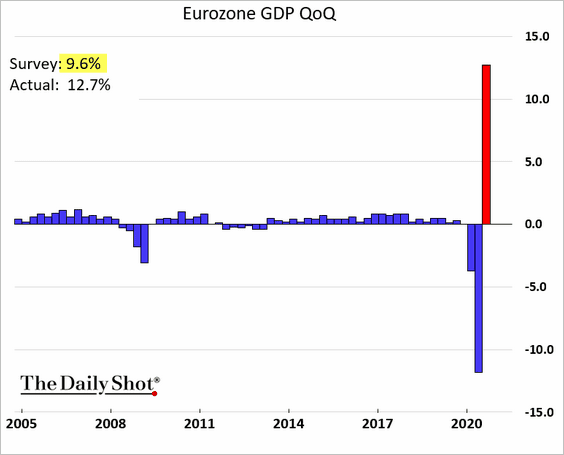
But with the new round of lockdowns, economists now expect a “double-dip” recession (2 charts).
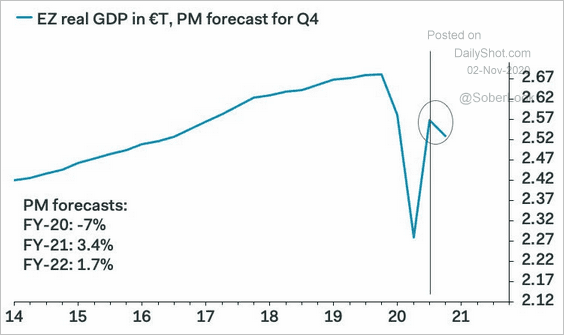 Source: Pantheon Macroeconomics
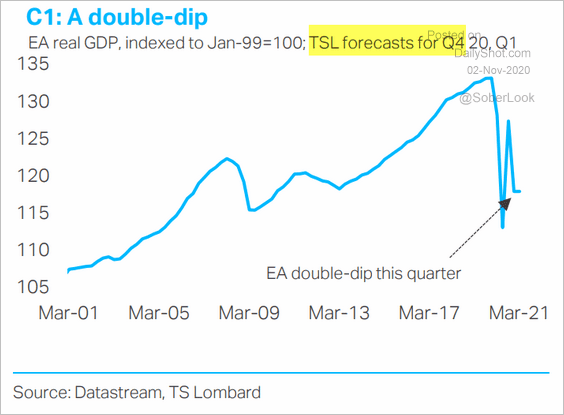 Source: TS Lombard
——————–
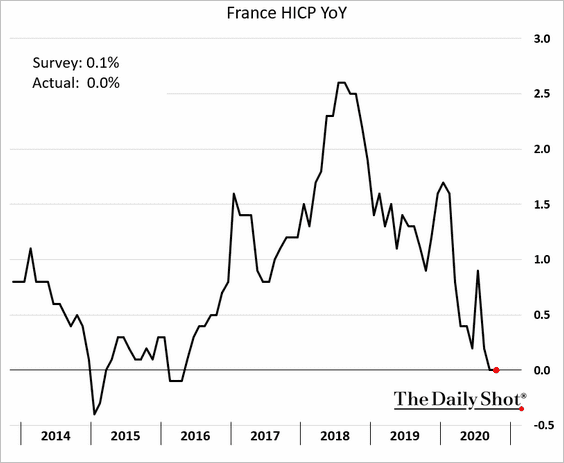
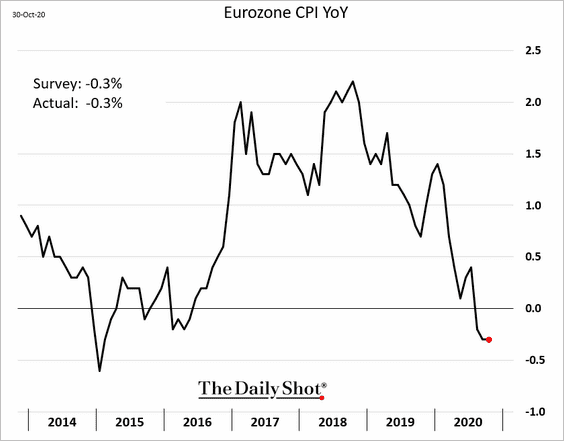
2. Euro-area consumer inflation remains weak.
• France:
• Italy:
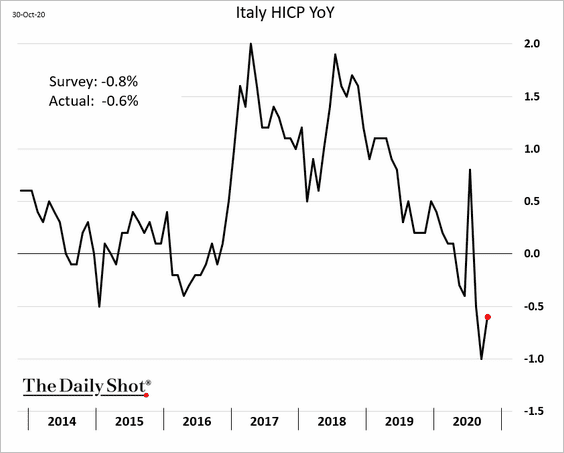
• Eurozone:
——————–
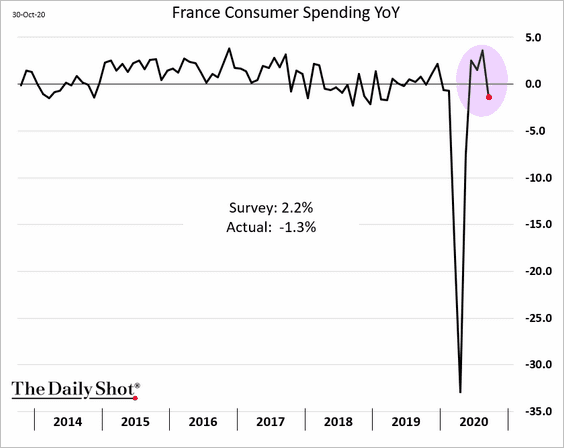
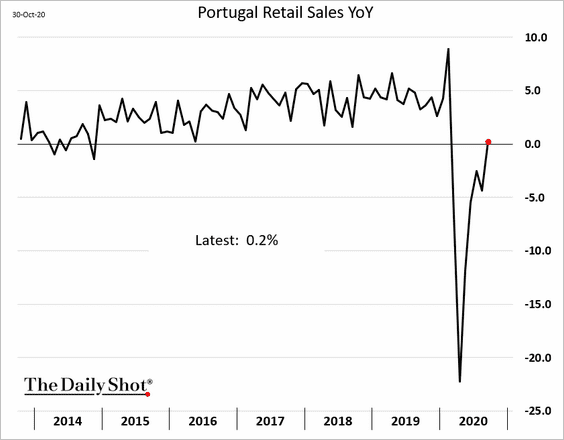
3. French consumer spending deteriorated in September.
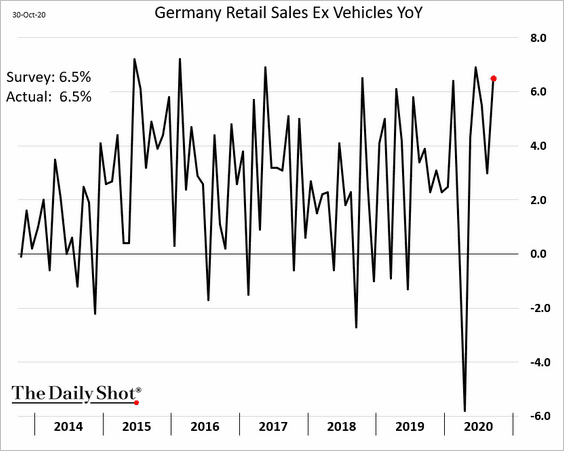
Retail sales in Germany and Portugal strengthened.
Europe
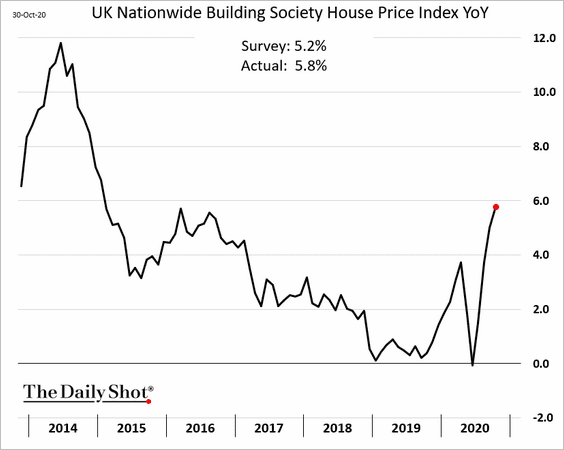
1. UK home price gains have accelerated.
2. Here is the stock market performance in October.
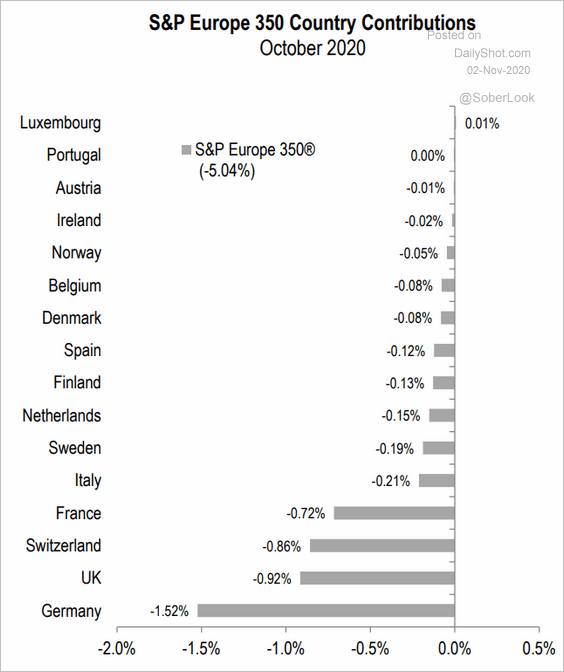 Source: S&P Global Market Intelligence
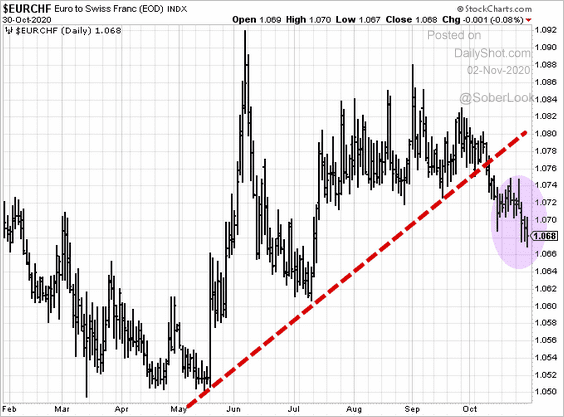
3. The euro has been declining against the Swiss franc as the pandemic worsens.
Asia – Pacific
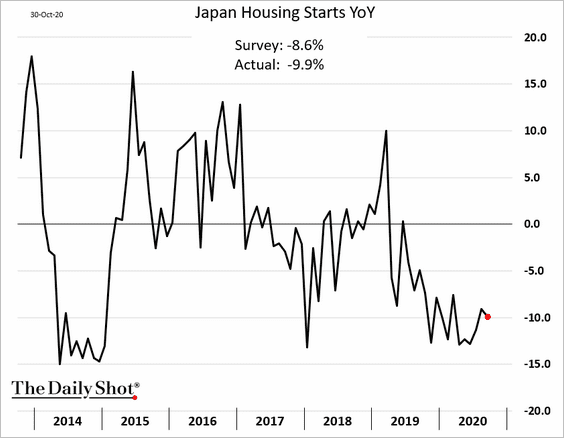
1. Japan’s housing starts remain soft.
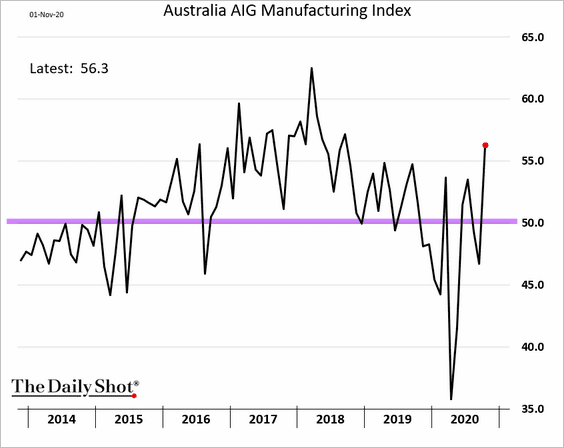
2. Asia-Pacific manufacturing activity continued to expand in October.
• South Korea PMI:
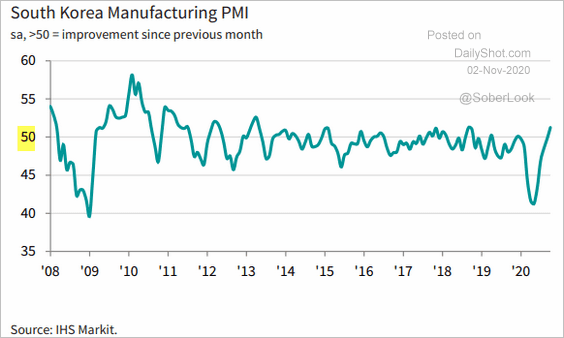 Source: IHS Markit
• Taiwan PMI:
 Source: IHS Markit
• Australia AIG manufacturing index:
——————–
3. Next, we have some updates on Australia.
• Mortgage lending for owner-occupied properties:

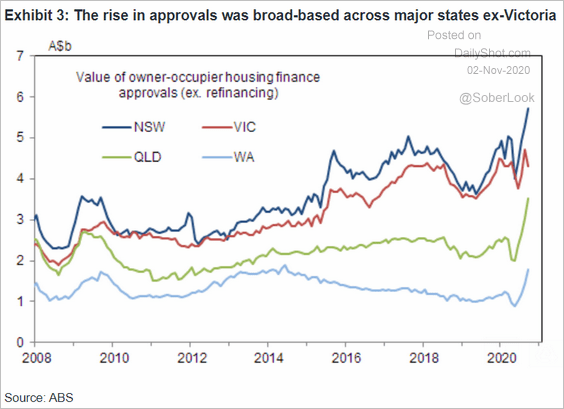 Source: Goldman Sachs
• First-time homebuyers:
 Source: @JFosterFM
• Building approvals for private-sector housing:
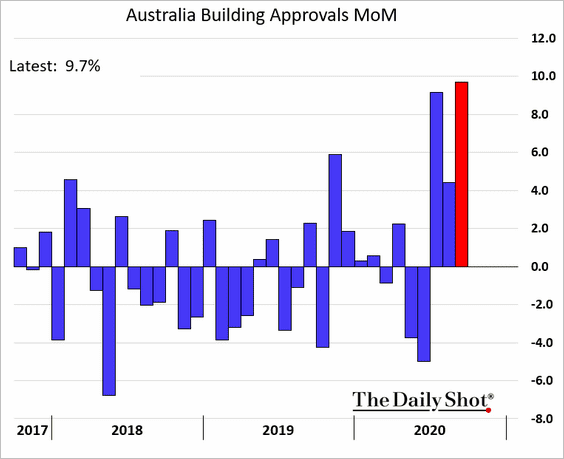
 Source: Goldman Sachs
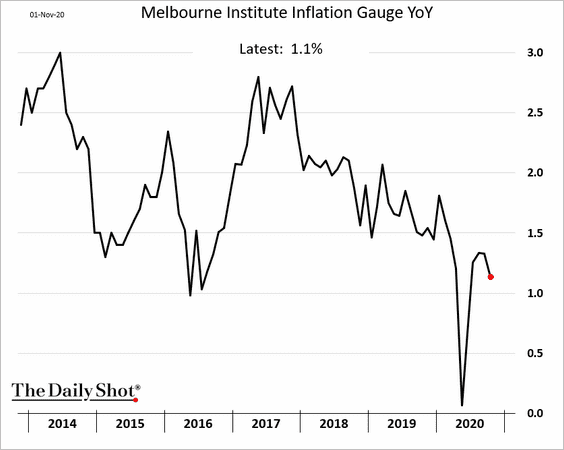
• Inflation indicator:
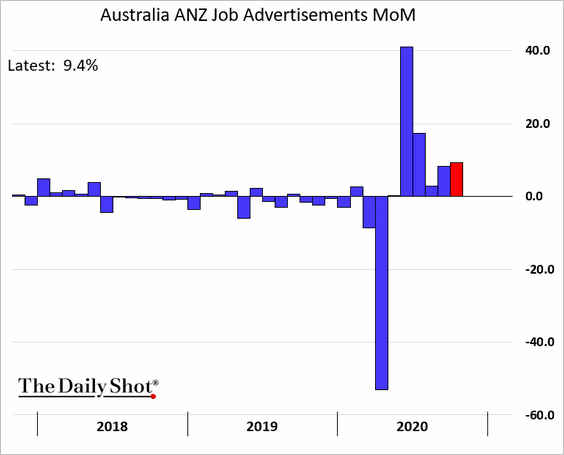
• Job openings:
• The Aussie dollar (at support):

• Australian and New Zealand stock market performance in October:
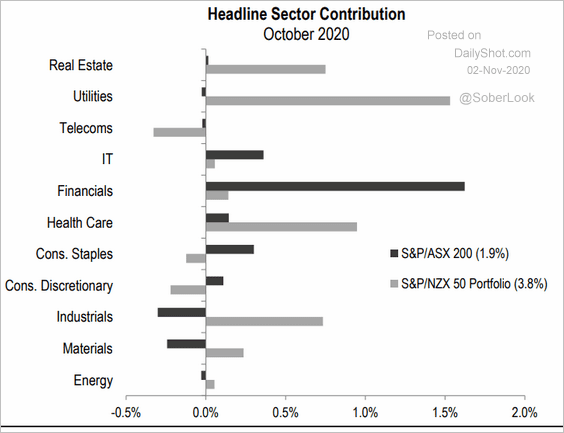 Source: S&P Global Market Intelligence
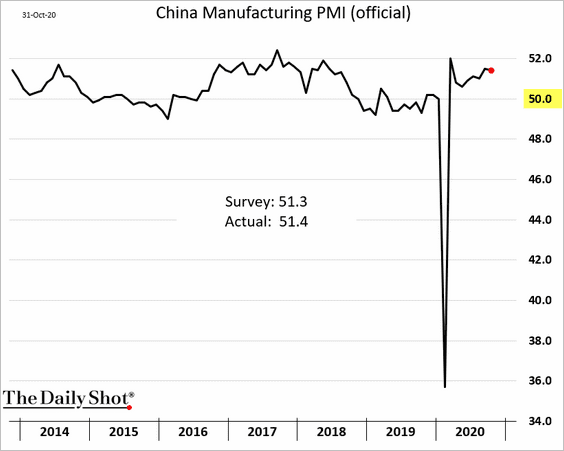
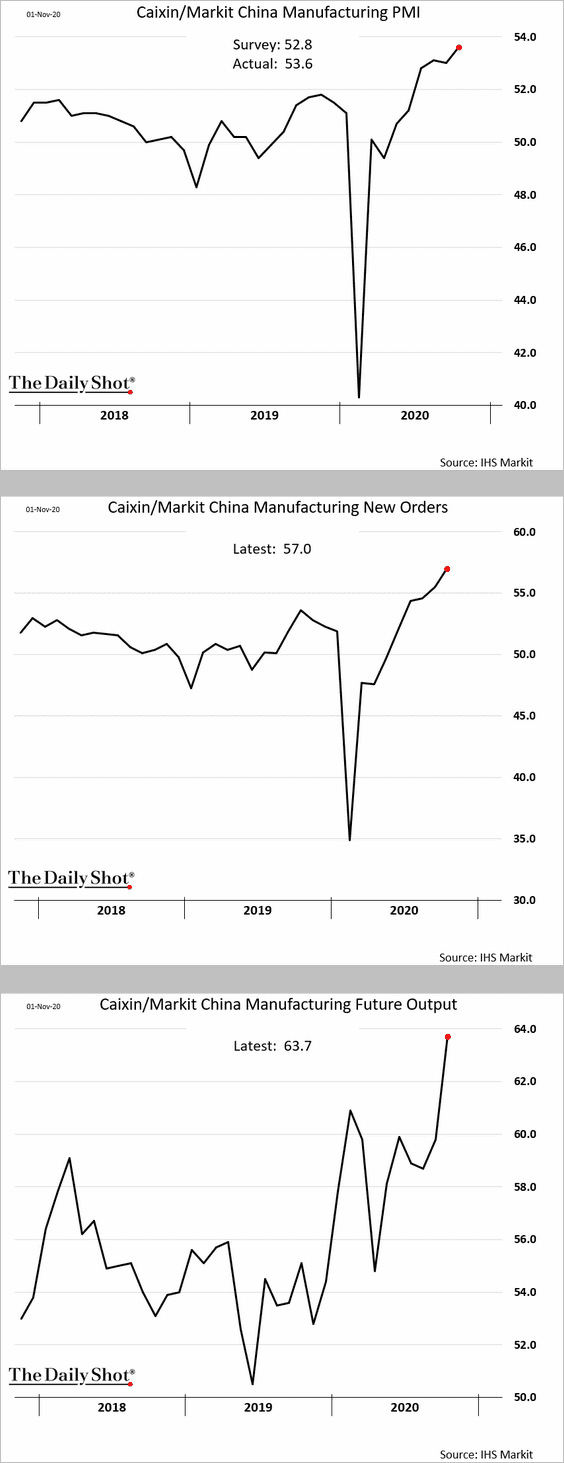
China
1. Business activity remained robust last month. Here is the manufacturing PMI (4 charts):
——————–
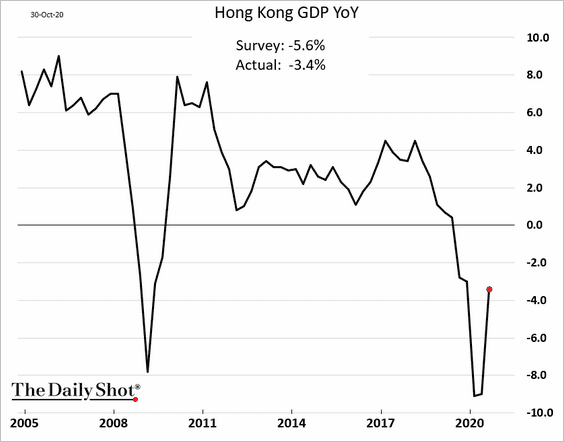
2. Hong Kong’s GDP continues to recover.
Emerging Markets
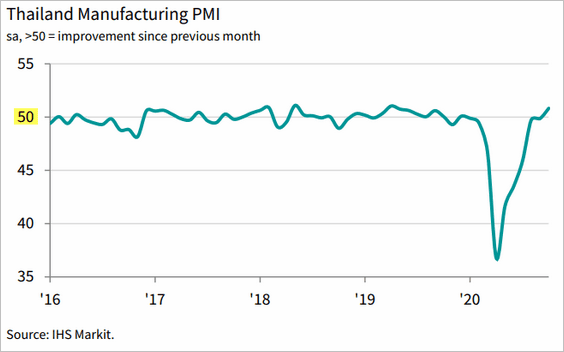
1. Let’s take a look at the latest Asian manufacturing PMI charts.
• Performing well:
– India:
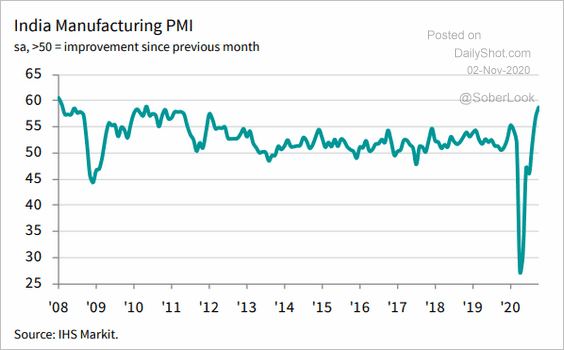 Source: IHS Markit Read full article
– Thailand:
– Vietnam:
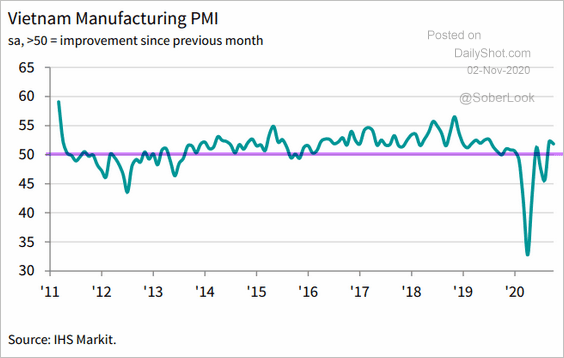 Source: IHS Markit
• Struggling:
– Malaysia:
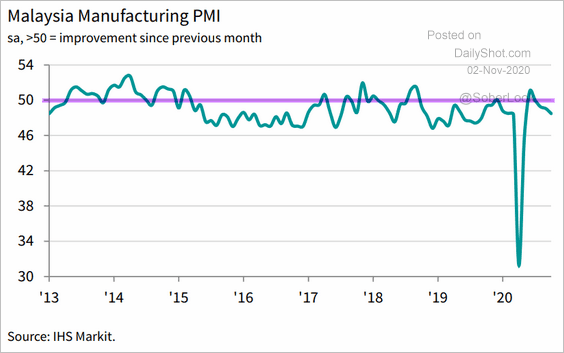 Source: IHS Markit
– Indonesia:
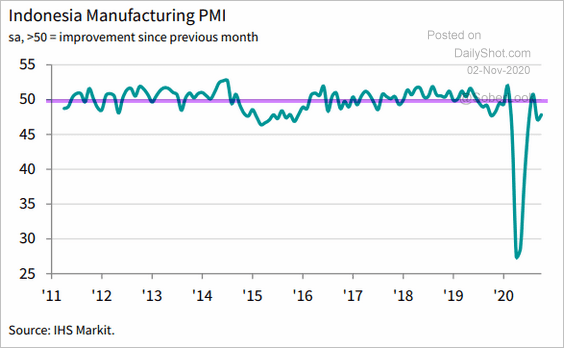 Source: IHS Markit
——————–
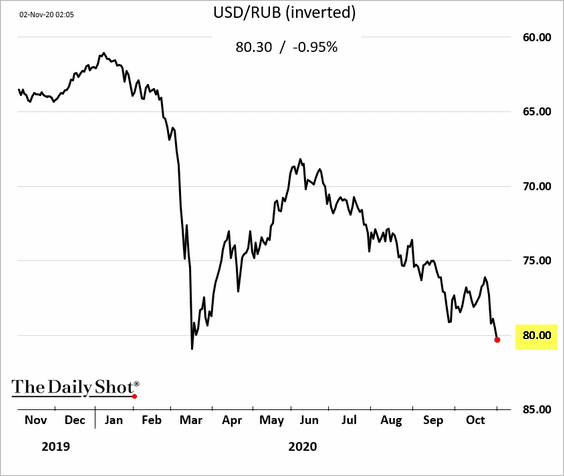
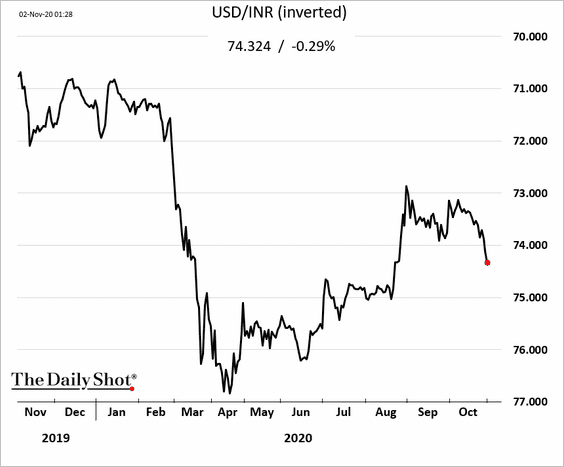
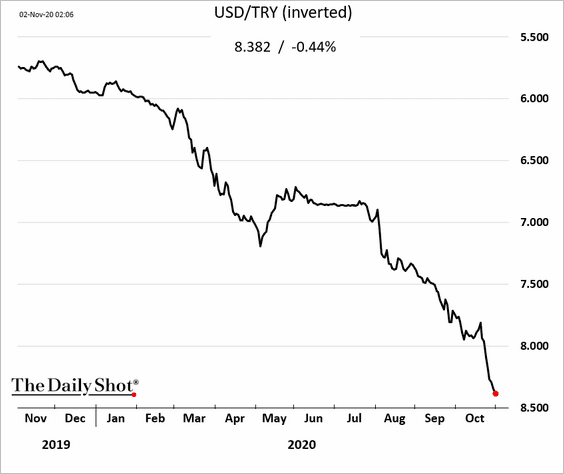
2. Some EM currencies are under pressure.
• The ruble (weak oil prices):
• The rupee:
• And of course, the Turkish lira:
Cryptocurrency
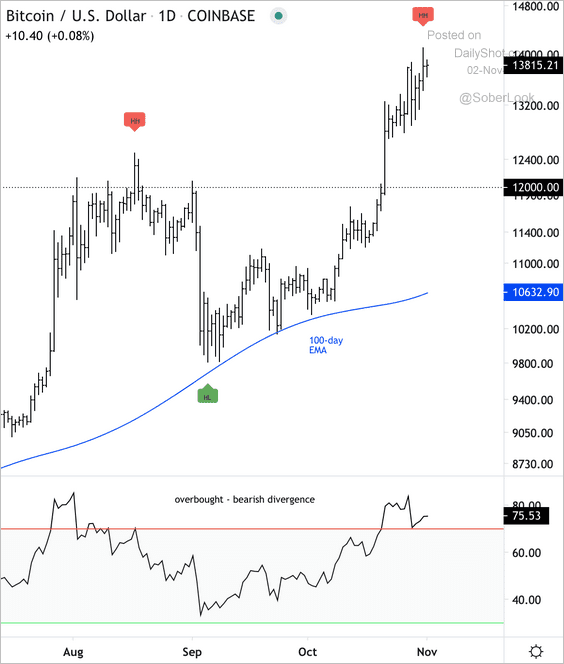
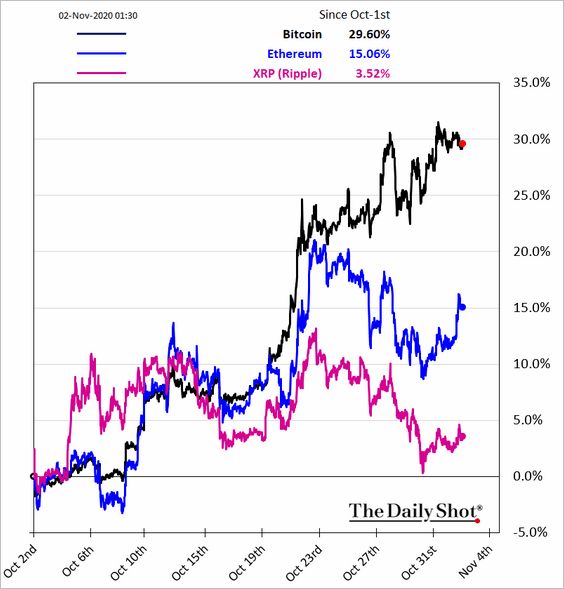
1. Bitcoin is testing the $14k resistance. Technicals show that it is the most overbought since August. Is it time for a pullback?
 Source: @DantesOutlook
2. Bitcoin continues to outperform other cryptos.
3. Bitcoin mining revenue has risen to the highest level since the halving in May.
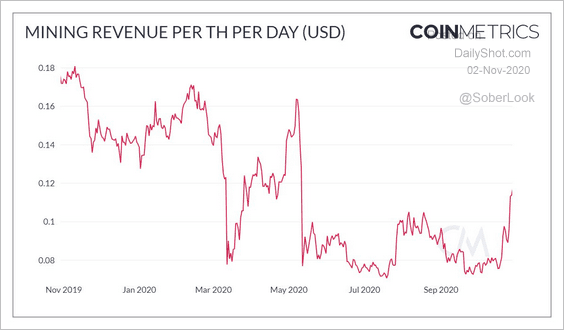 Source: @coinmetrics
However, the cost of doing transactions on Bitcoin is surging. Network congestion (typically experienced during price rallies) has reduced mining power, contributing to higher transaction fees.
![]() Source: CoinDesk Read full article
Source: CoinDesk Read full article
——————–
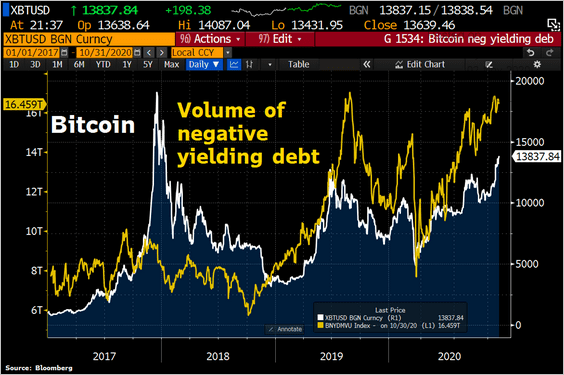
4. Bitcoin has risen in tandem with the volume of negative-yielding debt.
 Source: @Schuldensuehner
Commodities
1. Aluminum prices in China are soaring.

2. The gold/S&P 500 ratio is on the verge of a breakout.
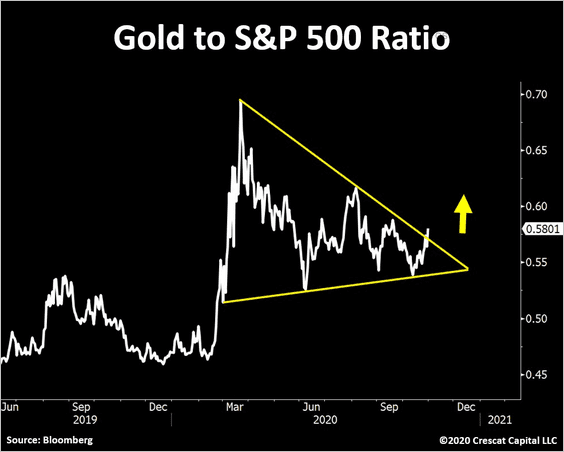 Source: @TaviCosta
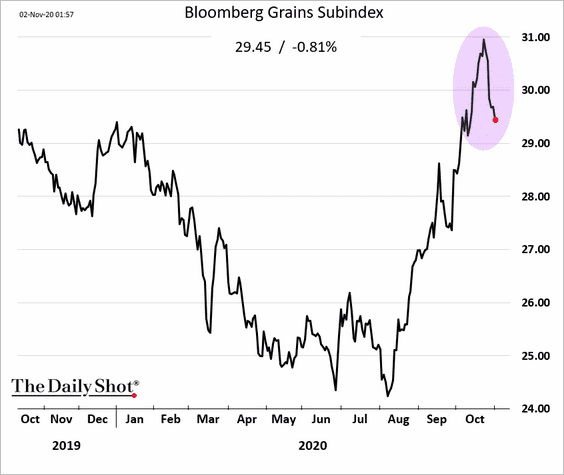
3. US grain futures are rolling over.
Energy
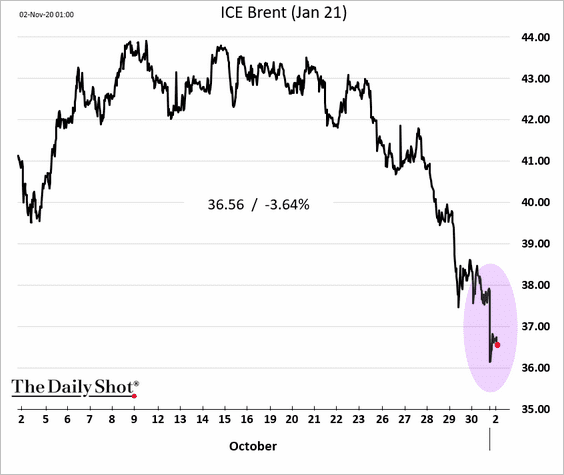
1. Crude oil started the month on a weak note.
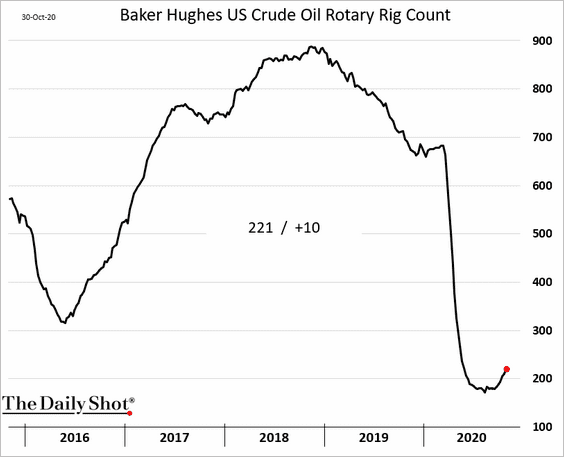
2. Will soft oil prices put an end to the nascent US oil rig count recovery?
Equities
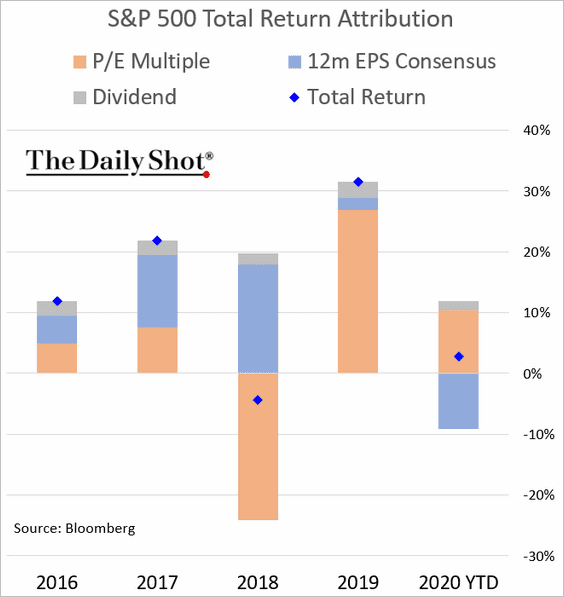
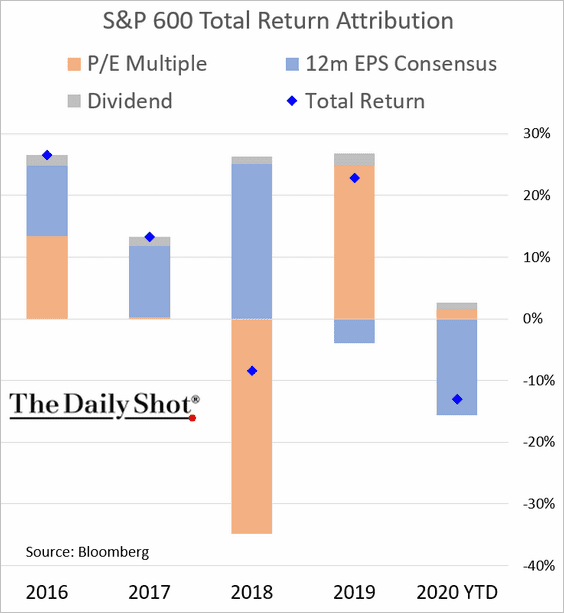
1. Let’s begin with the year-to-date performance attribution:
• S&P 500:
• S&P 600 (small caps):
——————–
2. A relief rally last Thursday was the only bright spot in an otherwise tough week for the S&P 500. And bonds offered no help.
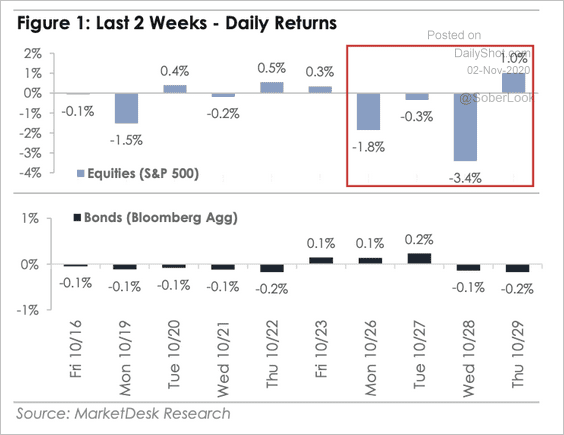 Source: MarketDesk Research
3. Will the US dollar gains put further pressure on stocks?
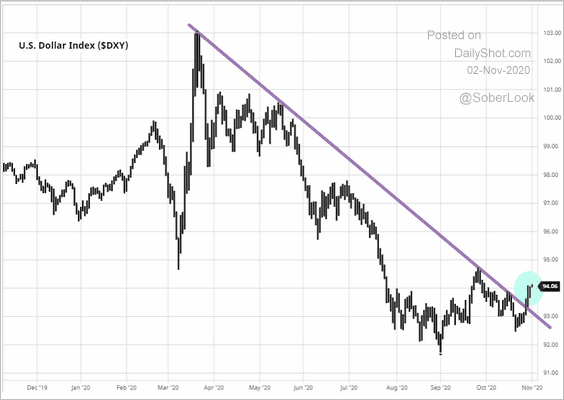 Source: barchart.com
4. The percentage of positive earnings surprises has been impressive.
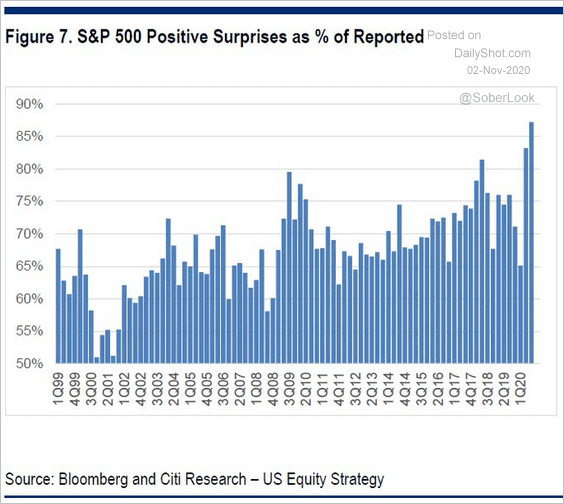 Source: Citi, @Scutty
5. This chart shows the S&P 500 October performance by sector:
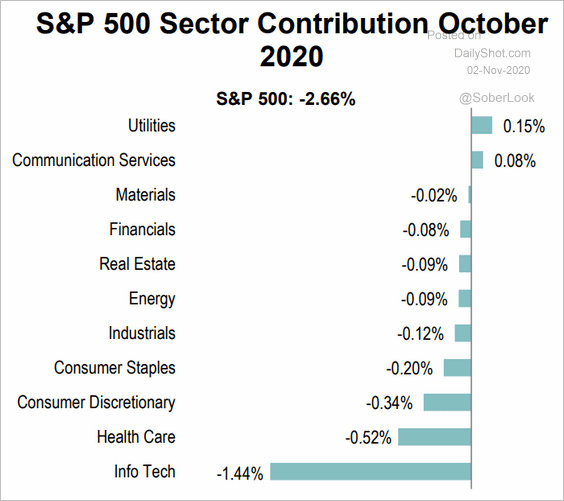 Source: S&P Global Market Intelligence
6. Healthcare stocks appear to be relatively cheap:
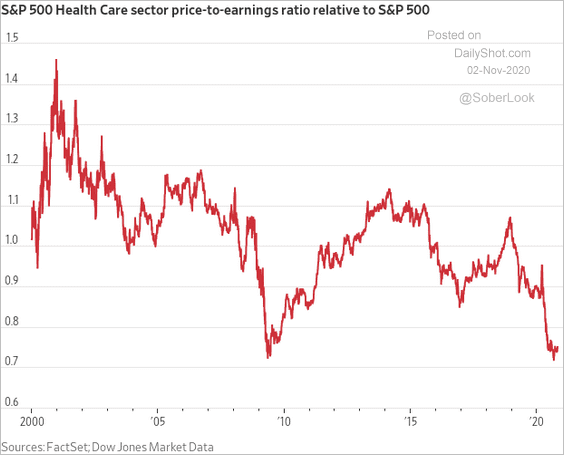 Source: @WSJ Read full article
7. Tech fund flows have been strong.
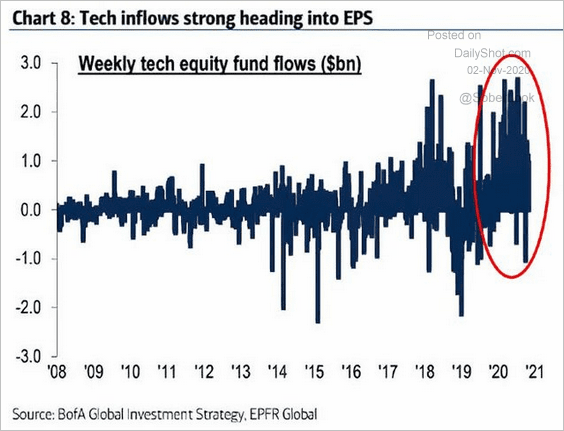 Source: @ISABELNET_SA, @BofAML
8. How have investors been preparing for the elections?
 Source: @WSJ Read full article
Rates
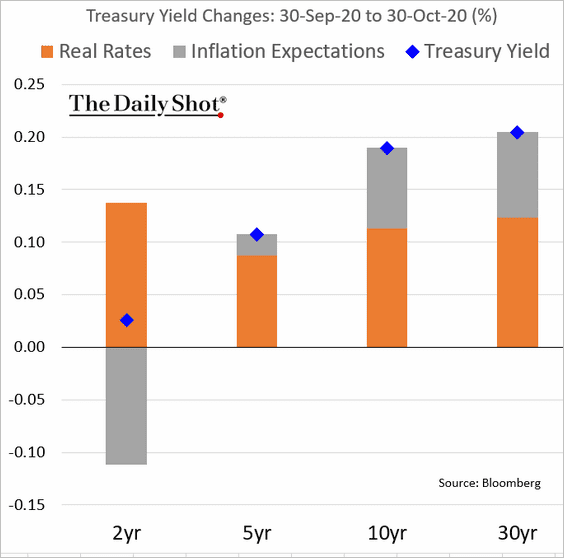
1. Here is the attribution of the Treasury yield increases in October.
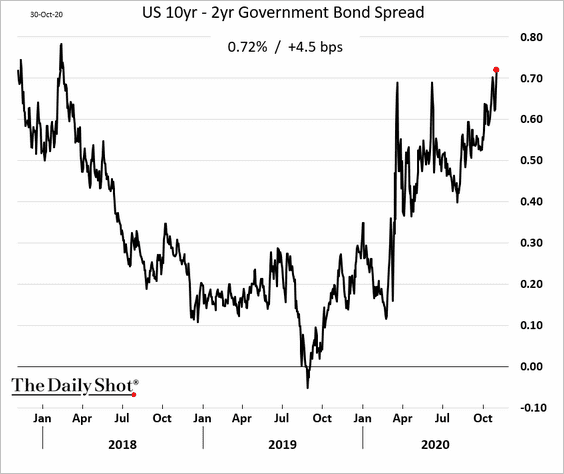
2. The US yield curve continues to steepen.
——————–
Food for Thought
1. COVID-related hospitalizations in select states:
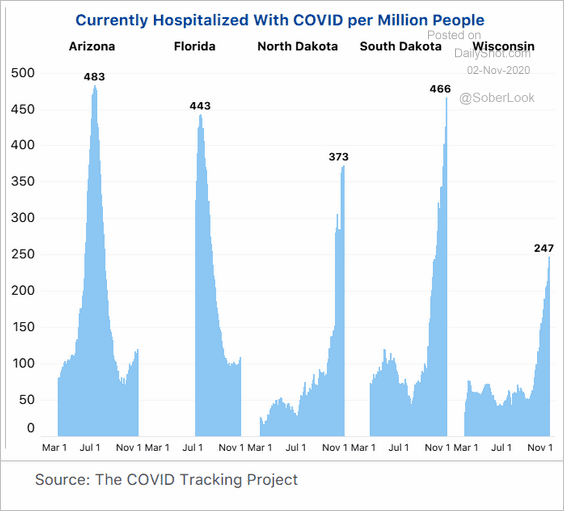 Source: CovidTracking.com
2. The largest tax increases vs. Biden’s plan:
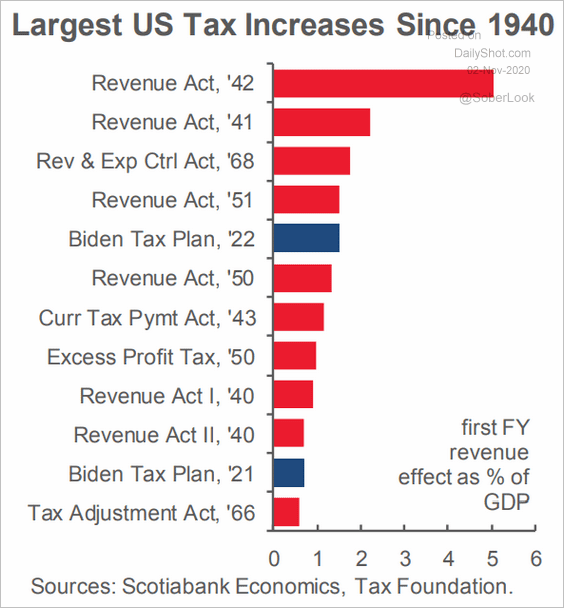 Source: Scotiabank Economics
3. Where does your vote count most?
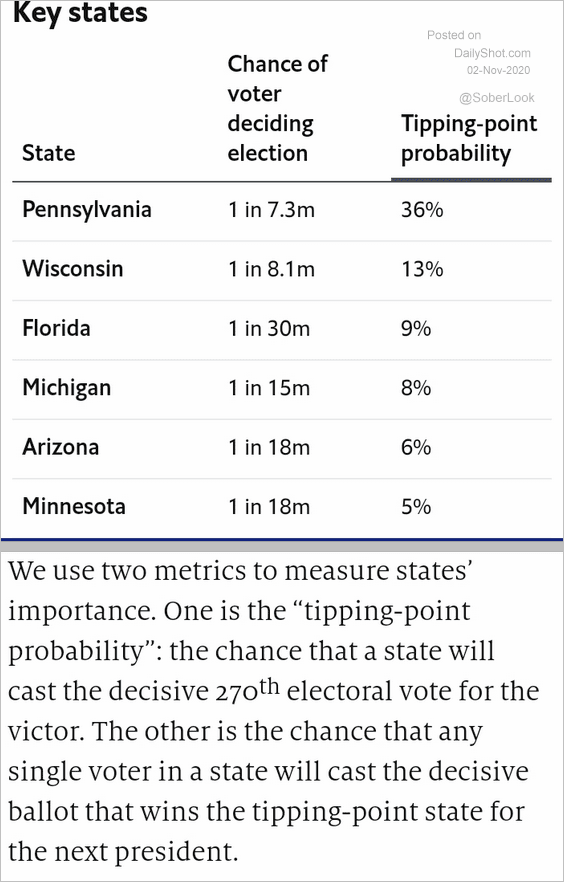 Source: @TheEconomist
4. What portion of the votes will be counted on election night?
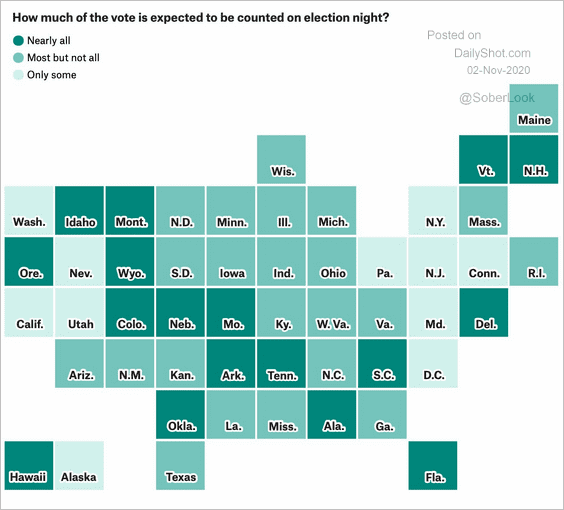 Source: @FiveThirtyEight Read full article
5. Airline fares:
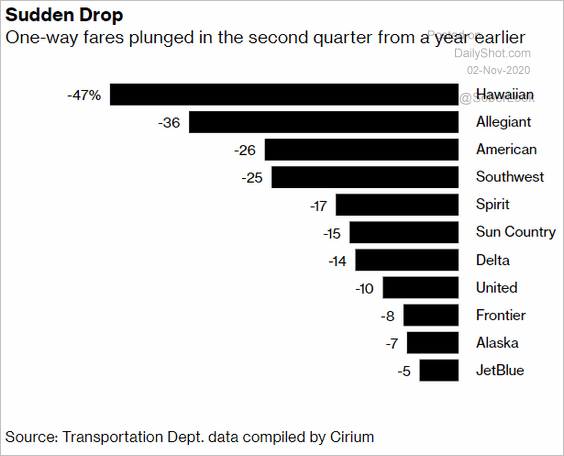 Source: @business Read full article
6. Paying for a news service:
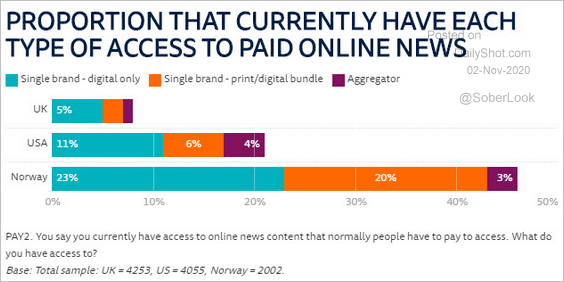 Source: @risj_oxford Read full article
7. US farm income:
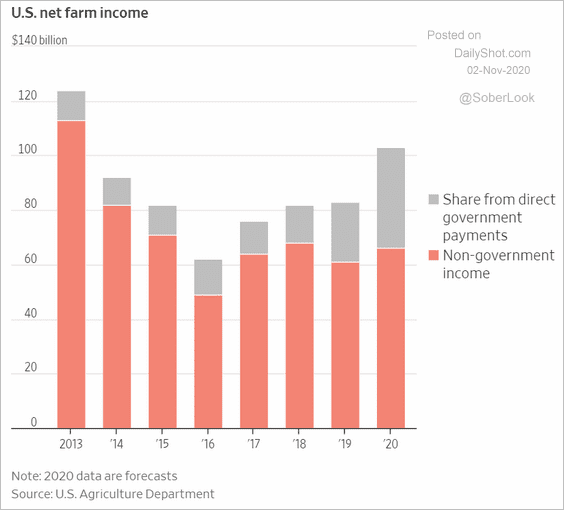 Source: @WSJ Read full article
8. Trump or Biden voter (based on what’s in the fridge)?
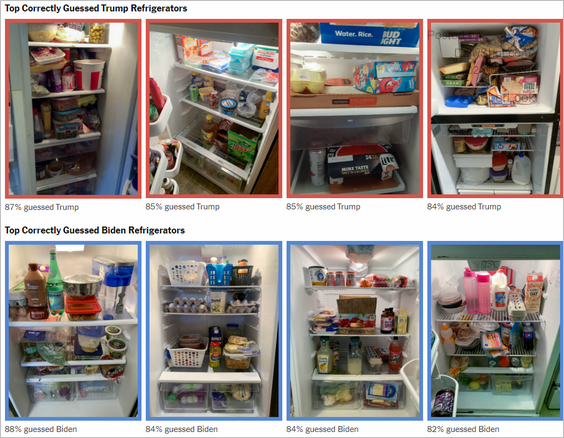 Source: The Upshot Read full article
——————–