
The Daily Shot: 03-Nov-20
• The United States
• Canada
• The United Kingdom
• The Eurozone
• Europe
• Asia – Pacific
• China
• Emerging Markets
• Energy
• Equities
• Rates
• Global Developments
• Food for Thought
The United States
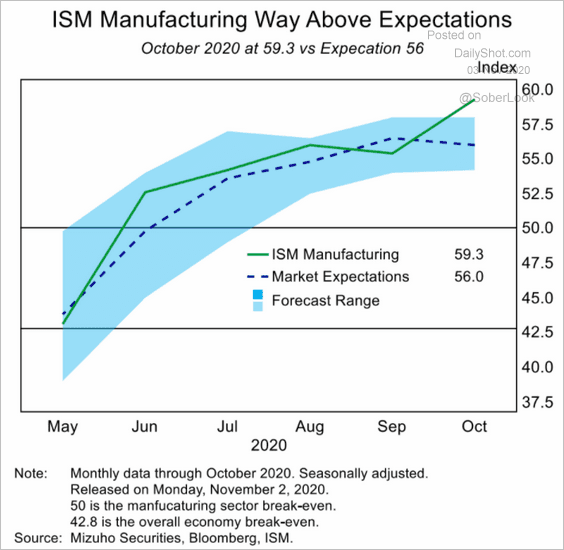
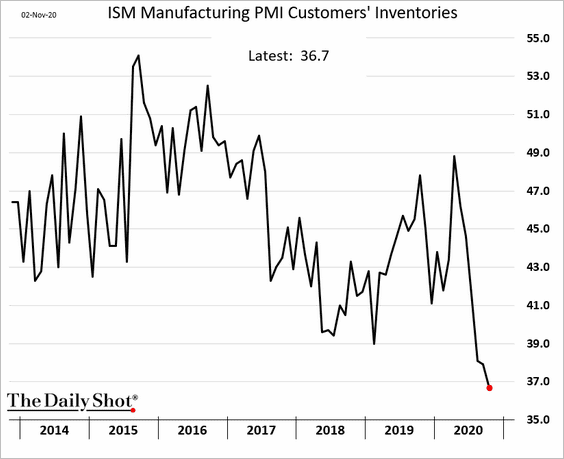
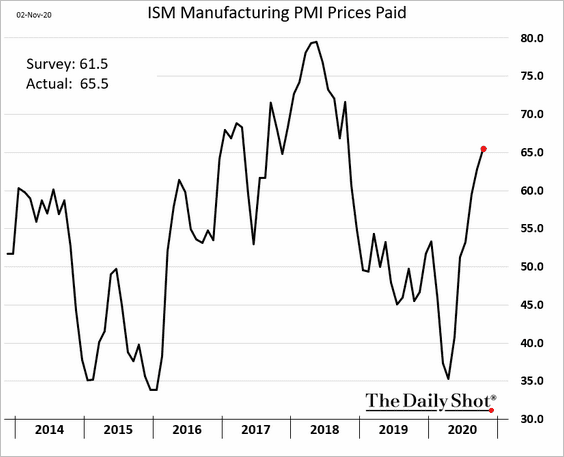
1. US factory activity quickened last month, with the ISM PMI report exceeding forecasts (2 charts).
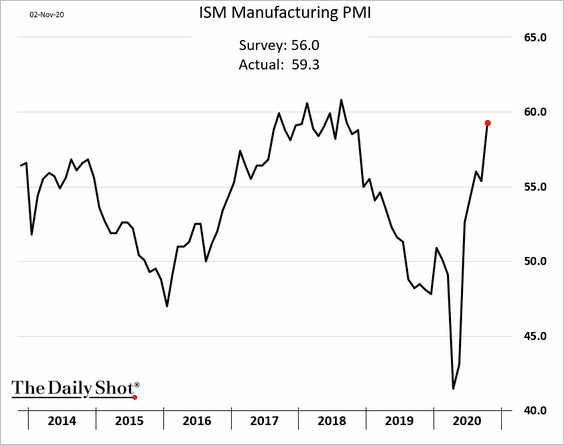
 Source: Mizuho Securities USA
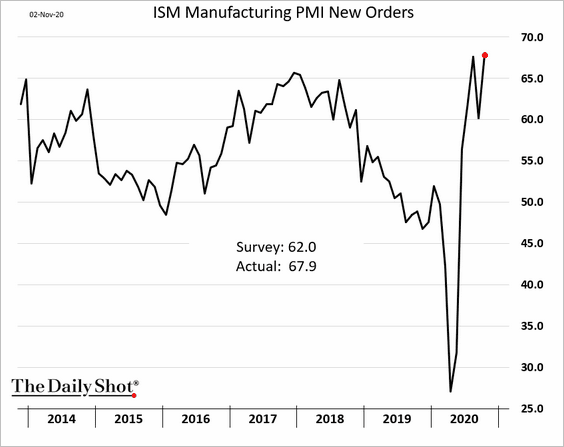
• The index of new orders hit a multi-year high.
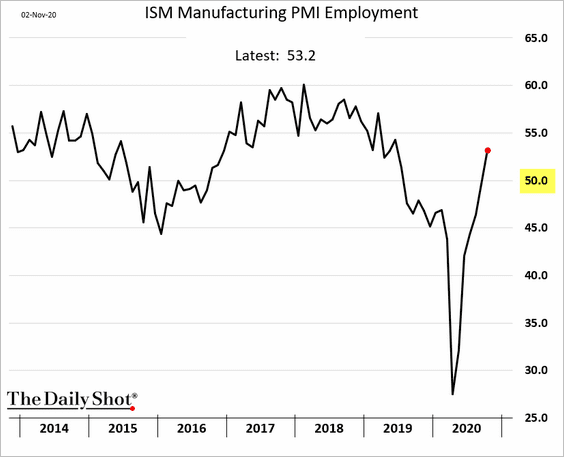
• Employment is back in growth mode.
• Manufacturers see their customers’ inventories as being too low.
• Input price gains accelerated.
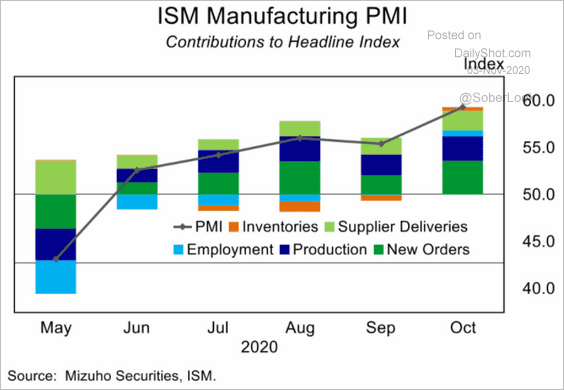
• Here are the contributions to the ISM index.
 Source: Mizuho Securities USA
——————–
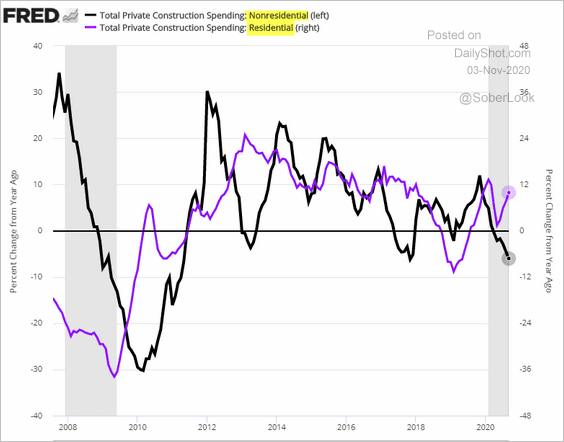
2. Growth in construction spending slowed.
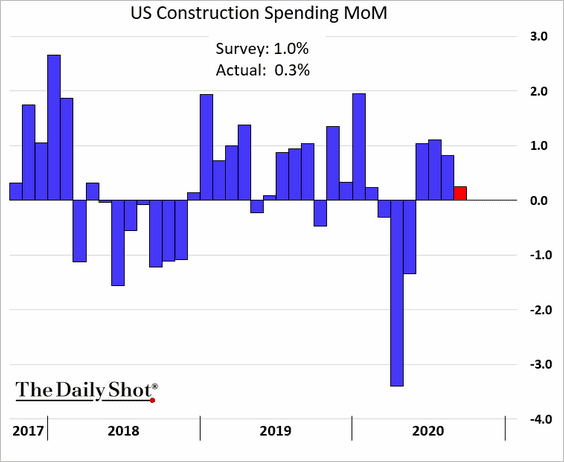
The recent weakness was driven by nonresidential construction.
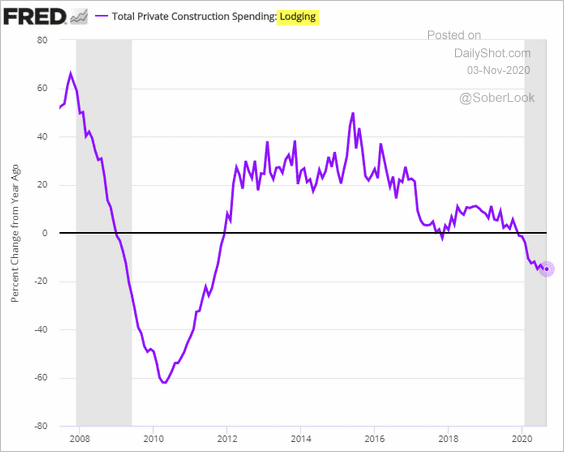
Who would want to invest in a new hotel in this environment?
——————–
3. Now, let’s take a look at the nation’s housing and rental markets.
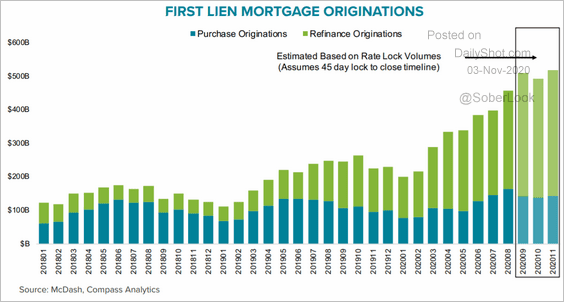
• Mortgage originations hit a multi-year high.
 Source: Black Knight
• The housing boom has been powered by borrowers with credit scores of 750 and above.
 Source: TS Lombard
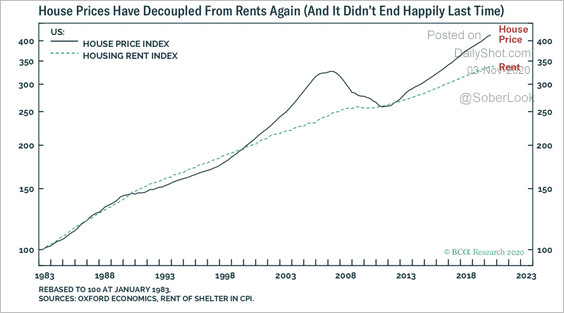
• Earlier, we saw the divergence between home prices and wages. Here is a similar comparison with rents.
 Source: BCA Research
• Evictions could climb as some renters struggle to make payments.
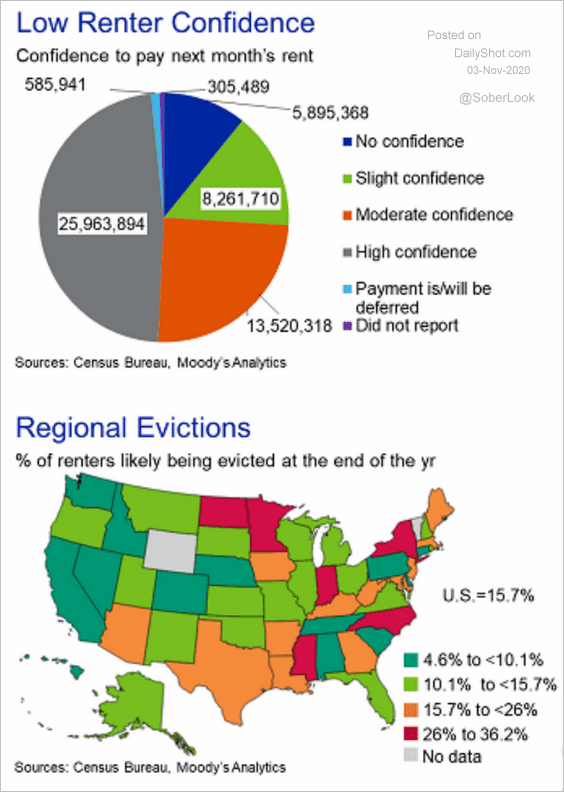 Source: Moody’s Analytics
• Migration out of urban areas is on full display in this year’s rent changes.
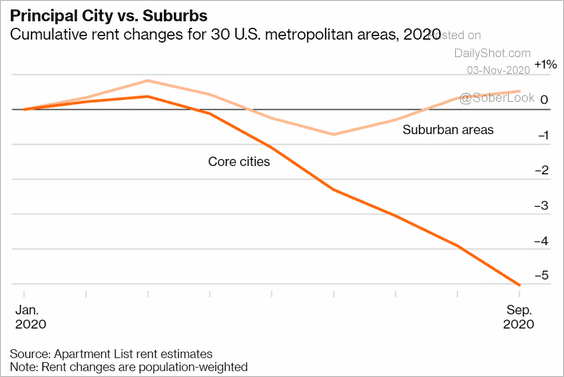 Source: @citylab Read full article
——————–
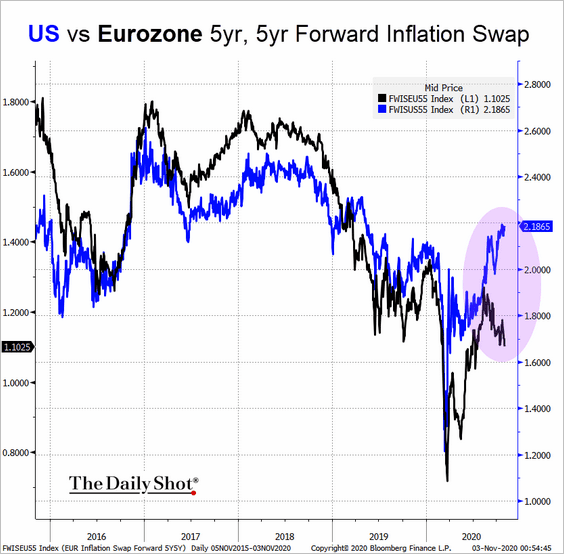
4. Next, let’s take a look at some inflation trends.
• US and Eurozone long-term inflation expectations have diverged sharply. The market sees the fiscal stimulus in the US significantly outpacing that of the euro area.
 Source: @TheTerminal, Bloomberg Finance L.P.
• The Phillips Curve illustrates a steady recovery in inflation and employment since May.
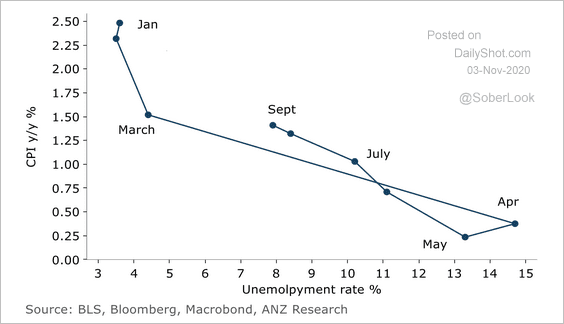 Source: ANZ Research
• The Fed has a troubled history with inflation targeting.
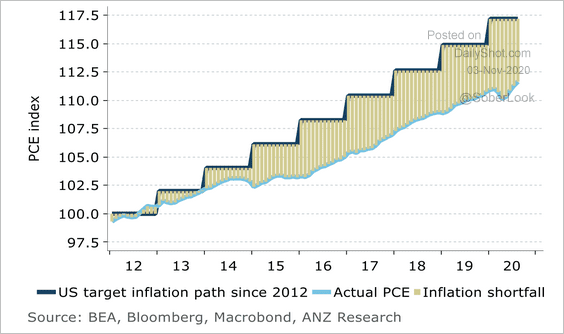 Source: ANZ Research
• When will inflation overshoot the Fed’s target?
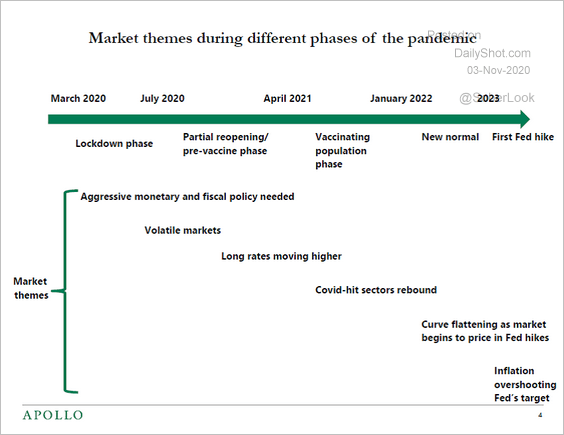 Source: Torsten Slok; Apollo Global Management
——————–
5. Below are a couple of COVID trends in the US.
• Google searches for COVID symptoms:
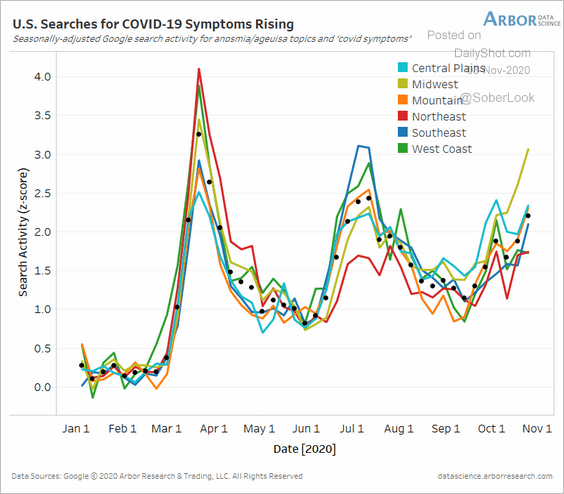 Source: Arbor Research & Trading
• Hospitalizations:
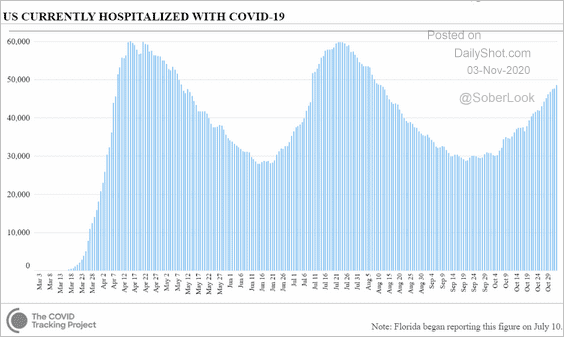 Source: CovidTracking.com
——————–
6. School closures and childcare challenges have forced many women out of the labor force.
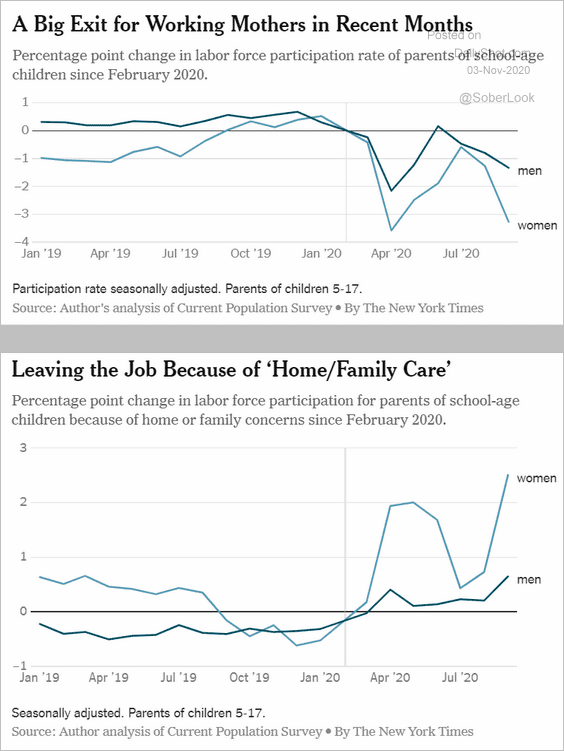 Source: The New York Times Read full article
7. Finally, here is a section on the US elections.
• The electoral map based on Larry Sabato’s Crystal Ball:
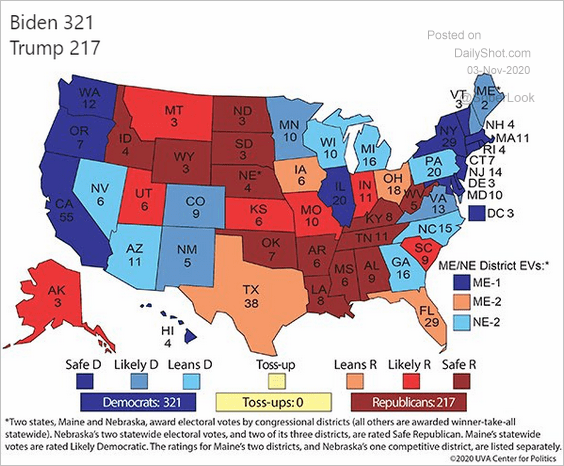 Source: @Politics_Polls, @LarrySabato
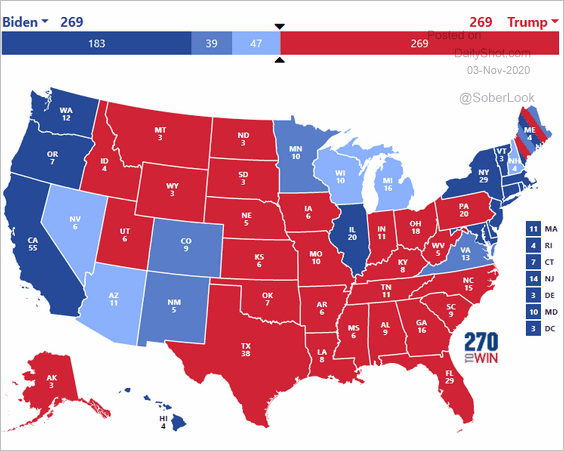
• The electoral map based on the betting markets (Predictit):
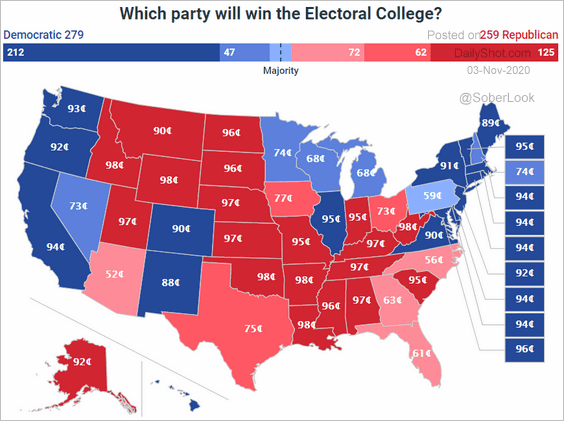 Source: @PredictIt
• Polling analysis by different groups:
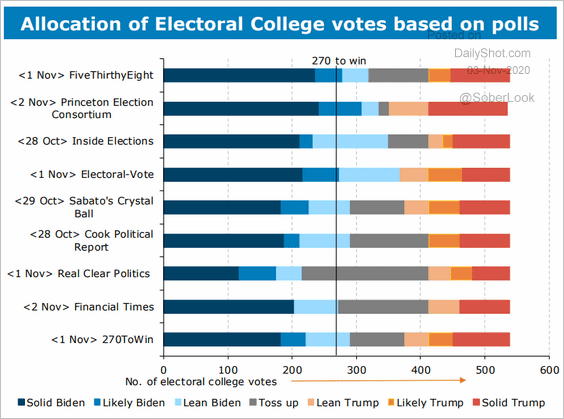 Source: ANZ Research
• What would a tie in the Electoral College look like?
 Source: Independent Advisor Alliance
• “Blue wave” probability estimates (538 vs. PredictIt):
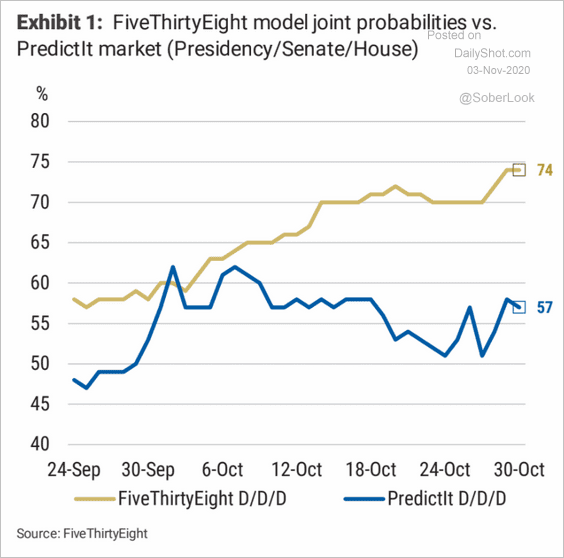 Source: Morgan Stanley Research
• What if my candidate doesn’t win?
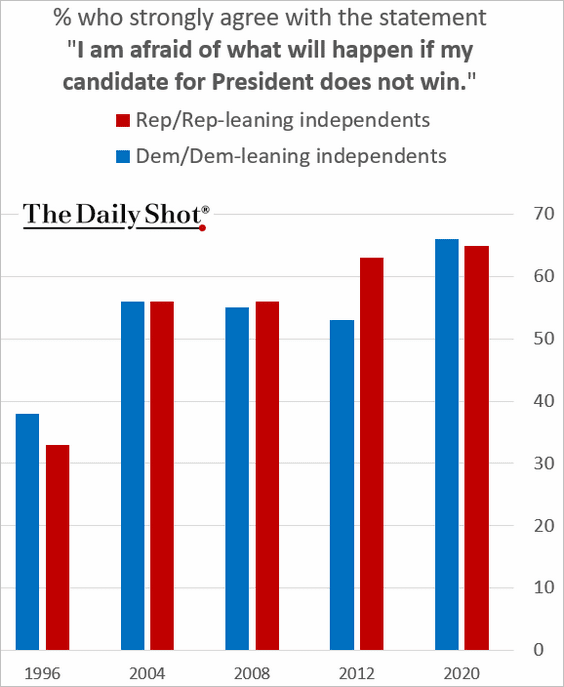 Source: Gallup Read full article
• Senate races:
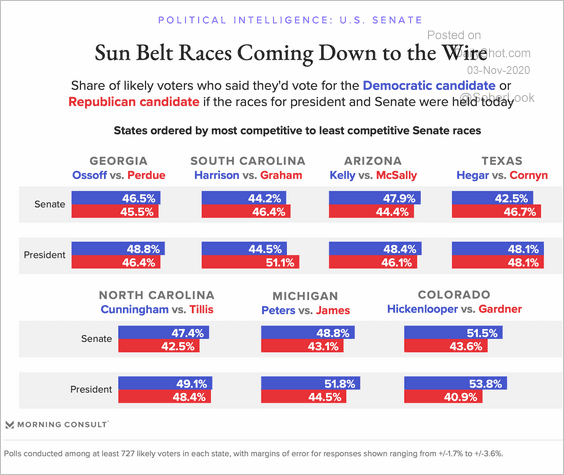 Source: Morning Consult Read full article
• Turnout expectations:
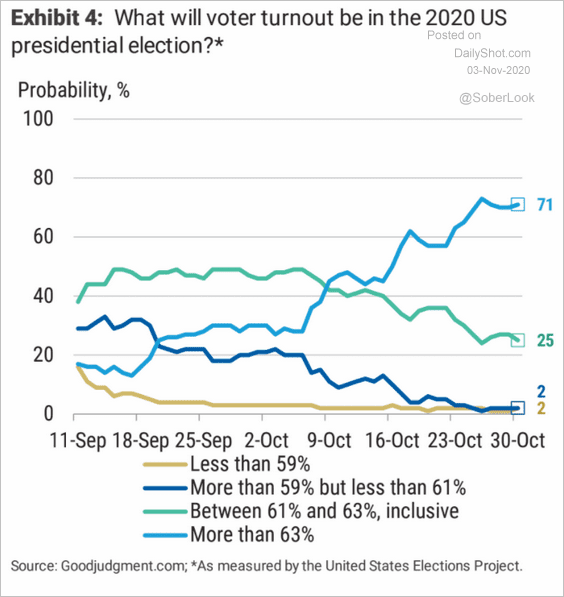 Source: Morgan Stanley Research
• 2016 vs. 2020 demographics (2 charts):
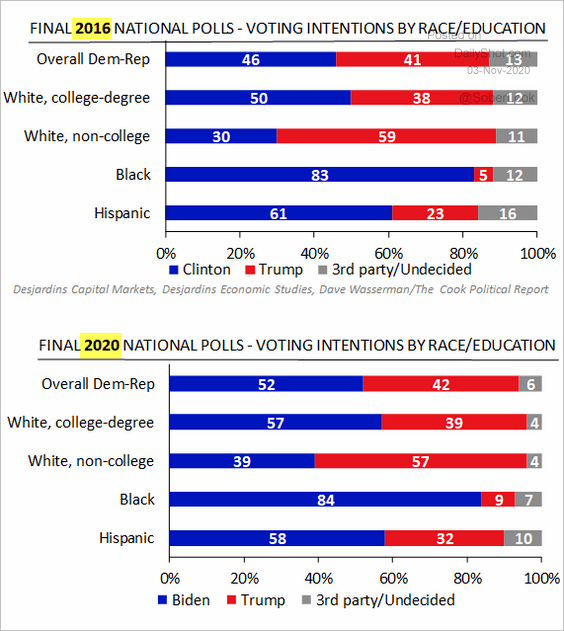 Source: Desjardins
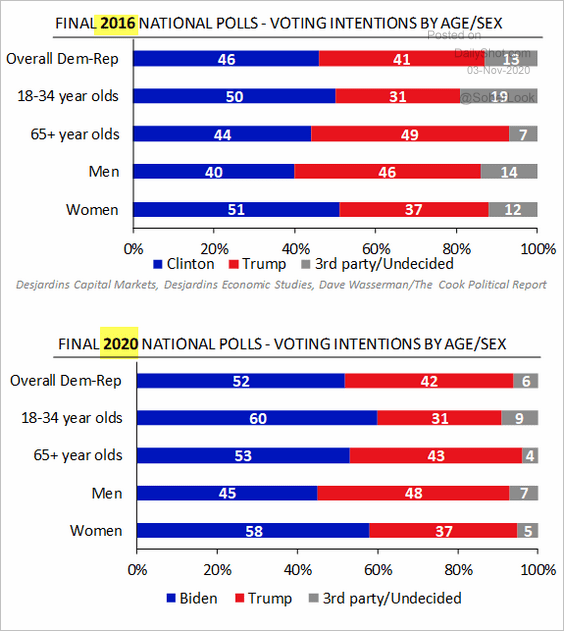 Source: Desjardins
• Early voter demographics:
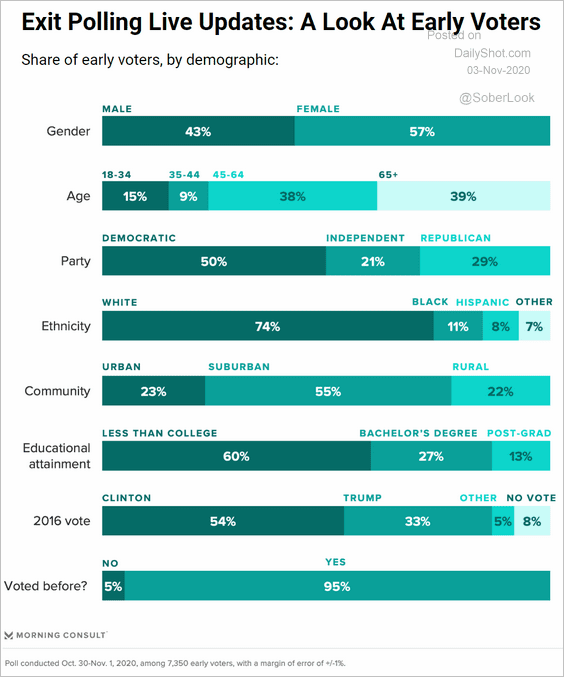 Source: Morning Consult Read full article
• Historical winning margins:
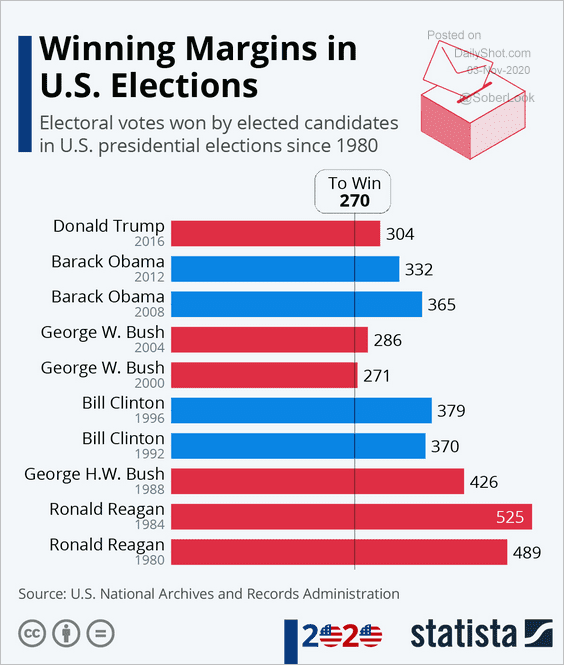 Source: Statista
• What outcome do other countries expect?
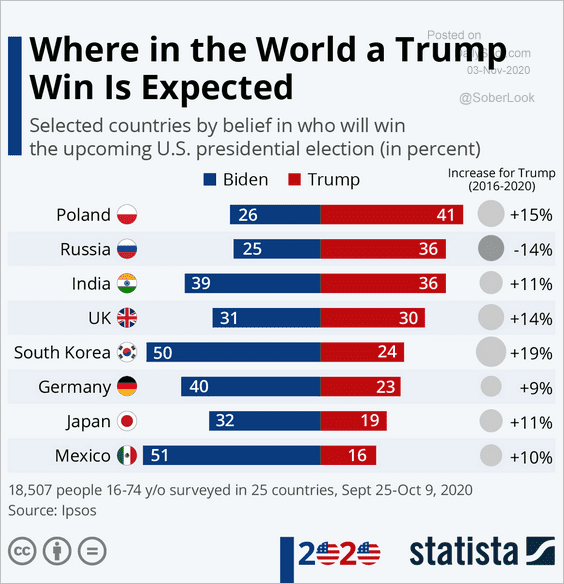 Source: Statista
Canada
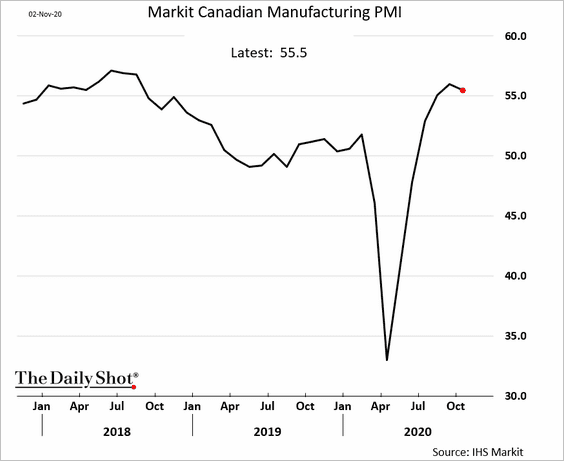
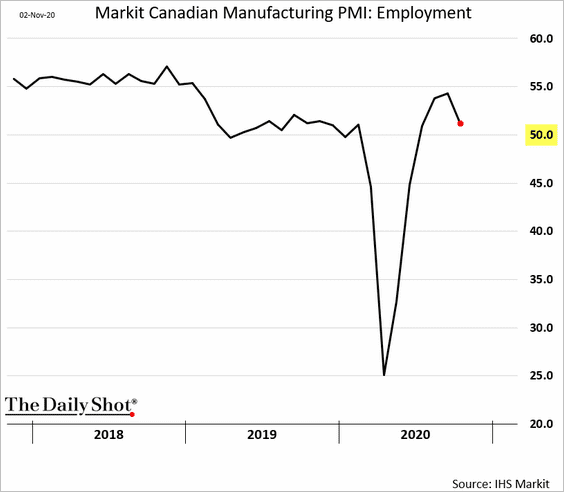
1. Manufacturing growth continued in October.
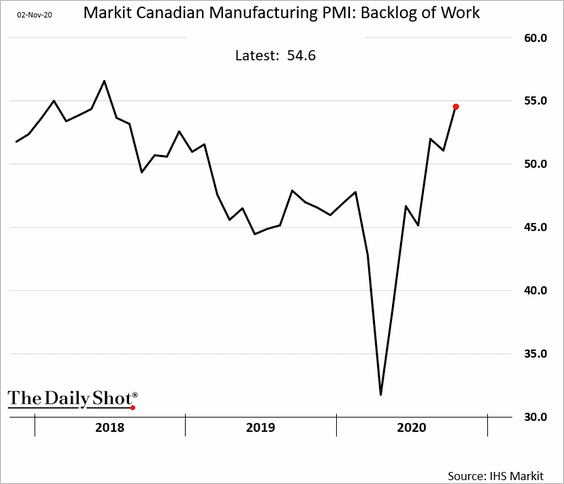
• The backlog of work accelerated.
• Factory hiring slowed.
——————–
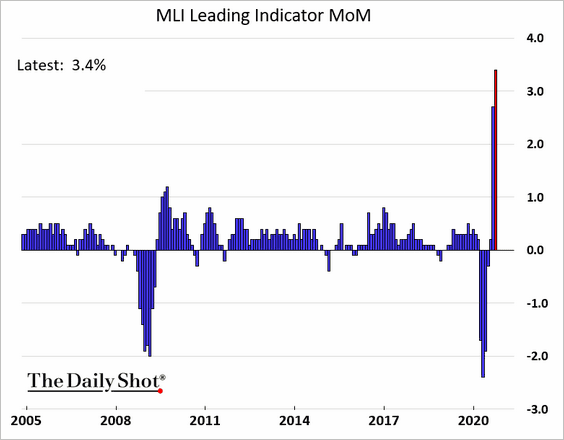
2. The MLI Leading Indicator monthly change hit a record high in September. Will we see a substantial pullback in October?
The United Kingdom
The UK economic outlook has worsened since the last MPC meeting.
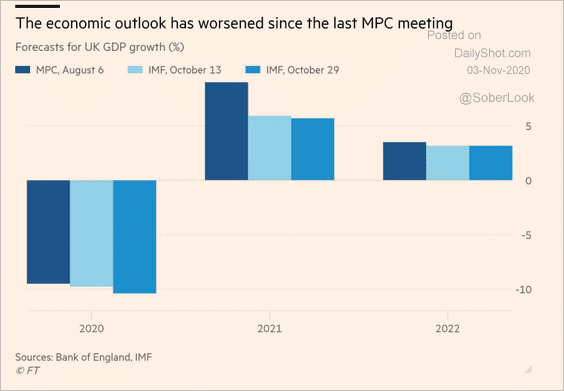 Source: @financialtimes Read full article
Here are some scenarios of the lockdown impact on the GDP.
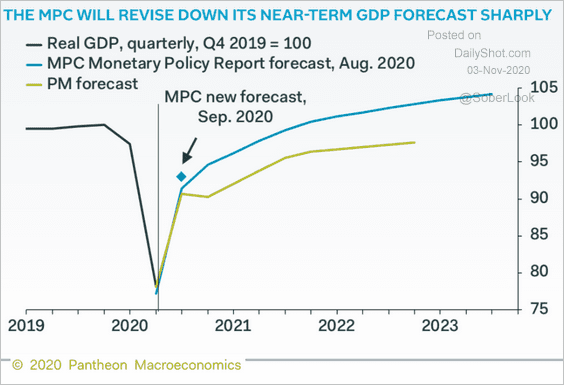 Source: Pantheon Macroeconomics
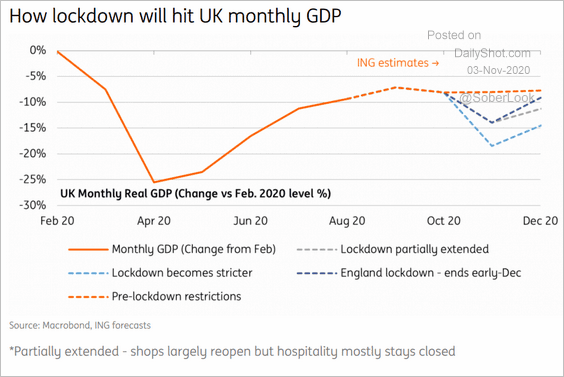 Source: ING
The Eurozone
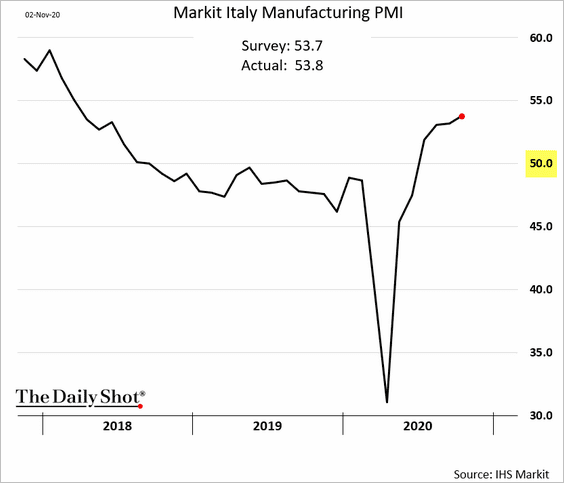
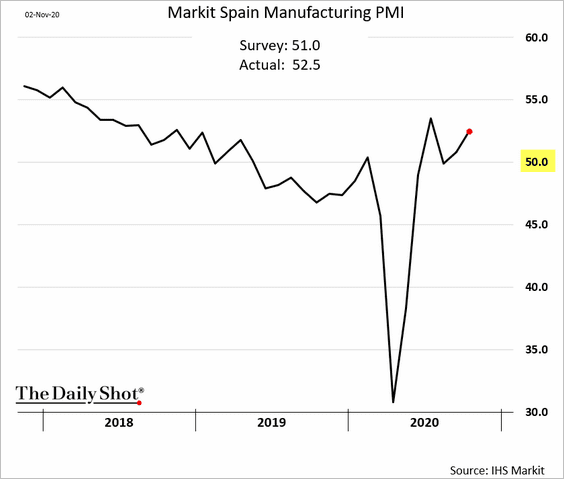
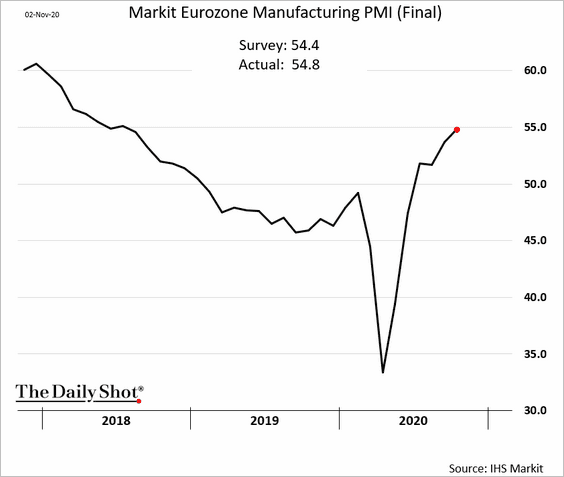
1. October factory activity surprised to the upside.
• Italy:
• Spain:
• Eurozone (better than the earlier report):
——————–
2. The pandemic is pressuring economic activity.
• Hospitalizations in France:
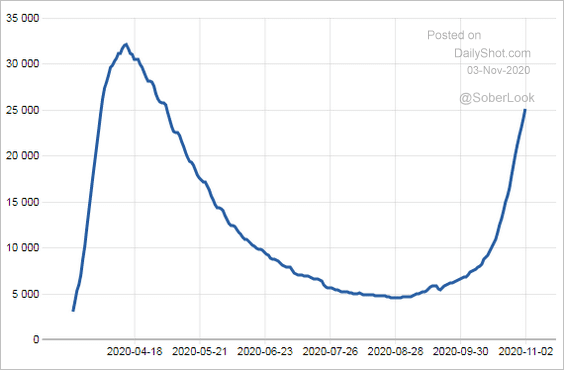 Source: @BNODesk
• Intensive care admissions in the Eurozone:
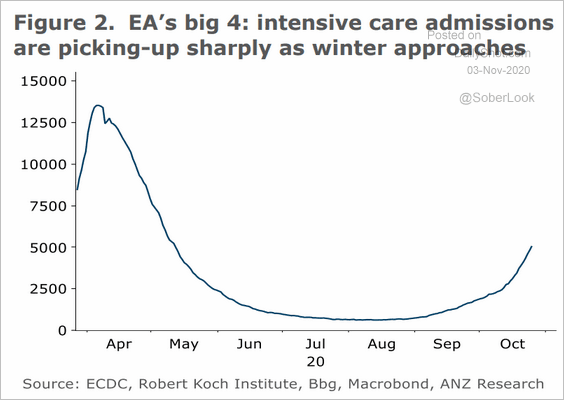 Source: ANZ Research
• Germany’s mobility indicators:
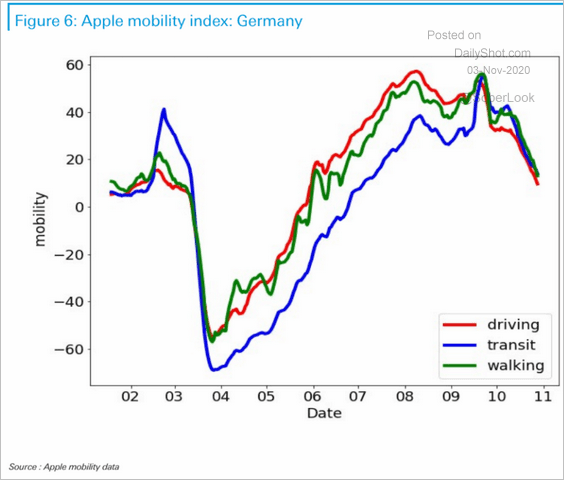 Source: Deutsche Bank Research
• Bloomberg’s recovery indices:
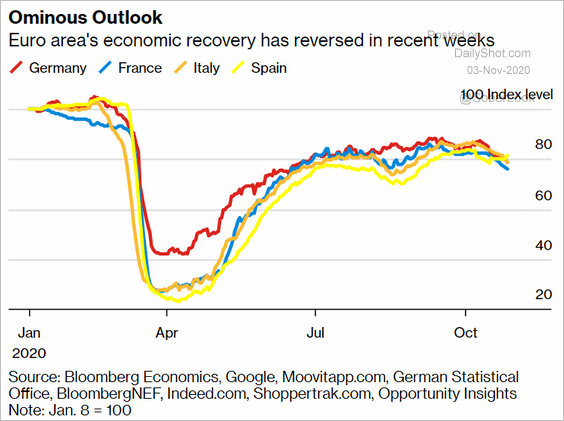 Source: @business Read full article
——————–
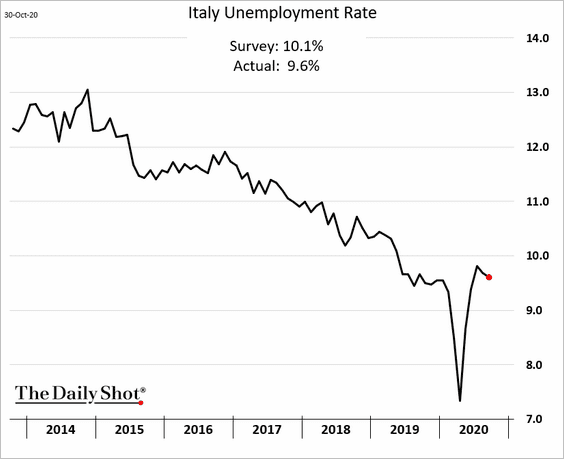
3. The Italian unemployment rate held below 10%.
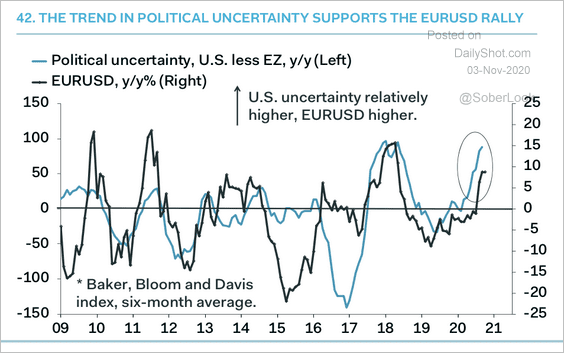
4. Rising US political uncertainty has been supportive of EUR/USD.
 Source: Pantheon Macroeconomics
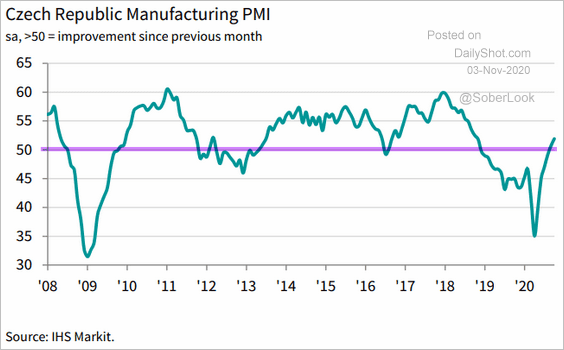
Europe
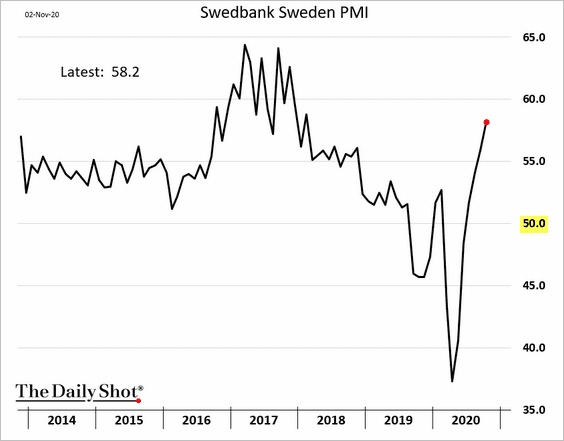
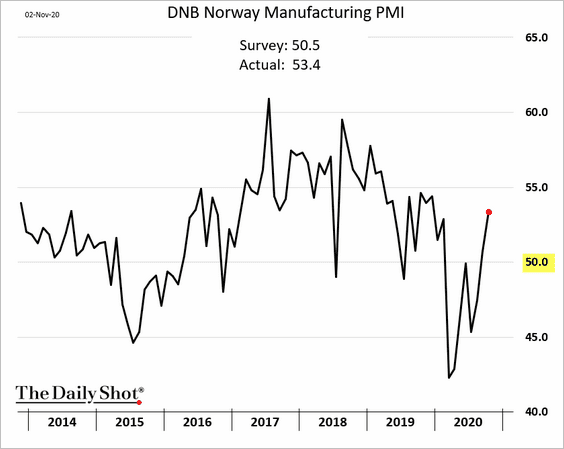
1. Let’s run through some PMI trends, which show improving manufacturing growth.
• Sweden:
• Norway:
• Central Europe:
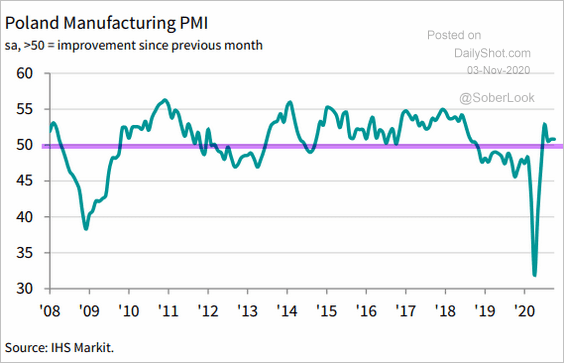 Source: IHS Markit Read full article
 Source: IHS Markit Read full article
——————–
2. Europe is outpacing the rest of the world in new COVID cases.
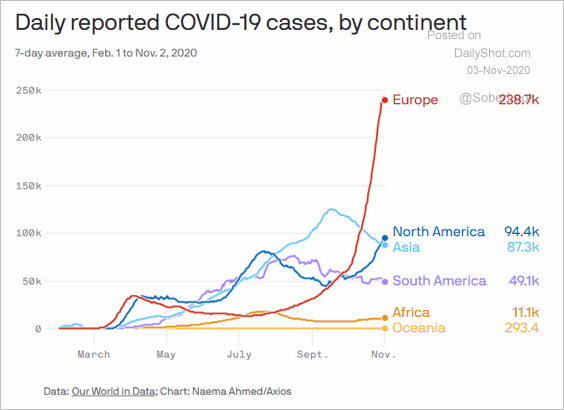 Source: @axios Read full article
And it’s putting a strain on the economy (see comment below).
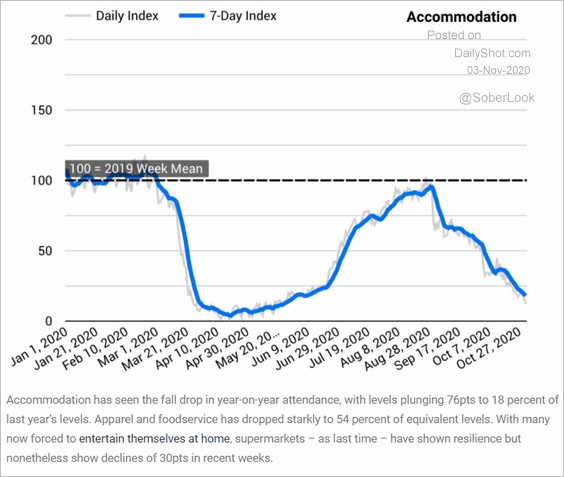 Source: huq Read full article
——————–
3. European corporate earnings projections are lagging those in the US.
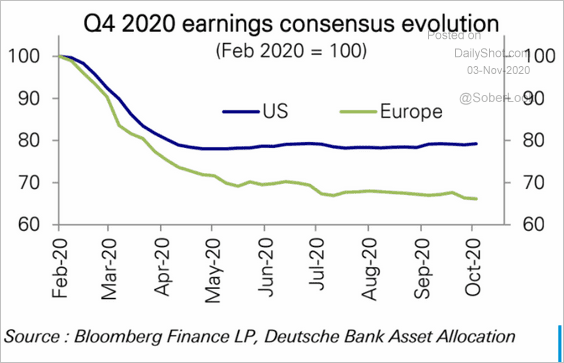 Source: Deutsche Bank Research
Asia – Pacific
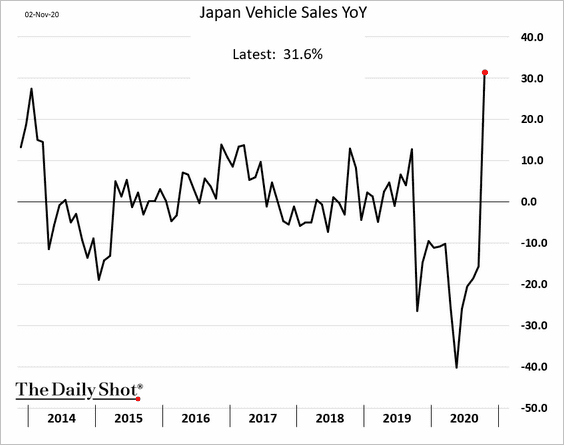
1. Japan’s vehicle sales rebounded sharply.
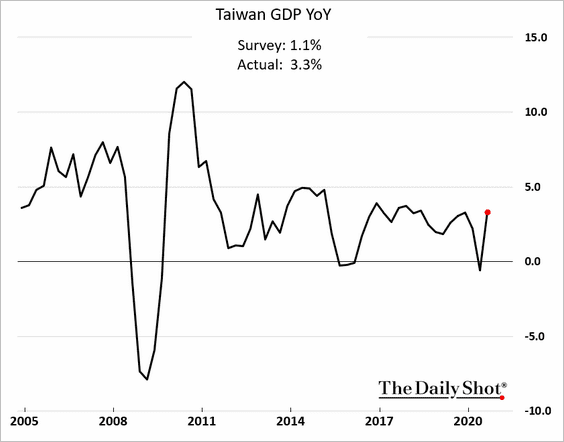
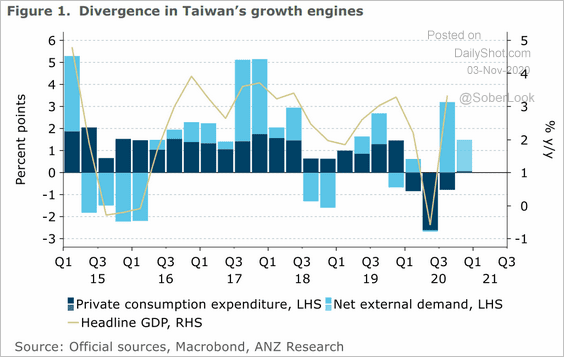
2. Taiwan’s GDP surprised to the upside, driven by external demand (2nd chart). The economy held up remarkably well this year.
 Source: ANZ Research
——————–
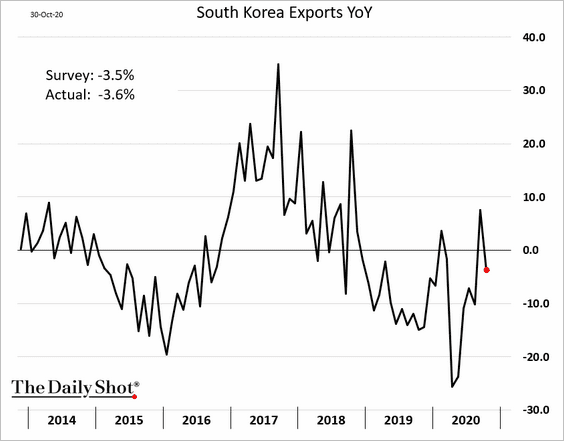
3. South Korea’s exports slowed in October.
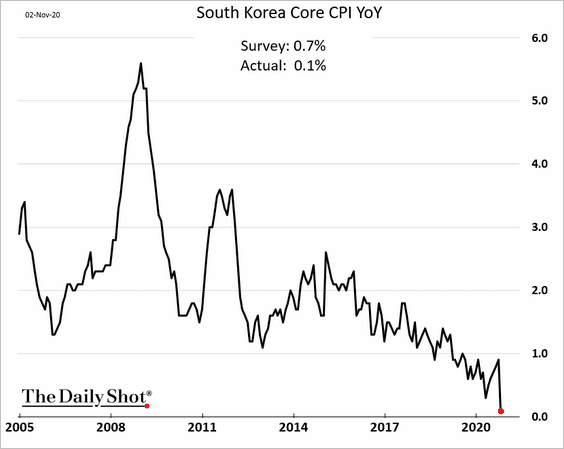
The nation’s core CPI hit a new low. Here is a comment from ANZ:
… the pullback is not a cause for serious concern as it was driven mainly by a sharp fall in communication prices following government subsidies for mobile phone bills.
——————–
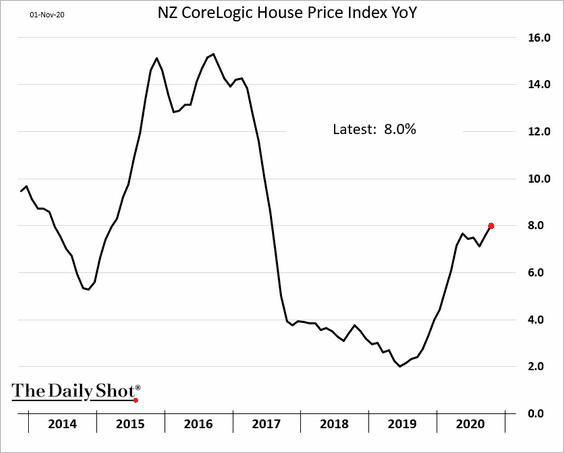
4. New Zealand’s home prices are now 8% above last year’s levels.
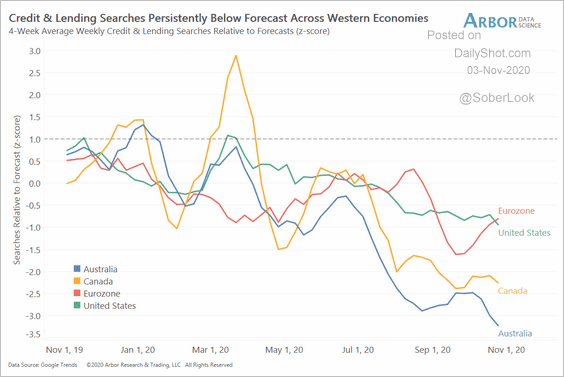
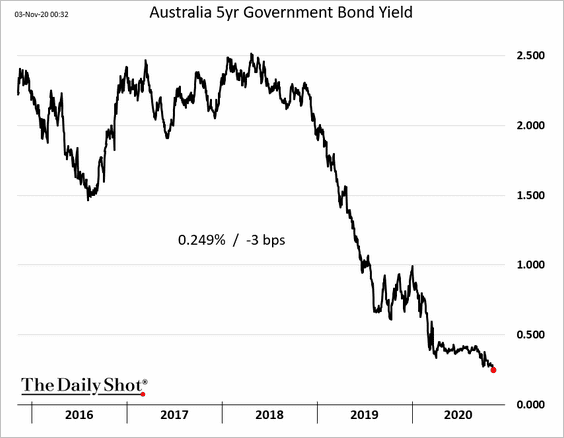
5. Search activity for loan/credit-related items in Australia tumbled in recent months.
 Source: Arbor Research & Trading
The 5yr Aussie government bond yield hit a new low.
China
1. The renminbi implied volatility spiked ahead of the US elections.
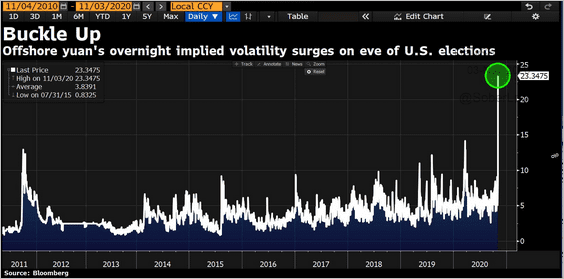 Source: @DavidInglesTV
2. Container shipping activity has surged to multi-year highs, with exports of textiles far outpacing India.
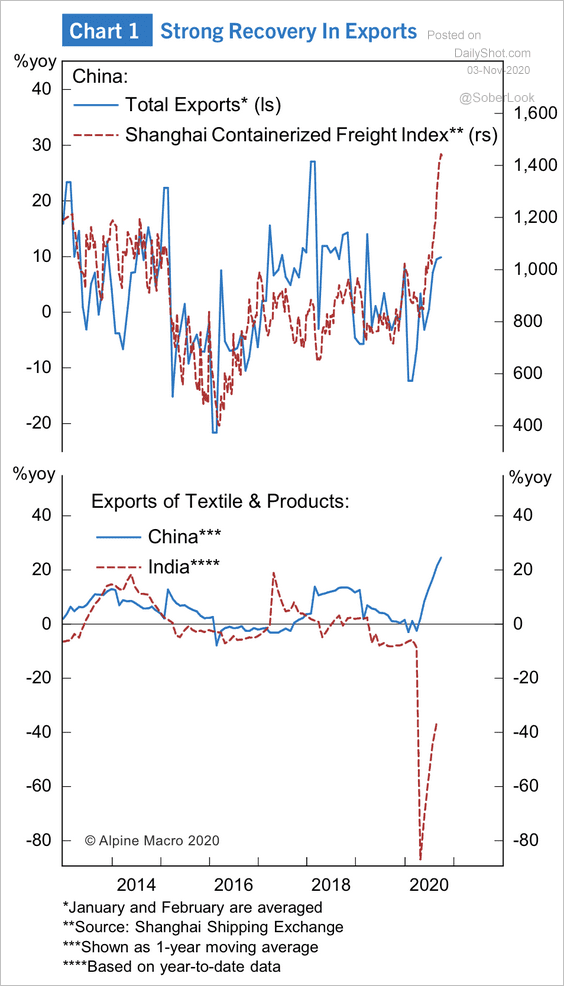 Source: Alpine Macro
3. China is allowing greater access to its onshore futures market. This makes it easier for foreign investors to hedge or speculate on stock positions.
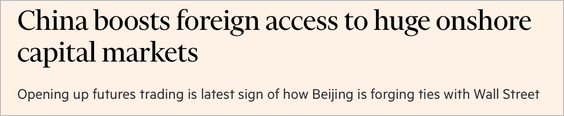 Source: @FT Read full article
4. A-shares with dual listings are currently trading at a 40% premium to their Hong-Kong listed counterparts, according to Alpine Macro.
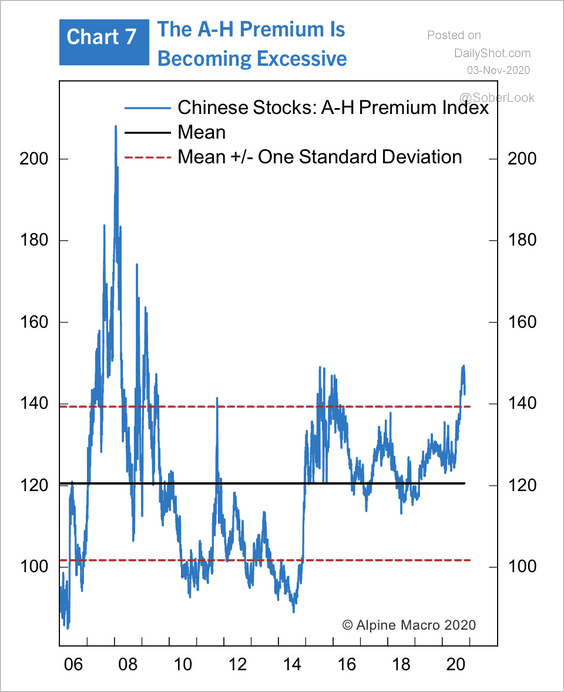 Source: Alpine Macro
5. Here are the contributions to real GDP. While growth is normalizing, household consumption remains a weak spot.
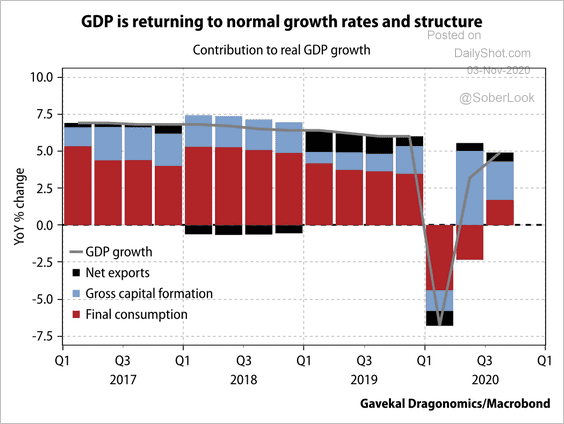 Source: Gavekal
6. Fiscal stimulus has peaked.
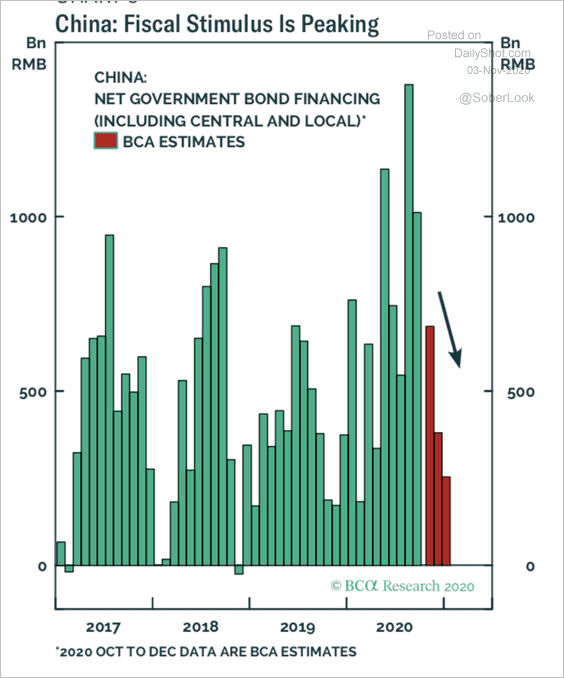 Source: BCA Research
7. The economic rebound has boosted corporate hiring intentions.
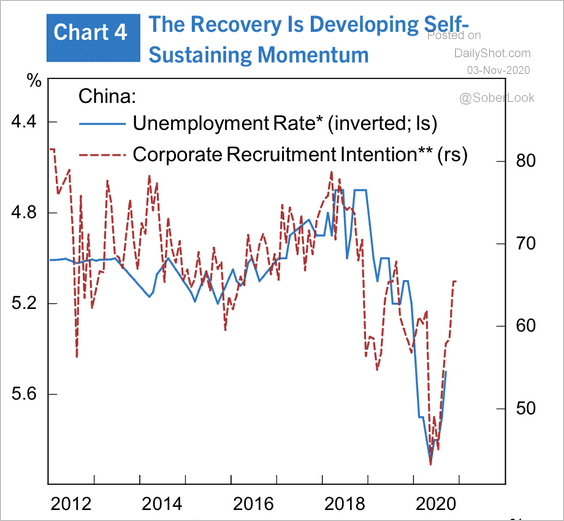 Source: Alpine Macro
8. Nonperforming loan balances rose this year.
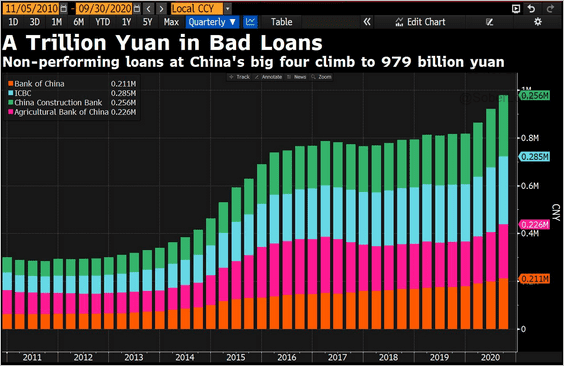 Source: @DavidInglesTV
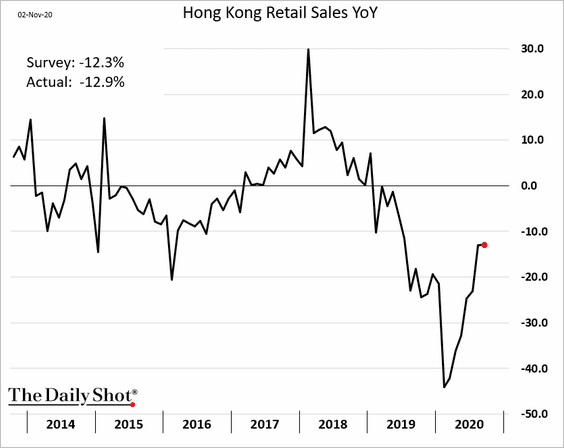
9. The recovery in Hong Kong’s retail sales has stalled.
Emerging Markets
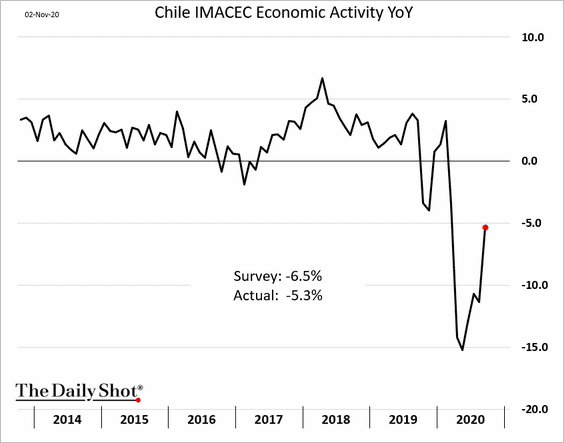
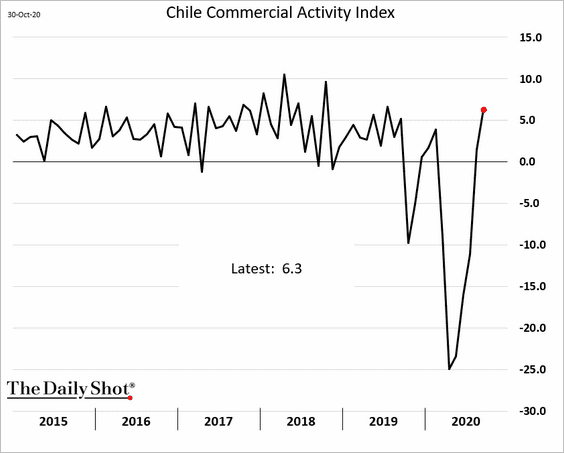
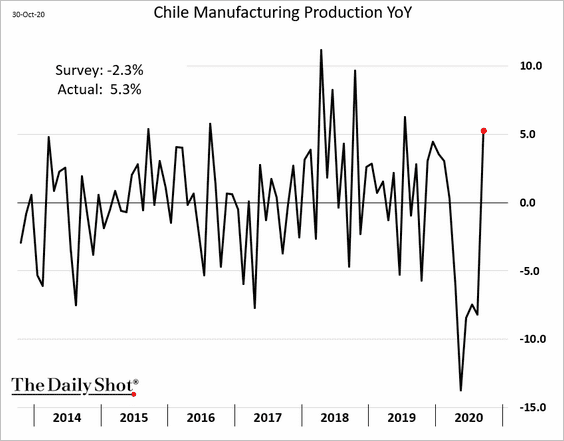
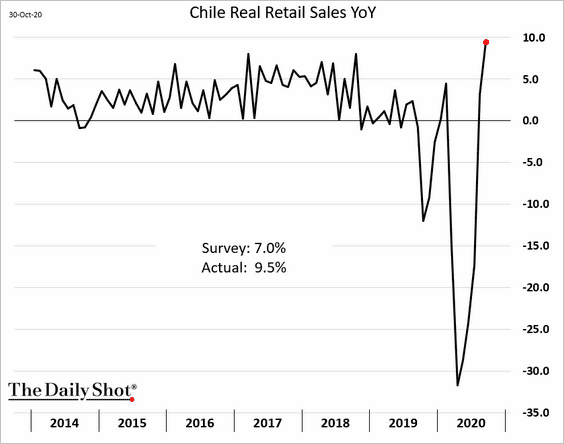
1. Let’s begin with Chile, where the recovery has picked up momentum.
• Economic activity:
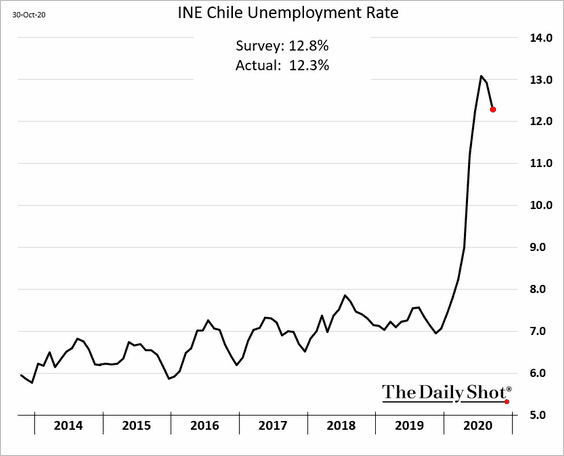
• The unemployment rate (off the highs):
• Commercial activity index:
• Industrial production:
• Retail sales:
• Consumer and business sentiment:
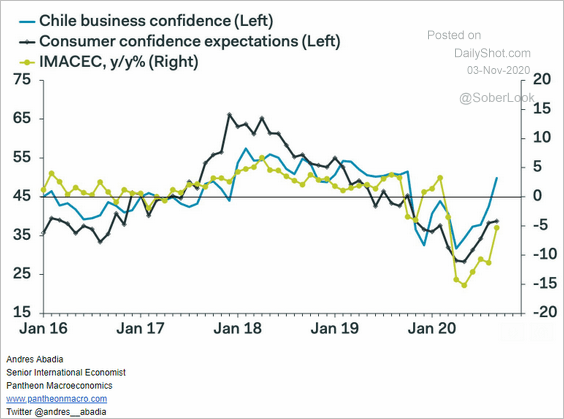 Source: Pantheon Macroeconomics
——————–
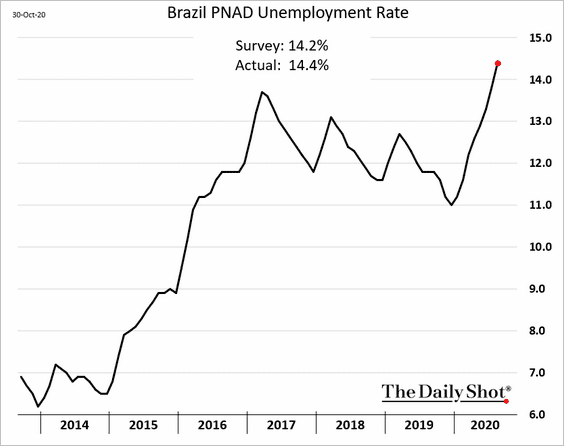
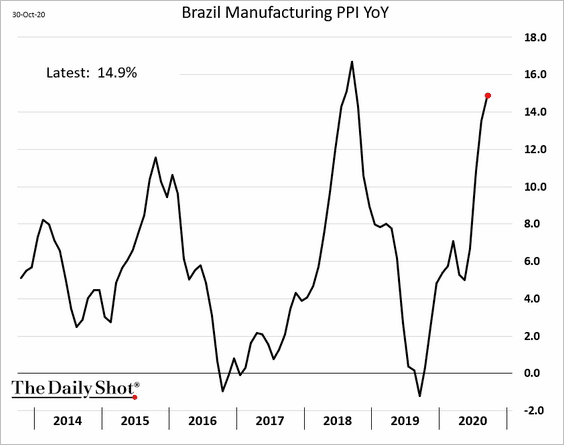
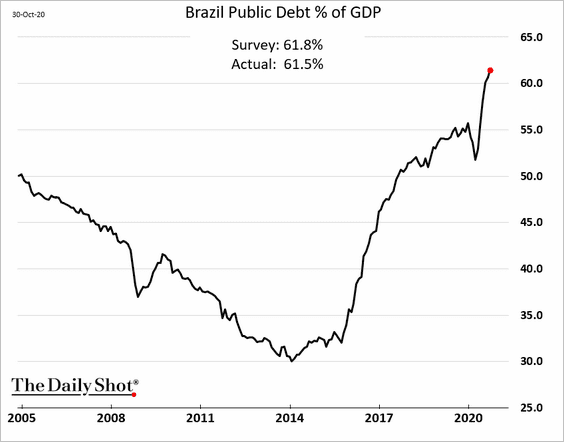
2. Here are some updates on Brazil.
• Unemployment:
• Manufacturing output prices:
• Debt-to-GDP ratio:
——————–
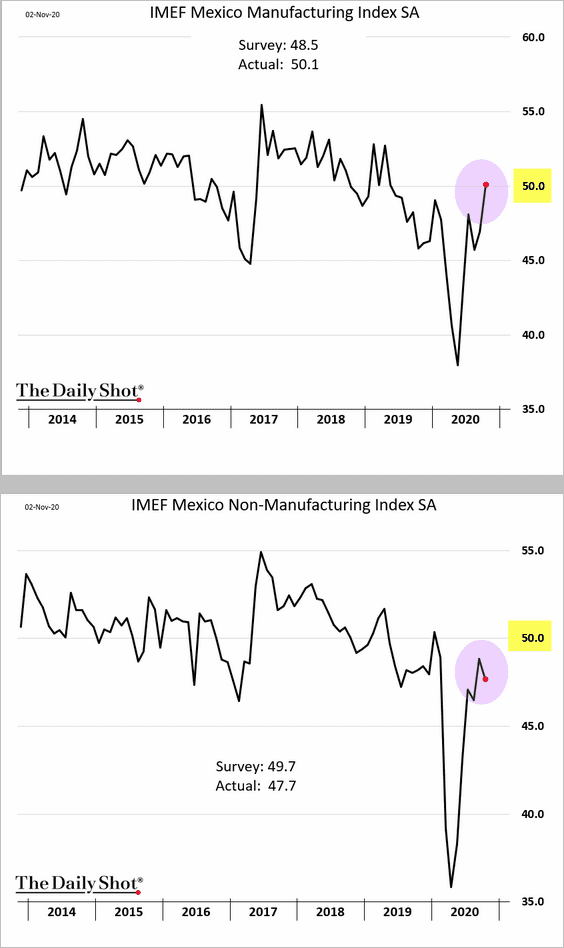
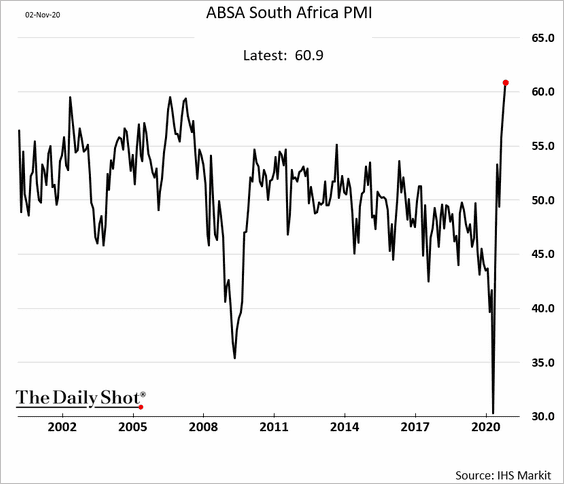
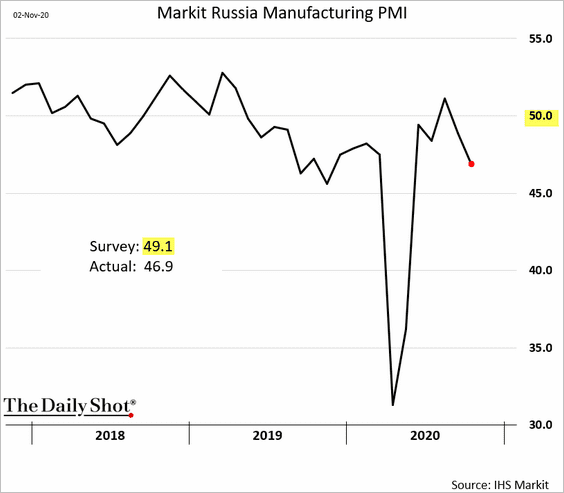
3. Next, let’s look at some manufacturing PMI trends.
• Mexico (manufacturing and services diverge):
• Sout Africa PMI (record high):
• Russia (back in contraction mode):
Energy
1. European oil and gas stocks have been under significant pressure this year.
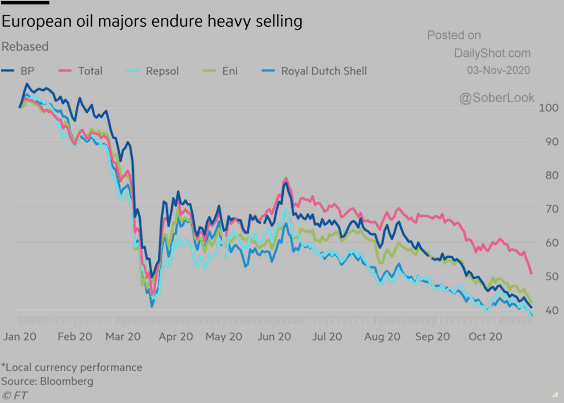 Source: @FT Read full article
Meanwhile, European renewable stocks have rallied.
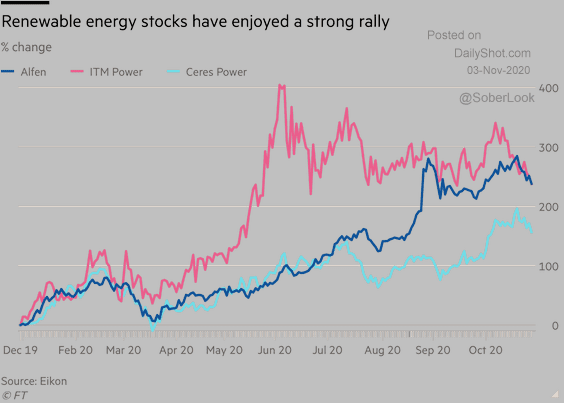 Source: @FT Read full article
——————–
2. Natixis expects a “relatively stable demand for oil, mainly from consumption in emerging countries, and a fairly rapid increase in natural gas consumption.”
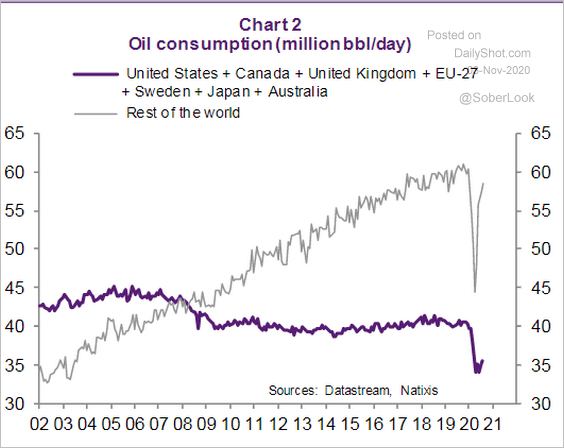 Source: Natixis
3. Negative sentiment in crude oil has reached an extreme versus copper.
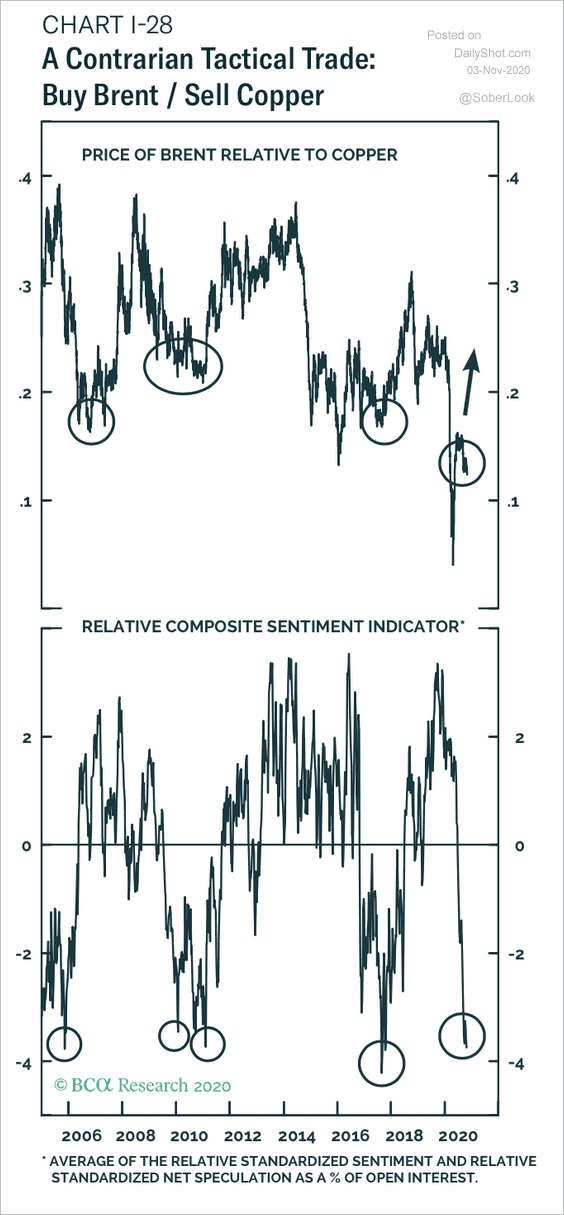 Source: BCA Research
4. Low oil prices have reduced the incentive to invest in R&D and new projects. Have we reached the bottom?
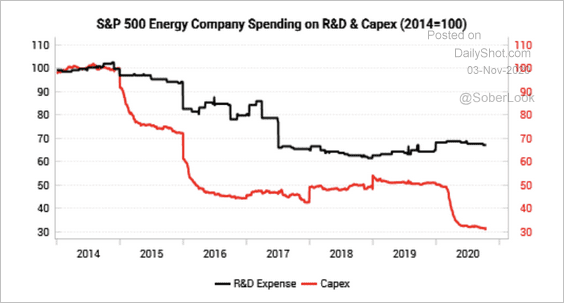 Source: Variant Perception
Equities
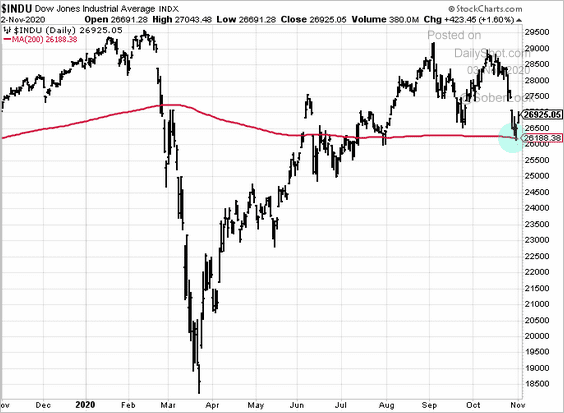
1. The Dow held support at the 200-day moving average.
 h/t Nancy Moran
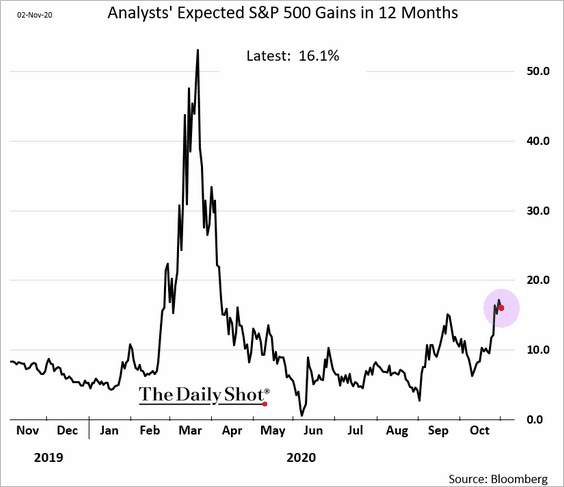
2. Analysts expect the S&P 500 to be up about 16% a year from now.
 h/t Nancy Moran
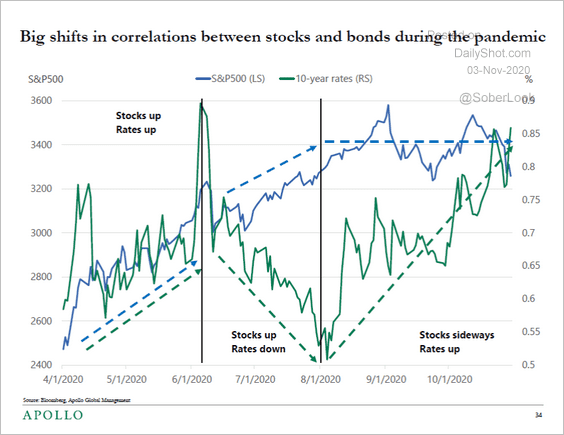
3. We’ve had significant shifts in correlations between stocks and bonds this year.
 Source: Torsten Slok; Apollo Global Management
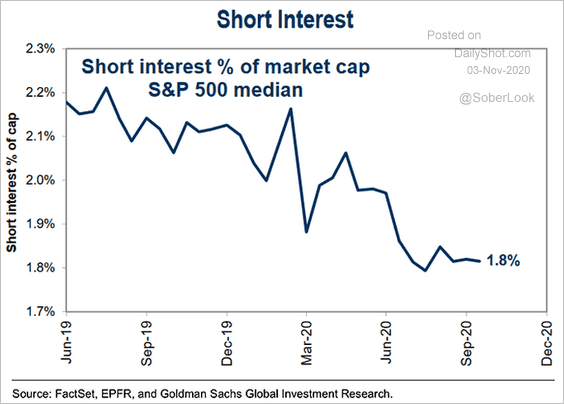
4. Short interest in S&P 500 shares remains depressed.
 Source: @ISABELNET_SA, @GoldmanSachs
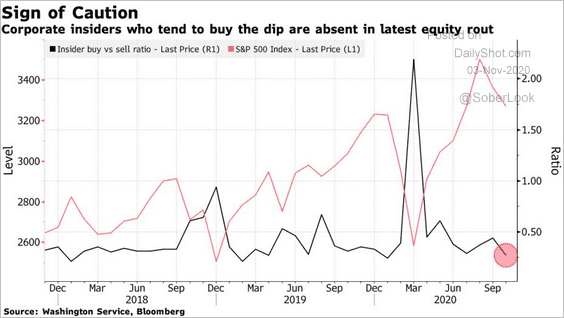
5. Insiders have been staying put ahead of the elections.
 Source: @markets Read full article
6. Speculative accounts have boosted their bets on S&P 500 futures.
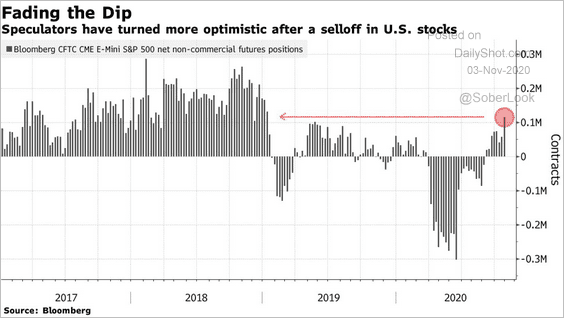 Source: @jessefelder, @markets Read full article
7. Finally, we have some updates on equity factor performance (from S&P Global).
• October and year-to-date returns:
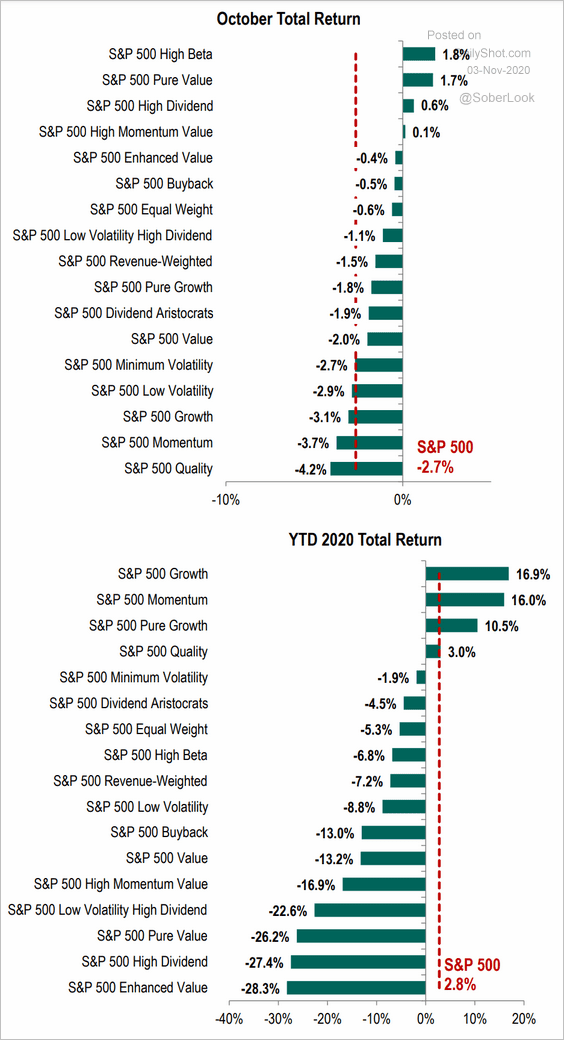 Source: S&P Global Market Intelligence
• Average constituent volatility vs. October returns:
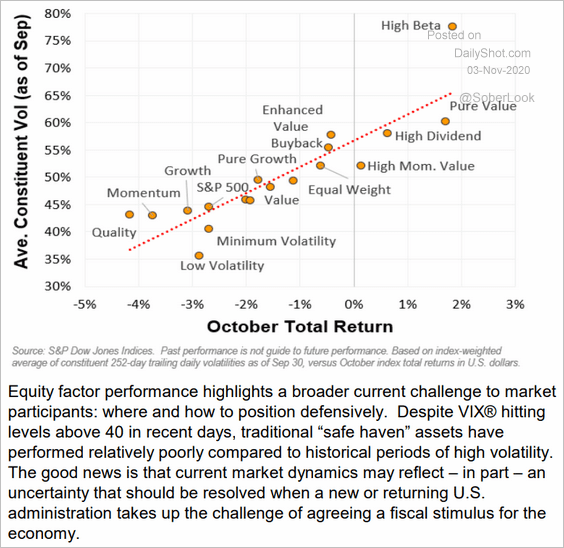 Source: S&P Global Market Intelligence
• Long-term returns vs. vol:
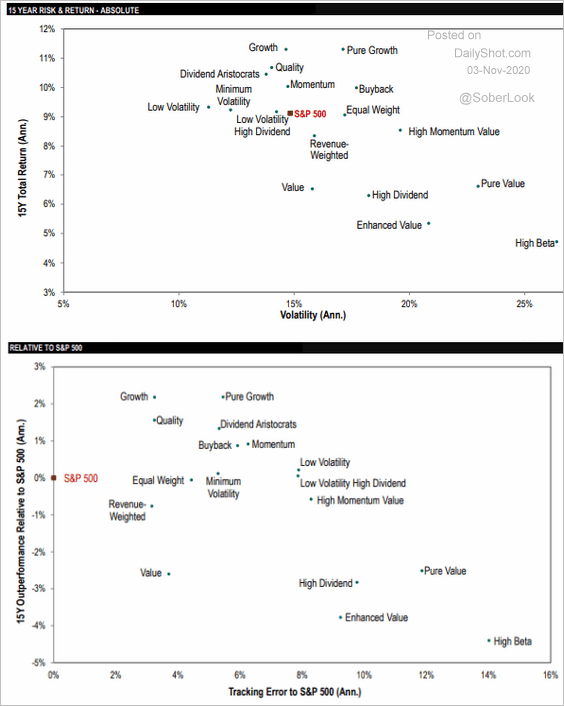 Source: S&P Global Market Intelligence
Rates
1. Fundamentals continue to signal higher Treasury yields (2 charts).
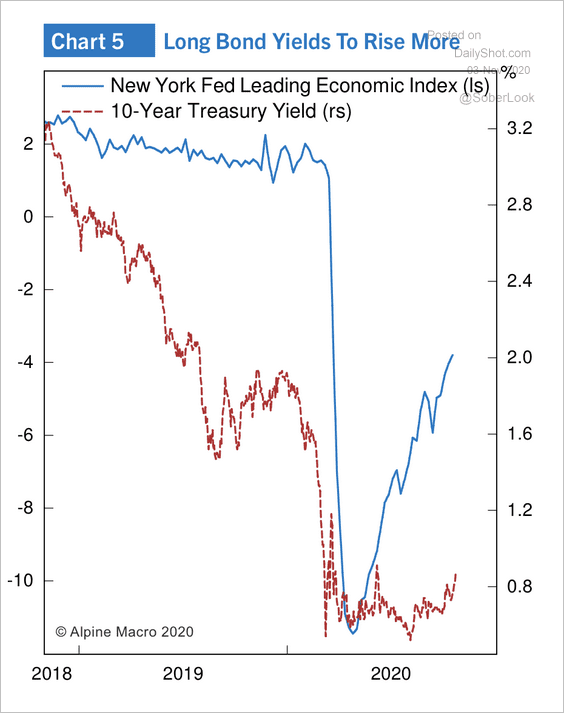 Source: Gavekal
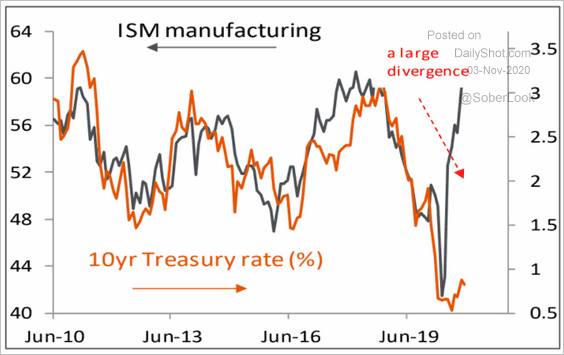 Source: Piper Sandler
——————–
2. QE typically results in higher Treasury yields.
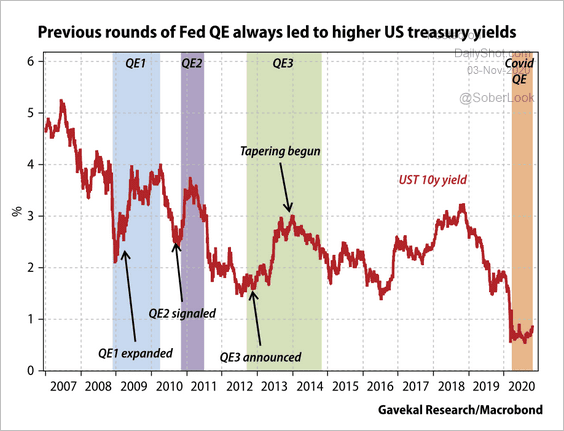 Source: Gavekal
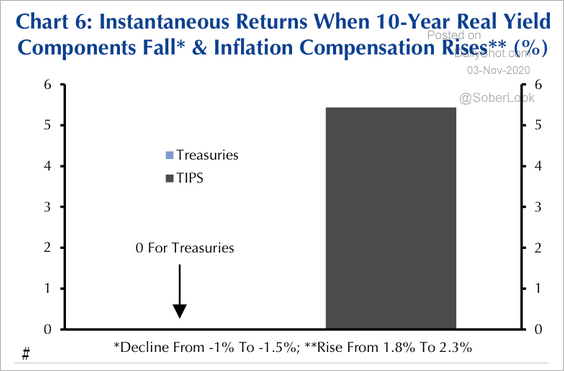
3. The gap in returns for TIPs and Treasuries has been larger for longer-dated maturities this year.
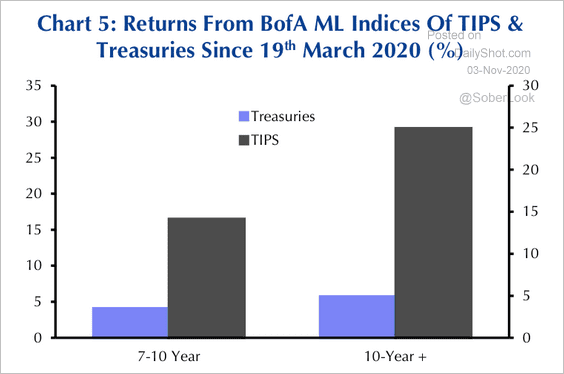 Source: Capital Economics
TIPs significantly outperform Treasuries when real yields fall and inflation expectations rise, according to Capital Economics.
 Source: Capital Economics
Global Developments
1. The global growth outlook will have a significant influence on the dollar over the next 12 months, according to ANZ.
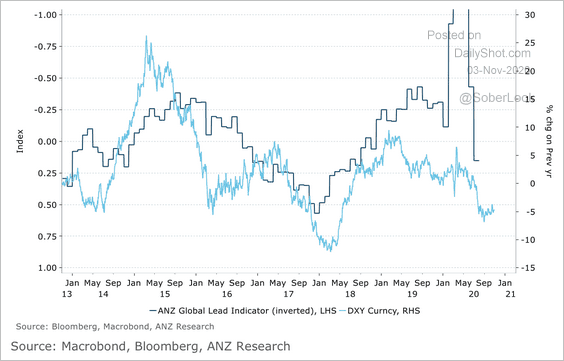 Source: ANZ Research
2. This chart shows asset classes relative to their 50 and 200-day moving averages.
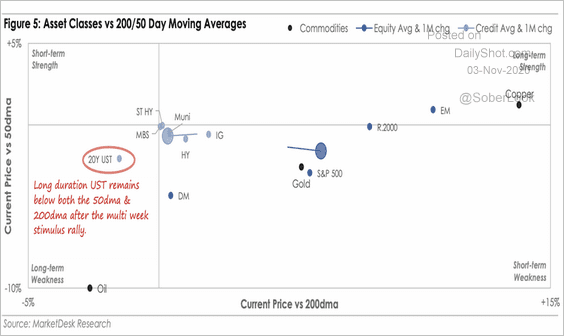 Source: MarketDesk Research
3. How did defensive indices perform last month?
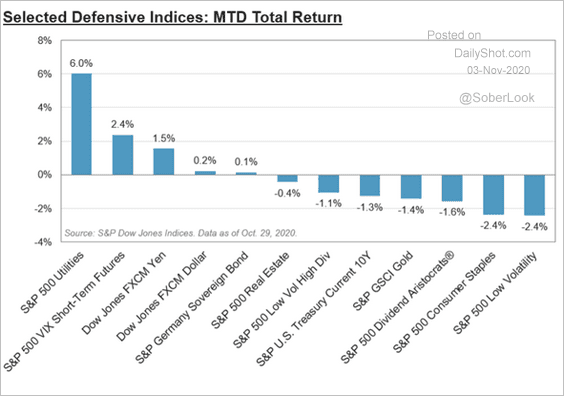 Source: S&P Global Market Intelligence
4. Global manufacturing growth strengthened in October.
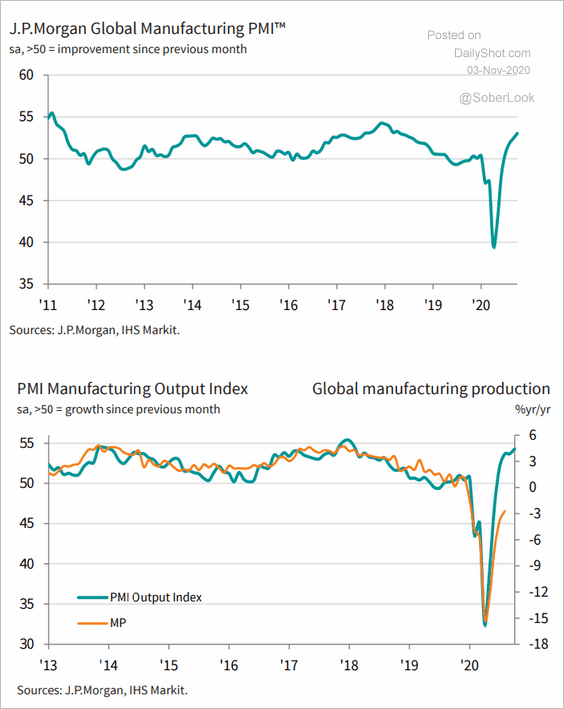 Source: @WilliamsonChris, @IHSMarkit Read full article
——————–
Food for Thought
1. Ability to work from home vs. GDP per capita:
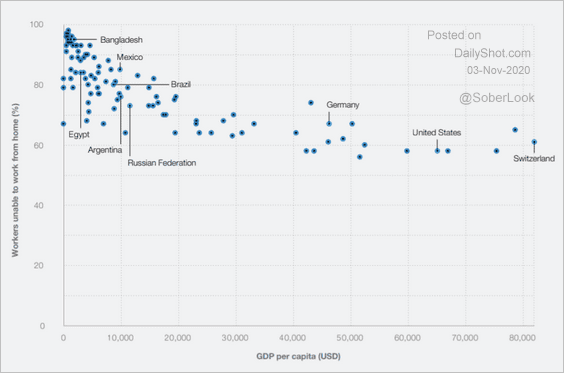 Source: WEF Read full article
2. New York City’s revenue losses:
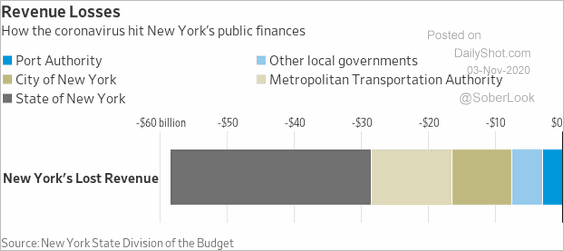 Source: @WSJ Read full article
3. States with best economic performance:
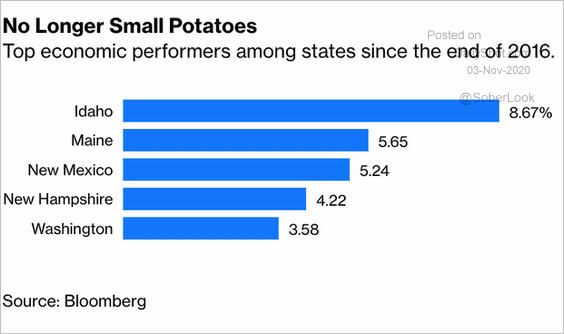 Source: @bopinion Read full article
4. US airline ticket prices:
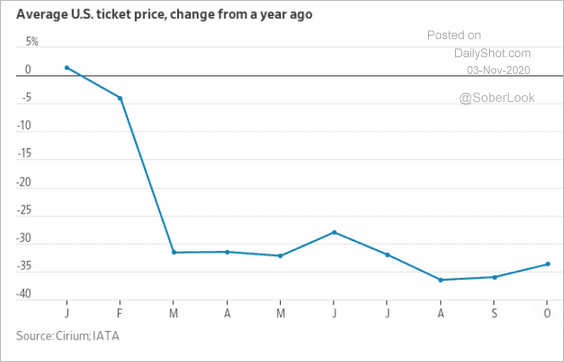 Source: @WSJ Read full article
5. When do you expect to meet more than a handful of clients face to face?
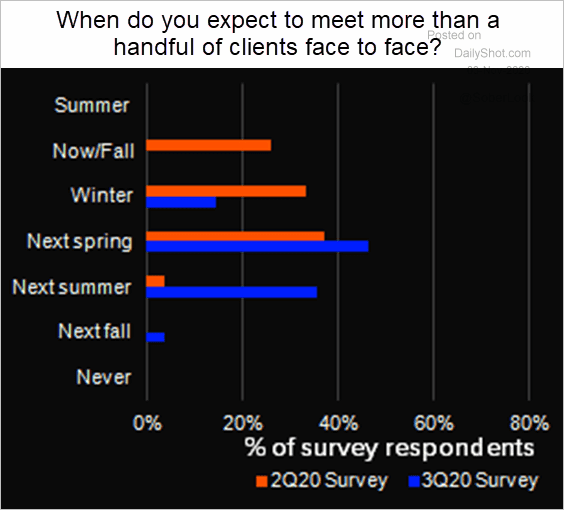 Source: @LPCLoans
6. What if the US were a multi-party Democracy?
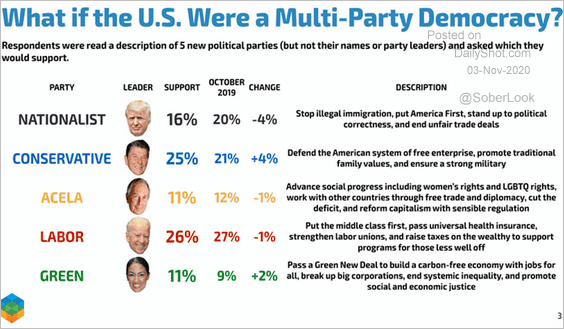 Source: Echelon Insights
Who would support these parties?
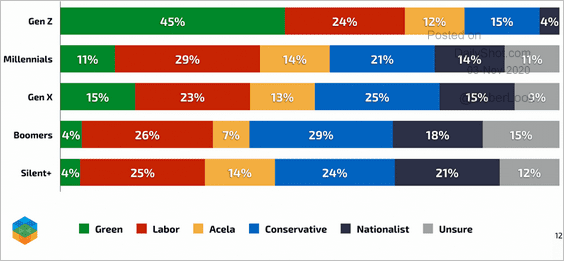 Source: Echelon Insights
——————–
7. Competing claims over the Eastern Mediterranean:
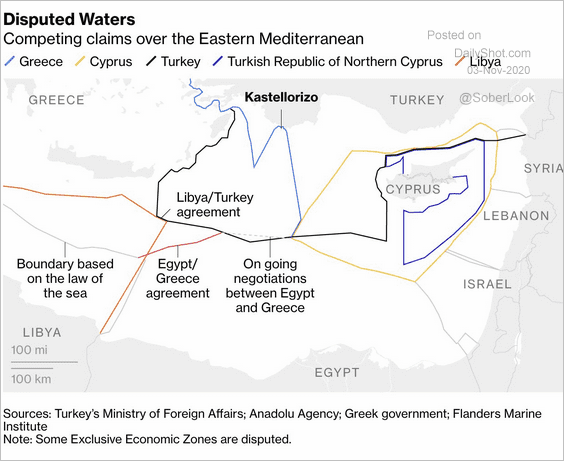 Source: @bopinion Read full article
8. Headache types:
 Source: CHI Health Read full article
9. Barbie doll sales:
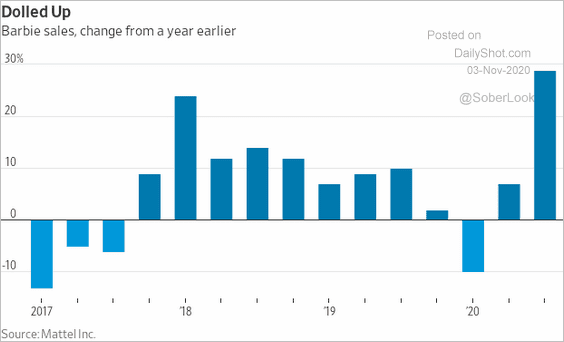 Source: @WSJ Read full article
——————–