
The Daily Shot: 04-Nov-20
• The United States
• The Eurozone
• Europe
• Asia – Pacific
• China
• Emerging Markets
• Cryptocurrency
• Commodities
• Energy
• Equities
• Credit
• Rates
• Global Developments
• Food for Thought
The United States
1. While the US election is still too close to call, as of 3:00 AM EST, the betting markets were projecting a victory for President Trump.
• The electoral map:
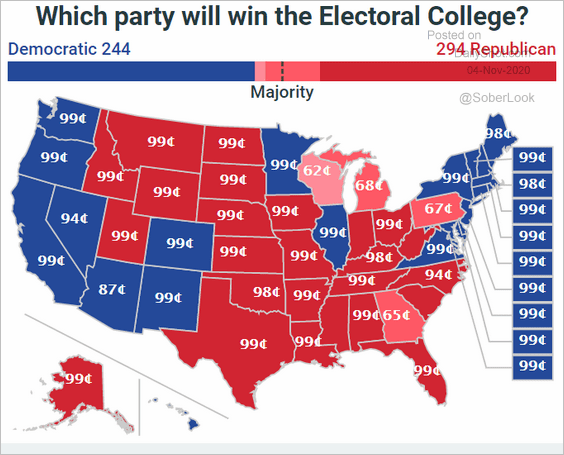 Source: @PredictIt
• Probability of victory based on the betting markets (2 charts):
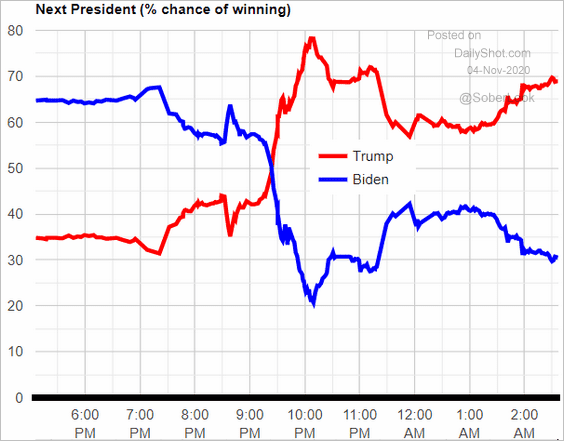 Source: ElectionBettingOdds.com
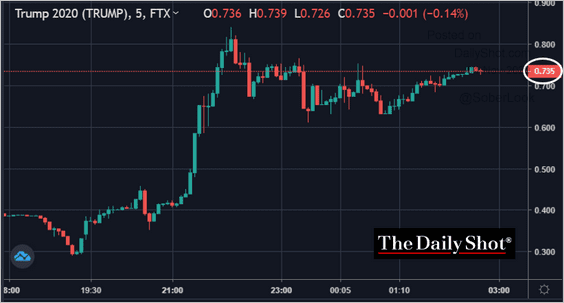 Source: FTX
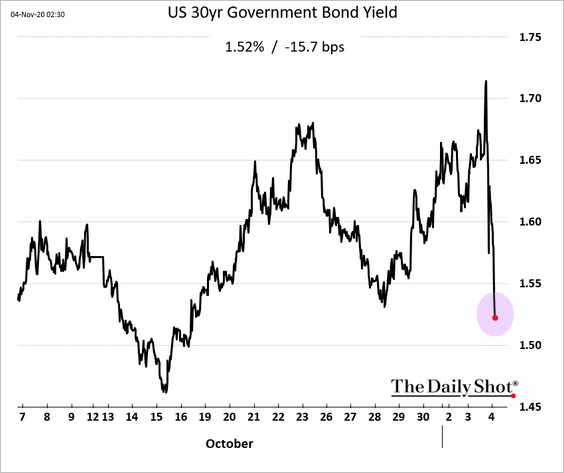
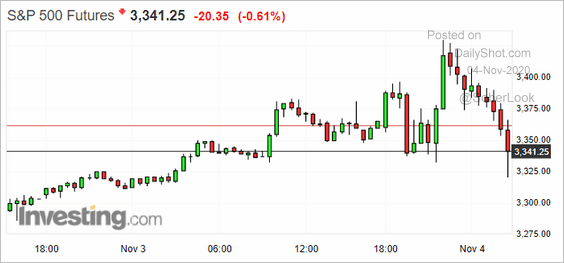
That is not the outcome global markets have been expecting.
• Treasury yields tumbled due to lower chances of a massive fiscal stimulus package.
• Stock futures first rallied but later reversed course. This is also due to lower chances of stimulus as well as a possibility of contested election results.
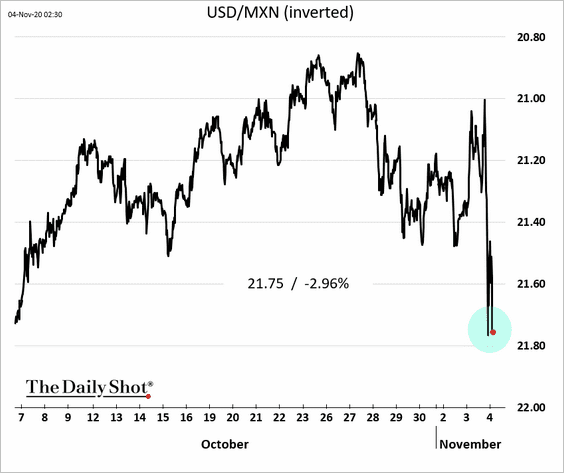
• The Mexican peso tumbled 3%.
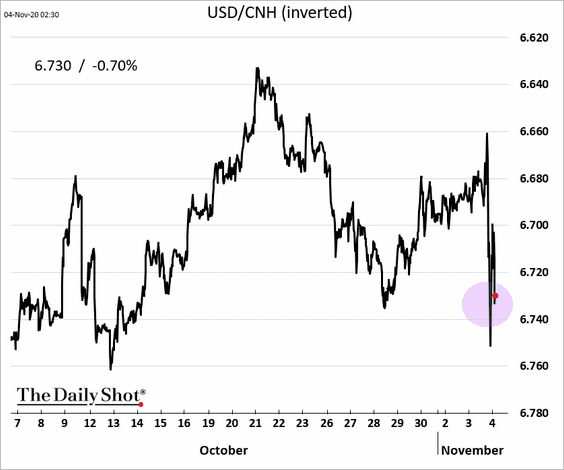
• The yuan is also under pressure.
——————–
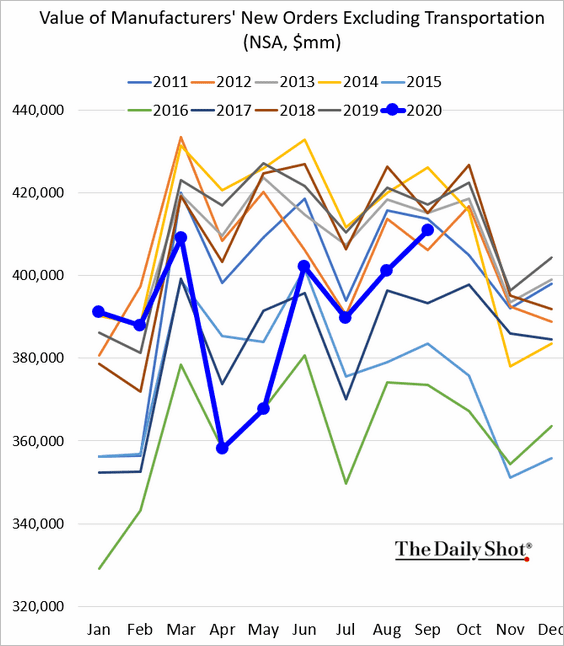
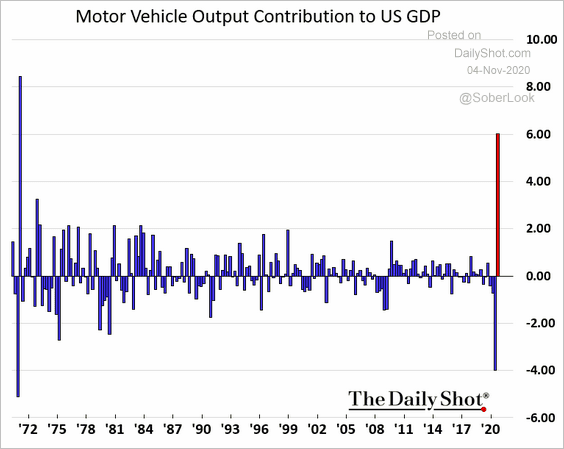
2. US manufacturing orders continue to recover but remain below last year’s levels.
• Will motor vehicles continue to power the nation’s manufacturing recovery? Here is the sector’s contribution to the GDP (%, through Q3).
 h/t Melinda Grenier
——————–
3. Companies are becoming more comfortable with remote workers and increasingly see this shift improving productivity.
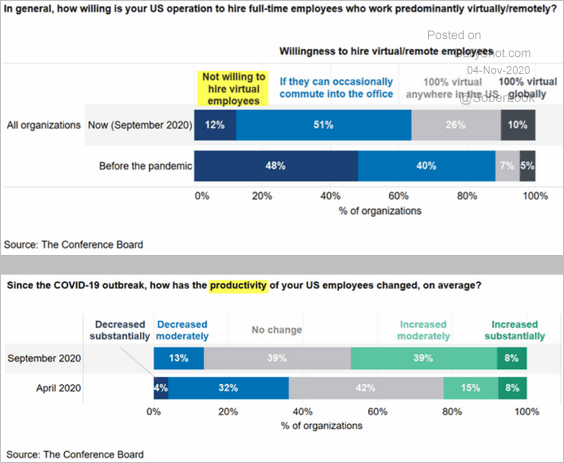 Source: The Conference Board
US businesses have been able to operate with a smaller workforce, which is also boosting productivity. Will we see higher profits and CapEx as a result of these trends?
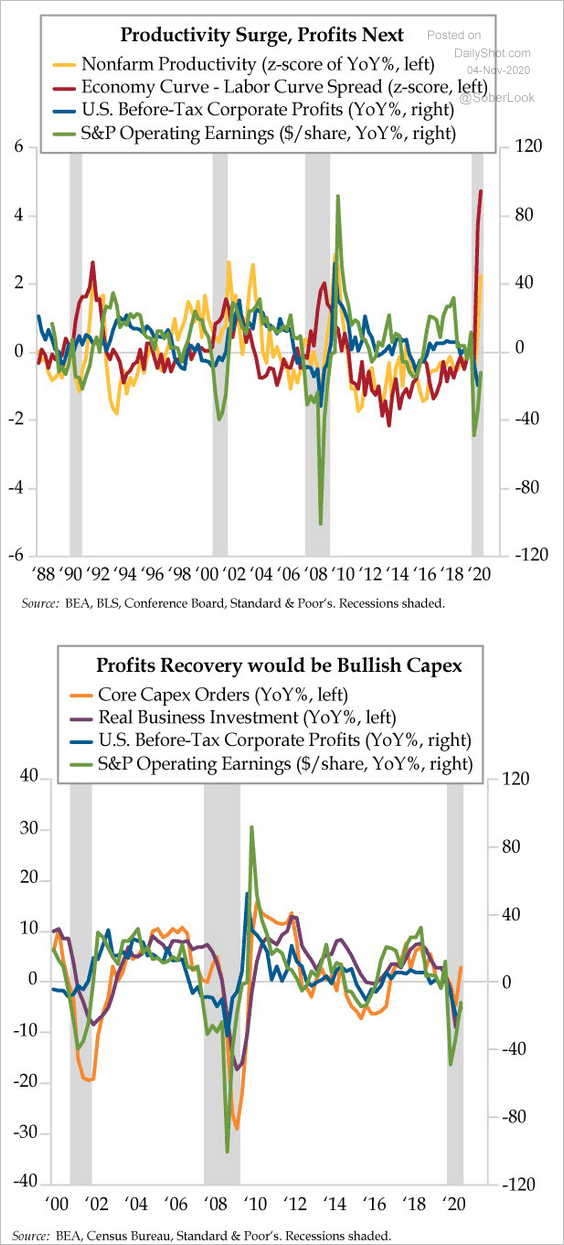 Source: The Daily Feather
——————–
4. Small Business employment remains depressed, according to Paychex/IHS Markit Small Business Employment Watch.
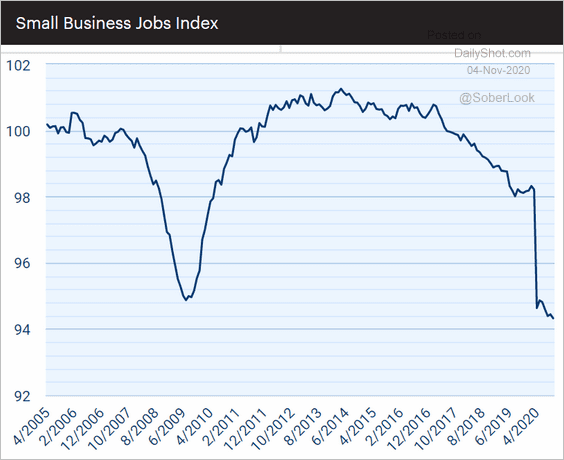 Source: Paychex/IHS Markit Small Business Employment Watch Read full article
5. Household income and savings rates are heading toward pre-pandemic levels.
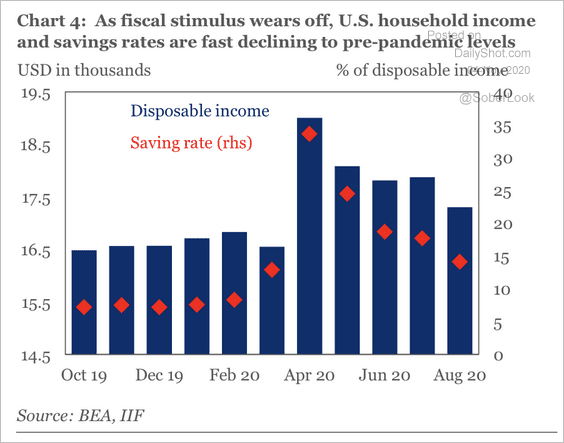 Source: IIF
6. A substantial percentage of US households are tapping their retirement savings this year.
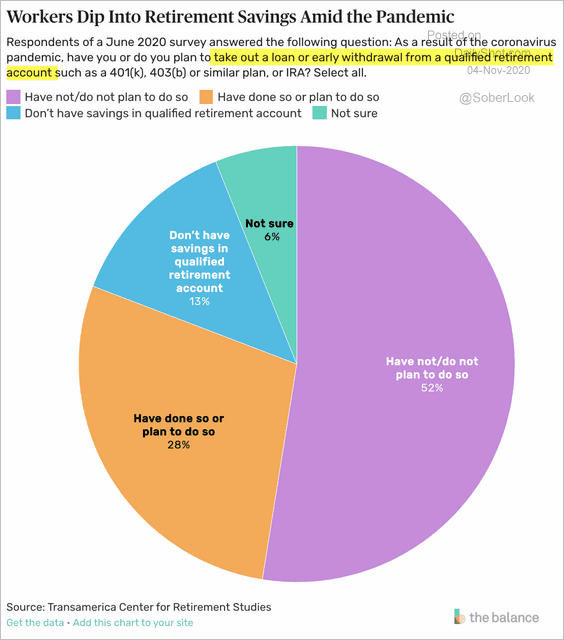 Source: Investopedia, The Balance
7. Finally, this chart shows the 2020 state-government employment vs. previous years.
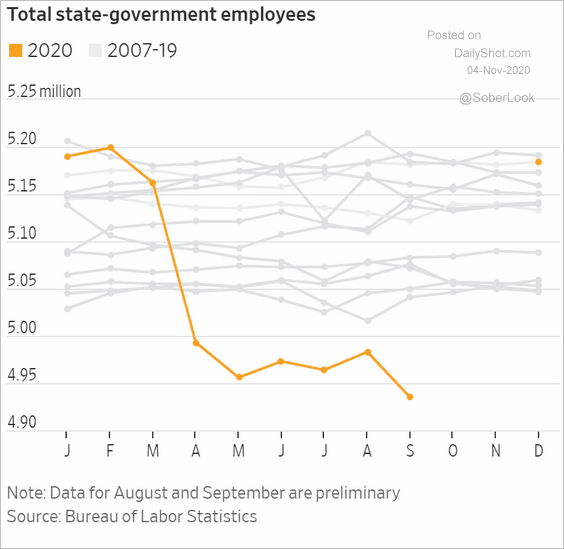 Source: @WSJ Read full article
The Eurozone
1. Based on the ECB’s official communications, the central bank has been increasingly dovish as it gears up for further bond buying in December.
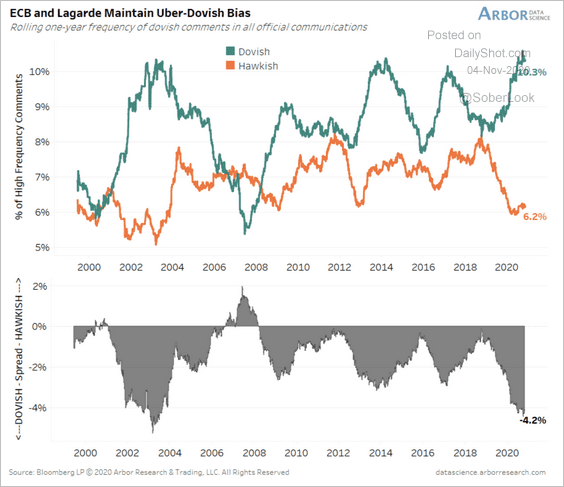 Source: Arbor Research & Trading
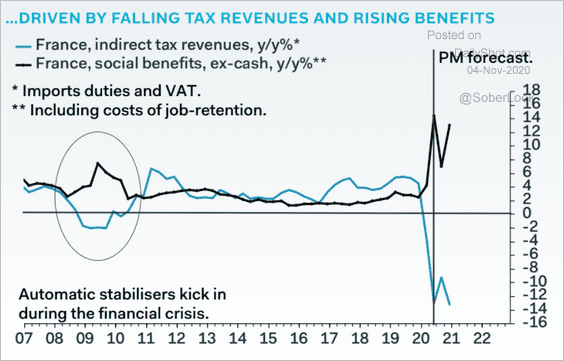
2. The fiscal situation in France has deteriorated sharply (2 charts).
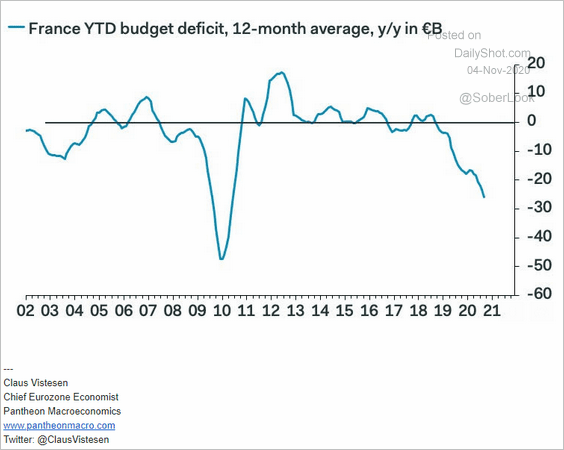 Source: Pantheon Macroeconomics
 Source: Pantheon Macroeconomics
——————–
3. Here is the total debt growth in the first half of 2020, by country.
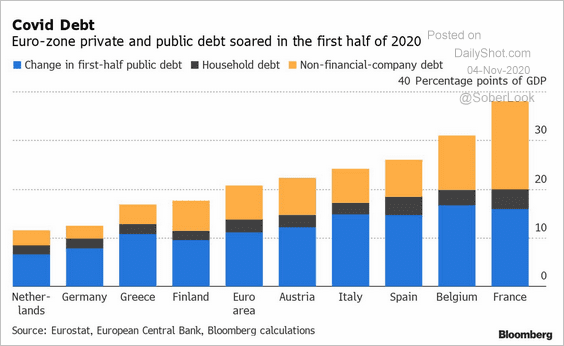 Source: @markets Read full article
4. Below are a couple of updates on Germany.
• German industrial employment by sector:
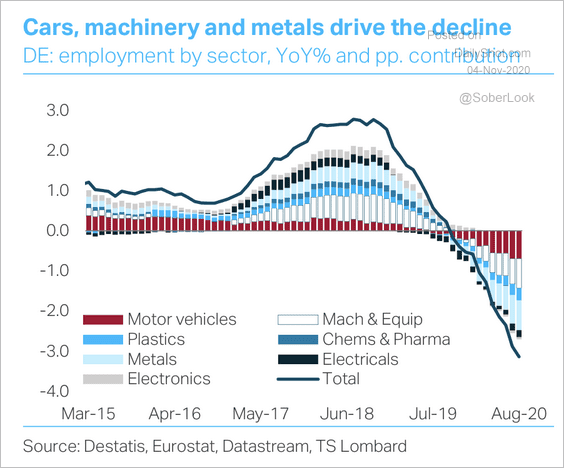 Source: TS Lombard
• Occupied intensive care beds:
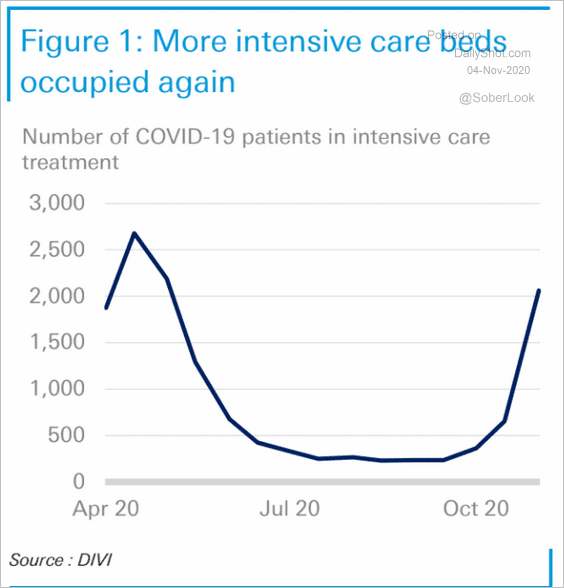 Source: Deutsche Bank Research
——————–
5. Finally, we have the Eurozone’s (and EU’s) overall tax-to-GDP ratio.
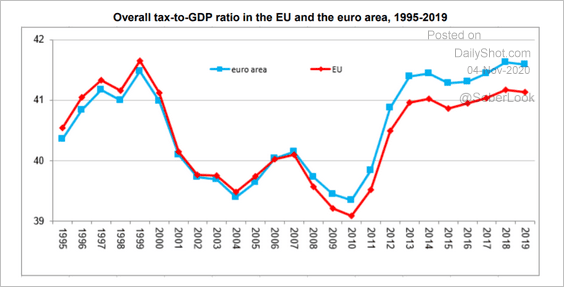 Source: Eurostat Read full article
Europe
1. What should we expect from the Bank of England on Thursday, and what will be the impact on the markets?
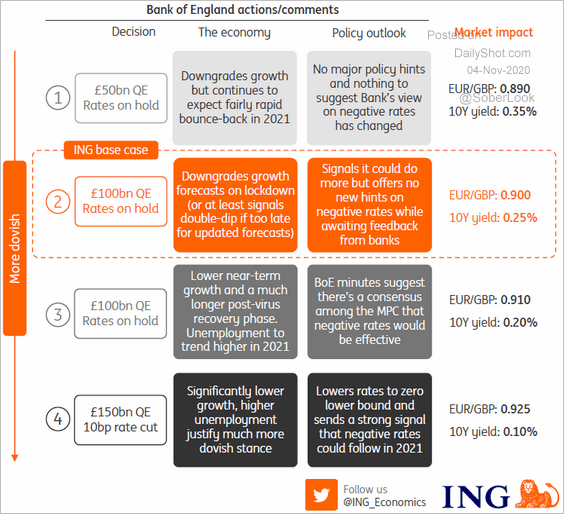 Source: ING
2. This chart compares electricity prices across the EU.
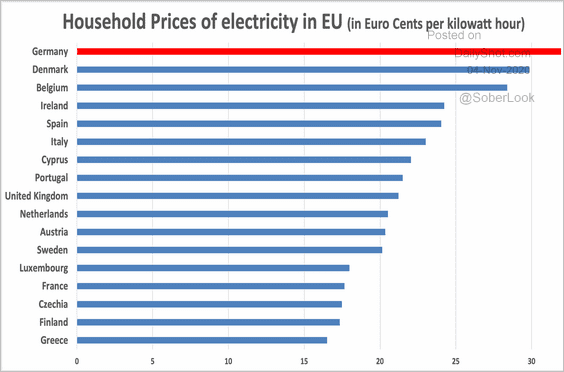 Source: @Schuldensuehner
Asia – Pacific
1. Japan’s private sector has run a large savings surplus over the past 30 years.
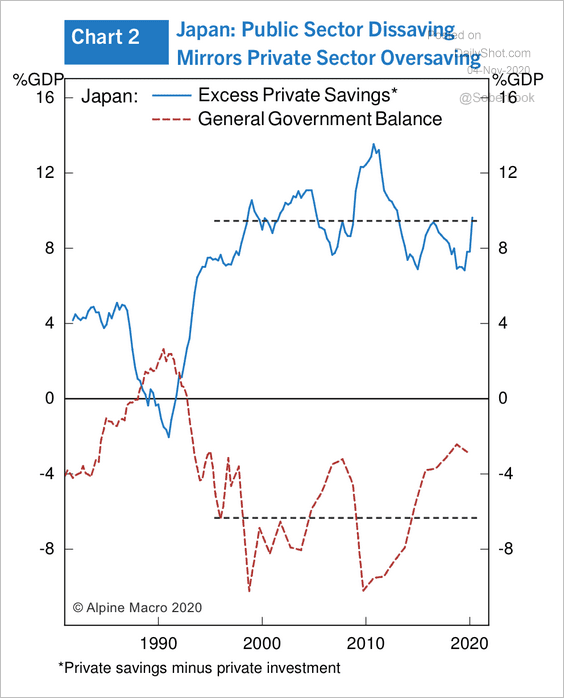 Source: Alpine Macro
2. Taiwan’s manufacturing recovery has outpaced China and Korea.
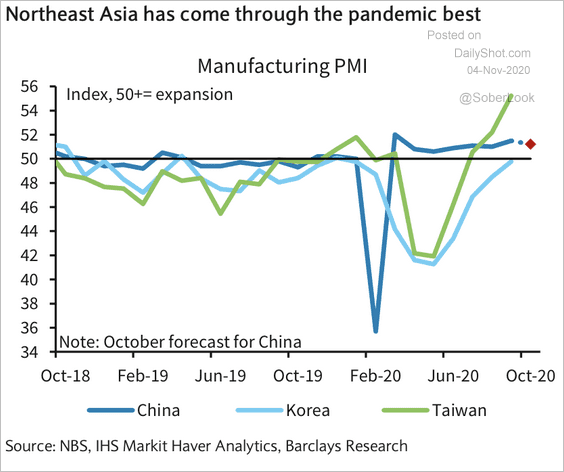 Source: Barclays Research
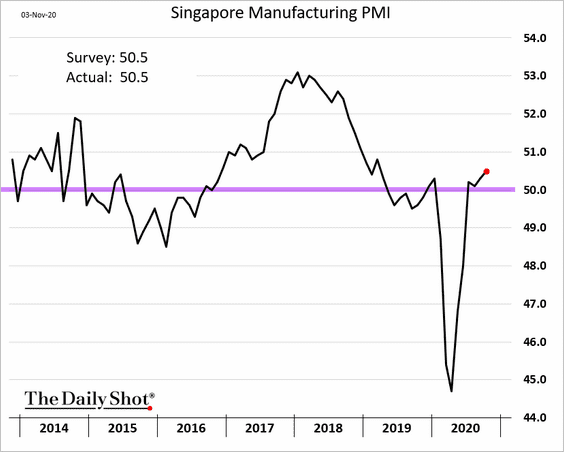
3. Singapore’s factory activity strengthened in October.
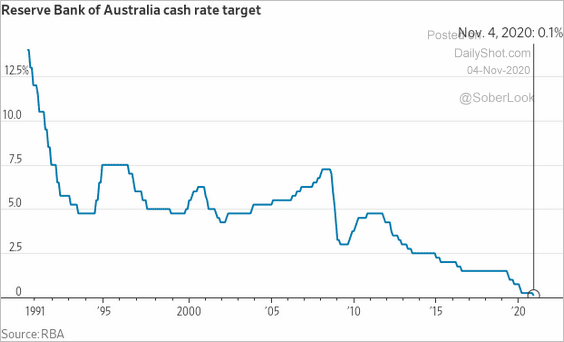
4. The RBA cut rates (as expected) and announced a A$ 100 bond-buying program.
 Source: @WSJ Read full article
China
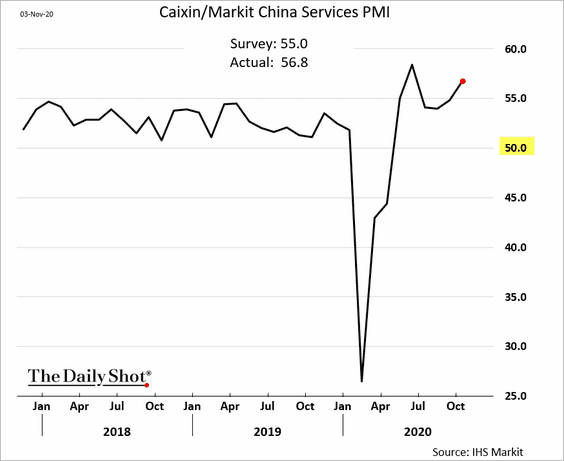
1. Service sector growth accelerated last month, as China’s economy continues its impressive rebound.
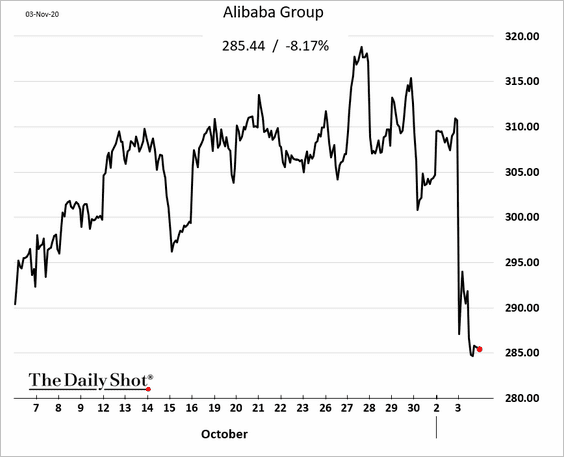
2. Beijing halted the Ant Group IPO, with regulators now planning to discourage banks from working with the firm. There seems to be some concern about Ant’s size posing risks for the financial system.
 Source: @technology Read full article
——————–
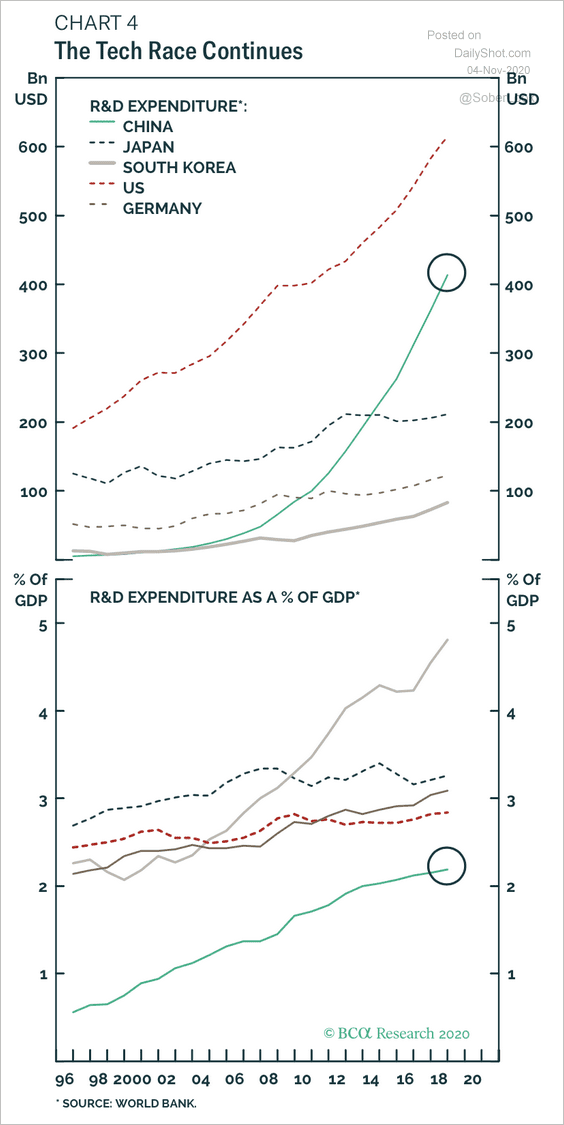
3. China’s spending on research and development has accelerated in recent years (although R&D is flattening out as a percent of GDP).
 Source: BCA Research
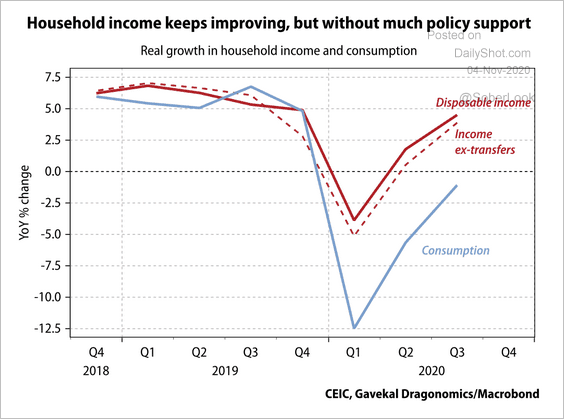
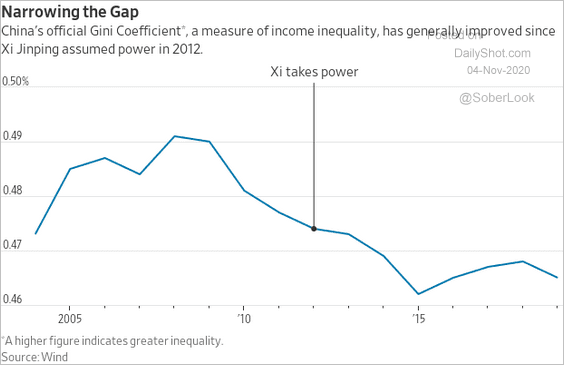
4. Disposable income is improving but may require additional government support to encourage spending.
 Source: Gavekal
5. Here is China’s Gini Coefficient.
 Source: @jeffsparshott, @WSJ
Emerging Markets
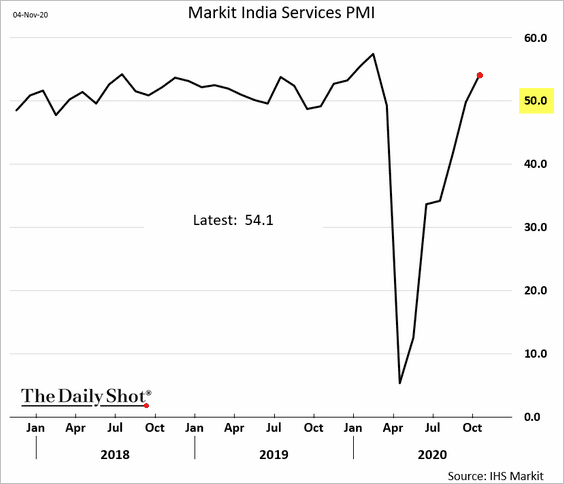
1. India’s service sector is now firmly in growth mode.
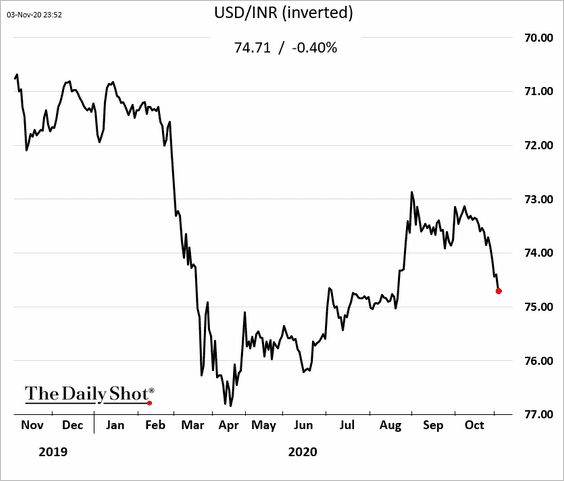
The rupee continues to slide.
——————–
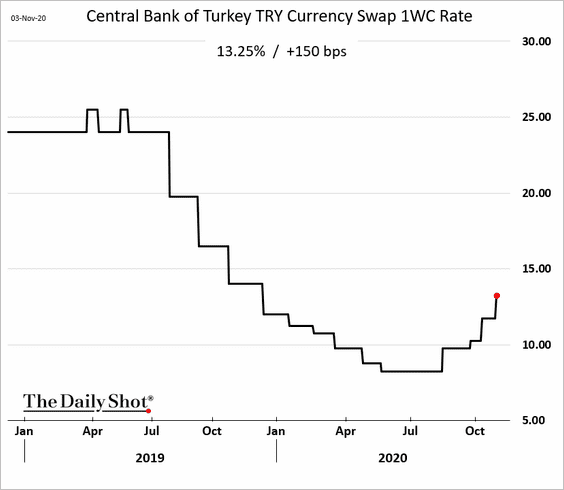
2. Worried about the lira’s persistent decline, the Turkish central bank tightened liquidity (by raising the currency swap rate).
 Source: Daily Sabah Read full article
 Source: @TheTerminal, Bloomberg Finance L.P.
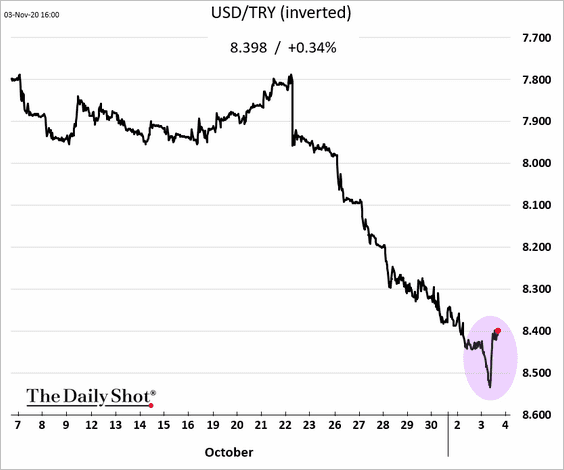
The currency bounced from the lows.
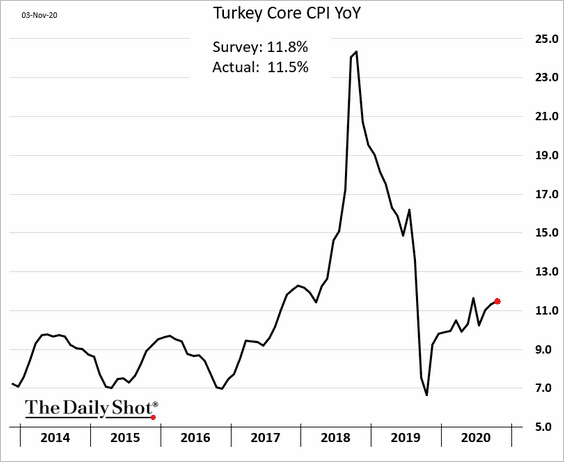
• The lira’s extreme weakness will keep putting upward pressure on inflation.
• The government continues to rely on domestic funding for the bulk of its budget financing.
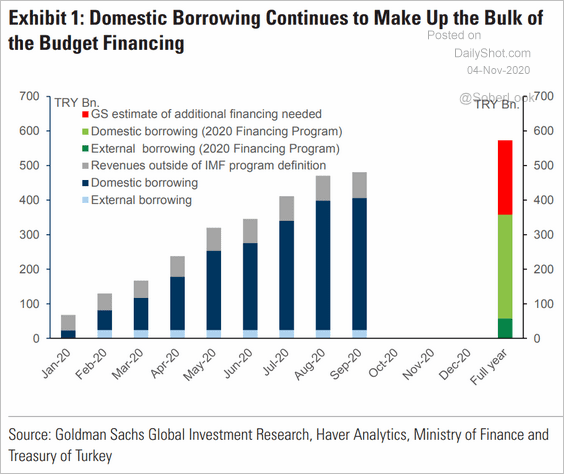 Source: Goldman Sachs
——————–
3. Egypt’s business activity is expanding at the fastest pace in years.
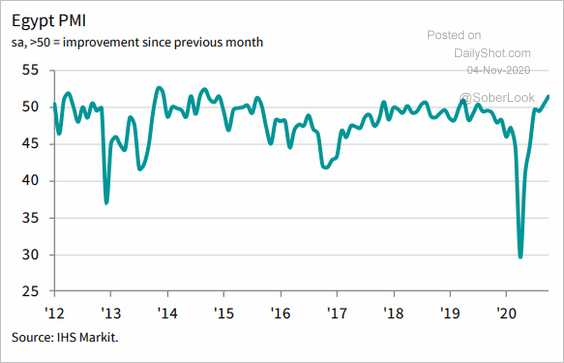 Source: IHS Markit Read full article
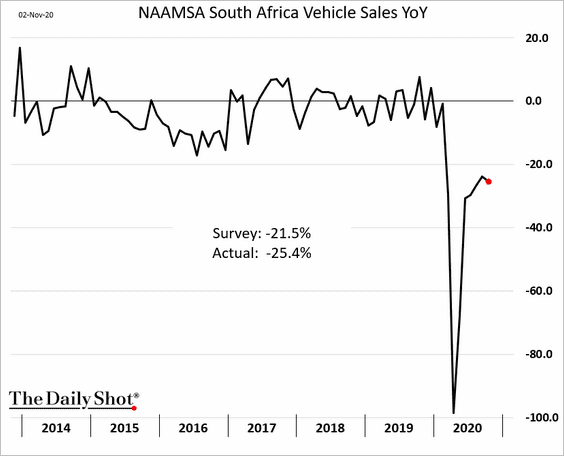
4. South Africa’s vehicle sales recovery has stalled.
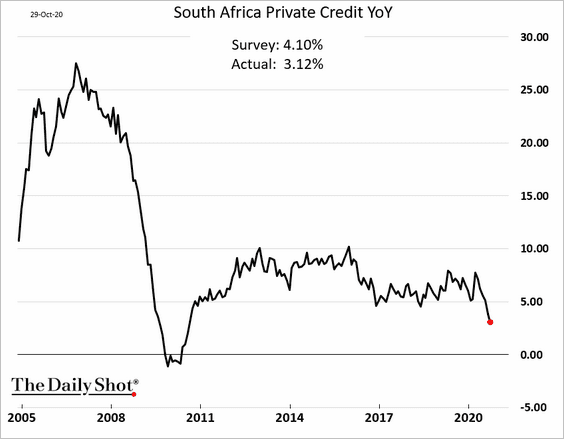
And credit growth continues to slow.
——————–
5. In Nigeria, nominal GDP growth is above short-term rates. This leaves room for the currency to fall and government spending to rise, according to BCA Research.
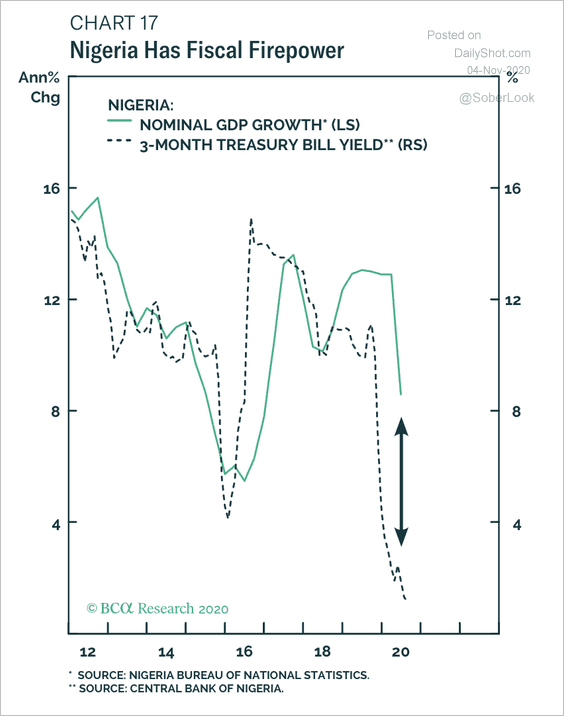 Source: BCA Research
6. Mexico’s recovery has a long way to go.
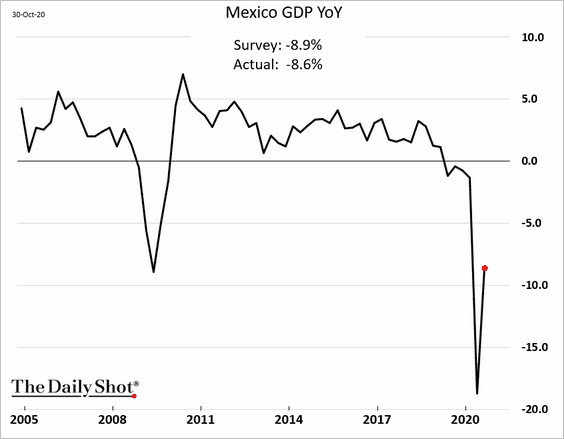
• Markit’s manufacturing PMI report suggests that Mexican factory activity is still in contraction mode (PMI < 50).
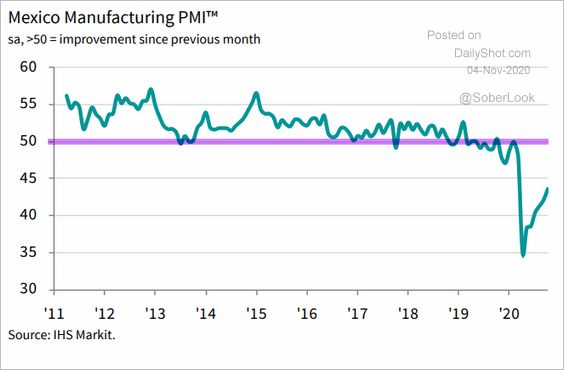 Source: IHS Markit Read full article
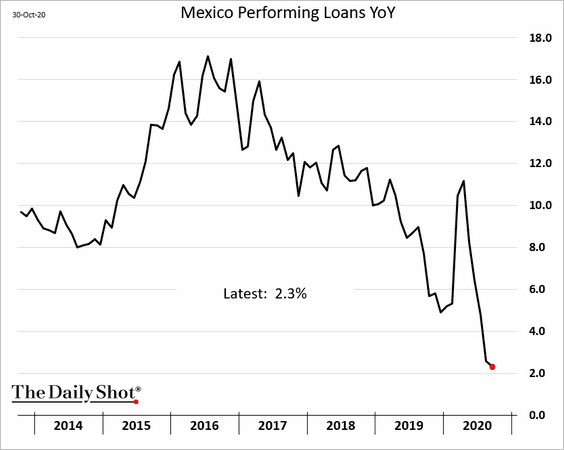
• Loan growth has been slowing.
——————–
7. Brazil’s manufacturing PMI hit a record high, with the Markit report showing some price pressures.
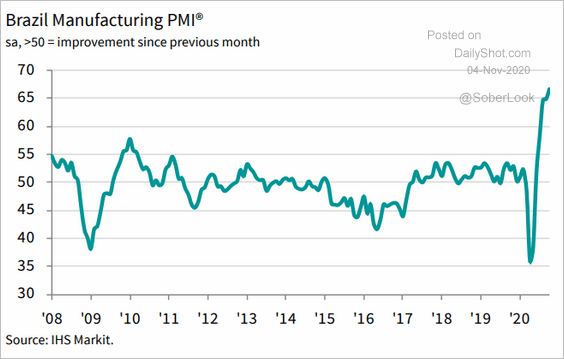 Source: IHS Markit Read full article
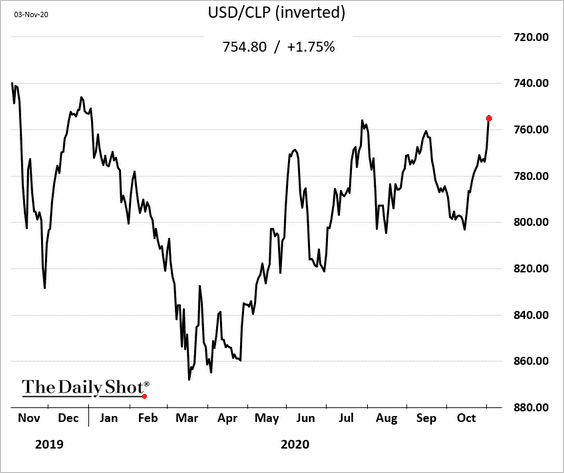
8. The Chilean peso hit the highest level since early January.
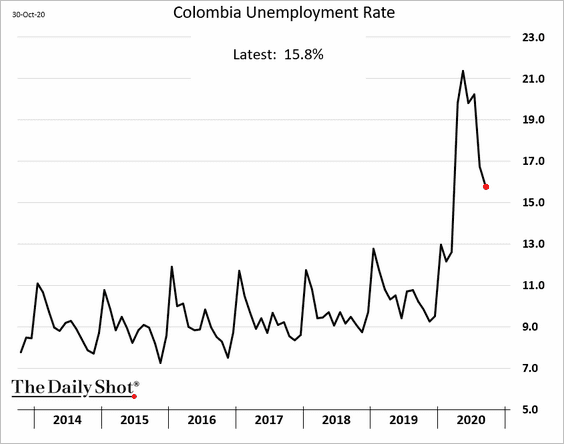
9. Colombia’s labor market continues to recover.
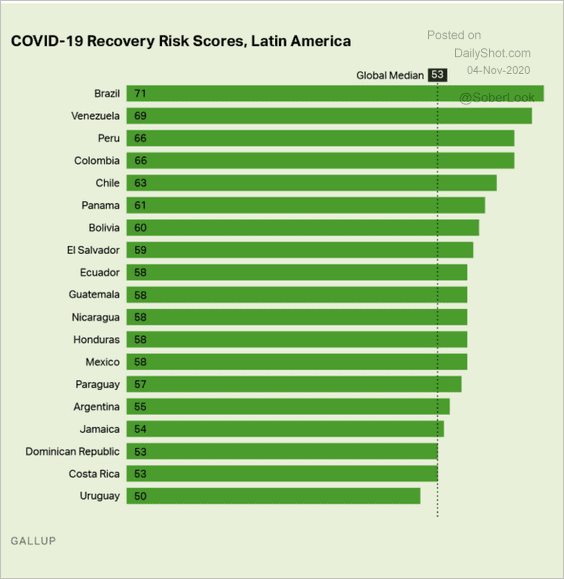
10. These charts from Gallup show which countries “are most likely to struggle with long-term efforts to deal with COVID-19 outbreaks and setbacks, according to a new measure that combines Gallup World Poll and Wellcome Global Monitor.”
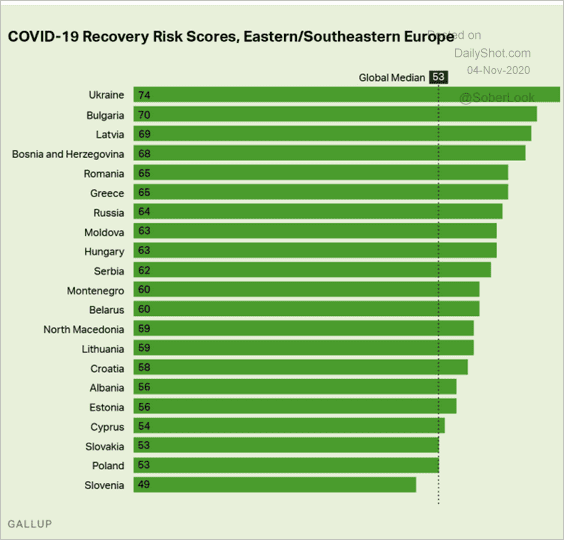 Source: Gallup Read full article
 Source: Gallup Read full article
Cryptocurrency
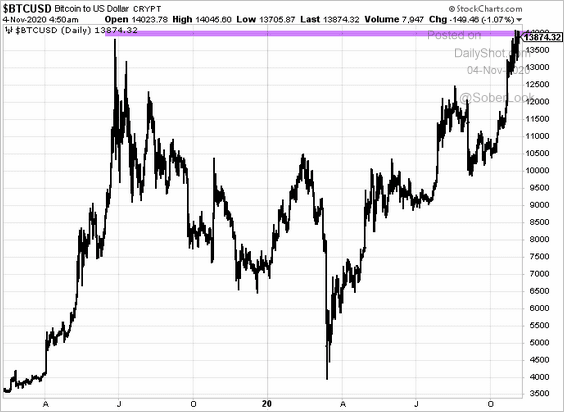
1. Bitcoin continues to test the $14k resistance.
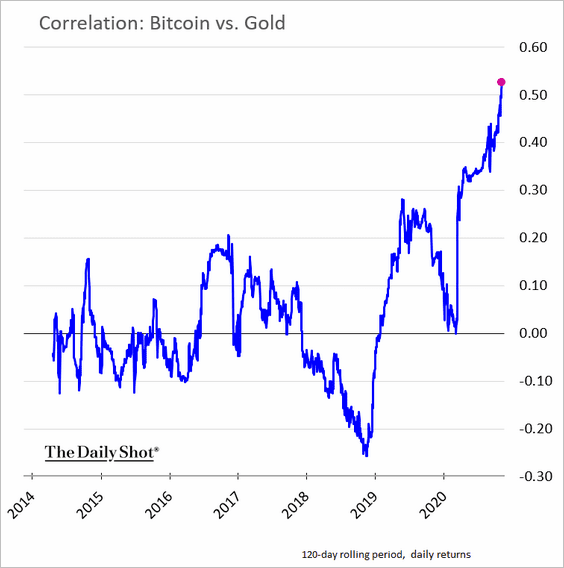
2. The correlation between Bitcoin in gold is at a multi-year high.
Commodities
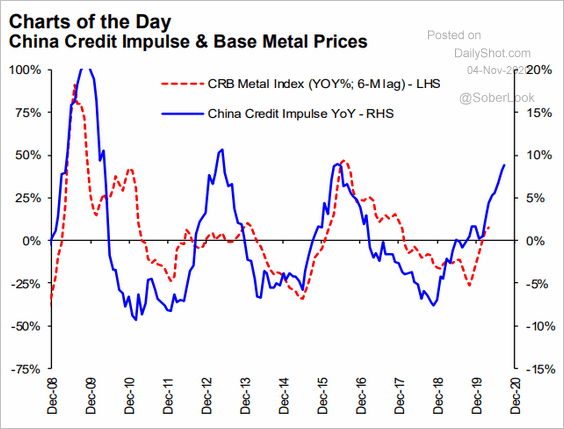
1. China’s credit impulse points to further upside for industrial metals.
 Source: Hugo Ste-Marie, Portfolio & Quantitative Strategy Global Equity Research, Scotia Capital
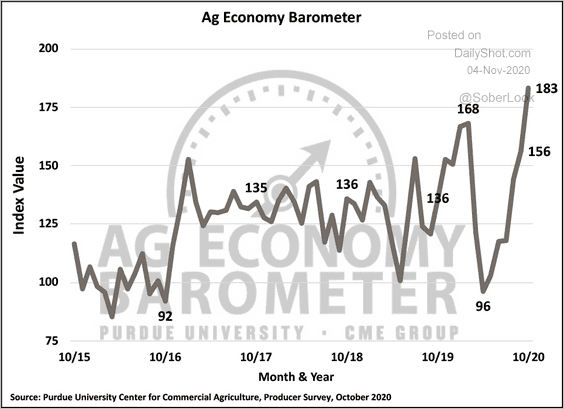
2. US farmers’ sentiment continues to climb as agricultural commodity prices rebound.
 Source: Purdue University/CME Group Ag Economy Barometer
Energy
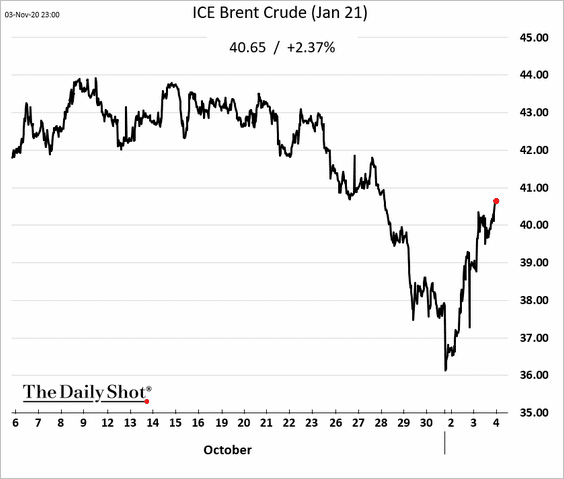
1. The active Brent crude contract is back above $40/bbl (there has been some talk of additional OPEC+ production cuts).
2. Global “at-risk” crude oil production has bottomed as Libya restarts output.
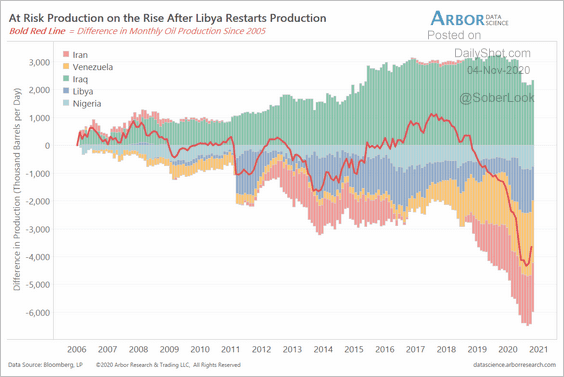 Source: Arbor Research & Trading
3. This chart shows US employment in renewables and fossil-fuel sectors.
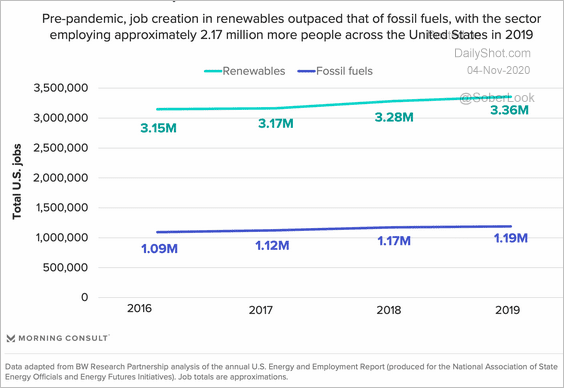 Source: Morning Consult
Equities
1. The tech mega-caps drove a great deal of the recent valuation spike in the S&P 500.
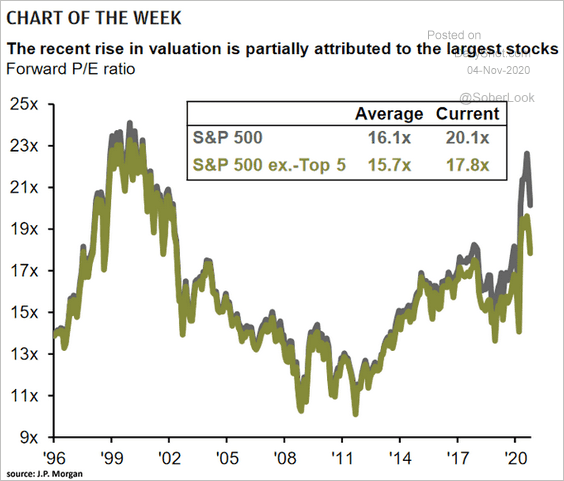 Source: @ISABELNET_SA, @JPMorganAM
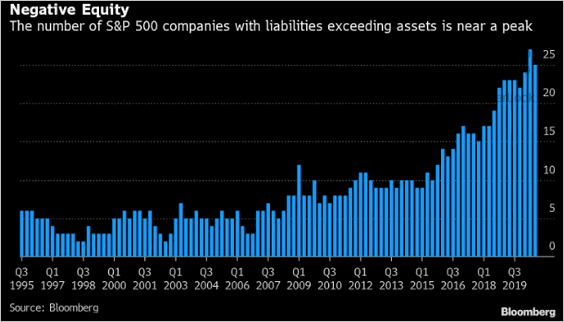
2. More of the S&P 500 firms now have negative equity.
 Source: @TheOneDave
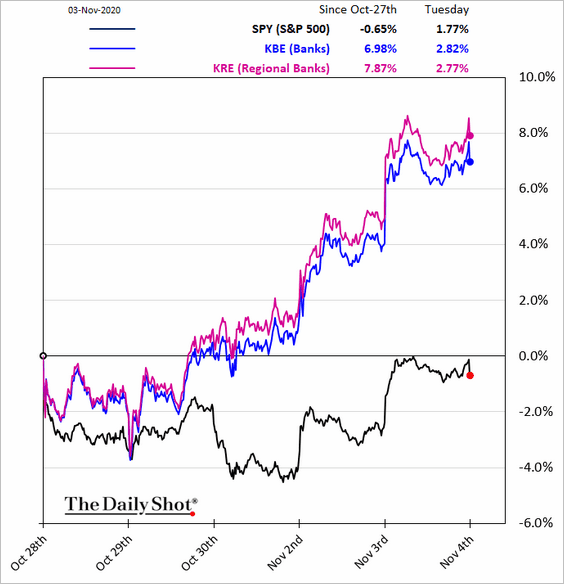
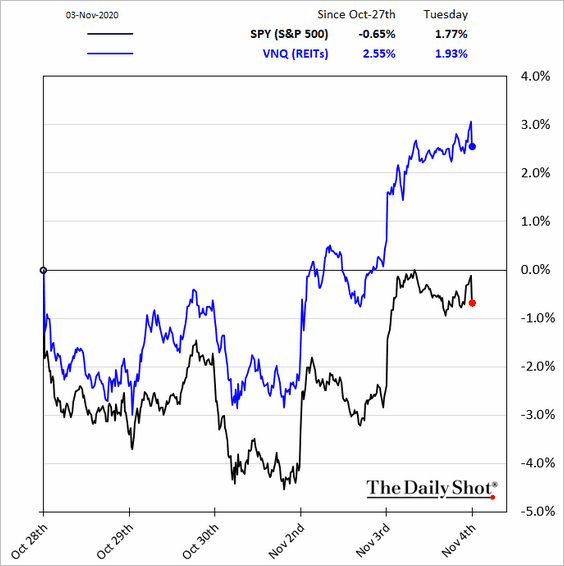
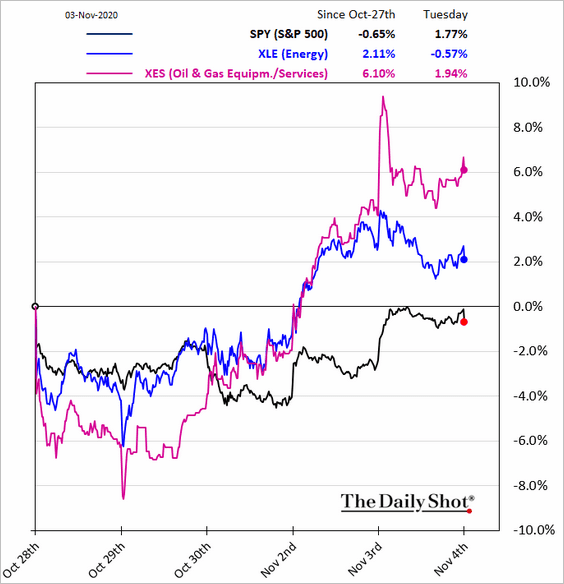
3. Next, we have some sector trends.
• Banks:
• REITs:
• Energy:
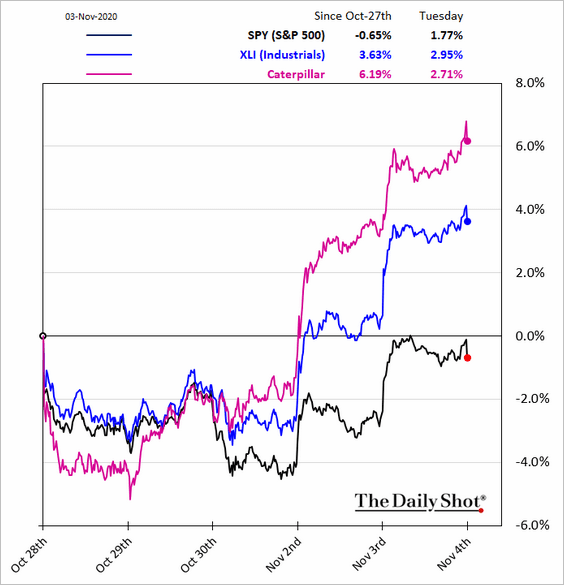
• Industrials:
• Transportation:
![]()
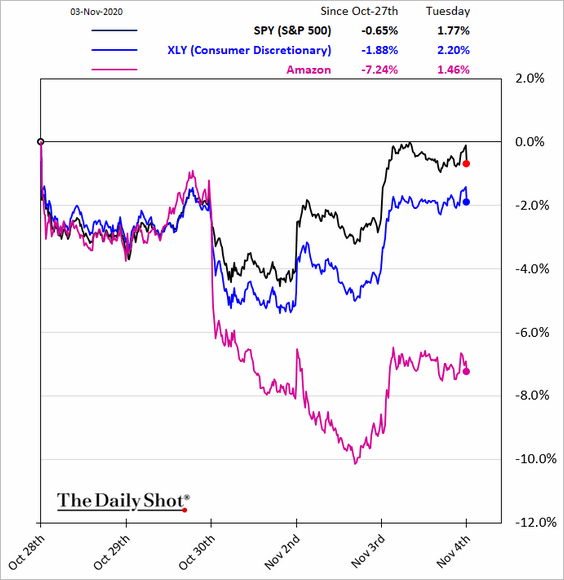
• Consumer Discretionary:
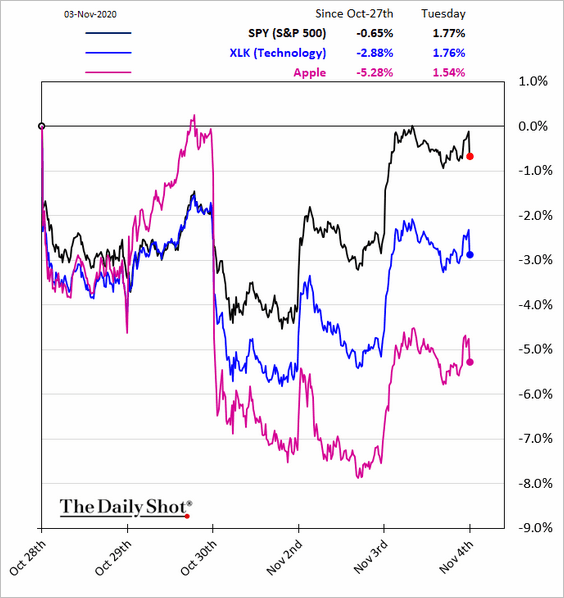
• Tech:
• The ratio of tech to industrials (last 12 months):
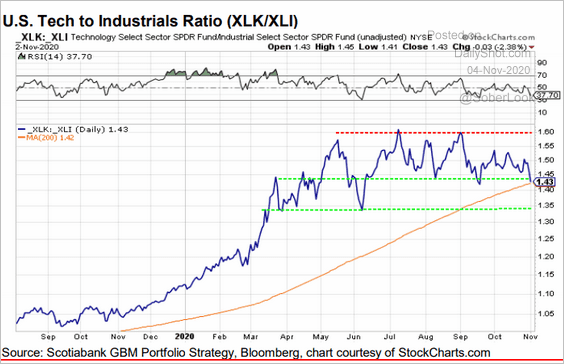 Source: Hugo Ste-Marie, Portfolio & Quantitative Strategy Global Equity Research, Scotia Capital
Credit
1. Delinquency rates on commercial mortgages (loans held by CMBS) remain elevated.
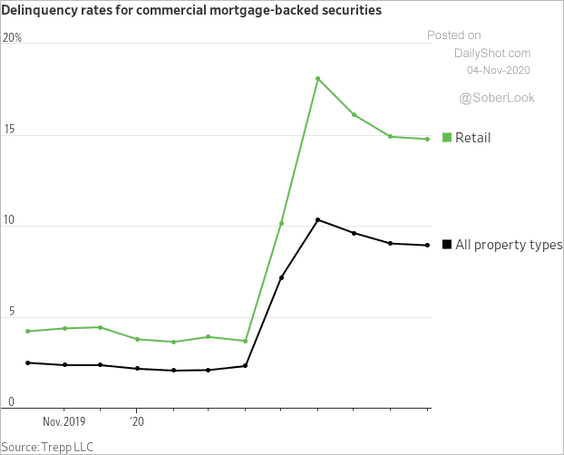 Source: @WSJ Read full article
By the way, at least for now, commercial property deflation is considerably less intense than in 2008.
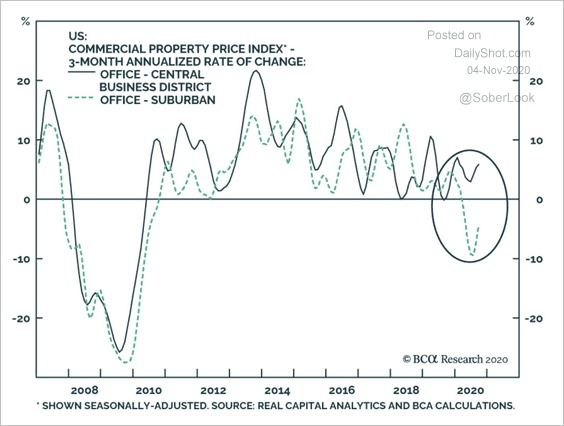 Source: BCA Research
——————–
2. Credit risk transfer (CRT) deals by Fannie and Freddie have slowed amid uncertainty around regulatory capital relief. CRT investors take on mortgage borrowers’ credit risk (which is not the case for traditional agency MBS bonds).
![]() Source: @markets Read full article
Source: @markets Read full article
3. Non-bank lenders increasingly dominate the mortgage market.
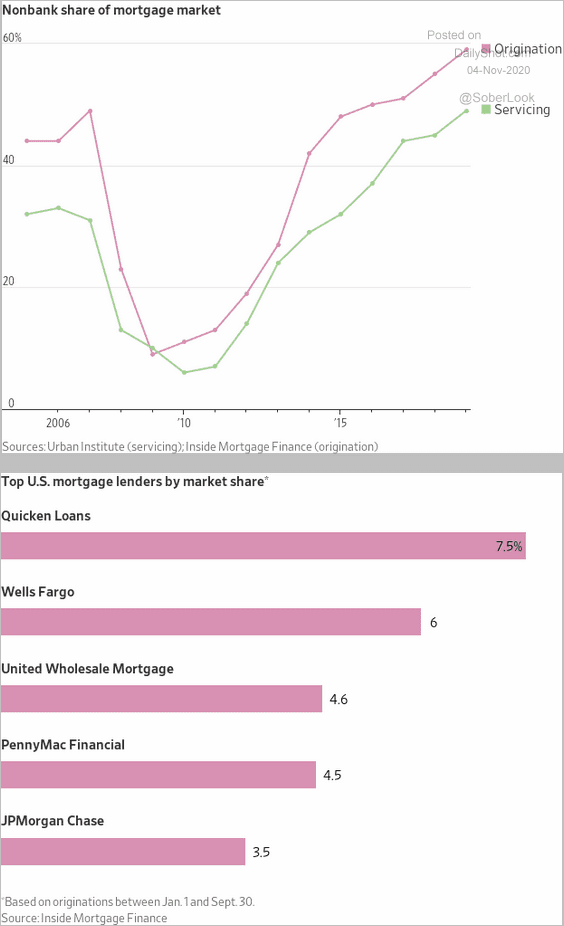 Source: @WSJ Read full article
4. The largest US high-yield bond ETF saw some outflows recently.
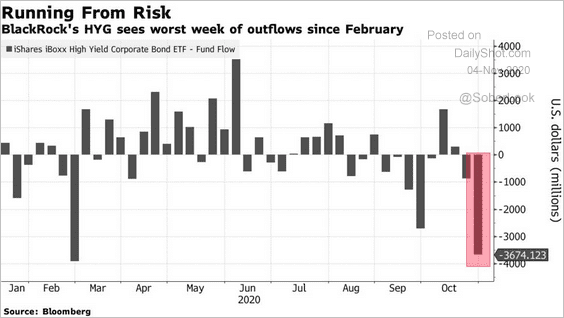 Source: @markets Read full article
5. The gap between US high-yield and investment-grade corporate bond volatility has widened the most since June.
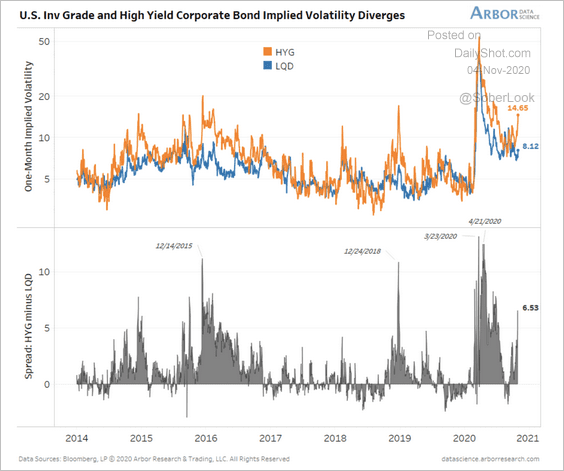 Source: Arbor Research & Trading
6. This chart shows the changes in US loan growth by sector in 2020 (C&I = business loans, Cml = commercial real estate).
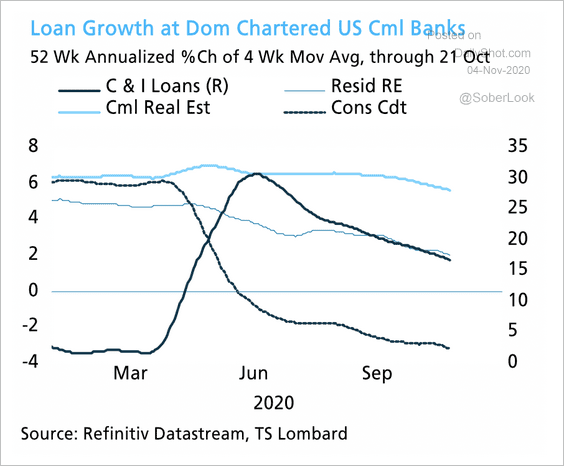 Source: TS Lombard
7. Sovereign debt downgrades spiked this year.
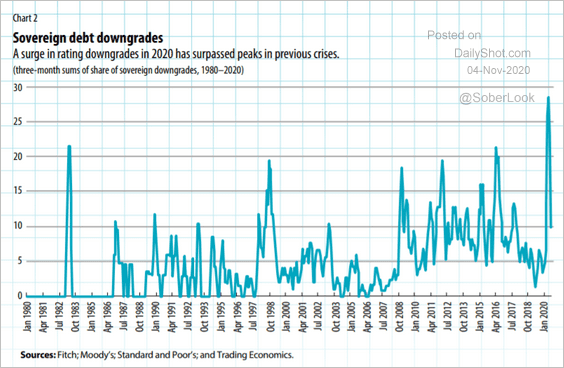 Source: IMF Read full article
Rates
1. The Treasury curve continues to steepen.
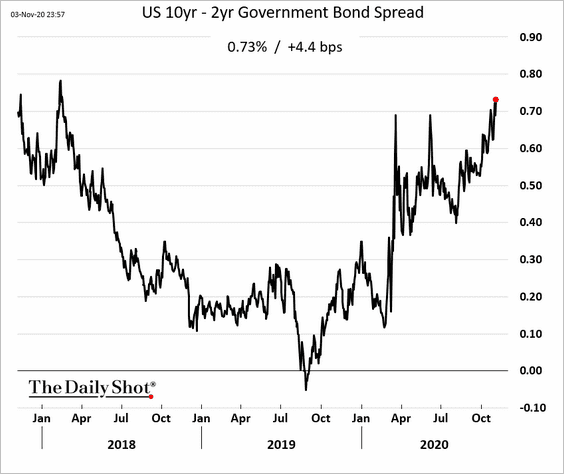
And the coming shift in relative issuance from the Treasury will continue to favor further steepening of the curve, according to Gavekal.
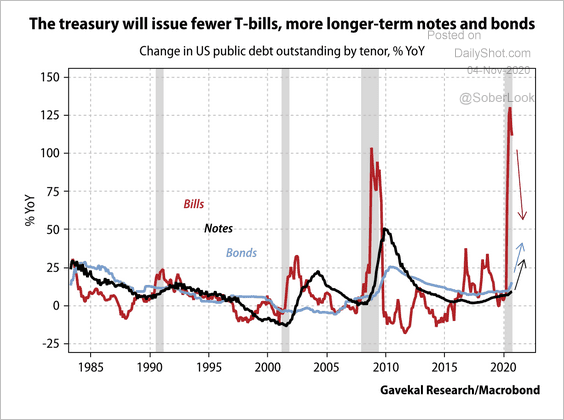 Source: Gavekal
——————–
2. Will Treasury yields follow the 2016 pattern?
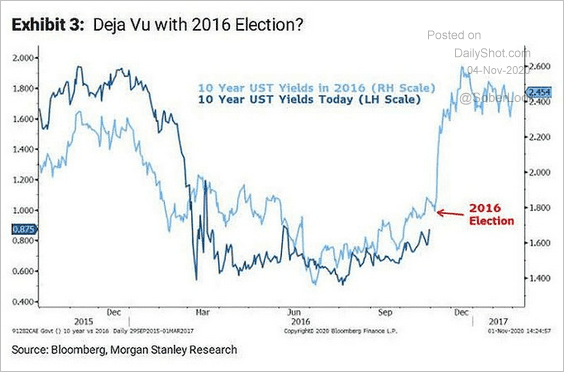 Source: @ISABELNET_SA, @MorganStanley
3. According to a Bloomberg survey, the Fed is unlikely to boost bond purchases this year.
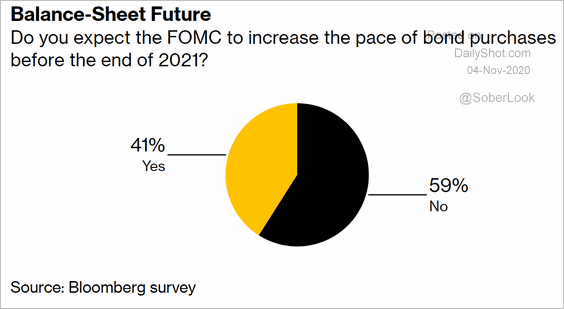 Source: @markets Read full article
Global Developments
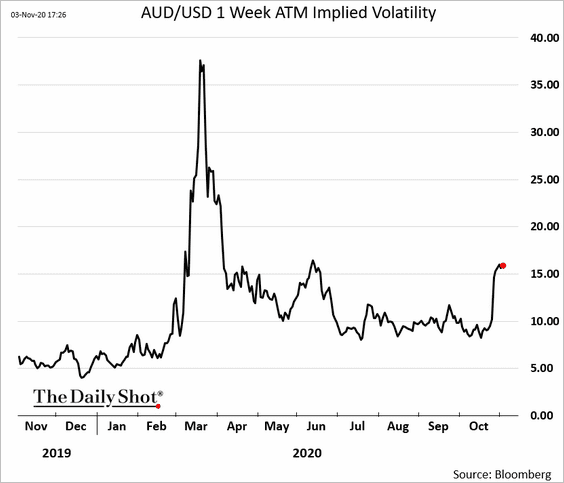
1. Short-term implied volatility in the currency markets remains elevated.
2. How did assets perform after the 2016 US elections?
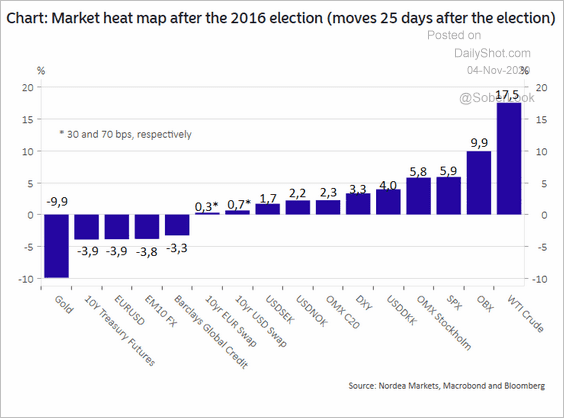 Source: Nordea Markets
3. This chart shows the recent changes in core CPI measures in select economies.
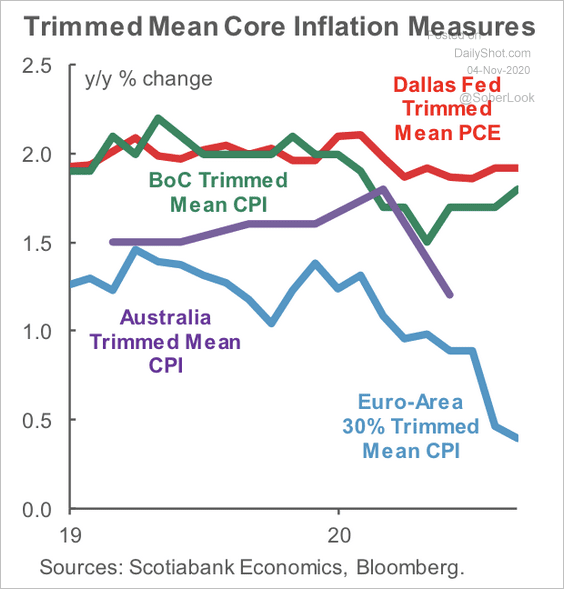 Source: Scotiabank Economics
4. Foreign direct investment flows declined sharply in most countries.
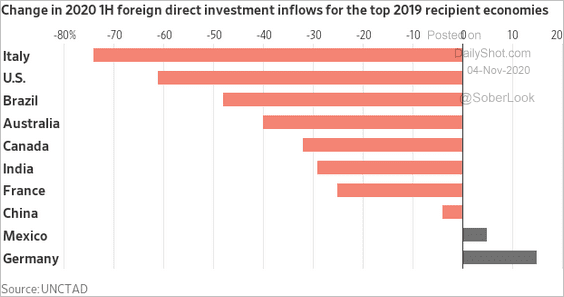 Source: @WSJ Read full article
5. Business executives surveyed by McKinsey maintain a positive outlook for the world economy.
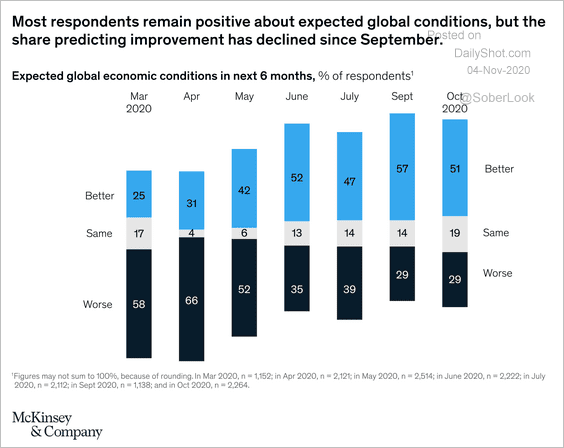 Source: McKinsey Read full article
However, according to McKinsey, the economic outlook for business executives in Greater China (incl. HK and Taiwan) and Europe have tempered.
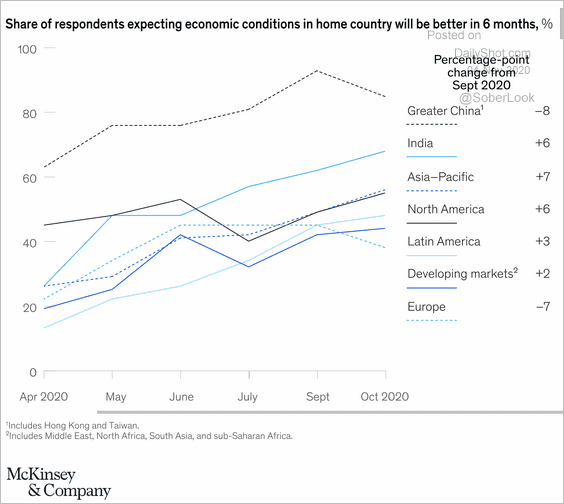 Source: McKinsey Read full article
——————–
Food for Thought
1. Projected growth of major religious groups globally:
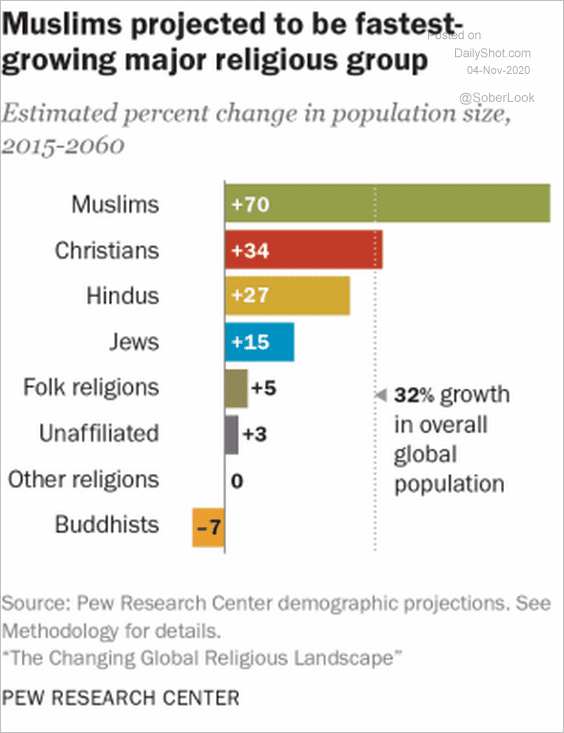 Source: Pew Research Center Read full article
2. Europe’s Jewish population:
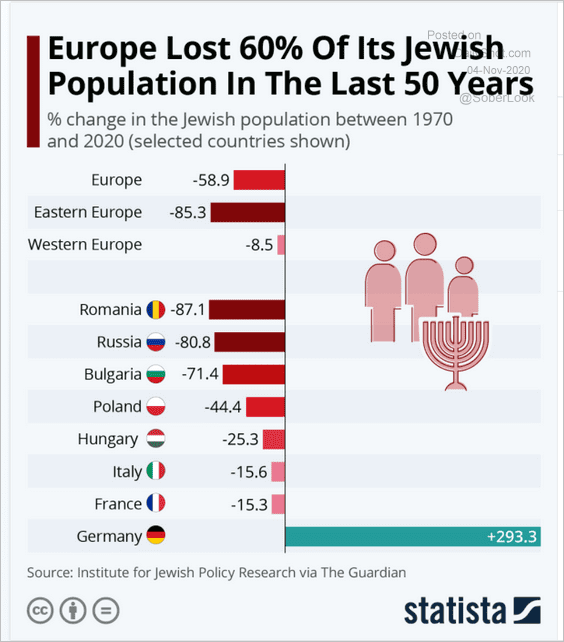 Source: Statista
3. Share of the population aged 60 and older:
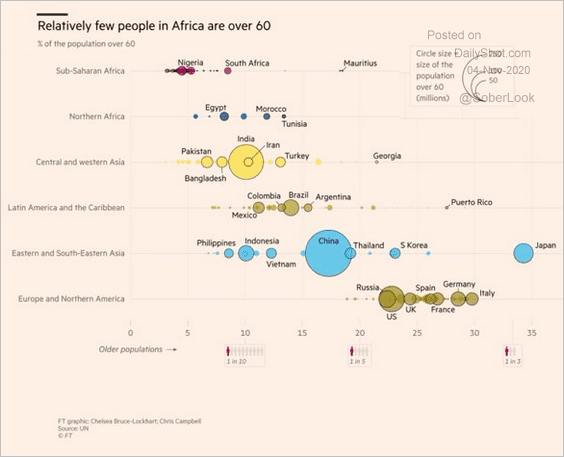 Source: @adam_tooze, @OurWorldInData, @MaxCRoser Read full article
4. Applications to US MBA programs:
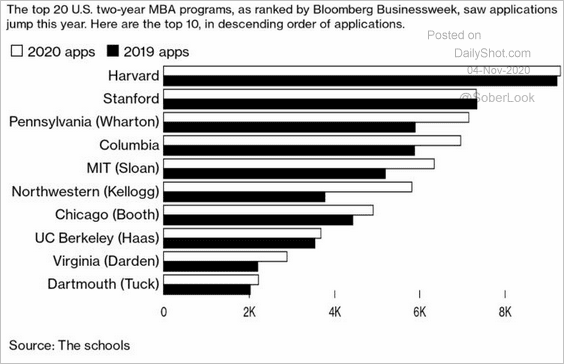 Source: @BW Read full article
5. How US voters feel about the elections:
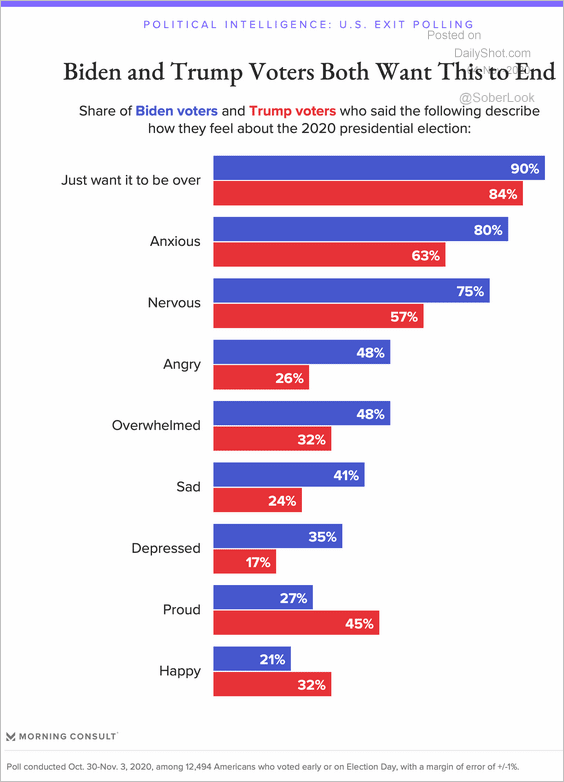 Source: Morning Consult Read full article
6. US election turnout estimate:
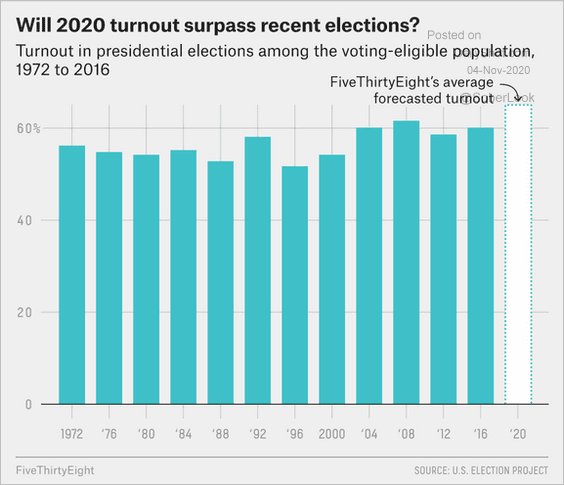 Source: @geoffreyvs
7. Charitable donations (tax deductions) by state:
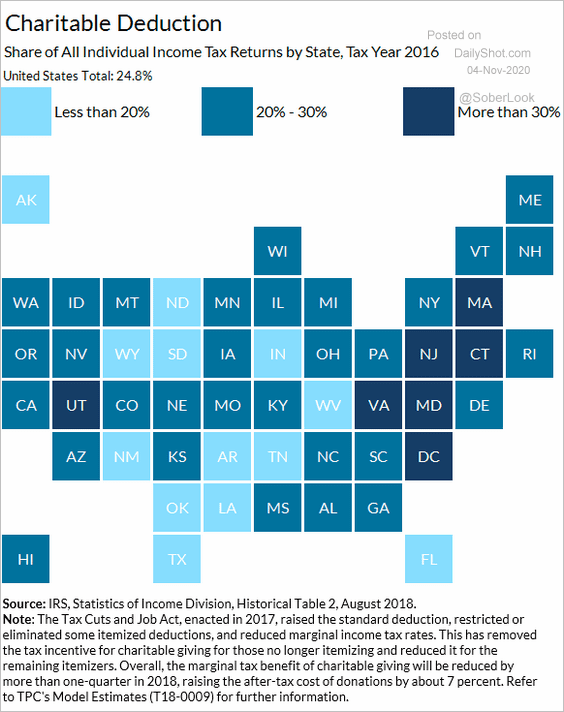 Source: Urban Institute, Brookings Institution Read full article
8. COVID impact on CO2 emissions (2 charts):
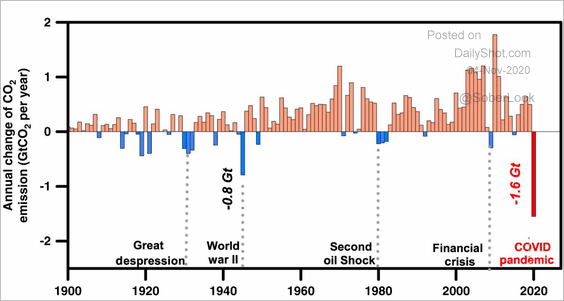 Source: @adam_tooze, @LiuzhuLiu Read full article
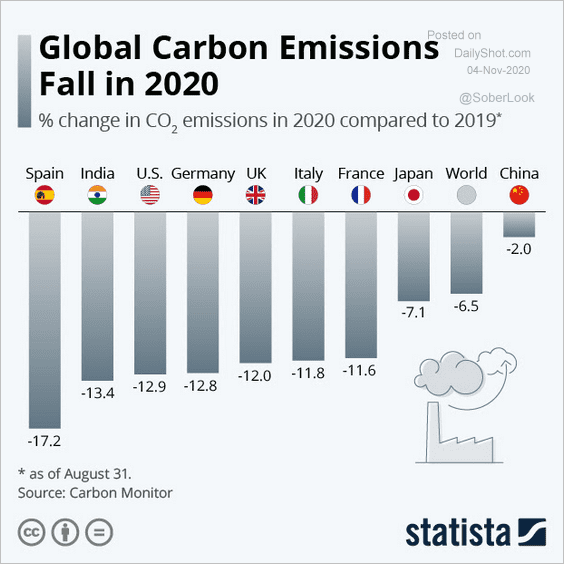 Source: Statista
——————–
9. This is a black and white photograph, and only the lines have color (creating an optical illusion).
 Source: @page_eco
——————–