
The Daily Shot: 12-Nov-20
• Credit
• Equities
• Energy
• Cryptocurrency
• Emerging Markets
• China
• Asia – Pacific.
• Japan
• Europe
• The United Kingdom
• The United States
• Global Developments
• Food for Thought
Credit
1. Let’s begin with the Fed’s Senior Loan Officer Opinion Survey.
• Given the strength in the housing market, banks have been easing lending standards on mortgages.
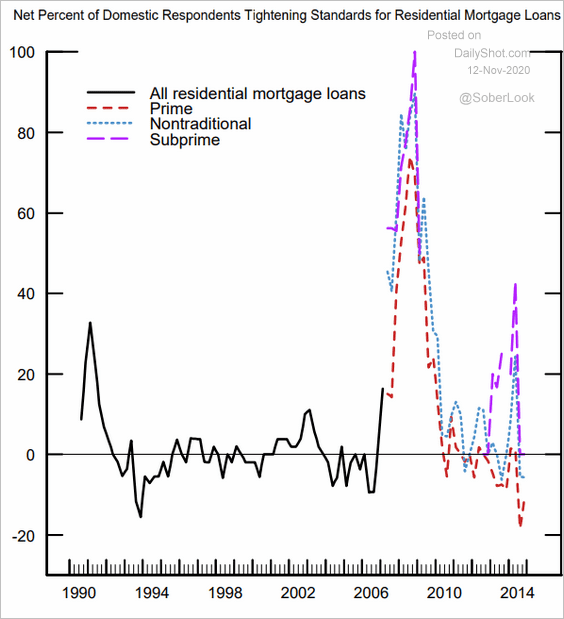 Source: FRB
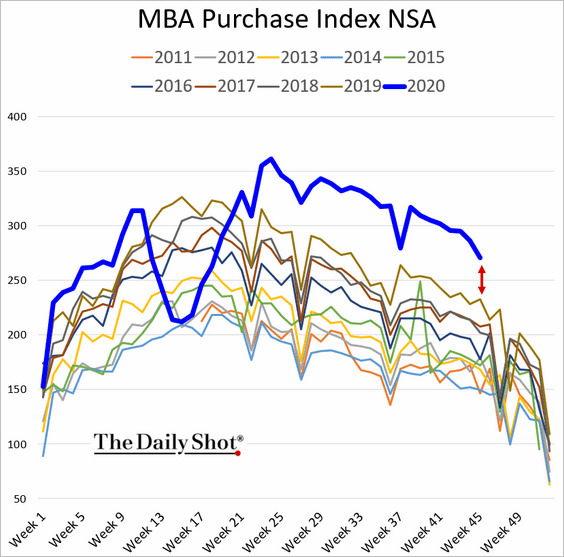
As we’ve seen from the Mortgage Bankers Association data (see US section), mortgage demand has been strong. This is especially true for conforming loans, which are bought by Fannie Mae and Freddie Mac (GSEs).
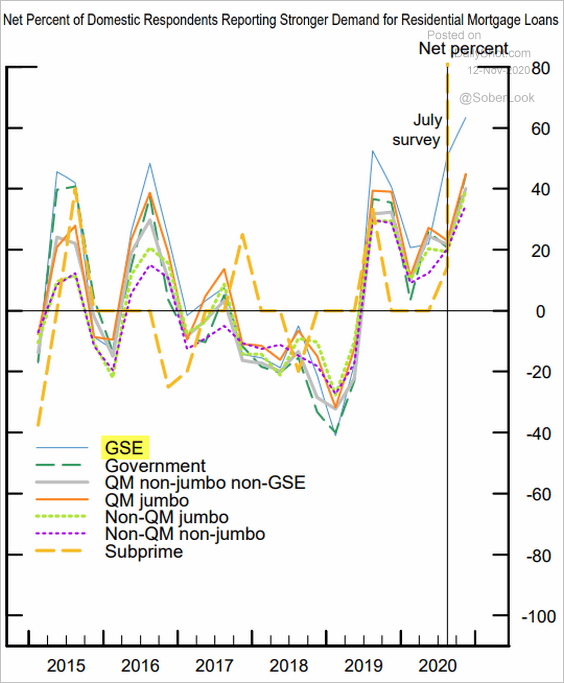 Source: FRB
• Consumer credit demand (credit cards, auto loans, etc.) has rebounded.
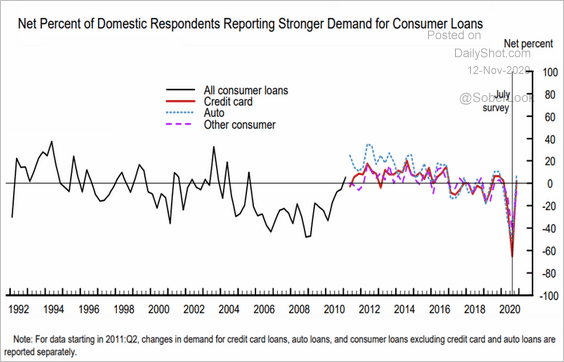 Source: FRB
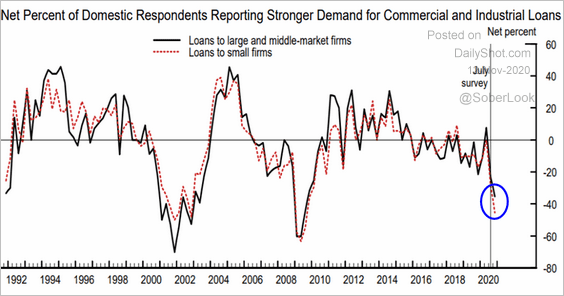
• Underwriting standards for business loans have eased somewhat but remain relatively tight.
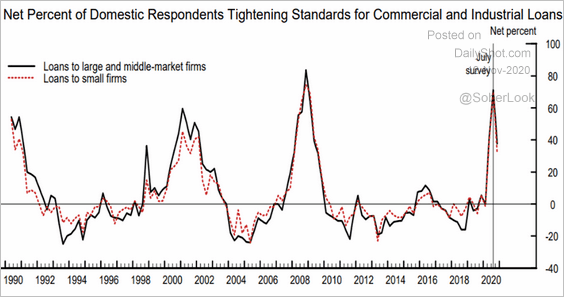 Source: FRB
Corporate loan demand is now at its weakest since the financial crisis. Small business demand is particularly soft.
 Source: FRB
——————–
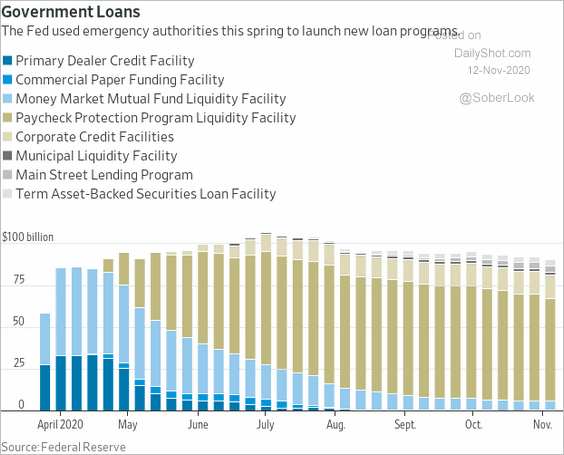
2. This chart shows the evolution of the Fed’s emergency programs (balances).
 Source: @WSJ Read full article
Equities
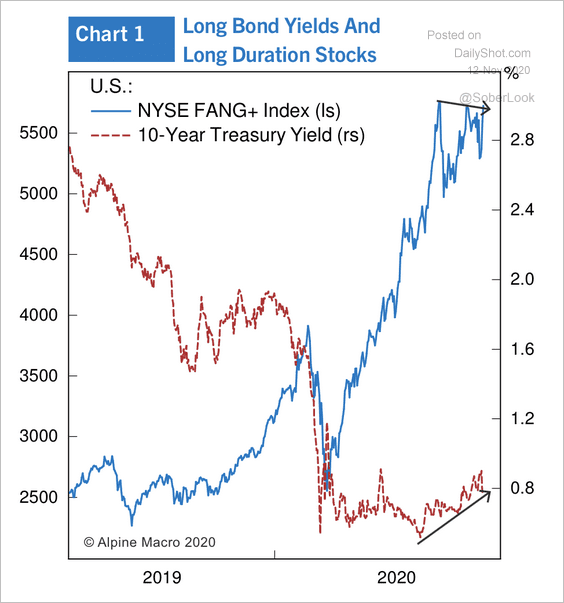
1. A substantial increase in Treasury yields could pose a risk for growth stocks, especially the tech mega-caps. A successful vaccine rollout, for example, could be a catalyst for higher rates.
 Source: Alpine Macro
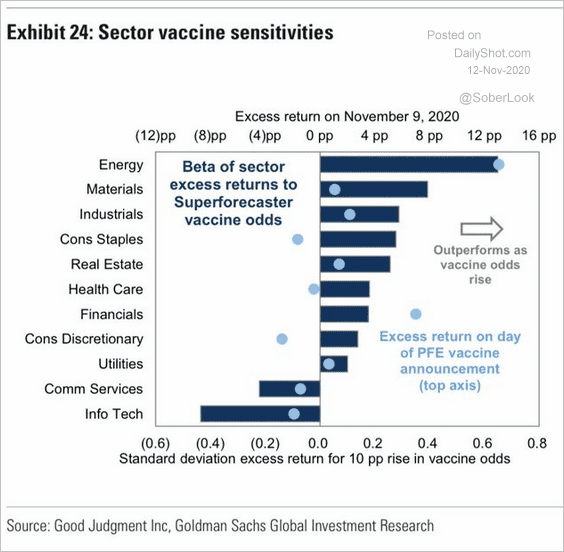
This chart shows the “vaccine sensitivity” by sector.
 Source: Goldman Sachs, @carlquintanilla
Growth share valuations remain near multi-decade highs.
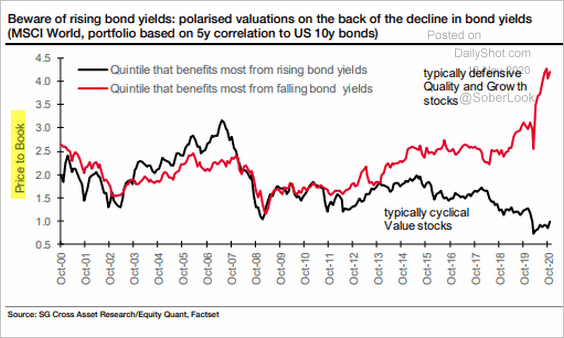 Source: Cross Asset Research – Societe Generale, @Theimmigrant84
——————–
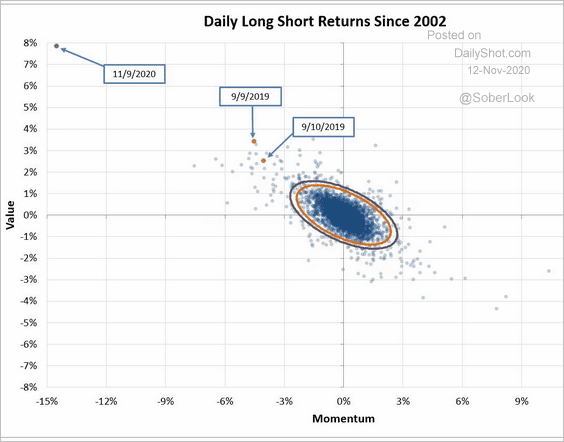
2. On Monday, momentum had its largest drop versus value since 2002.
 Source: @wjruss84
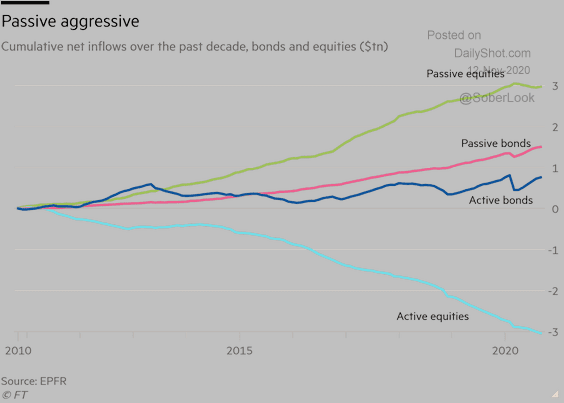
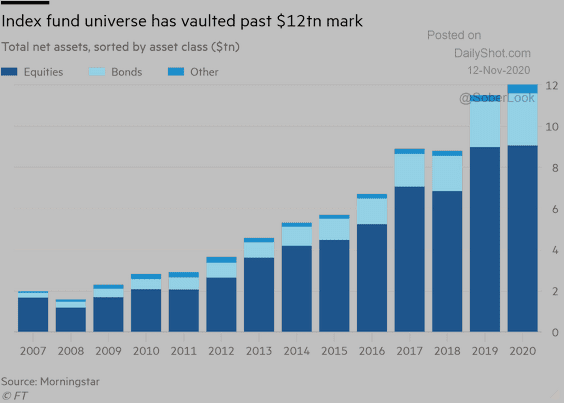
3. Flows into passive funds continue as investors pull money out of active funds.
 Source: @financialtimes, h/t @trevornoren Read full article
 Source: @financialtimes, h/t @trevornoren Read full article
——————–
4. Investopedia readers (mostly retail investors) are bullish on US stocks over the next three months. A majority of respondents expect 10% or higher returns next year.
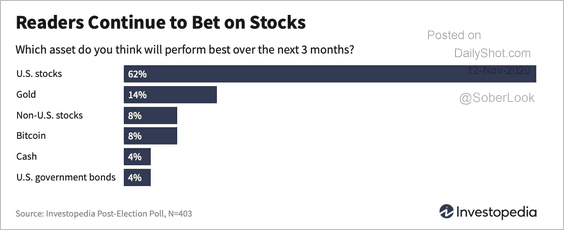 Source: Investopedia Read full article
5. Here is a look at stock market performance globally.
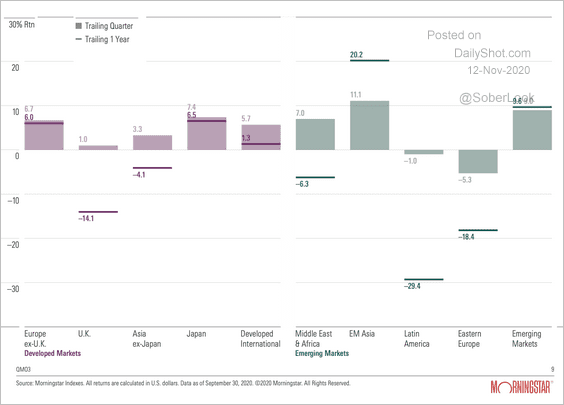 Source: Morningstar
Below, we have the 10-year annualized returns by country.
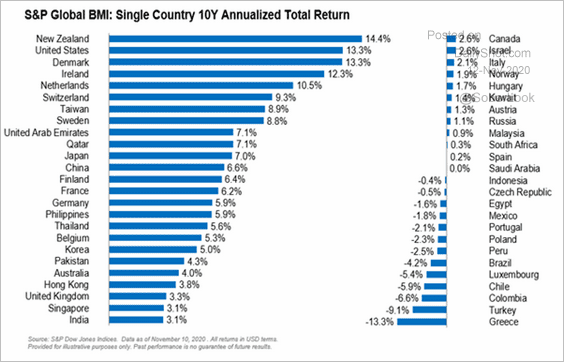 Source: S&P Global Market Intelligence
——————–
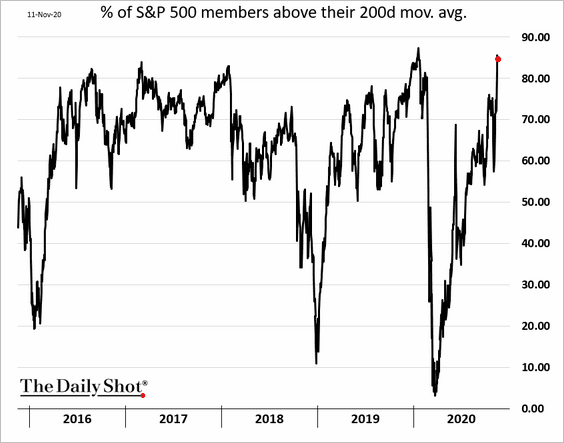
6. Some 85% of S&P 500 members are now above their 200-day moving average.
7. VIX has been declining since the election day.
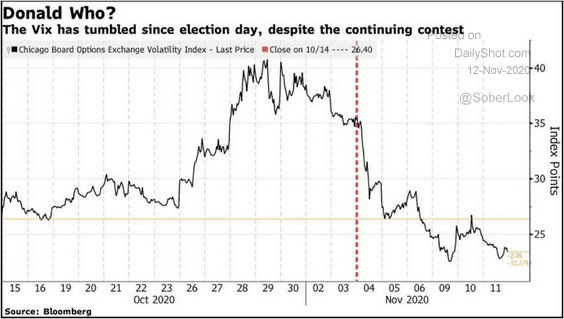 Source: @johnauthers, @bopinion Read full article
Energy
1. US gasoline demand is holding below the 7-year range.
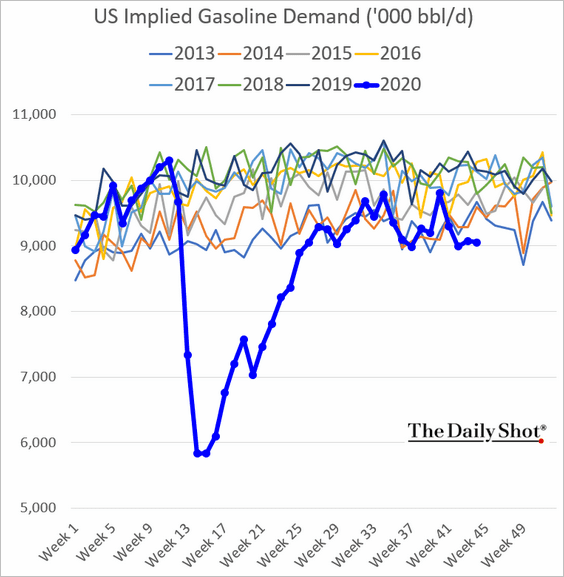
Refinery inputs remain soft.
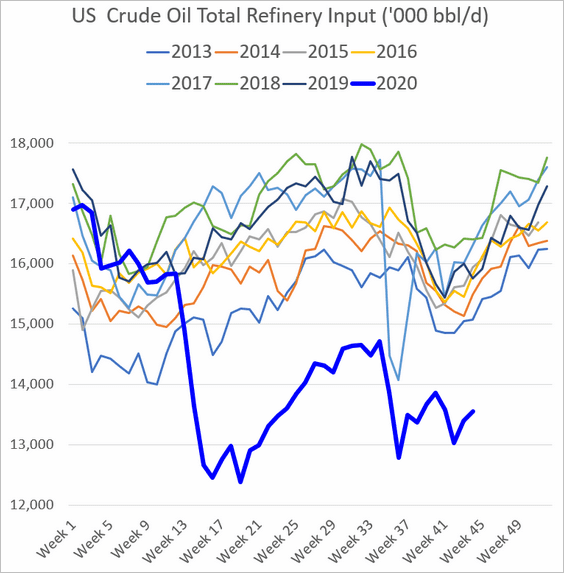
This chart shows US refinery inputs by region (see the last panel for region definitions). The Gulf Coast refinery activity has been particularly weak (second panel).
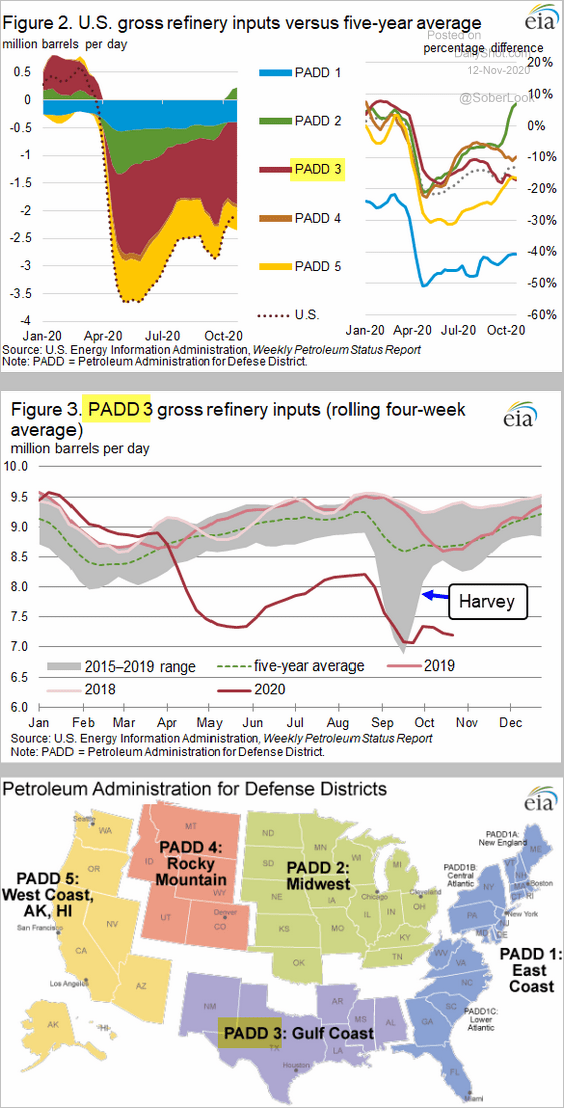 Source: @EIAgov
——————–
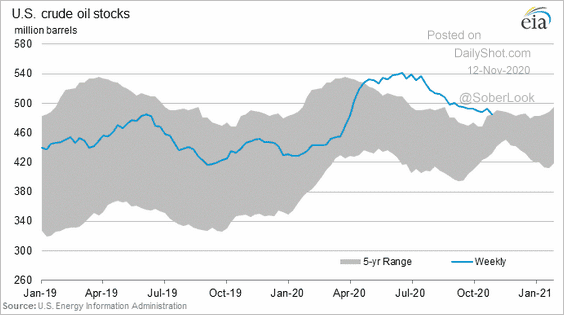
2. US crude oil inventories (absolute level) are back at the 5-year range.
Cryptocurrency
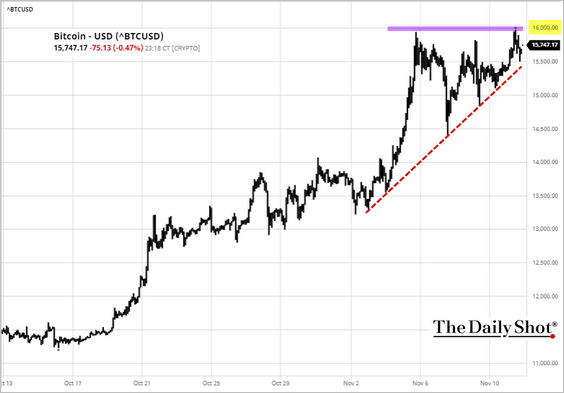
1. Bitcoin has retested the $16k resistance. Should we be concerned about a double top here?
 Source: barchart.com
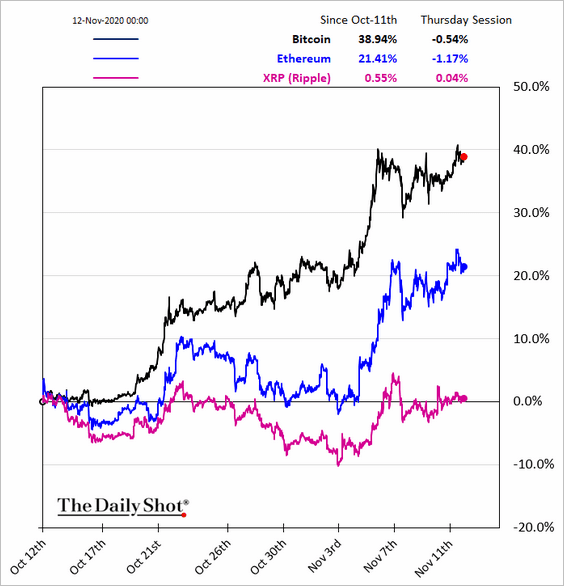
2. Below is the relative performance of Bitcoin, Ethereum, and XRP over the past month.
Emerging Markets
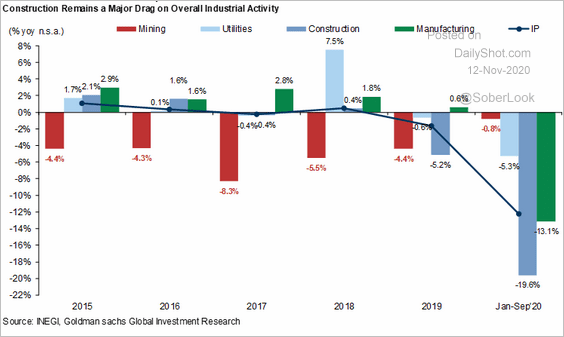
1. Mexico’s industrial production continued to recover in September.
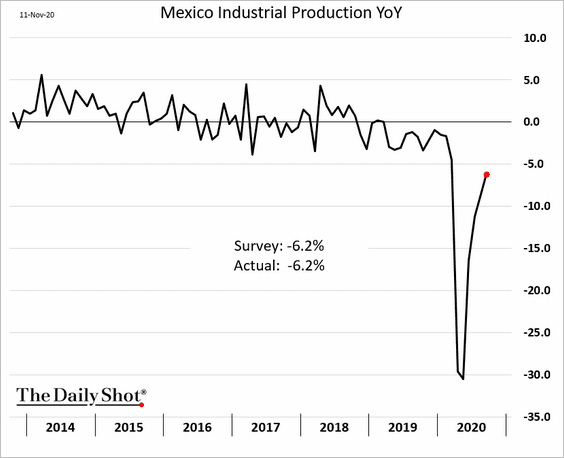
Construction has been a major drag on industrial activity.
 Source: Goldman Sachs
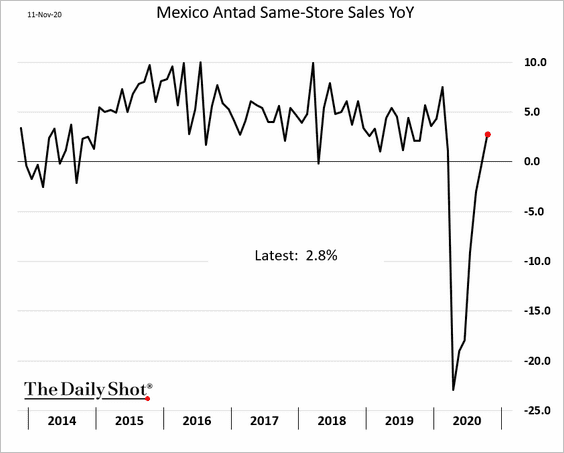
Separately, Mexican same-store sales are now up vs. 2019 (as of October).
——————–
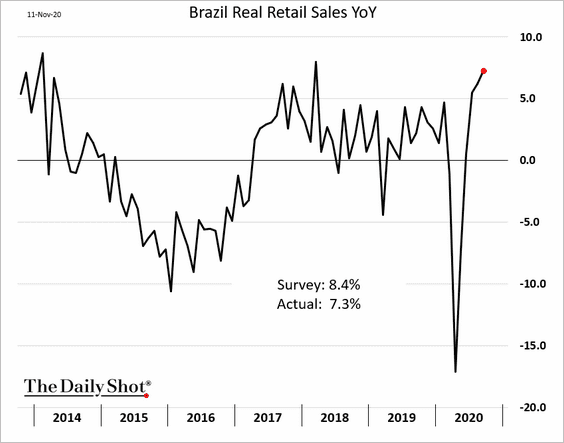
2. Brazil’s retail sales were strong in September, but not as good as markets were expecting.
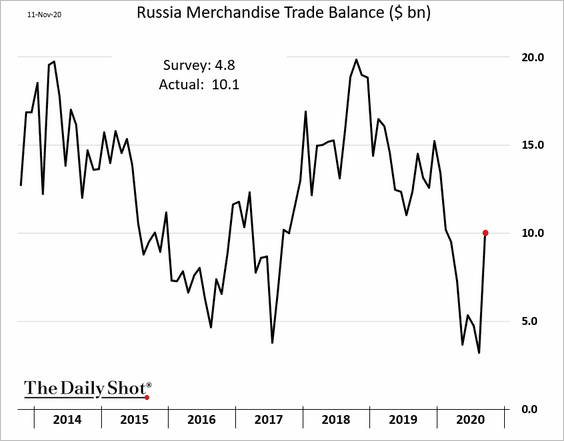
3. Russia’s trade balance surprised to the upside, boosted by exports (as of September).
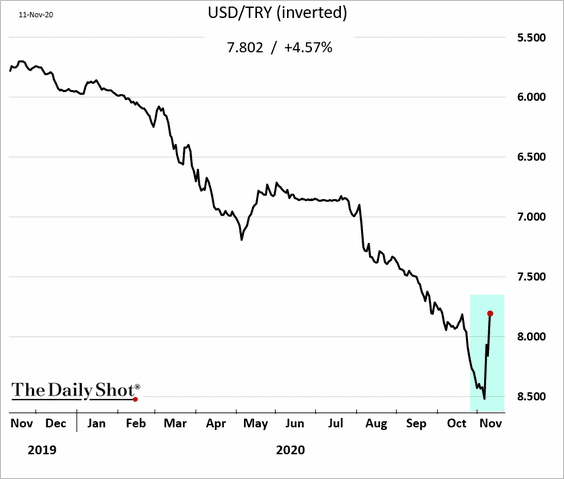
4. Next, we have some updates on Turkey.
• Apparently, Erdogan gave the nod to higher rates in order to boost the lira (“bitter pill policies”).
 Source: @markets Read full article
The lira jumped.
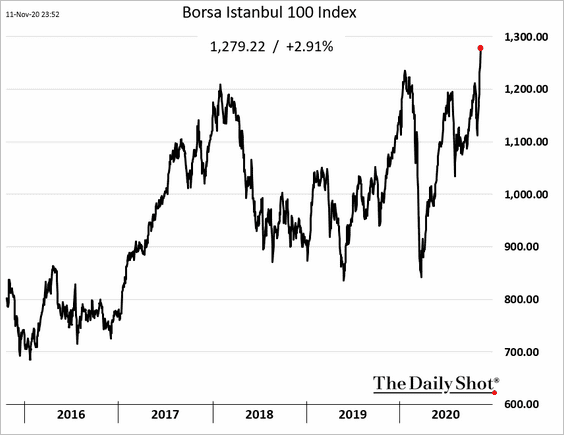
The stock market hit a record high.
• The central bank’s “stealth tightening” this year has raised funding costs for banks, resulting in higher lending rates.
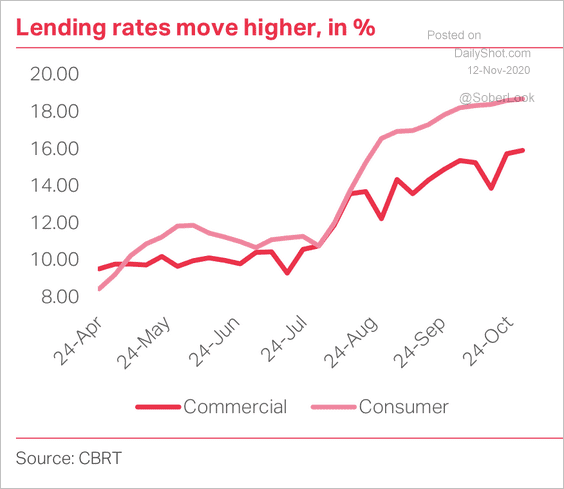 Source: TS Lombard
• Turkey’s current account balance continues to deteriorate.
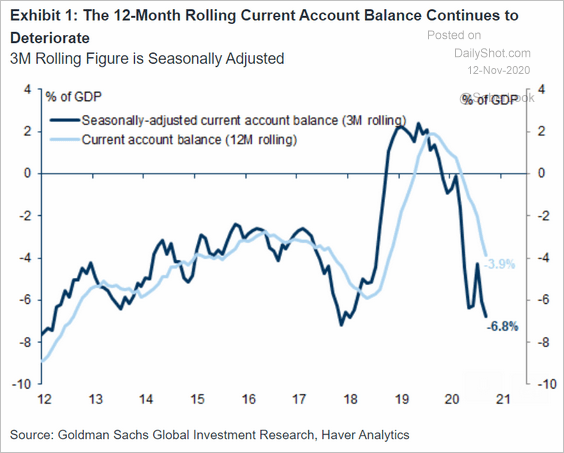 Source: Goldman Sachs
China
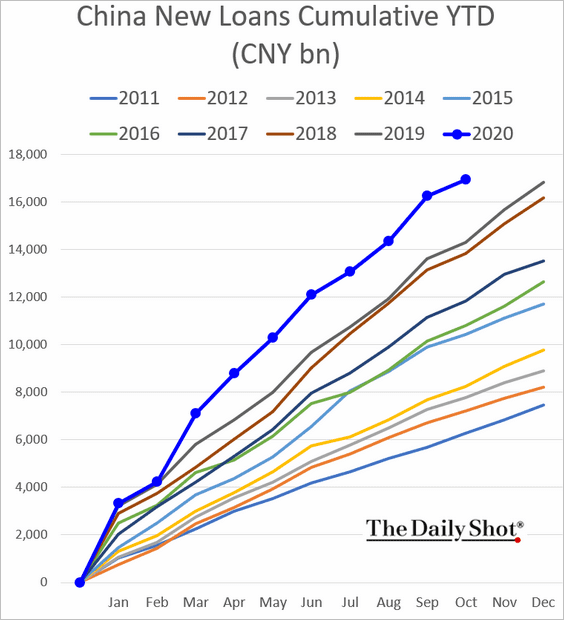
1. Loan growth was a bit softer than expected last month. However, credit expansion has been robust year-to-date.
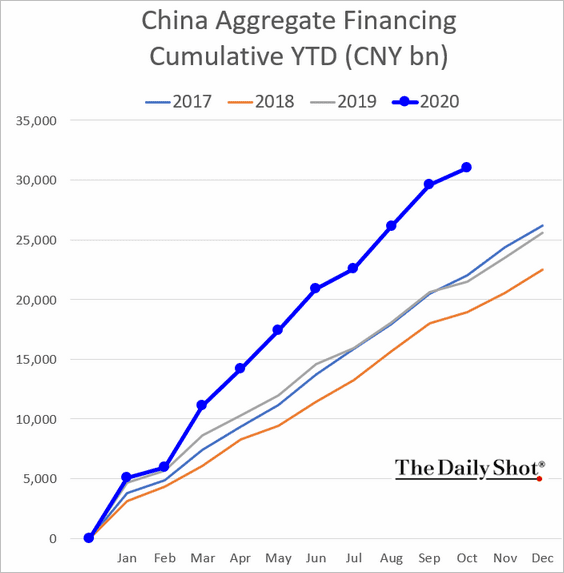
Here is the aggregate financing.
——————–
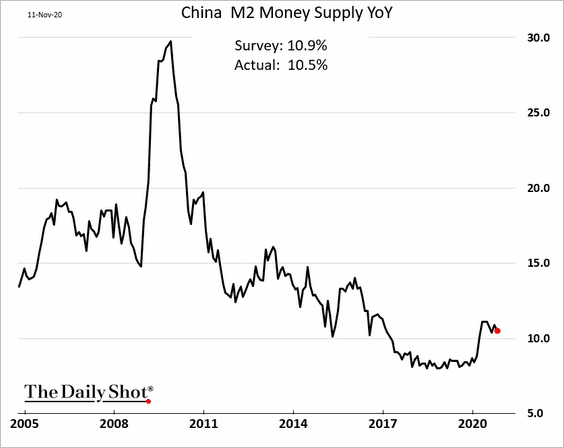
2. The broad money supply (M2) growth missed estimates but remains above 10% (year-over-year).
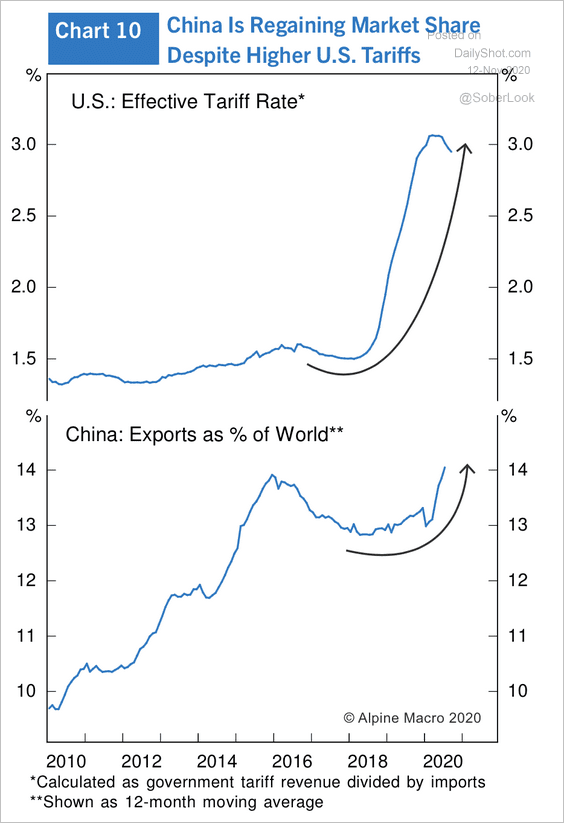
3. China’s share of world exports has been rising despite higher tariffs from the US.
 Source: Alpine Macro
Asia – Pacific.
1. Weak job creation points to further risks to South Korea’s labor market.
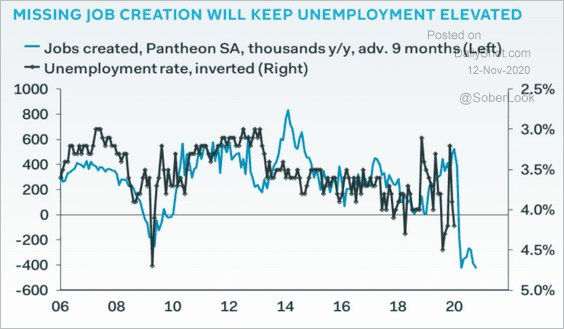 Source: Pantheon Macroeconomics
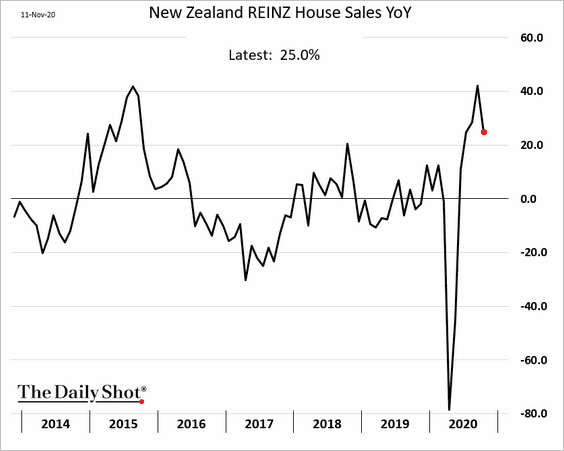
2. Next, we have some updates on New Zealand.
• Home sales remain robust, with prices continuing to rise.
 Source: @WSJ Read full article
——————–
• New Zealand’s breakeven rates (inflation expectations) have not widened as much as in the US.
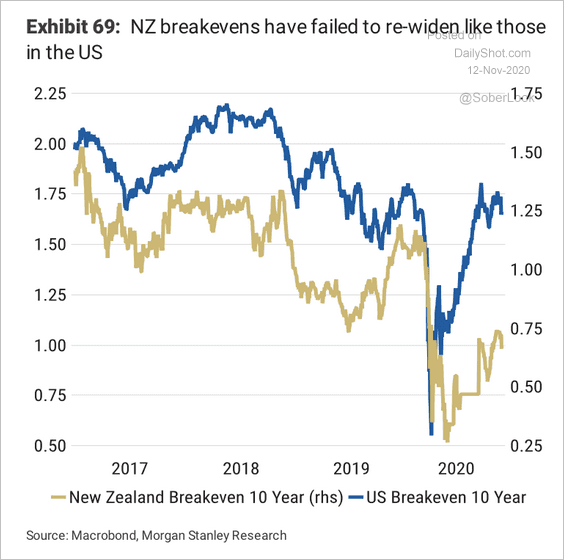 Source: Morgan Stanley Research
• The Reserve Bank of New Zealand has been the most dovish central bank relative to its G7 peers. Perhaps that changed this week (see # 3 here)?
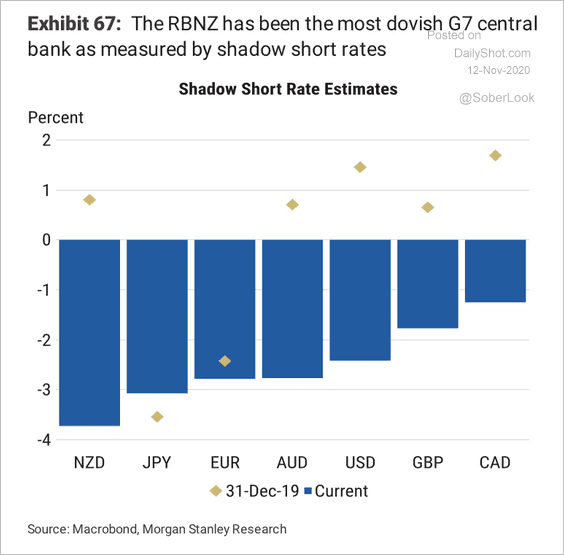 Source: Morgan Stanley Research
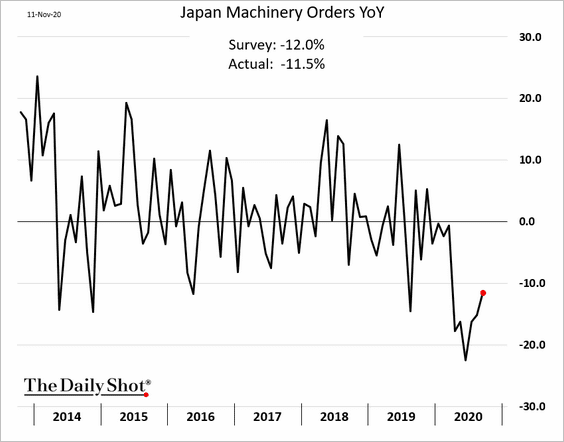
Japan
1. Machinery orders are recovering.
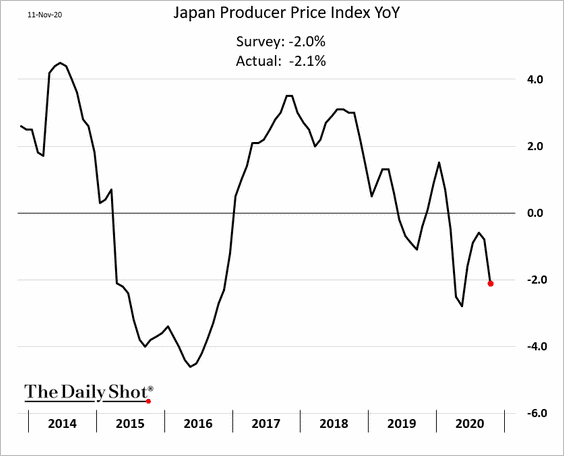
2. Producer prices remain soft.
3. Analysts are projecting more gains ahead for the Nikkei 225.
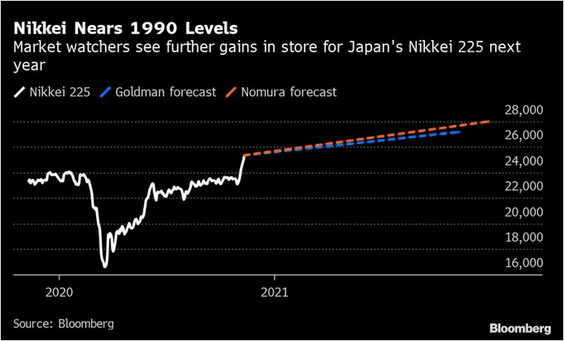 Source: @markets Read full article
Europe
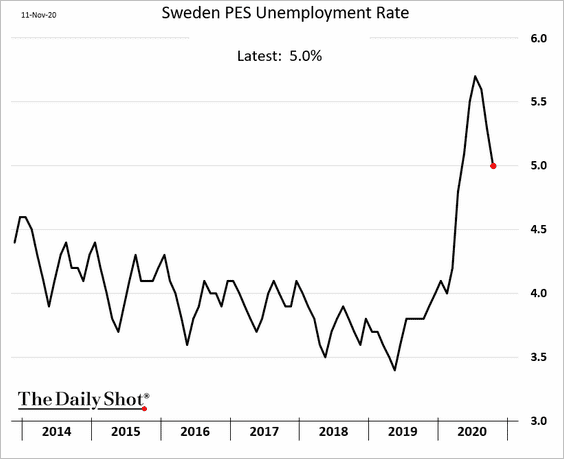
1. Sweden’s unemployment rate continues to ease.
2. The options market remains extremely bearish on the Norwegian Krone relative to history.
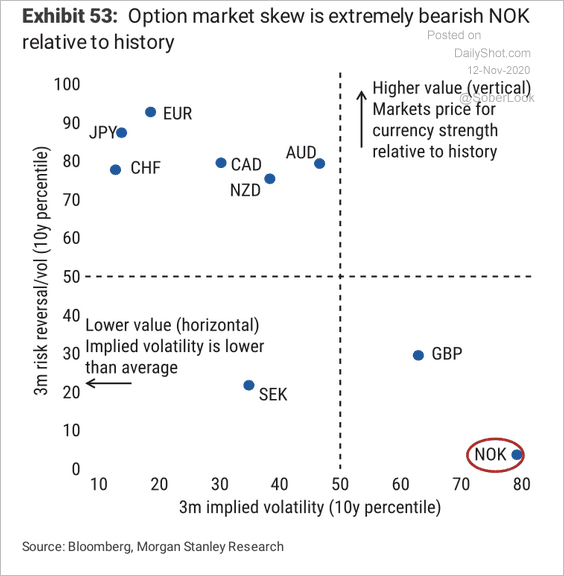 Source: Morgan Stanley Research
The market is pricing in a higher probability of a rate hike next year.
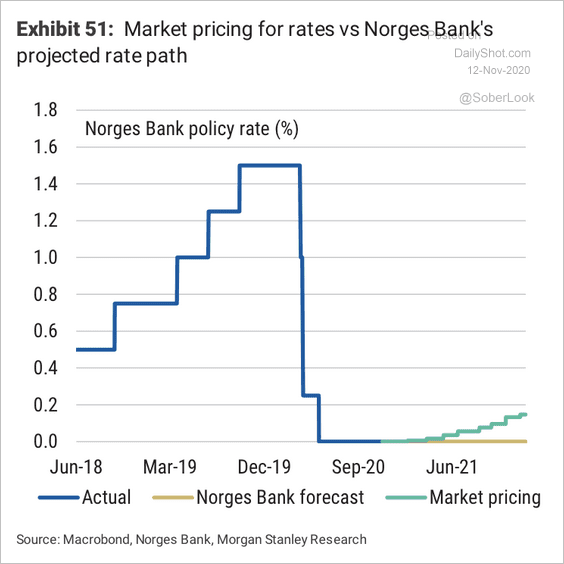 Source: Morgan Stanley Research
——————–
3. The correlation between the 30-year Treasury and 30-year Bund declined last week, reaching its lowest level since 2002.
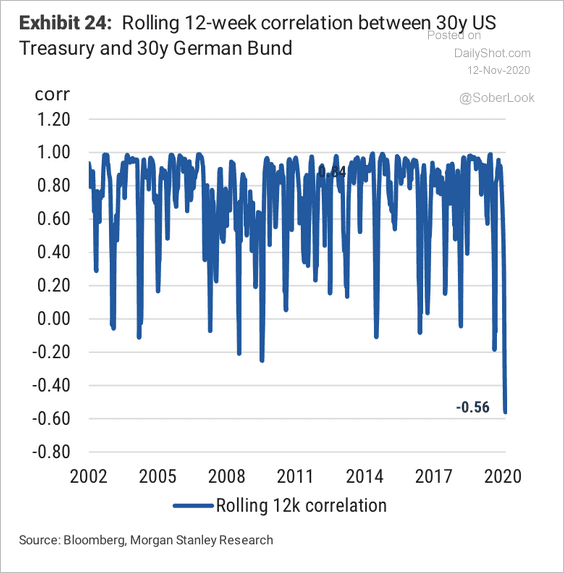 Source: Morgan Stanley Research
4. Manufacturing recovery points to higher stock prices in Europe.
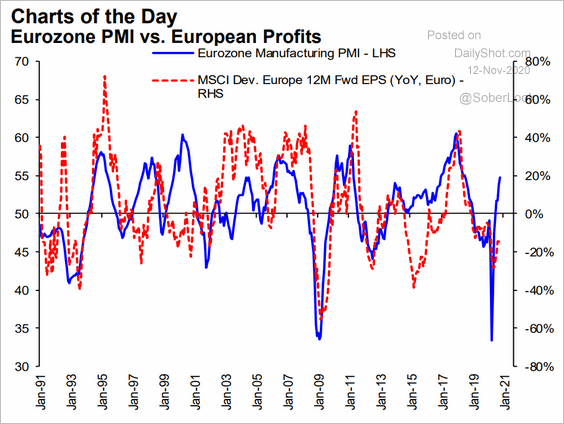 Source: Hugo Ste-Marie, Portfolio & Quantitative Strategy Global Equity Research, Scotia Capital
5. However, here are Variant Perception’s recovery scores.
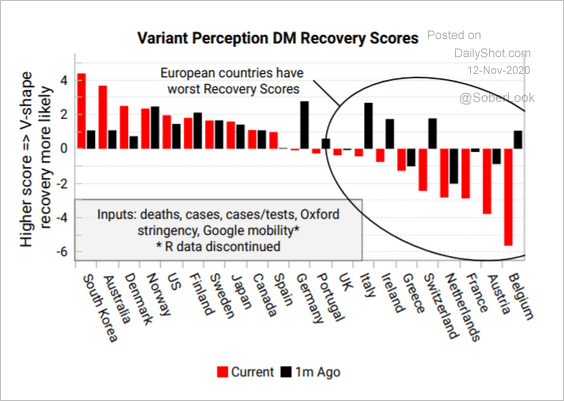 Source: Variant Perception
6. Italian and Spanish bond spreads have been tightening.
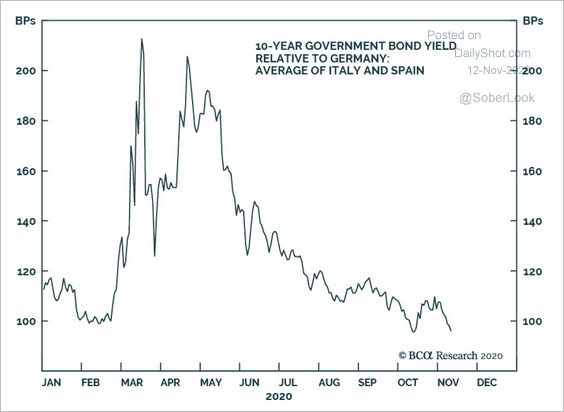 Source: @bcaresearch, h/t @Scutty
7. This chart shows the projected debt-to-GDP ratios for 2021.
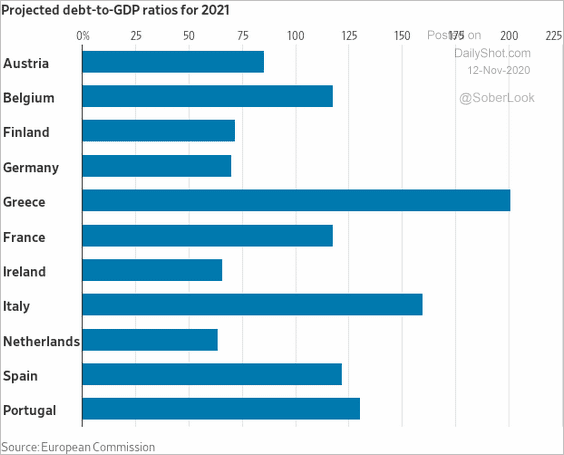 Source: @WSJ Read full article
The United Kingdom
1. The second wave of COVID-19 cases will likely weigh on economic growth.
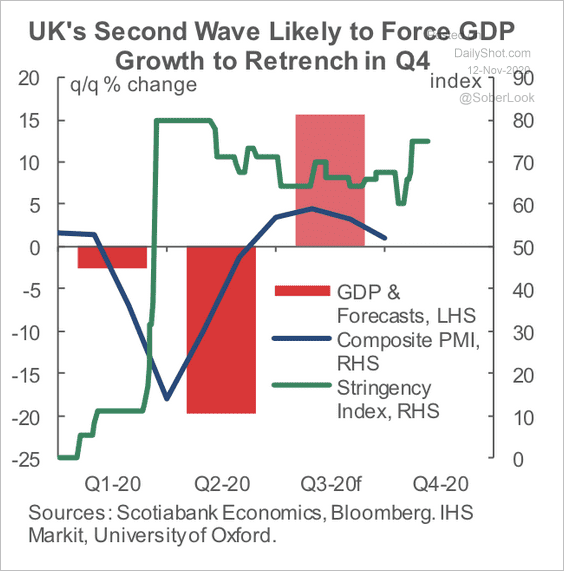 Source: Scotiabank Economics
• But COVID-related deaths have not spiked the way they did at the beginning of the pandemic.
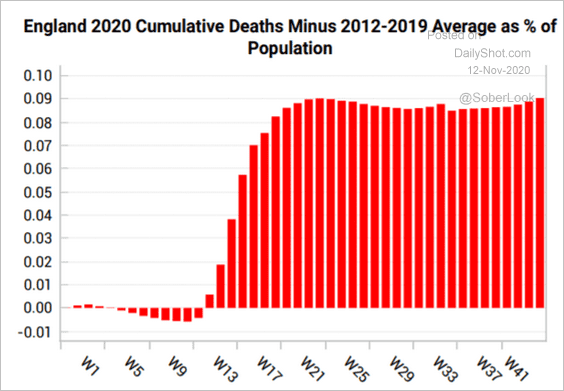 Source: Variant Perception
• How does the public feel about returning to the Tier-based lockdown?
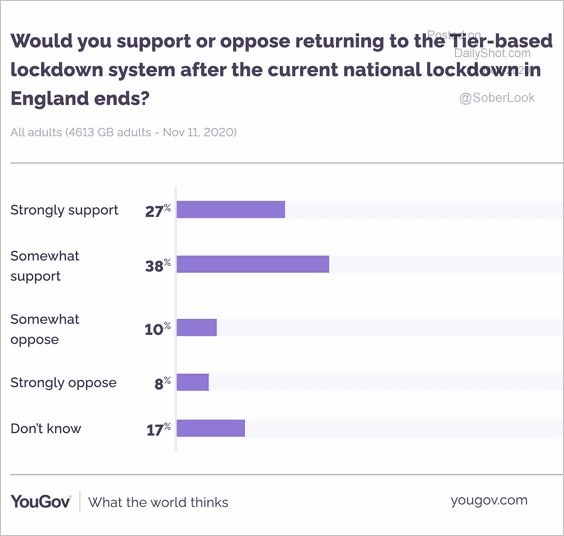 Source: @YouGov Read full article
——————–
2. Heathrow traffic has been depressed.
 Source: Statista
The United States
1. Mortgage demand remains robust, although there has been some loss of momentum.
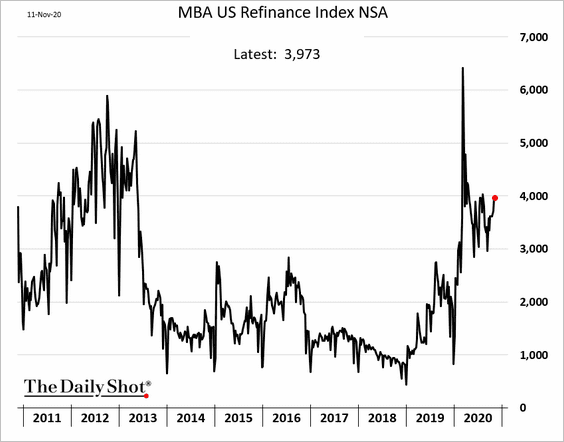
Here is the mortgage refinancing activity index.
——————–
2. As we saw yesterday (#4 here), consumer sentiment has been softening.
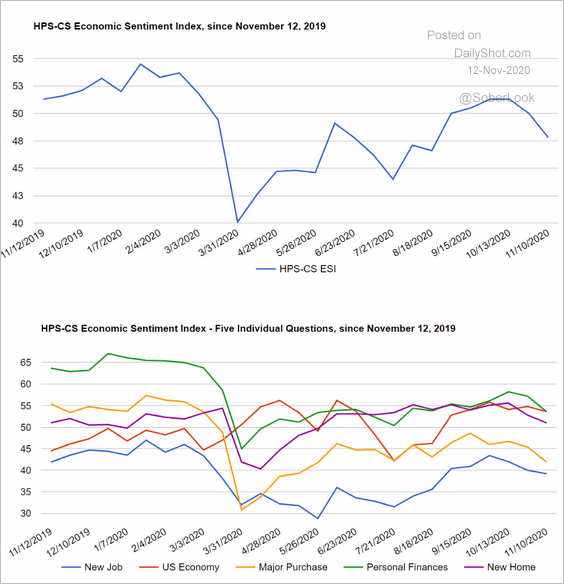 Source: @HPSInsight, @CivicScience
3. Below is the Chase debit/credit card spending tracker.
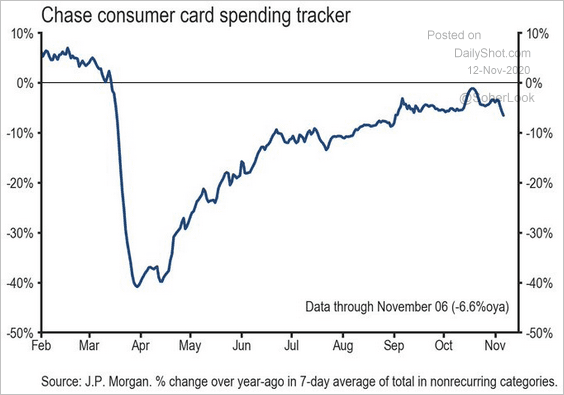 Source: JP Morgan, @carlquintanilla
4. Goldman’s US exports tracker has been weakening.
![]() Source: Goldman Sachs
Source: Goldman Sachs
Global Developments
1. This chart shows Morgan Stanley’s expected average monthly QE pace next year (as a percent of central banks’ balance sheet size).
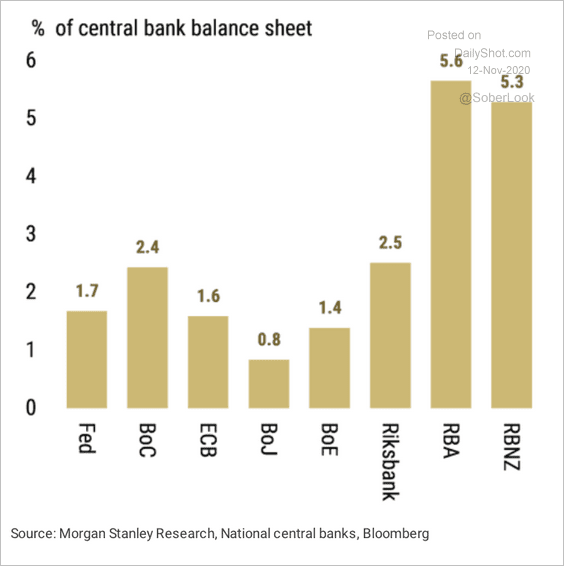 Source: Morgan Stanley Research
2. Global business activity expectations have improved.
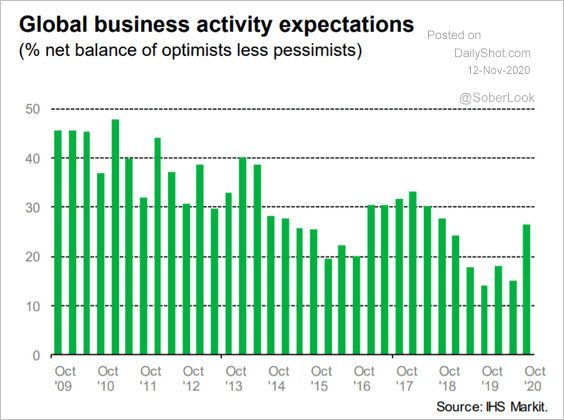 Source: IHS Markit
3. Here is Goldman’s estimate of the pandemic restrictions’ impact on the GDP.
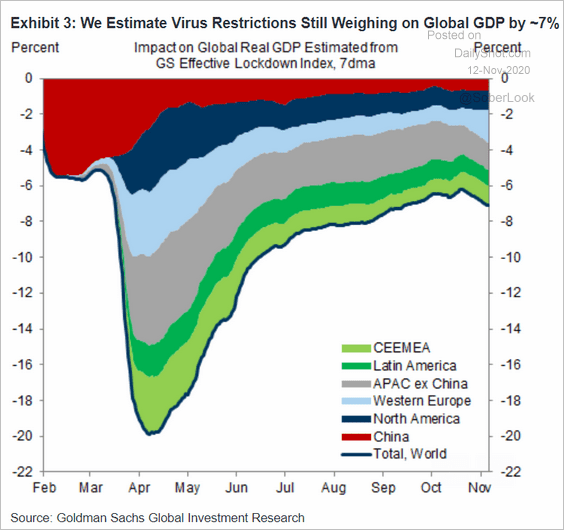 Source: Goldman Sachs
4. This chart shows the US dollar’s dominance across the global monetary landscape.
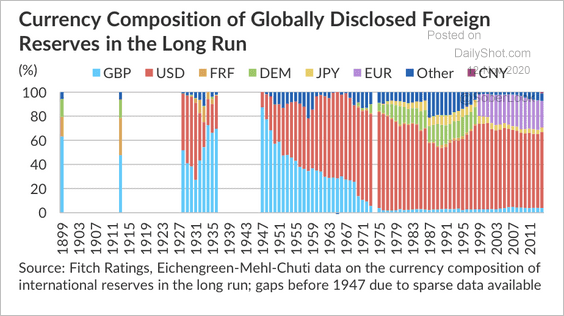 Source: Fitch Ratings
——————–
Food for Thought
1. US job postings by sector:
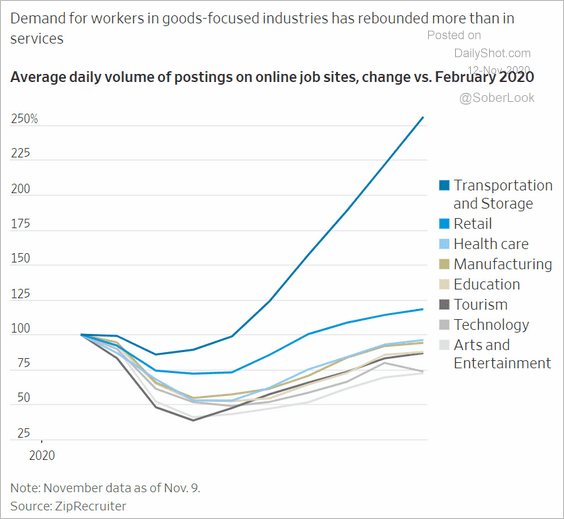 Source: @WSJ Read full article
2. Trending articles on Investopedia during the US election:
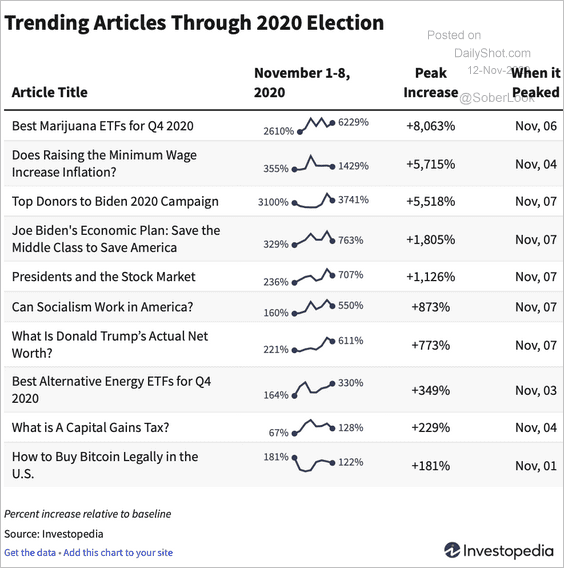 Source: Investopedia Read full article
3. COVID mortality rates:
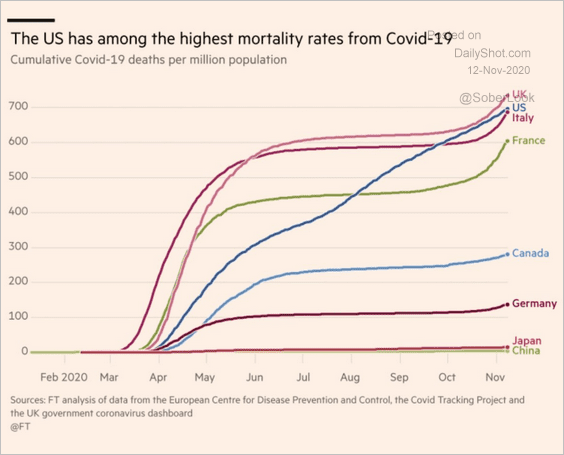 Source: @adam_tooze Read full article
4. Positivity rates across the US:
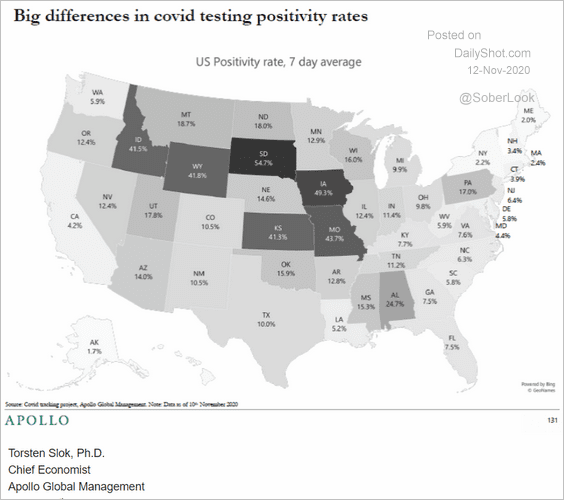 Source: Apollo
5. The latest pandemic uptrend:
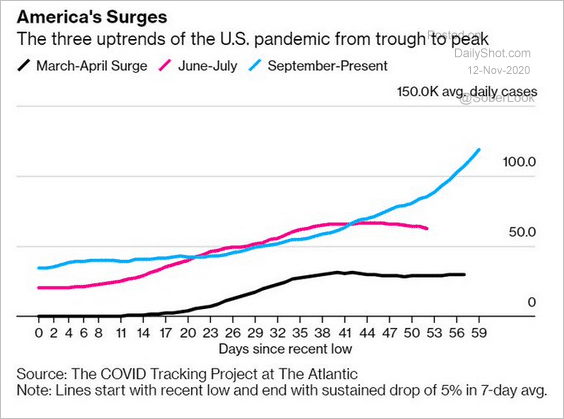 Source: @TheStalwart, @jonathanjlevin Read full article
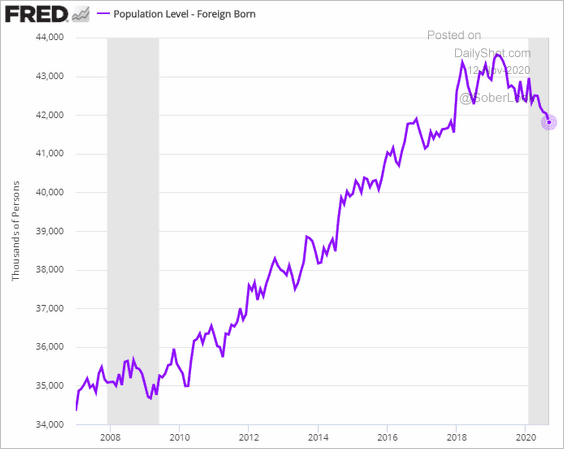
6. US foreign-born population over time:
7. US veterans, by state:
 Source: @FactTank, @uscensusbureau Read full article
8. Giving gifts this holiday season:
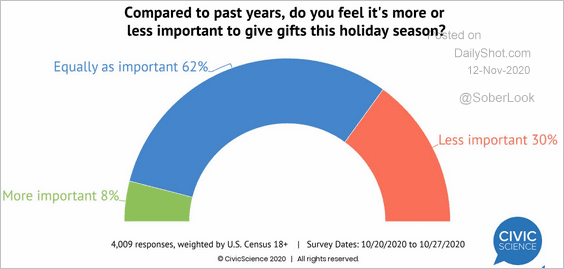 Source: @CivicScience
9. How Americans allocate time saved by not commuting:
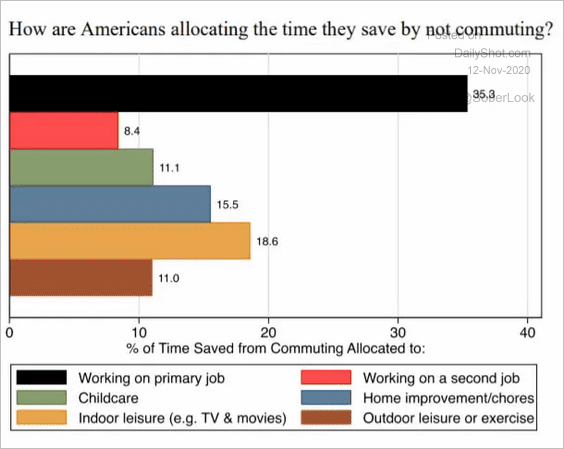 Source: Snippet.Finance Further reading
——————–