The Daily Shot: 01-Dec-20
• The United States
• Canada
• The United Kingdom
• The Eurozone
• Europe
• Japan
• Asia – Pacific
• China
• Emerging Markets
• Cryptocurrency
• Commodities
• Energy
• Equities
• Credit
• Global Developments
• Food for Thought
The United States
1. Let’s begin with the housing market.
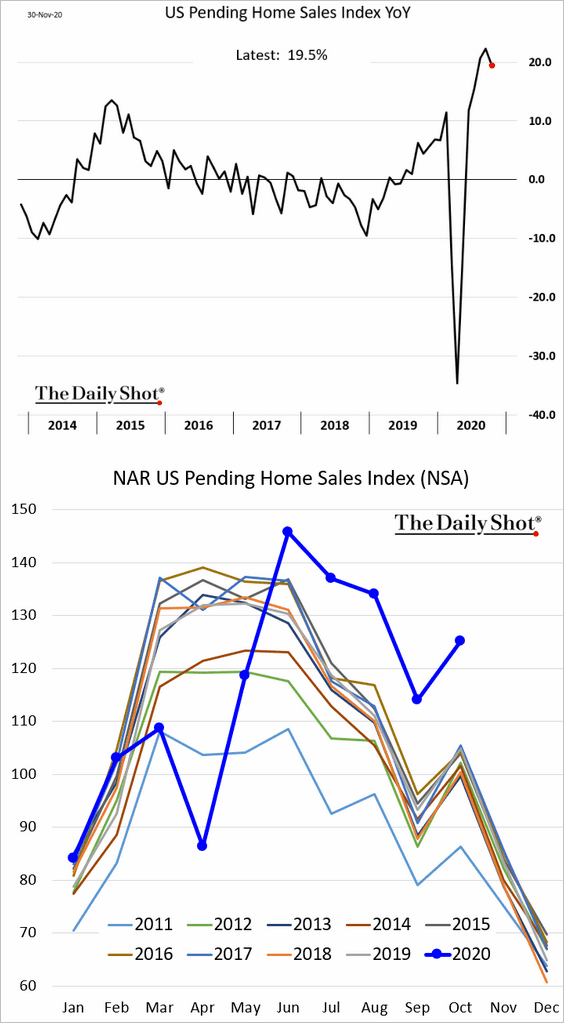
• Pending home sales came off the highs but are still nearly 20% above last year’s levels.
Total existing-home sales will probably moderate as well.
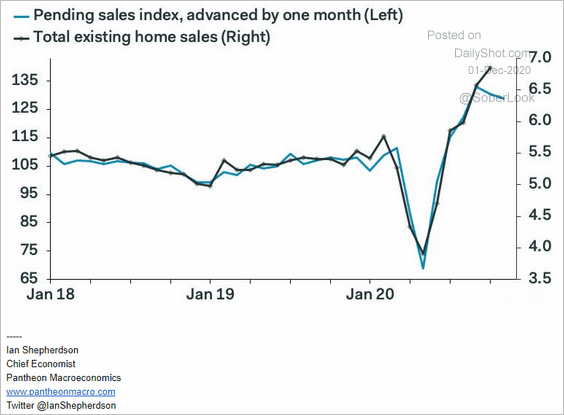 Source: Pantheon Macroeconomics
• CoreLogic still expects home price appreciation to slow next year.
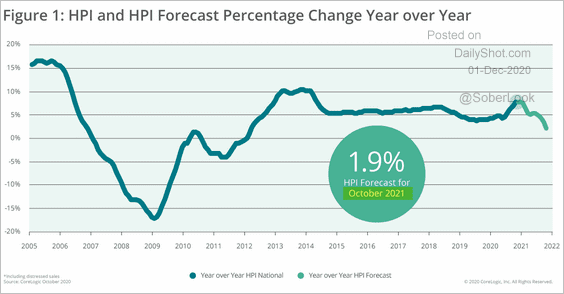 Source: CoreLogic
——————–
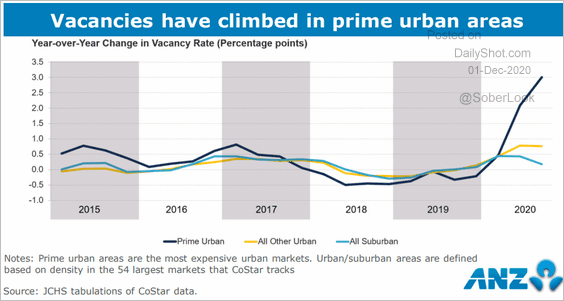
2. Residential vacancies climbed sharply across large cities as demand dwindles (2nd chart).
 Source: ANZ Research
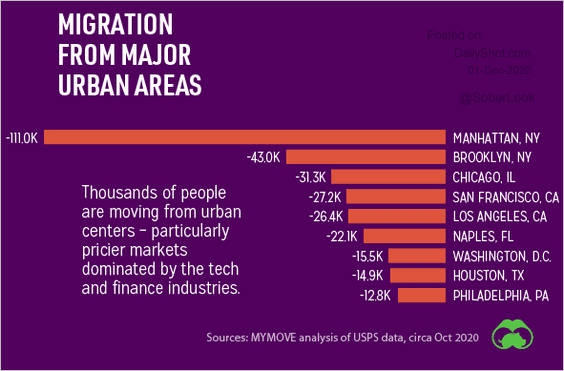 Source: @VisualCap Read full article
Rental weakness has been more pronounced for higher-end residential properties.
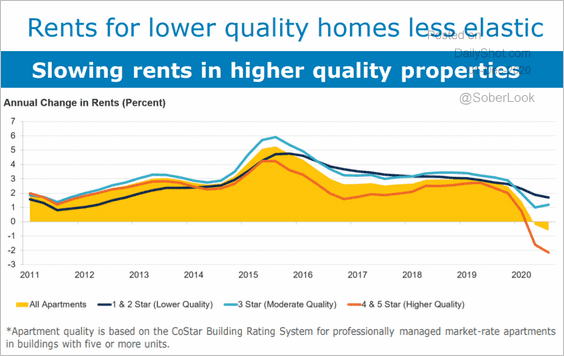 Source: ANZ Research
——————–
3. Here are some updates on the labor market.
• Employment recovery by educational attainment (2 charts):
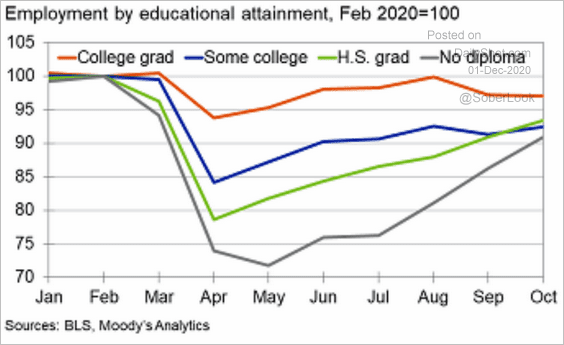 Source: Moody’s Analytics
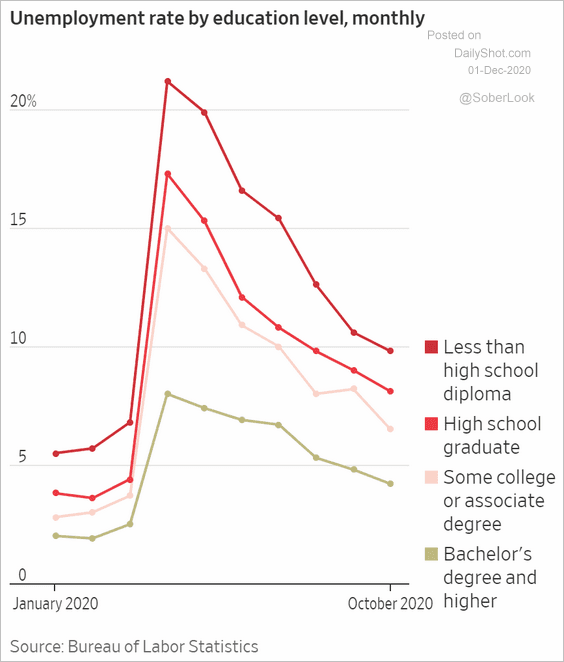 Source: @WSJ Read full article
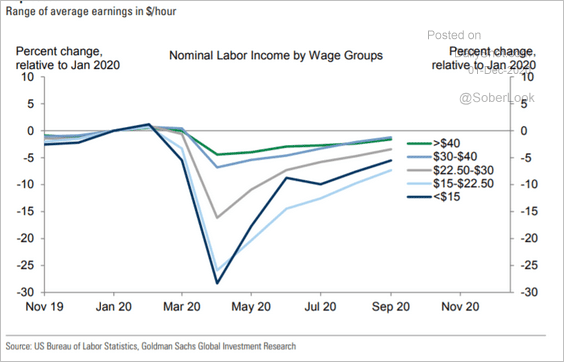
• Recovery in labor income by wage category:
 Source: Goldman Sachs
• Oops …
 Source: @WSJ Read full article
——————–
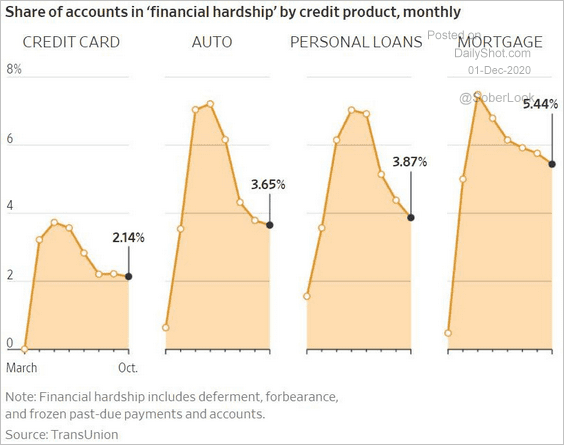
4. This chart shows the percentage of borrowers in each credit product who are experiencing “financial hardship.”
 Source: @WSJ Read full article
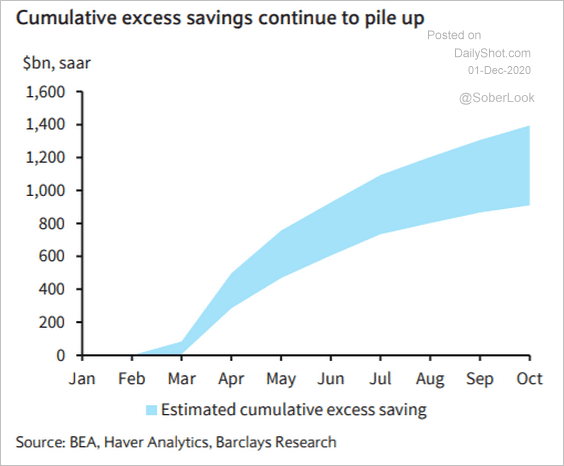
5. Elevated excess savings have been supporting consumer spending.
 Source: Barclays Research
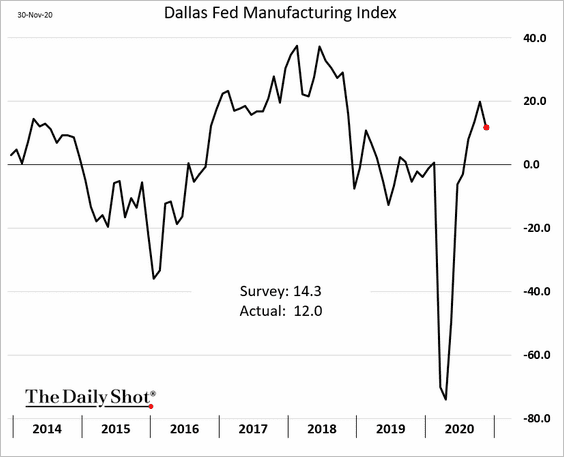
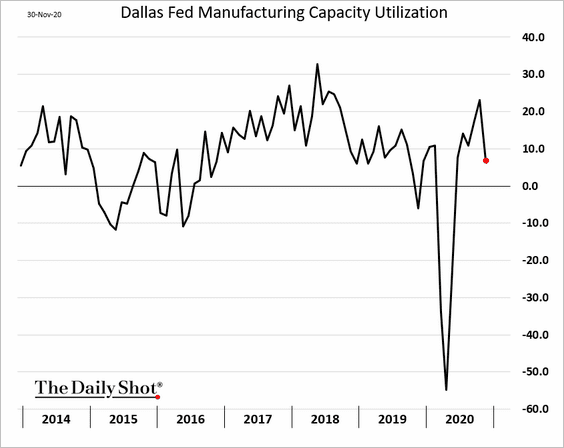
6. The Dallas Fed manufacturing index pulled back in November, but activity remains robust.
——————–
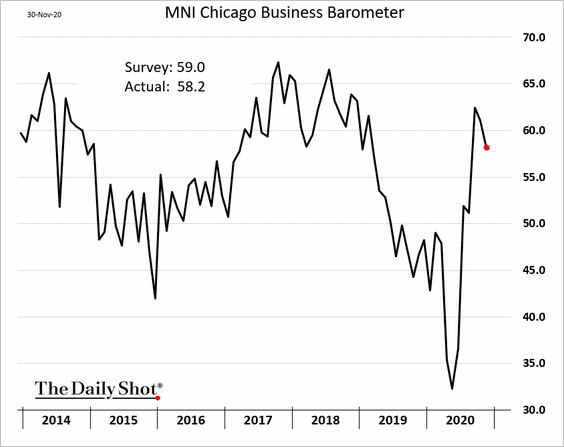
7. The Chicago PMI index (regional business activity) also retreated from the highs.
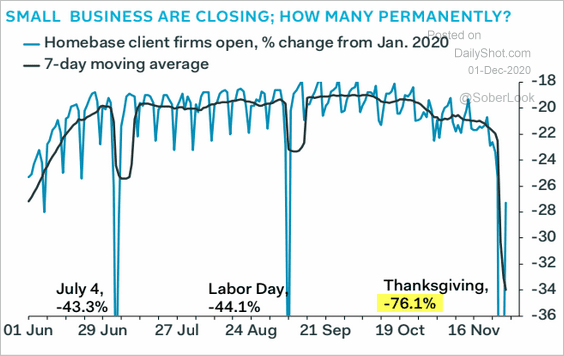
8. Small businesses remain under pressure due to the pandemic.
 Source: Pantheon Macroeconomics
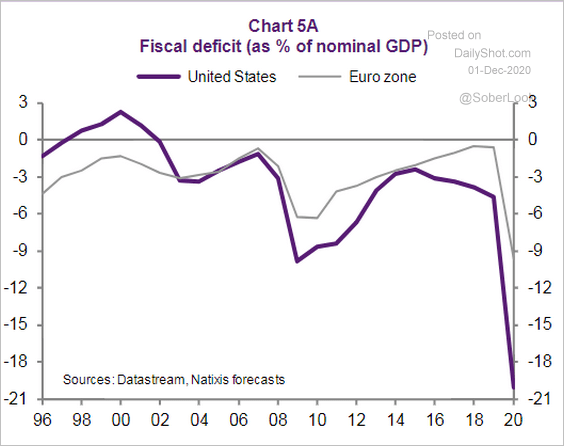
9. This year’s US budget gap far exceeded the levels we see in the Eurozone, which in part explains the US economic outperformance (much larger fiscal stimulus).
 Source: Natixis
Canada
1. Small and medium-size business activity ticked higher. The recovery has been uneven, with the second wave pressuring some sectors.

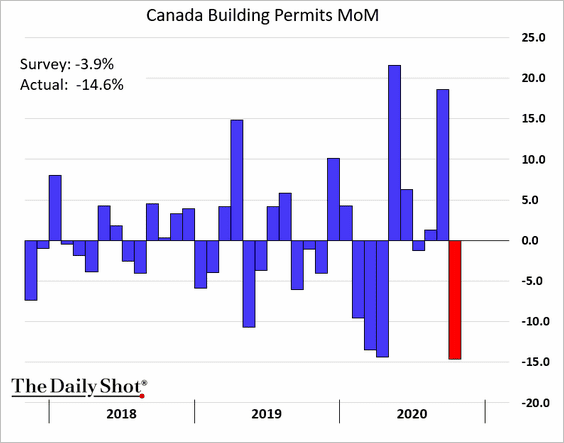
2. Building permits tumbled last month.
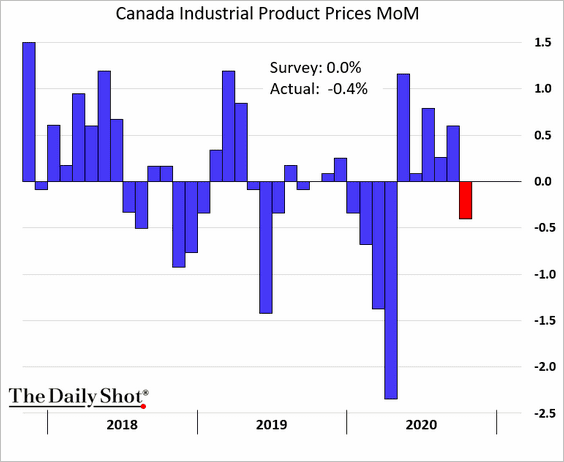
3. Industrial producer prices unexpectedly declined.
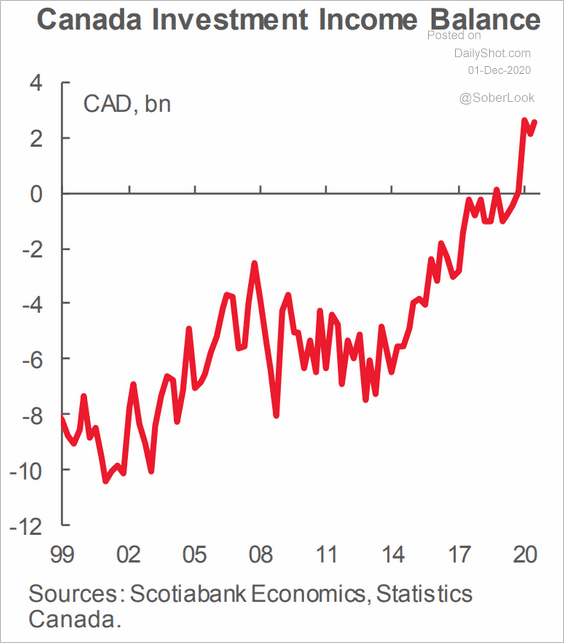
4. Here is Canada’s investment income balance. Canadians are generating more income abroad than foreigners are making in Canada.
 Source: Scotiabank Economics
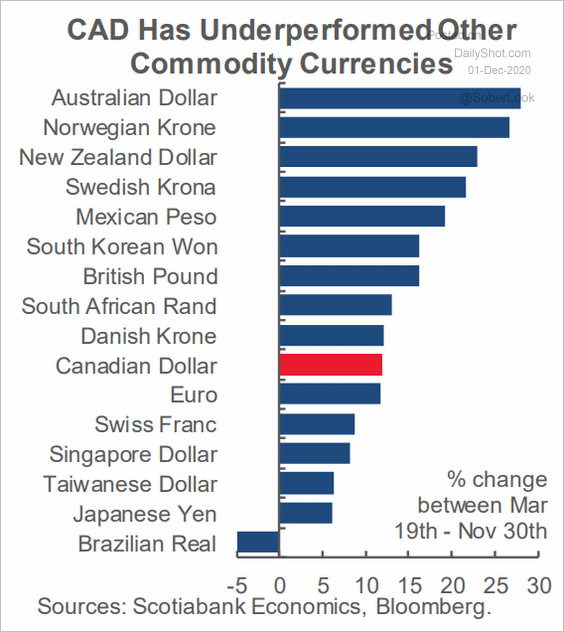
5. The loonie underperformed other commodity currencies in November.
 Source: Scotiabank Economics
The United Kingdom
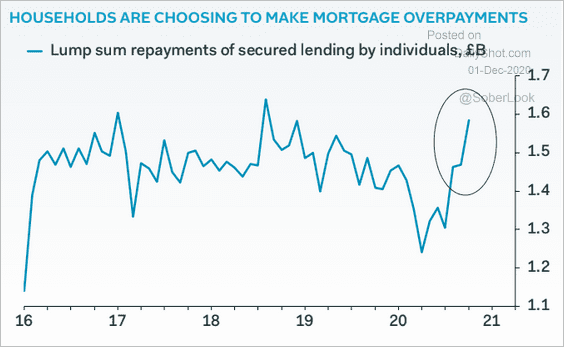
1. Mortgage approvals hit a multi-year high, easily exceeding forecasts.

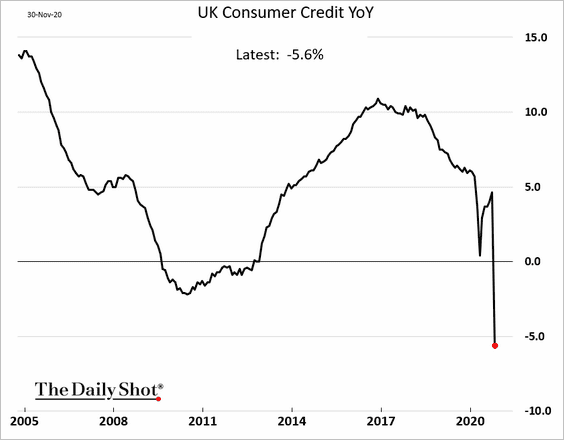
The overall consumer credit has been declining rapidly as households pull back on borrowing and pay down their loans.
 Source: Pantheon Macroeconomics
——————–
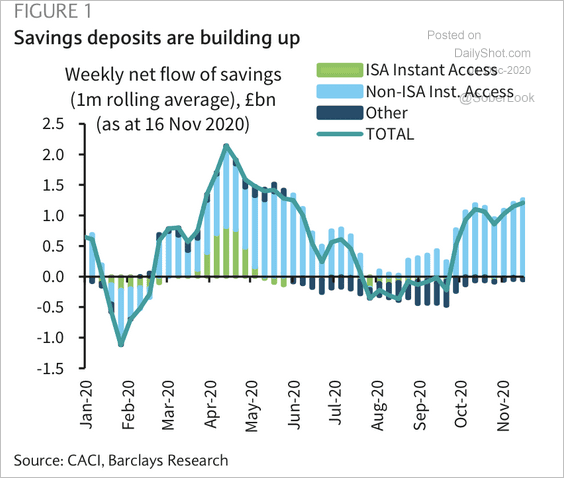
2. Savings deposits have risen over the past two months.
 Source: Barclays Research
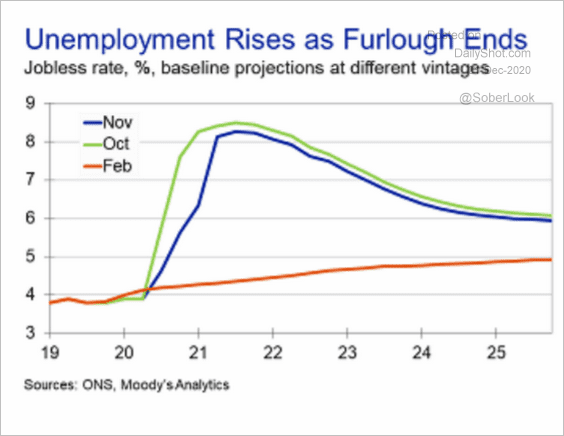
3. The unemployment rate is expected to climb further next year.
 Source: Moody’s Analytics
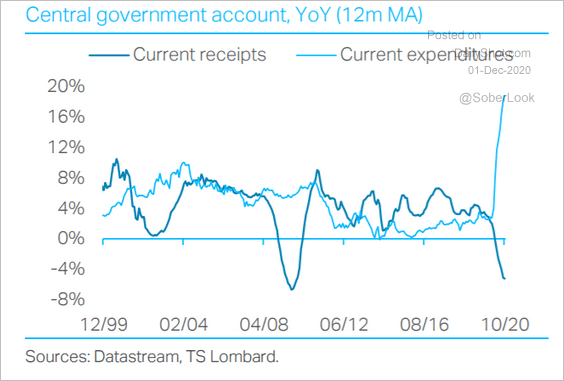
4. This chart shows the government’s receipts and expenditures.
 Source: TS Lombard
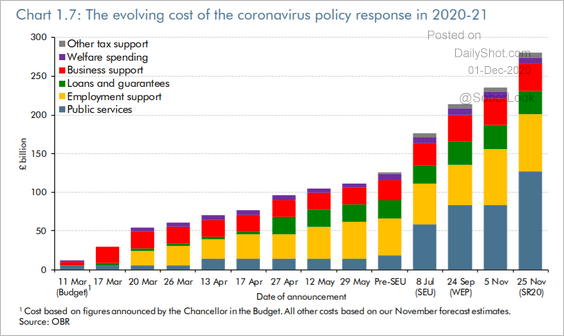
The crisis has been expensive.
 Source: OBR
——————–
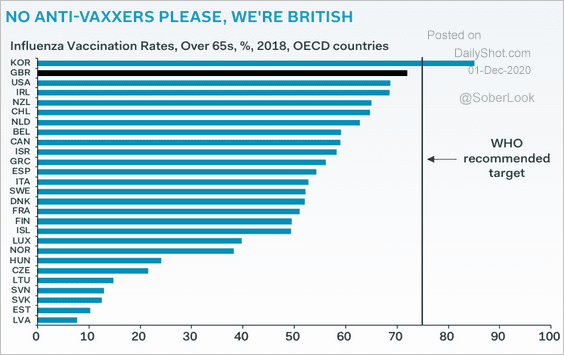
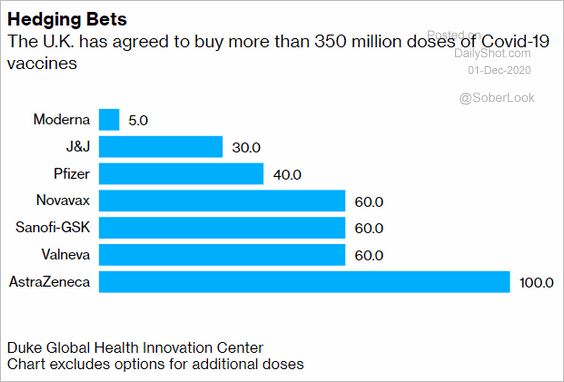
5. Flu vaccination rates suggest that the UK will be successful in rolling out the COVID vaccine.
 Source: Pantheon Macroeconomics
 Source: @bpolitics Read full article
——————–
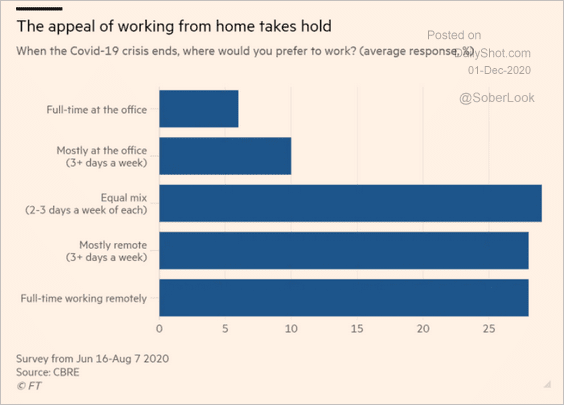
6. Working from home is not a temporary change.
 Source: @financialtimes Read full article
The Eurozone
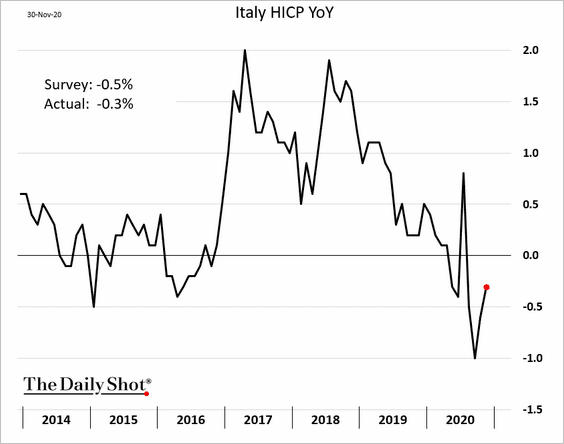
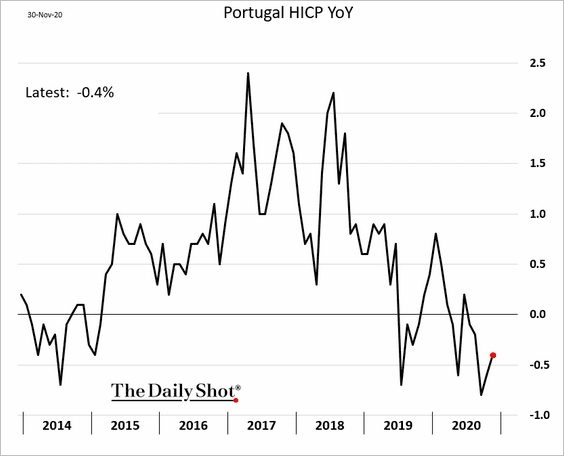
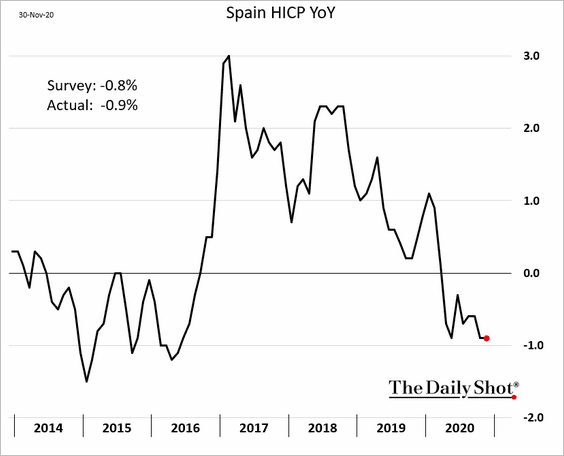
1. Let’s begin with the CPI report.
• Italy and Portugal saw an uptick in inflation.
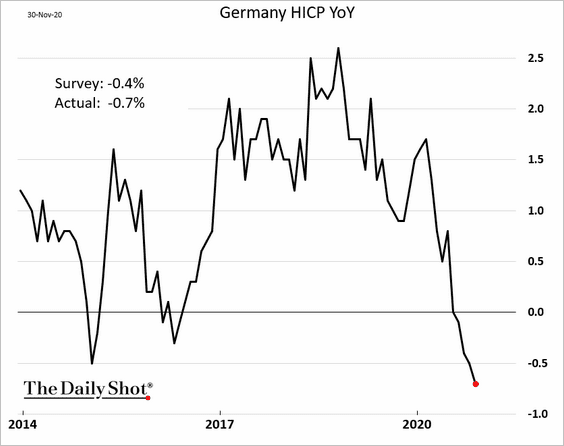
• Consumer prices were lower in Spain and Germany (below consensus). Germany’s CPI is the lowest in recent years.
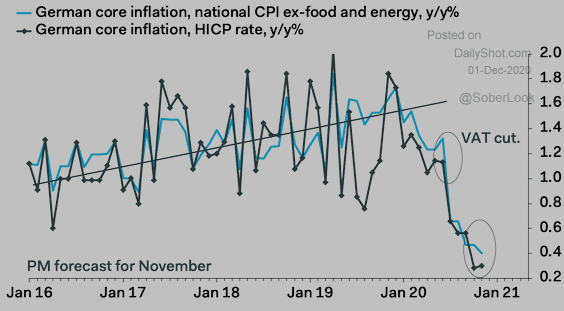
Germany’s core CPI is also soft.
 Source: Pantheon Macroeconomics
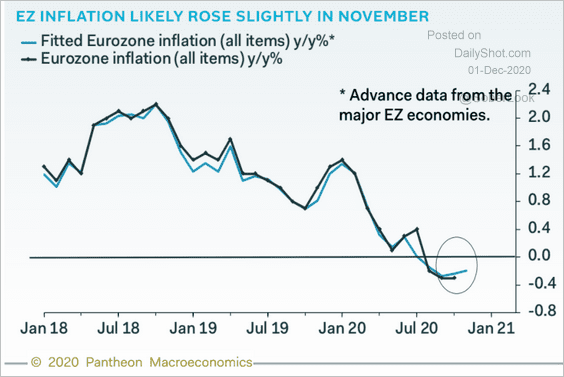
• Inflation probably ticked higher at the Eurozone level.
 Source: Pantheon Macroeconomics
——————–
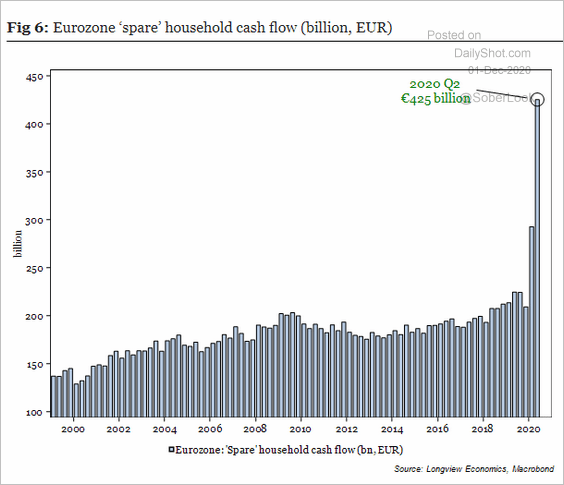
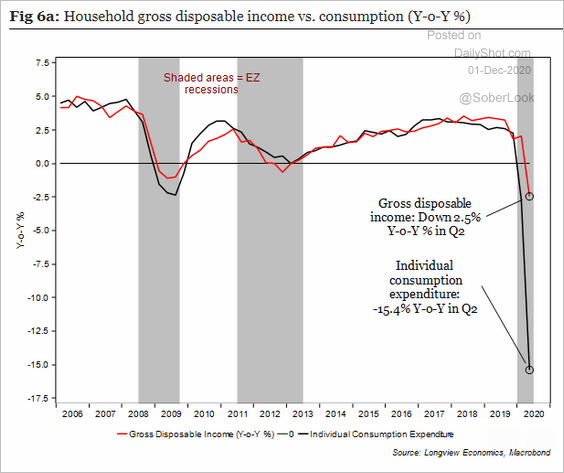
2. “Spare” household cash flow has been unprecedented, …
 Source: Longview Economics
… driven by the massive gap between disposable income and consumption.
 Source: Longview Economics
——————–
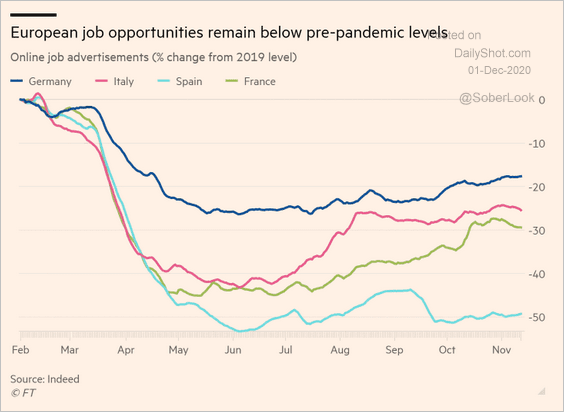
3. Job opportunities remain depressed.
 Source: @financialtimes Read full article
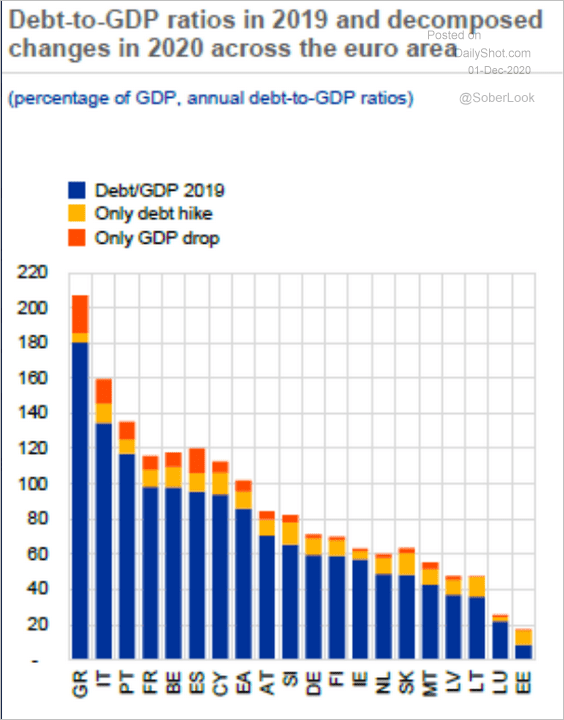
4. This chart shows the attribution of gains in debt-to-GDP ratios.
 Source: ECB Read full article
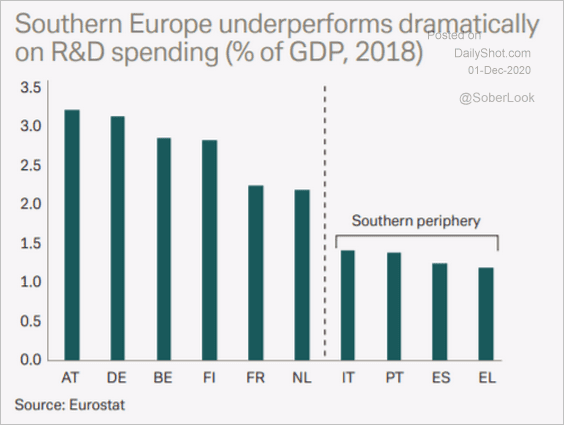
5. R&D Spending has been weak in southern Europe.
 Source: Deutsche Bank Research
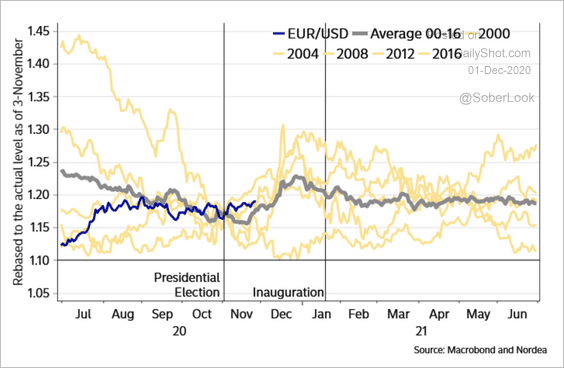
6. The euro is testing resistance at 1.20.
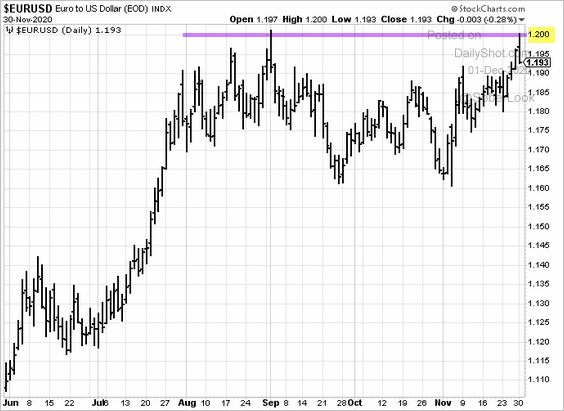
Will it sustain a break above 1.20 before New Year’s?
 Source: Nordea Markets
 Source: Nordea Markets
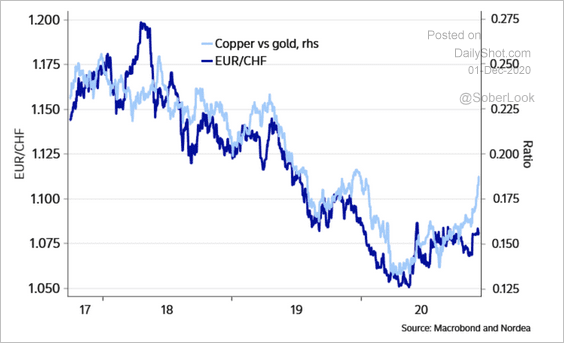
Separately, EUR/CHF has been correlated with the copper/gold ratio over the past few years.
 Source: Nordea Markets
——————–
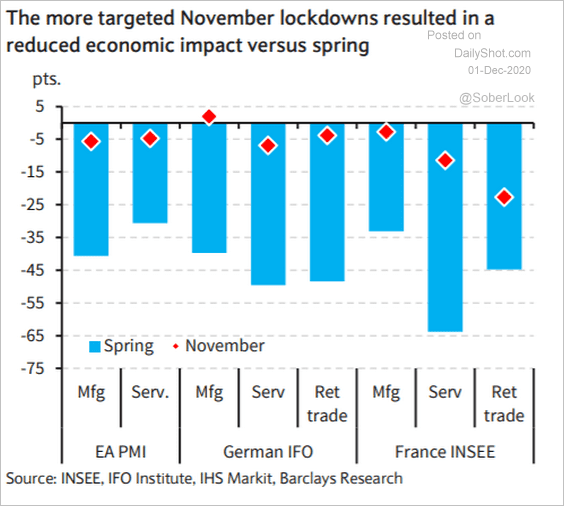
8. The second-wave lockdowns haven’t been nearly as severe as the first wave.
 Source: Barclays Research
Europe
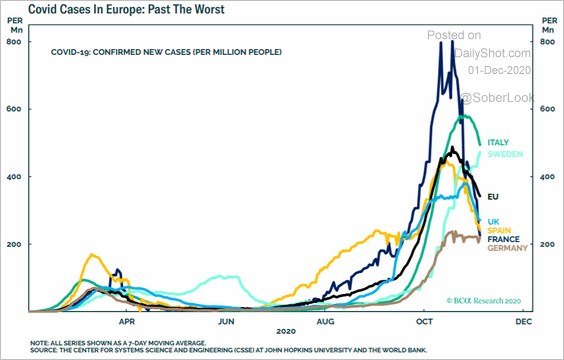
1. New COVID cases have peaked.
 Source: BCA Research
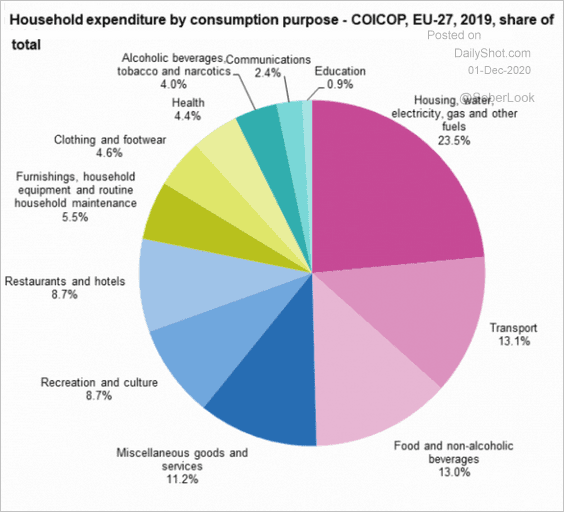
2. How do EU households spend their money?
 Source: Eurostat Read full article
3. What percentage of small and medium-sized firms are late on their payments?
 Source: ECB Read full article
Japan
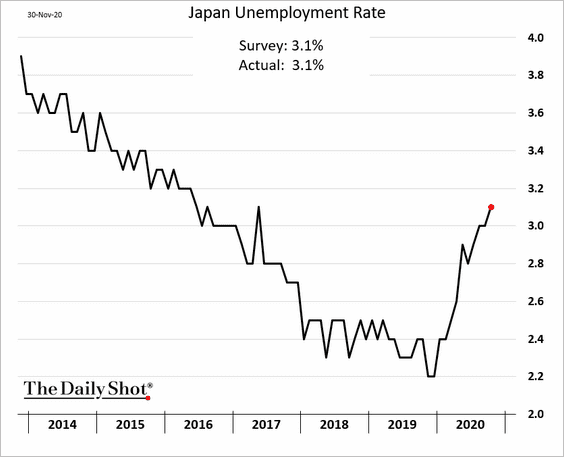
1. The unemployment rate keeps grinding higher.
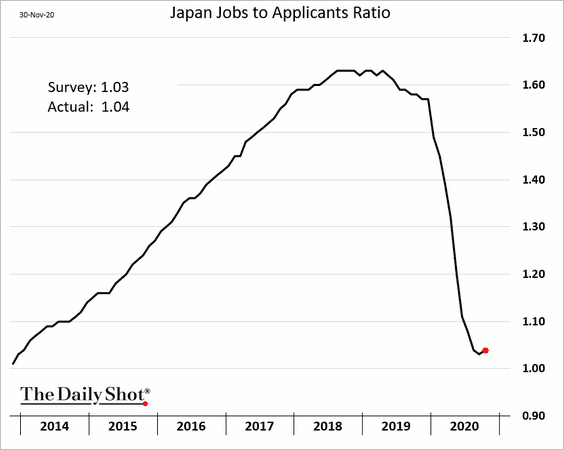
But the jobs-to-applicants ratio appears to have bottomed.
——————–
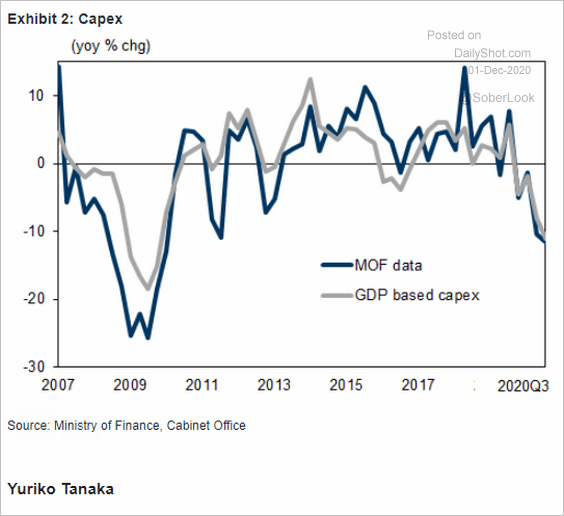
2. Business investment has slowed sharply this year.
 Source: Goldman Sachs
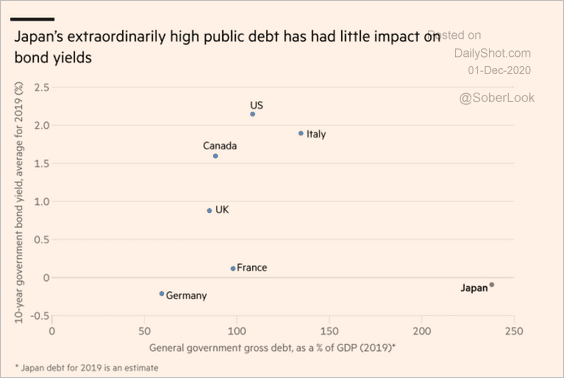
3. Massive public debt has not resulted in higher bond yields (thanks to the BoJ).
 Source: @financialtimes Read full article
4. Rate differentials suggest a lower USD/JPY. Will we see a break below 100?
 Source: Nordea Markets
Asia – Pacific
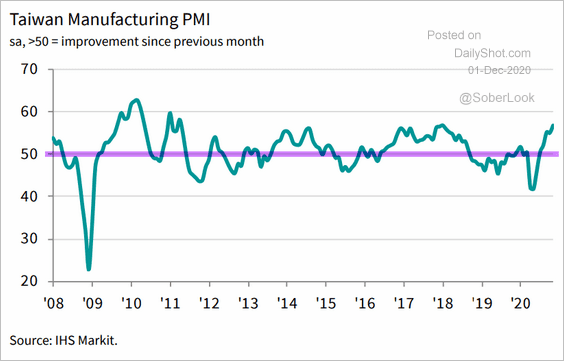
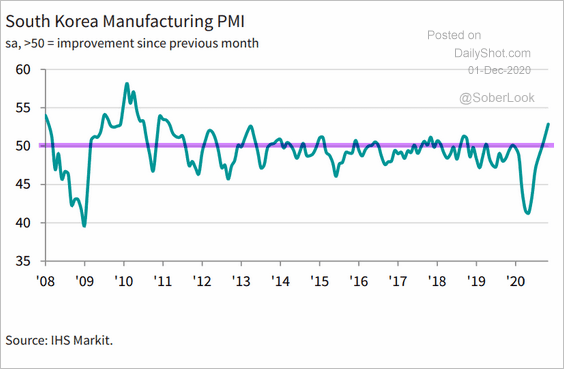
1. Taiwan’s and South Korea’s manufacturing PMI reports show accelerating factory activity.
 Source: IHS Markit
 Source: IHS Markit
——————–
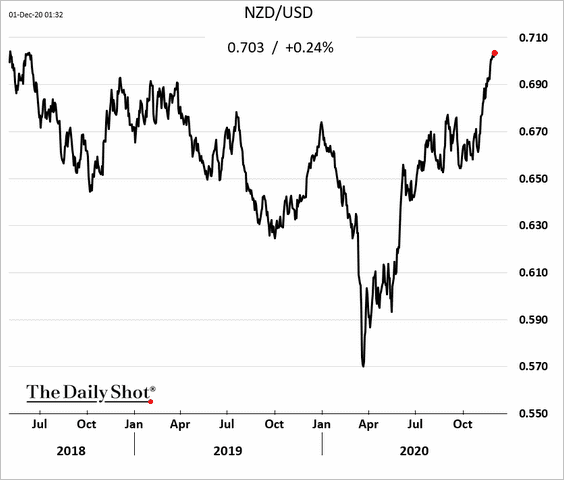
2. The Kiwi dollar hit a multi-year high.
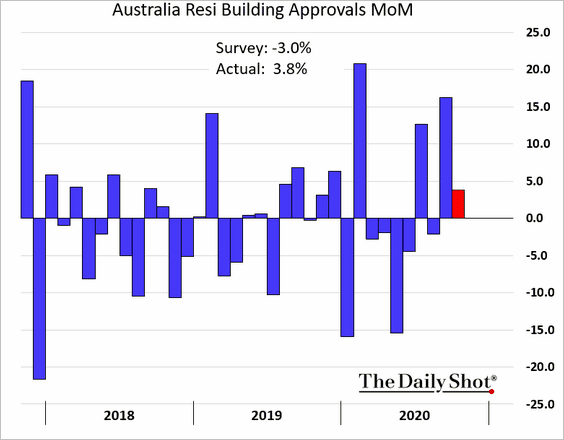
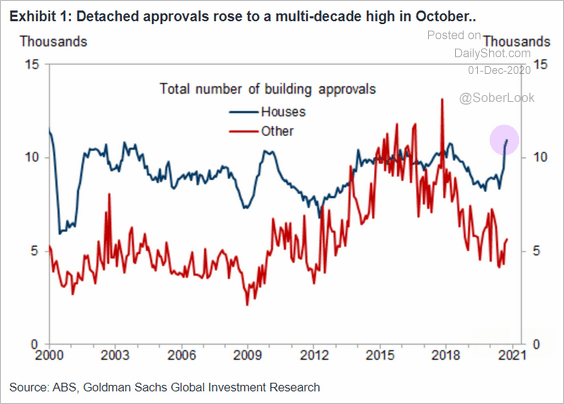
3. Next, we have some updates on Australia.
• Building approvals surprised to the upside, driven by single-family homes.
 Source: Goldman Sachs
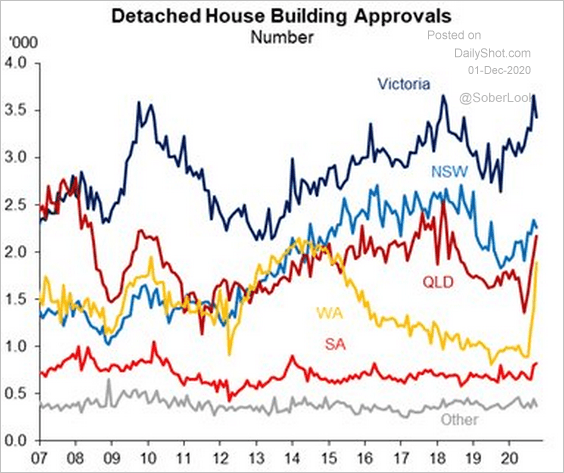
Here is the regional breakdown.
 Source: @justinfabo
——————–
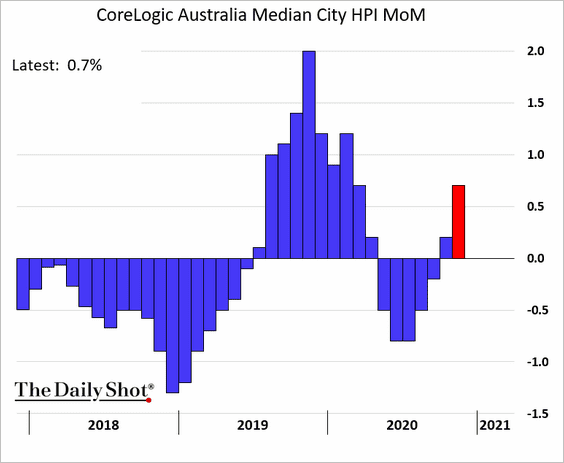
• Home prices are climbing again.
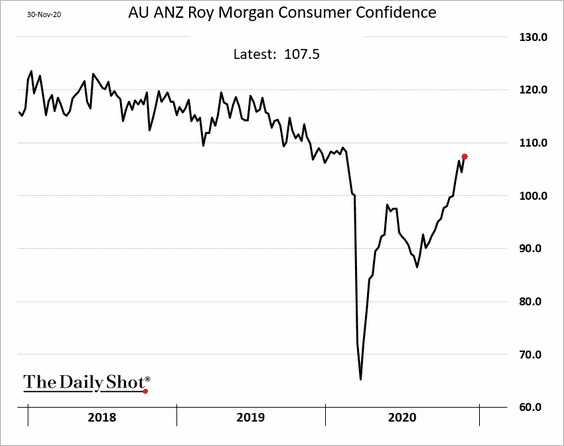
• Consumer confidence has nearly fully recovered.
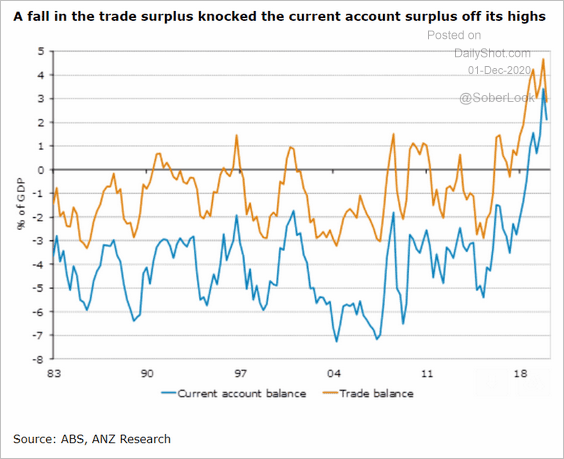
• Trade surplus came off the highs.
 Source: ANZ Research
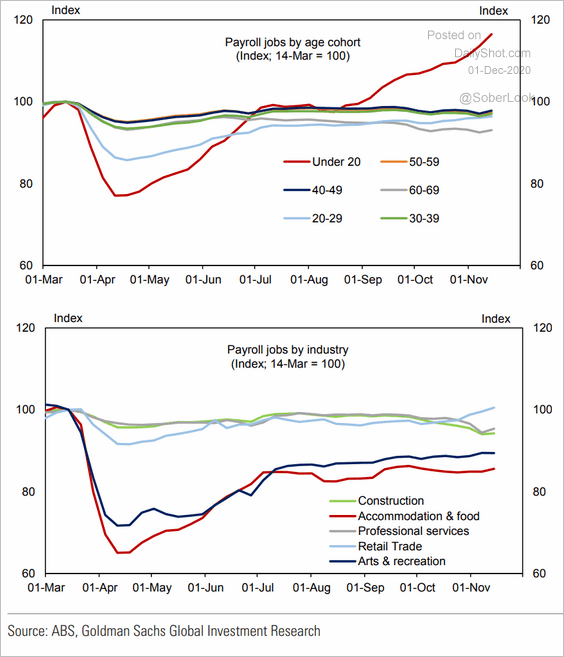
• Here are the trends in Australia’s payrolls.
 Source: Goldman Sachs
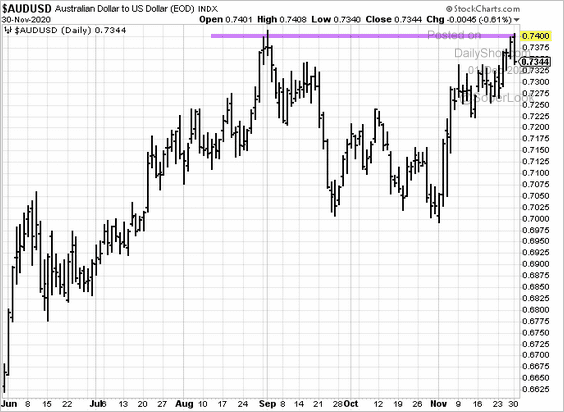
• The Aussie dollar is testing resistance at USD 0.74.
China
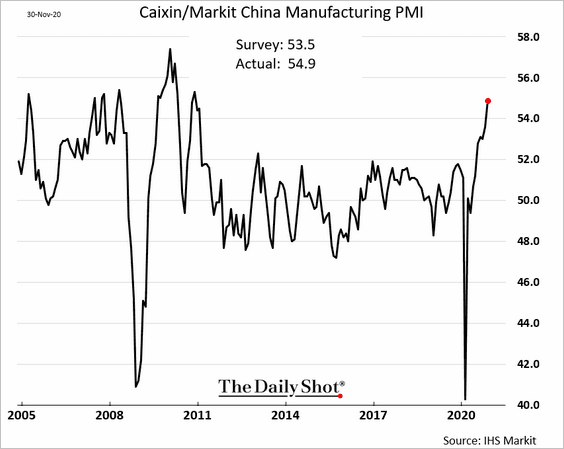
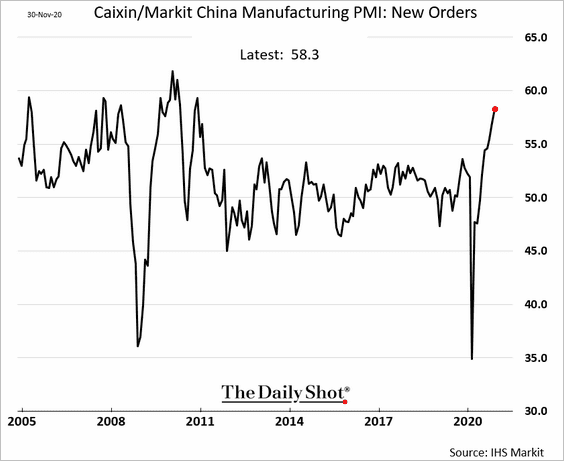
1. The Markit PMI result surprised to the upside, with factory growth accelerating.
——————–
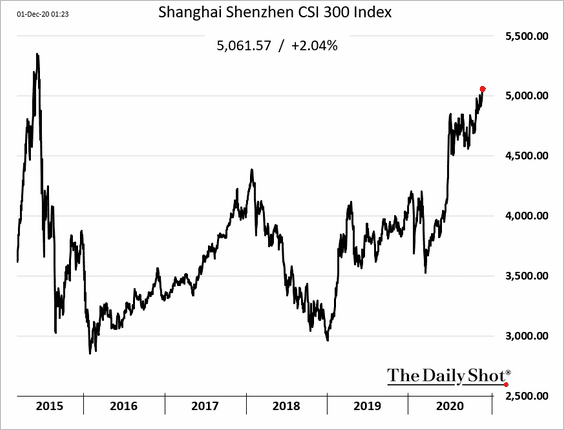
2. The stock market benchmark index hit the highest level since the 2015 bubble.
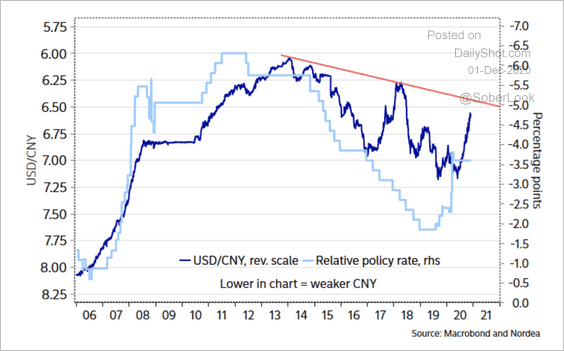
3. USD/CNY is facing resistance.
 Source: Nordea Markets
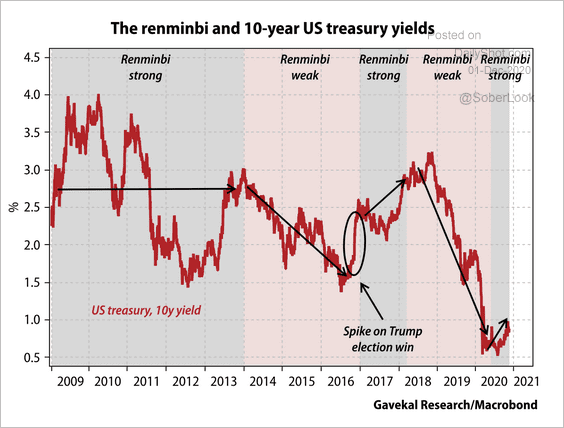
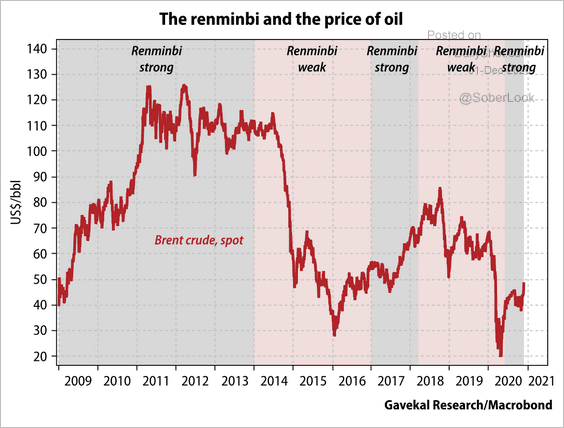
Generally, a weaker renminbi has coincided with falling Treasury yields and lower oil prices.
 Source: Gavekal
 Source: Gavekal
——————–
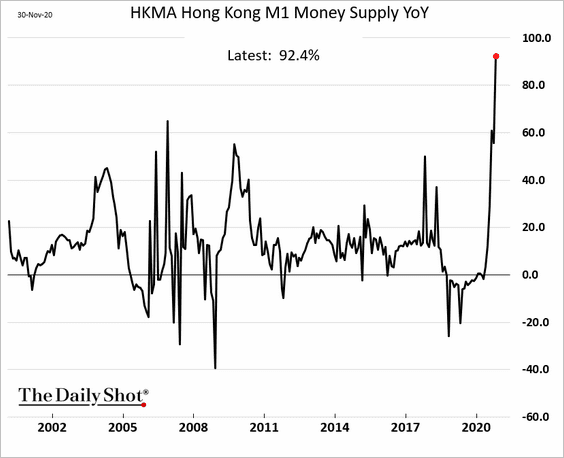
4. Hong Kong’s financial system is awash with liquidity.
Emerging Markets
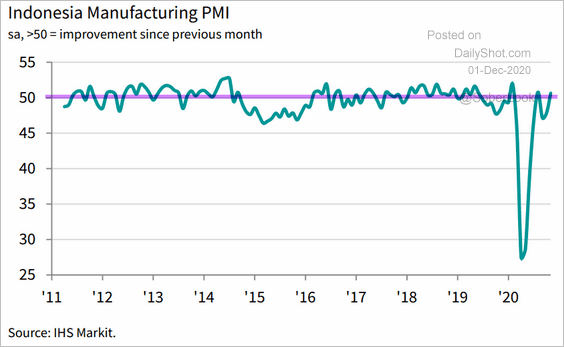
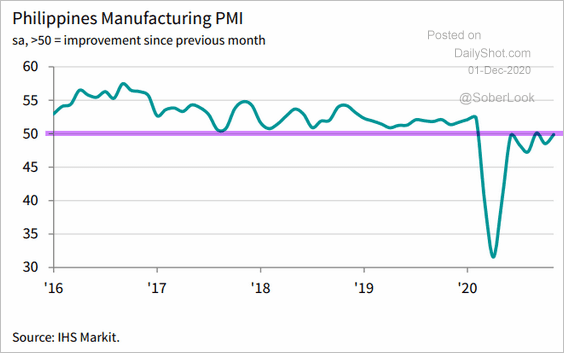
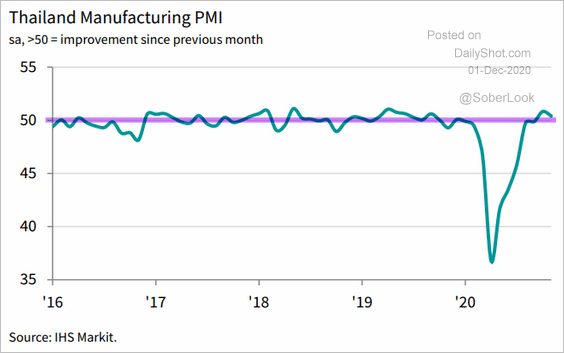
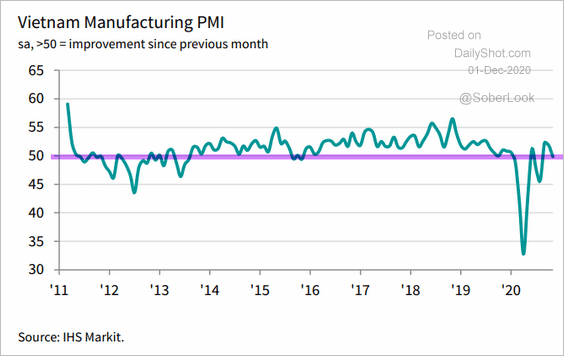
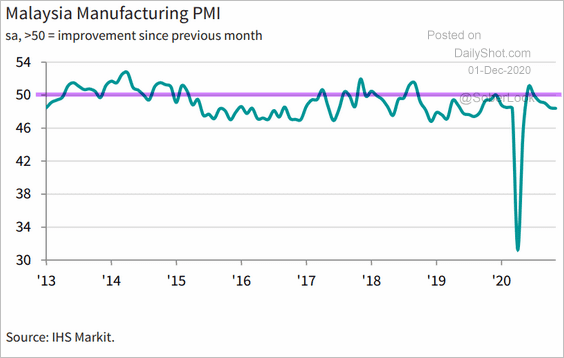
1. While China, Taiwan, and South Korea all saw substantial expansion in factory activity in November, that hasn’t been the case for other Asian economies. The manufacturing PMI indices show most countries treading water (PMI close to 50).
• Indonesia:
 Source: IHS Markit
• The Philippines:
 Source: IHS Markit
• Thailand:
 Source: IHS Markit
• Vietnam:
 Source: IHS Markit
• Malaysia (contraction):
 Source: IHS Markit
——————–
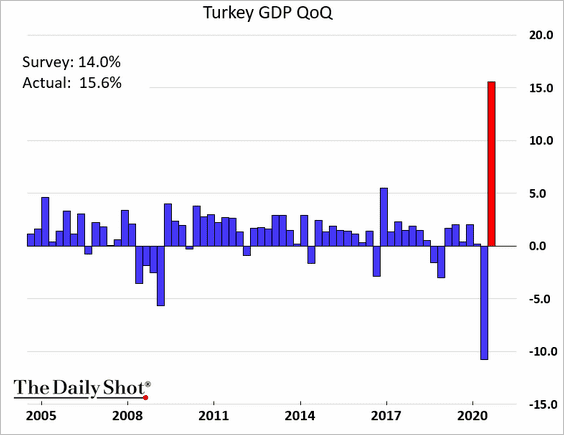
2. Turkey’s Q3 GDP rebound was stronger than expected.
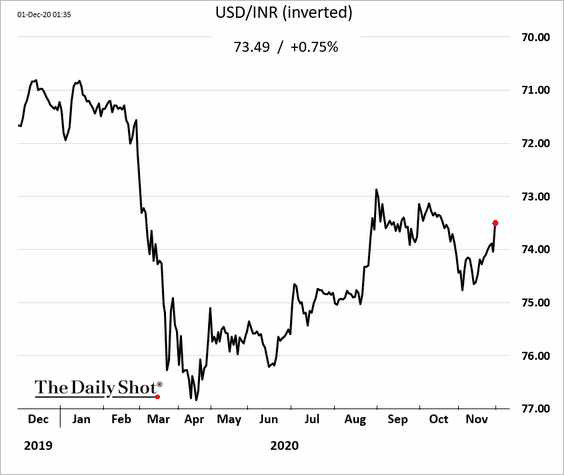
3. The rupee is climbing, driven by capital inflows.
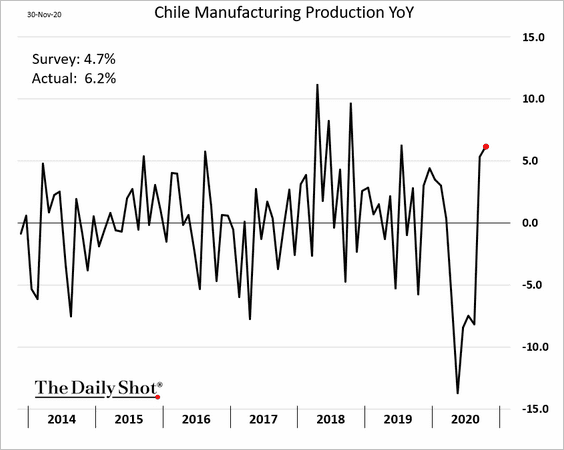
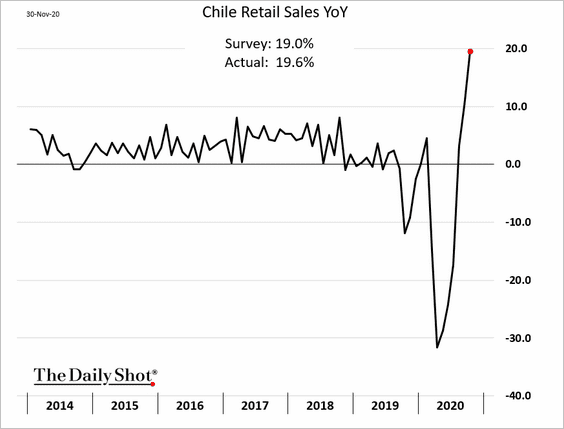
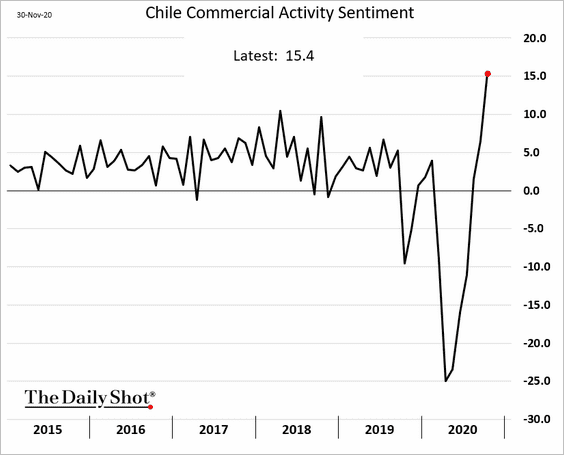
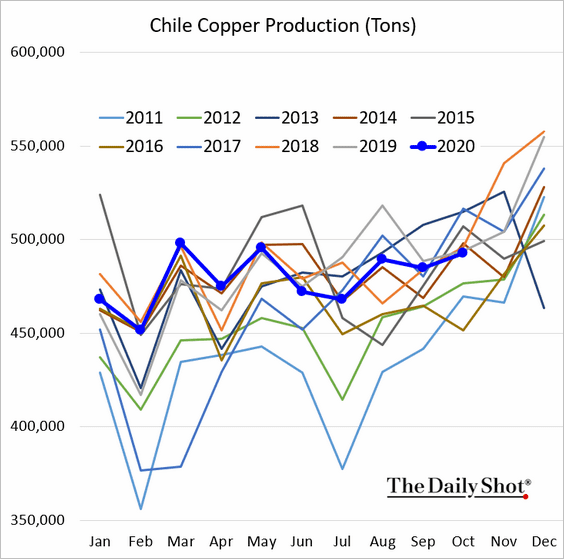
4. Chile’s economy continues to recover.
• Industrial production:
• Retail sales:
• Commercial activity:
Chile’s copper output is in line with 2019 and 2018 levels.
——————–
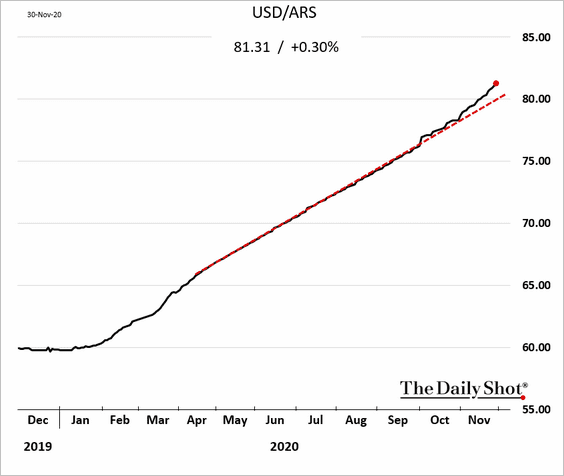
5. Argentina is accelerating the peso’s devaluation.
6. Brazil’s fiscal situation continues to deteriorate (2 charts):
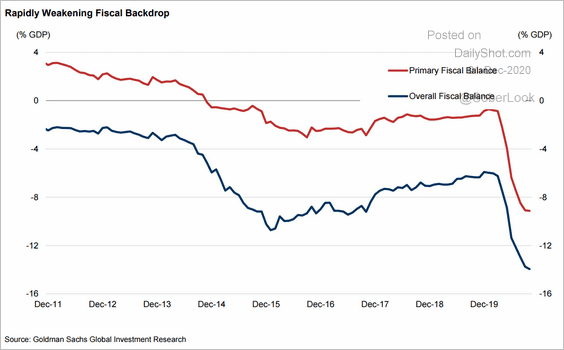 Source: Goldman Sachs
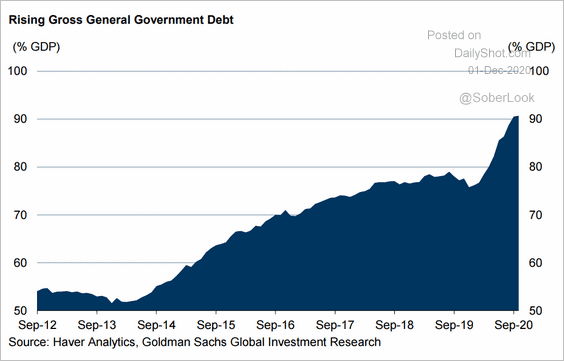 Source: Goldman Sachs
Cryptocurrency
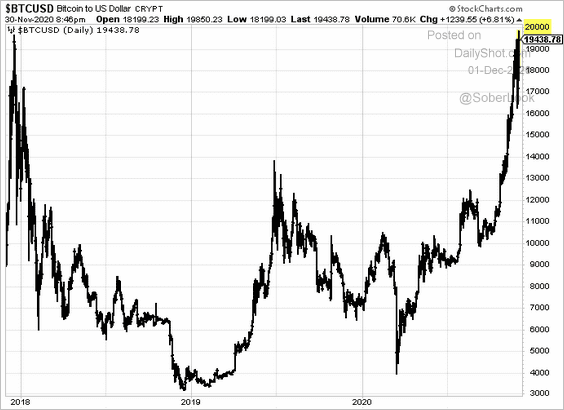
Bitcoin hit a record high, pushing toward $20k.
Commodities
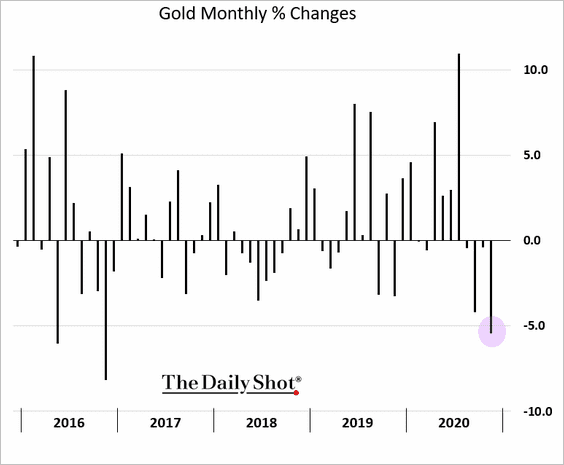
1. Let’s start with gold.
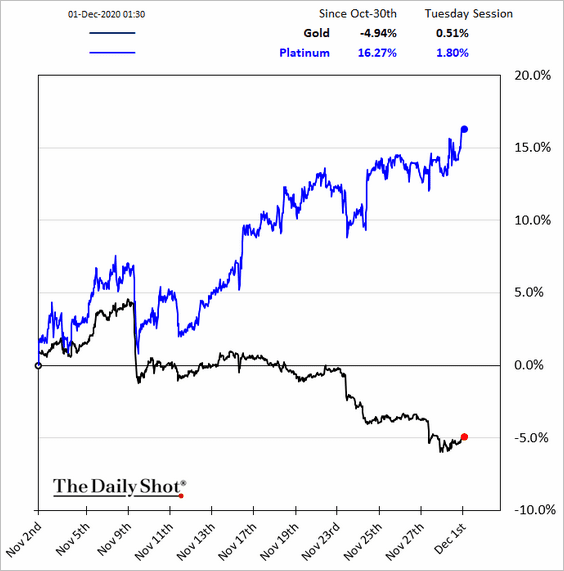
• It’s been a rough month.
• Here is gold vs. platinum.
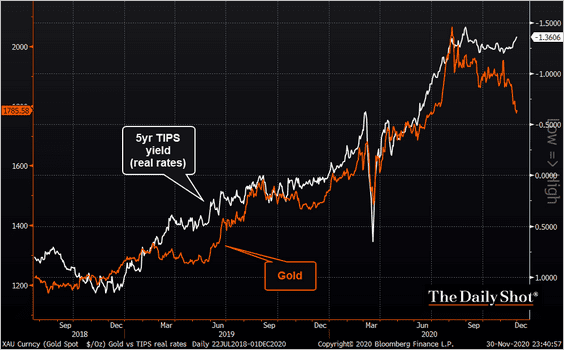
• Gold has diverged from real rates (TIPS yields), pointing to potential gains ahead for the precious metal.
 Source: @TheTerminal, Bloomberg Finance L.P.
——————–
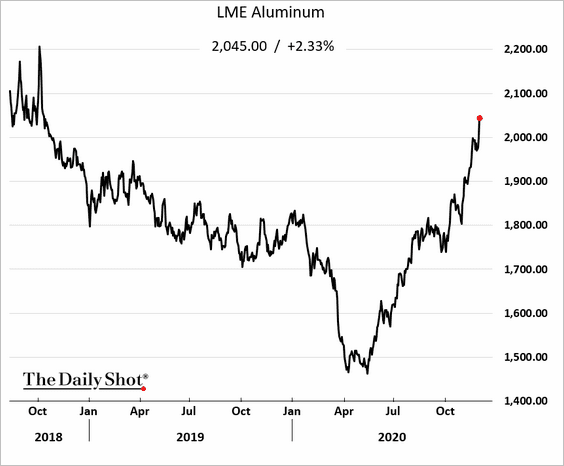
2. The rally in aluminum continues.
Energy
1. Here is a look at the November performance for energy products and energy equity indices.
 Source: S&P Global Market Intelligence
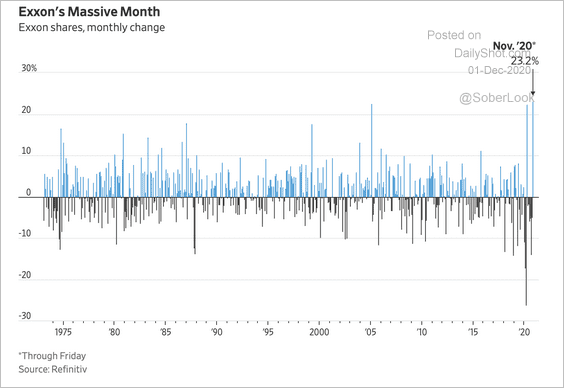
Exxon Mobil’s stock just had its best month since at least 1972.
 Source: @WSJ Read full article
——————–
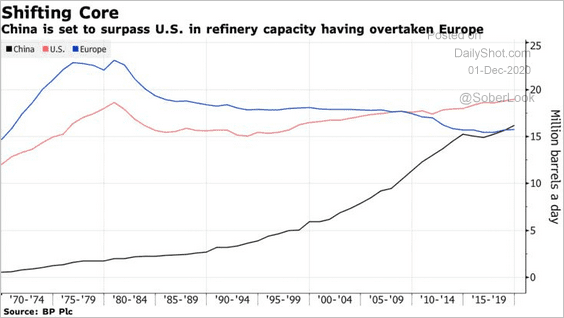
2. China’s refining capacity has overtaken Europe.
 Source: @markets Read full article
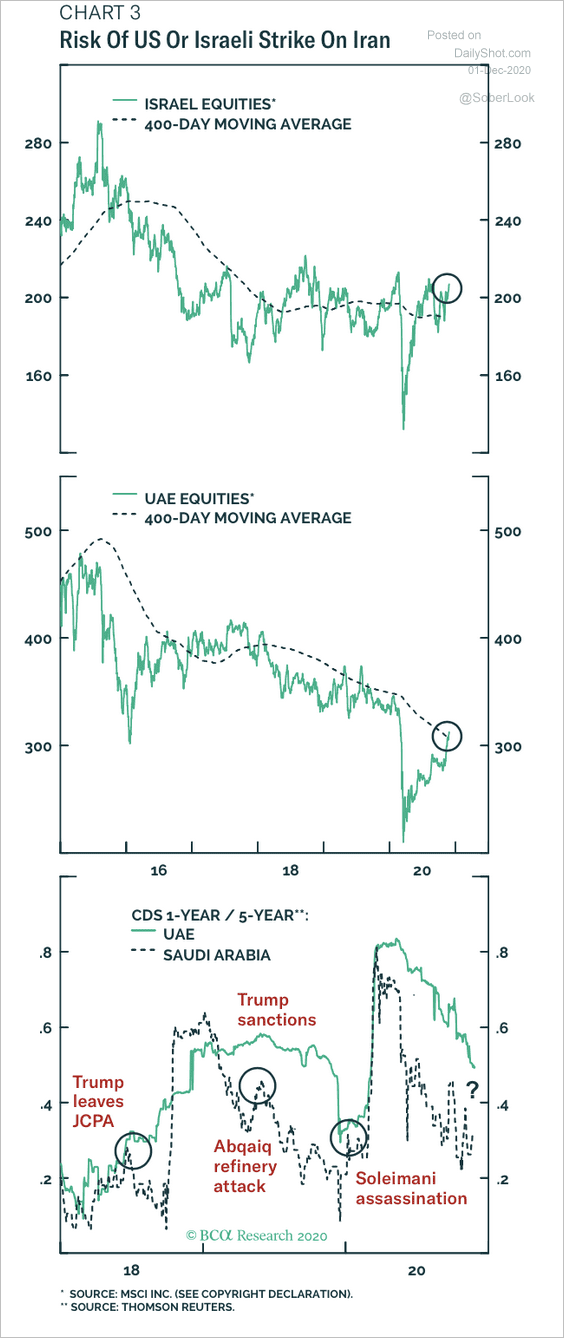
3. Financial markets are not prepared for geopolitical risk in the Middle East, according to BCA Research (see article).
 Source: BCA Research
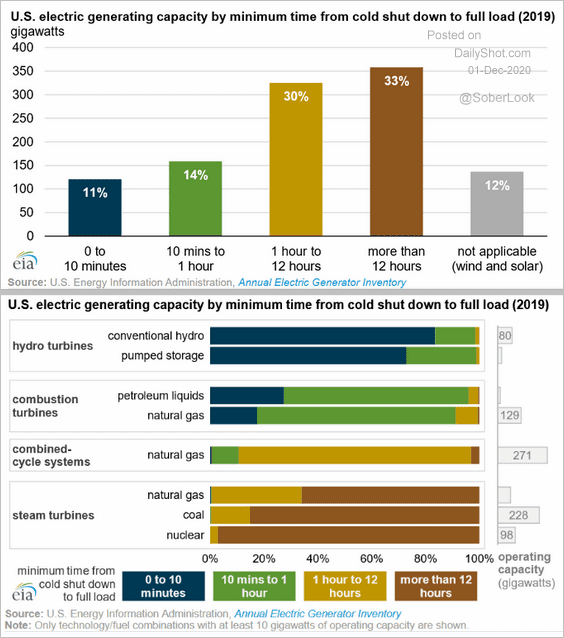
4. According to EIA, “about 25% of U.S. power plants can start up within an hour.”
 Source: @EIAgov Read full article
Equities
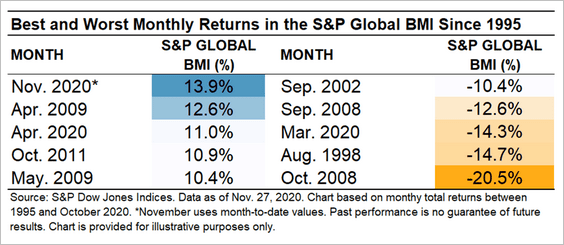
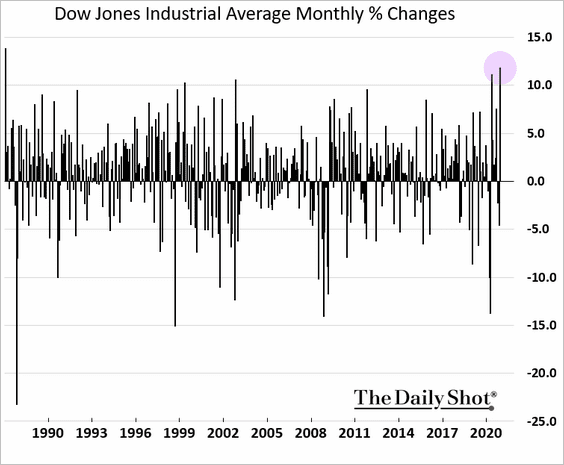
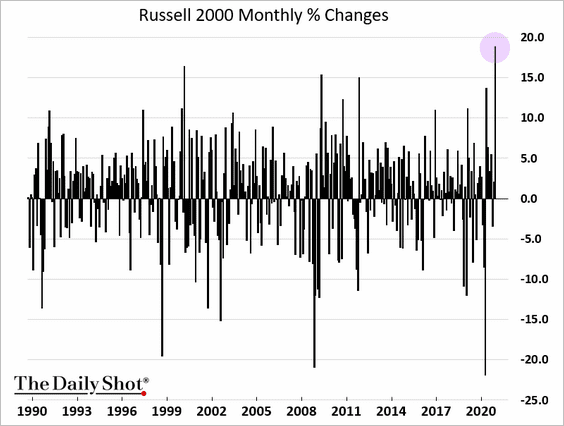
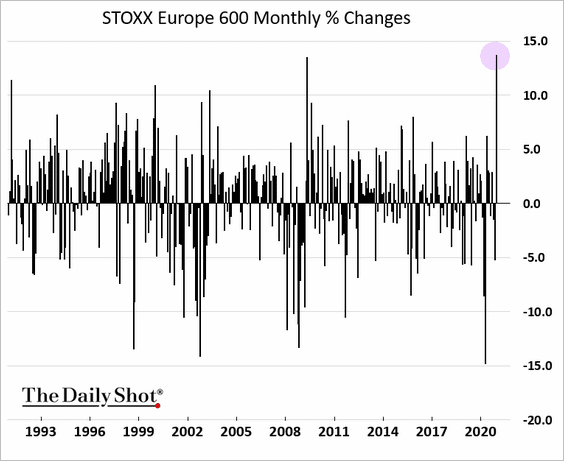
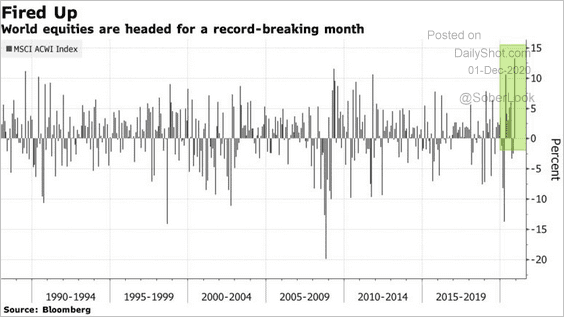
1. It’s been a good month for stocks.
• The S&P 500:
 Source: S&P Global Market Intelligence
• The Dow:
• Small caps:
• European stocks:
• Global equities:
 Source: @markets Read full article
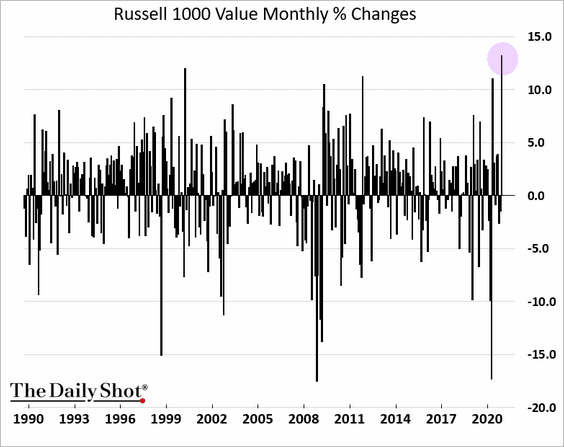
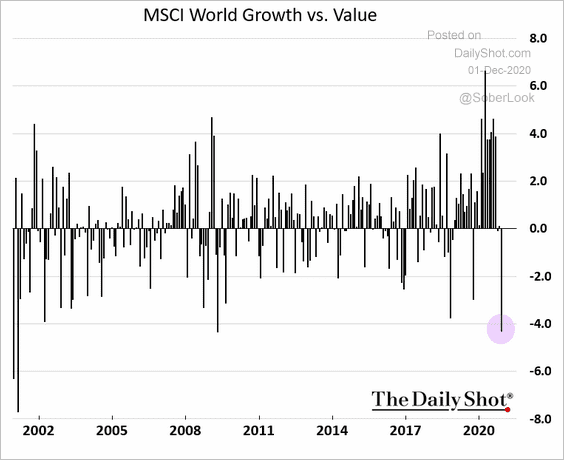
• Value stocks did particularly well, …
… while growth underperformed by most in two decades.
 h/t @IshikaMookerjee
——————–
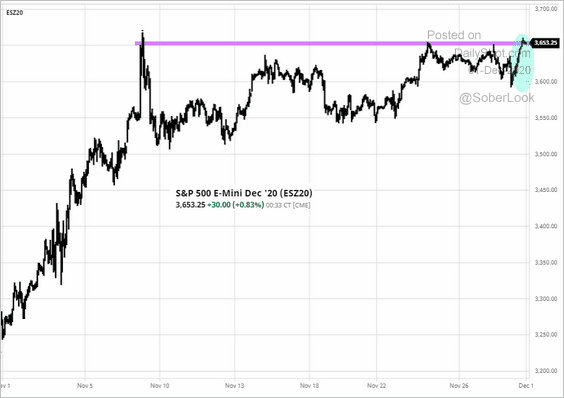
2. S&P 500 futures are up again this morning.
 Source: barchart.com
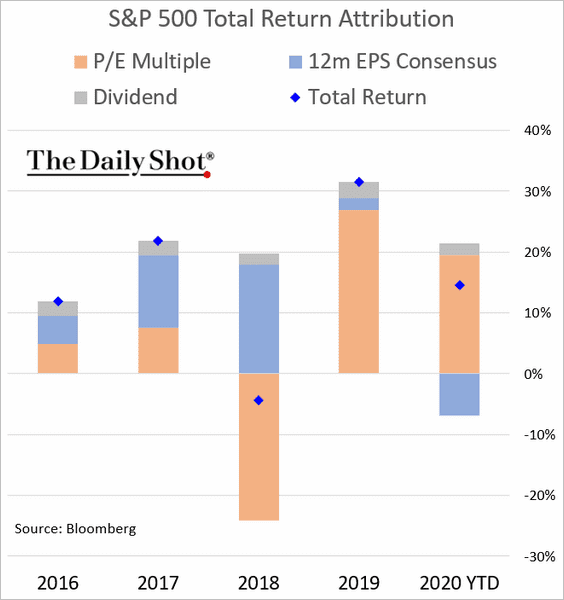
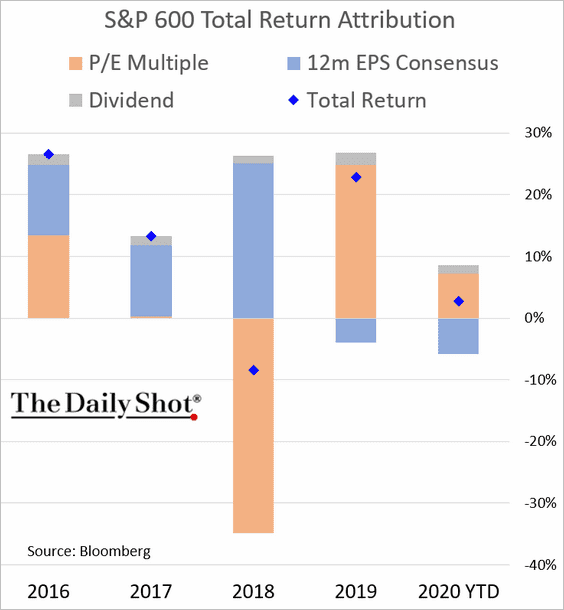
3. Here is the year-to-date performance attribution.
• S&P 500:
• S&P 600 (small caps):
——————–
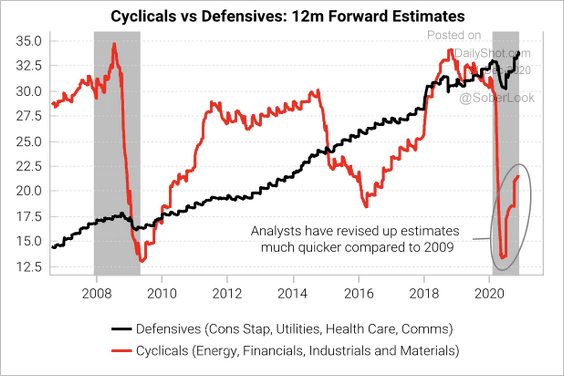
4. Analysts continue to revise up their earnings estimates for cyclical companies.
 Source: Variant Perception
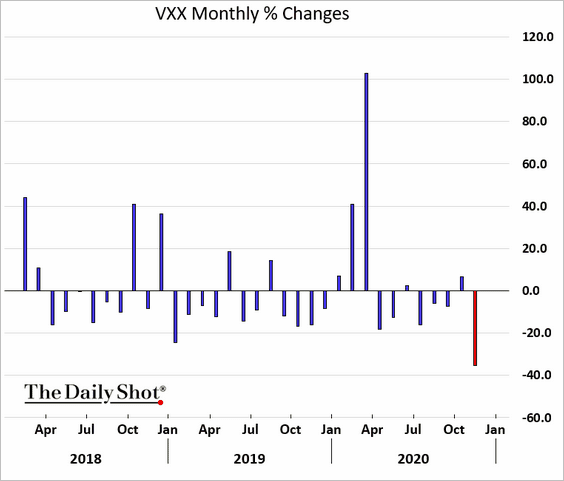
5. Shorting vol paid off handsomely in November (VXX is a VIX ETN).
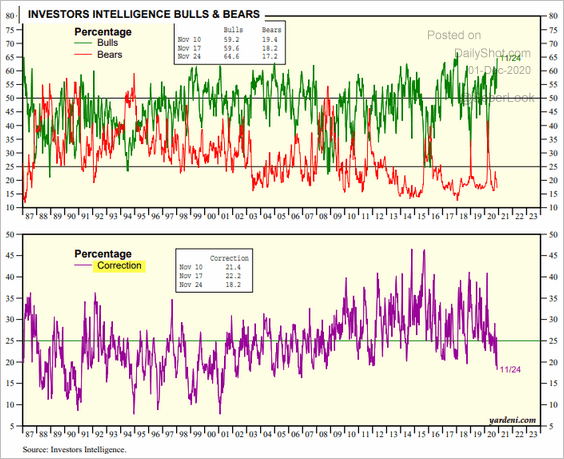
6. The percentage of investors expecting a correction hit the lowest level in years.
 Source: Yardeni Research
Credit
1. US investment-grade bond yields hit a new low.

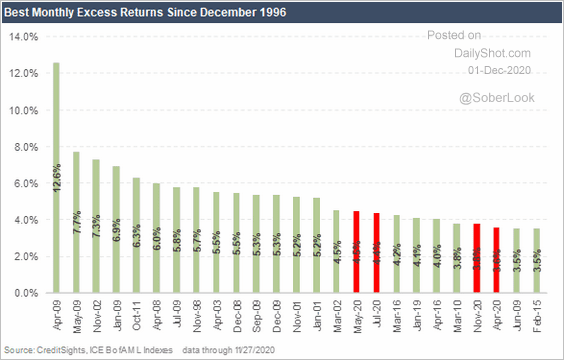
2. November was a good month for credit.
 Source: CreditSights
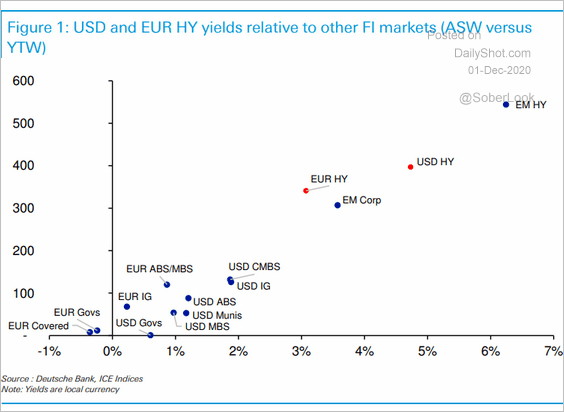
3. This chart shows how US and European junk bond yields compare to other fixed-income products.
 Source: Deutsche Bank Research
Global Developments
1. Asset managers are boosting their bets against the US dollar.
 Source: ANZ Research
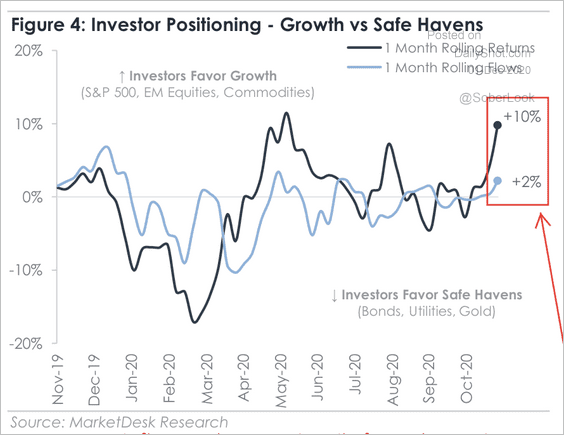
2. Investors favored growth over safe-havens over the past month.
 Source: MarketDesk Research
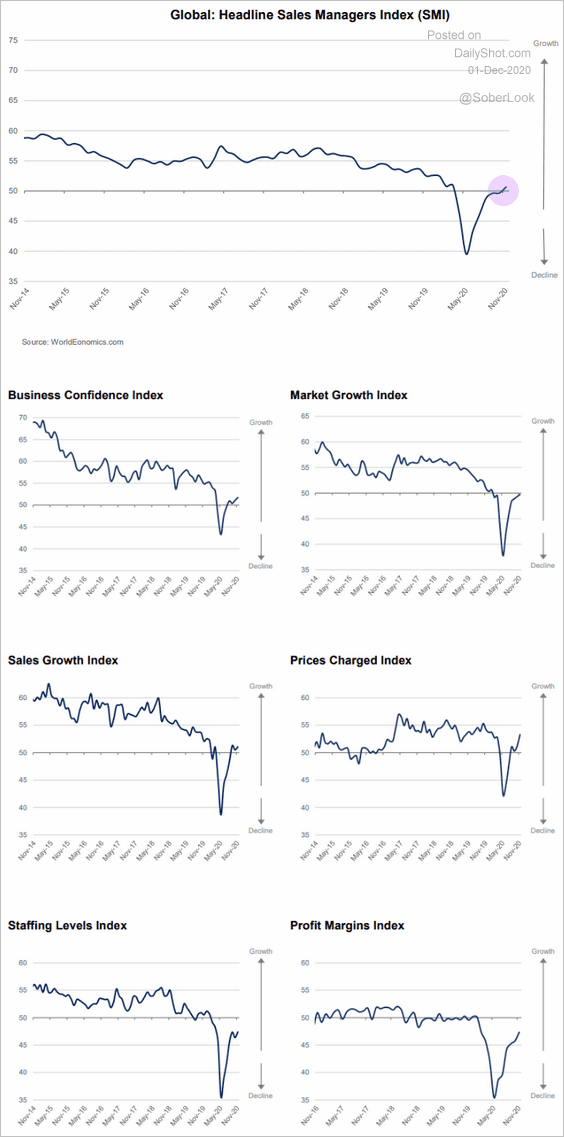
3. Global business activity is back in growth mode, according to the World Economics SMI report.
 Source: World Economics
——————–
Food for Thought
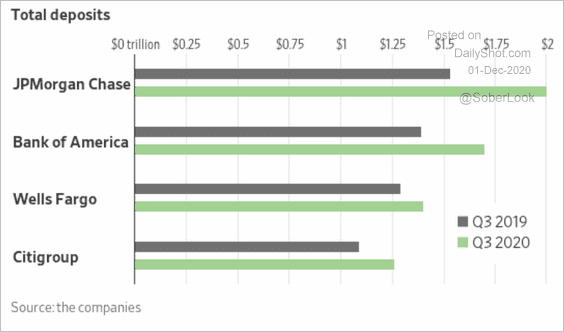
1. Growth in bank deposits:
 Source: @WSJ Read full article
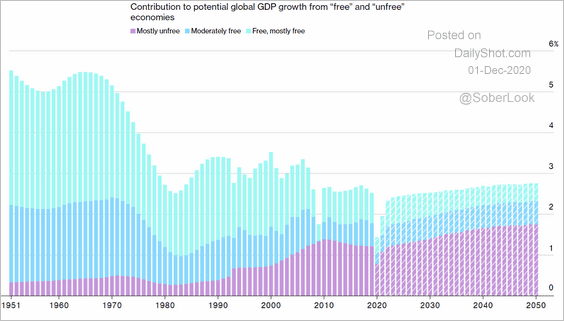
2. Contribution to the global GDP from “free” and “unfree” economies:
 Source: @bw Read full article
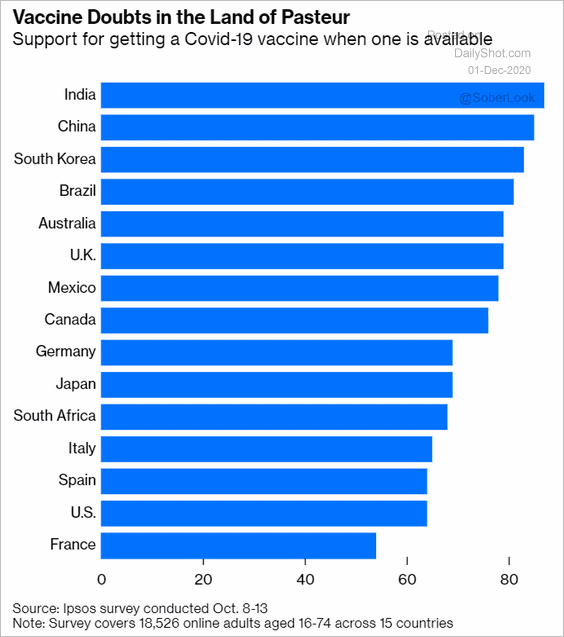
3. Support for getting vaccinated against COVID:
 Source: @CivicScience
 Source: @bopinion Read full article
——————–
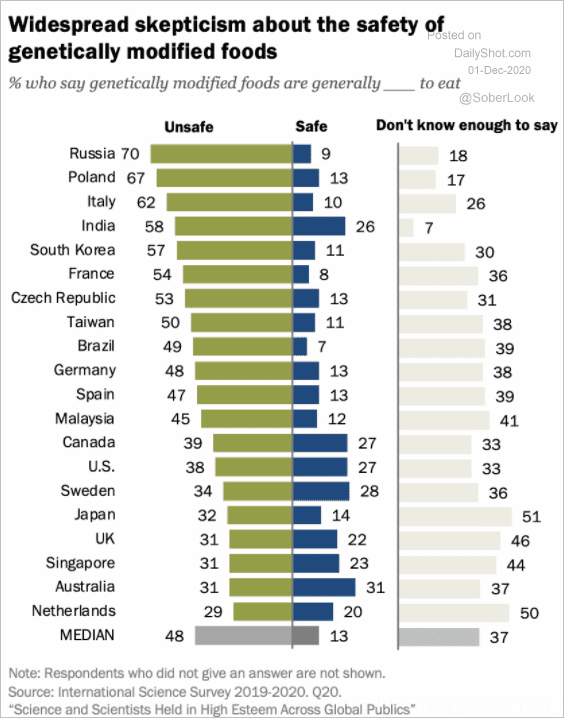
4. Views on genetically modified foods:
 Source: Pew Research Center Read full article
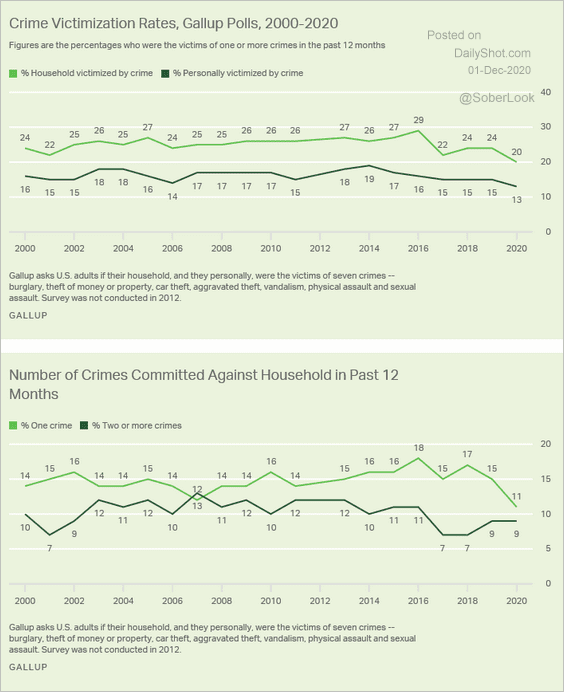
5. Households victimized by crime in the US:
 Source: Gallup Read full article
6. Obstacles faced by women trying to advance their career:
 Source: Morning Consult
7. Private prisons in the US:
 Source: The Sentencing Project Read full article
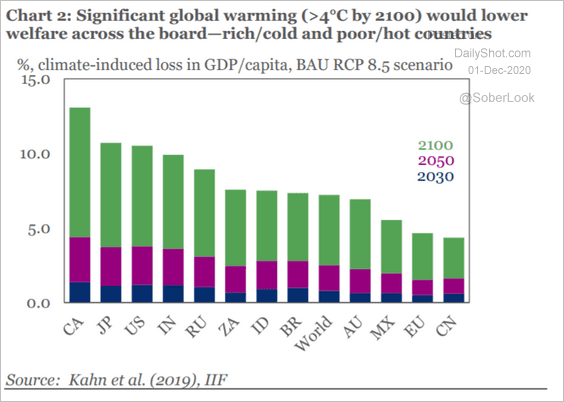
8. Global warming’s potential impact on economic growth:
 Source: IIF
9. Online search activity for “chess”:
 Source: @chartrdaily
——————–
