
The Daily Shot: 07-Dec-20
• The United States
• Canada
• The United Kingdom
• The Eurozone
• Sweden
• Asia – Pacific
• China
• Emerging Markets
• Commodities
• Energy
• Equities
• Credit
• Global Developments
• Food for Thought
The United States
1. The November employment report was a stark reminder that the nation’s labor market recovery has a long way to go. The headline payrolls figure was well below market expectations.
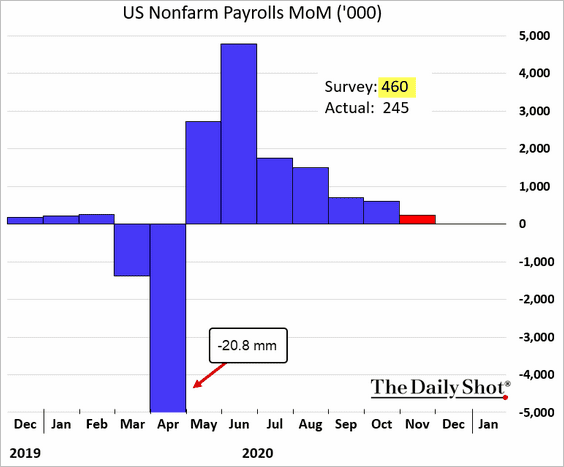
Here is the evolution of payroll employment.
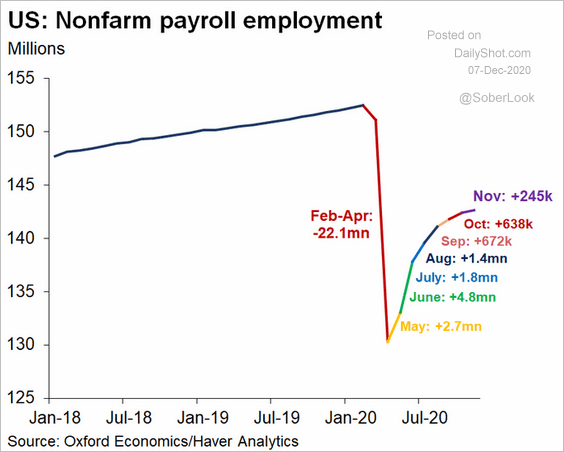 Source: Oxford Economics, @GregDaco
And this chart shows a comparison to previous downturns.
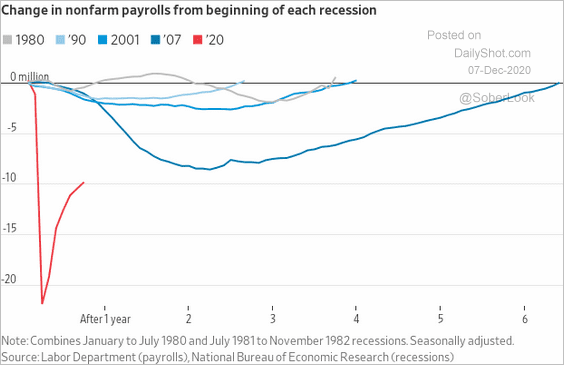 Source: @jeffsparshott
The small business employment data from Homebase has been a good predictor of total service jobs – and it points to further deterioration.
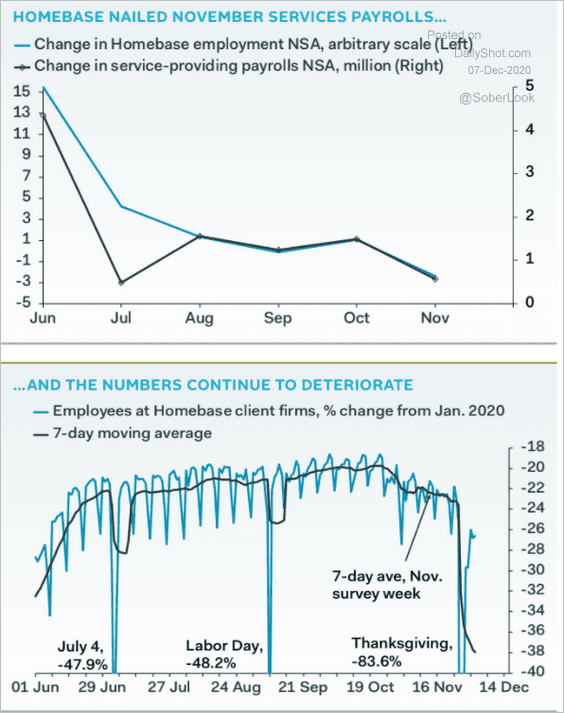 Source: Pantheon Macroeconomics
Moreover, a substantial portion of the November job gains is related to online shopping. Here is a comment from TS Lombard.
With near 40% of November job gains tied to on-line retail, a negative employment number in January or February is more likely.
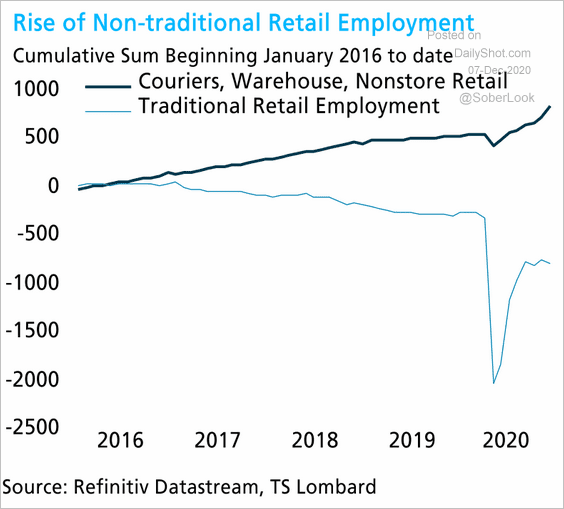 Source: TS Lombard
There were other troubling aspects of the jobs report.
• The household survey showed a loss in jobs.
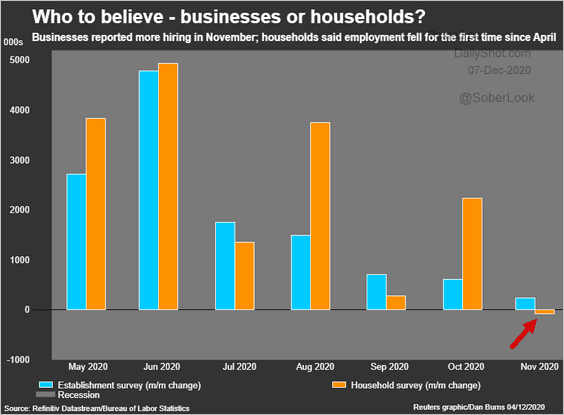 Source: Reuters Read full article
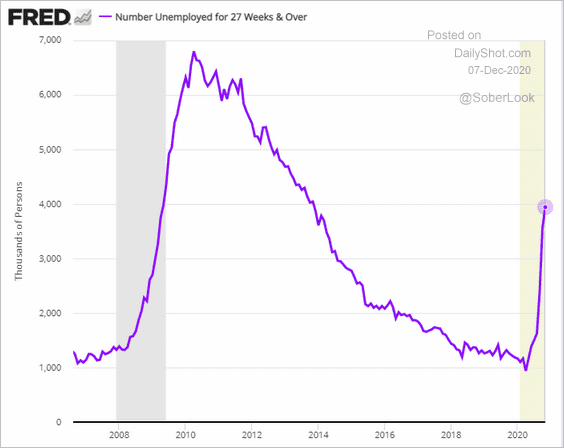
• Long-term unemployment continues to climb.
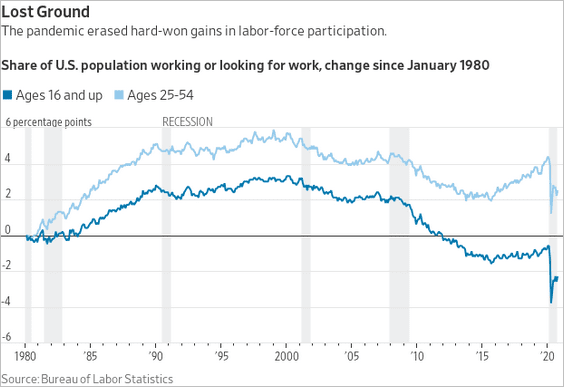
• The prime-age labor force participation rate is deteriorating.
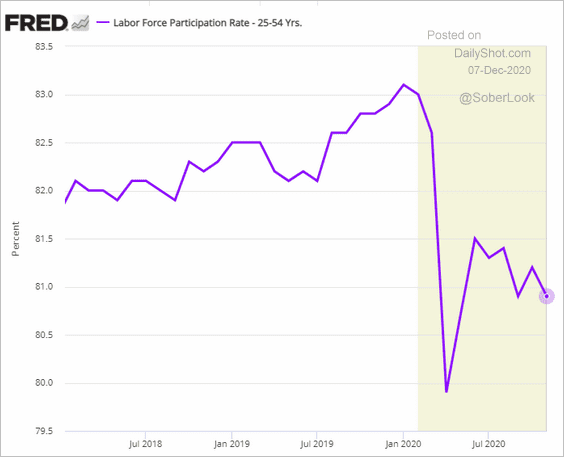
The lack of childcare options is part of the reason for the trend above.
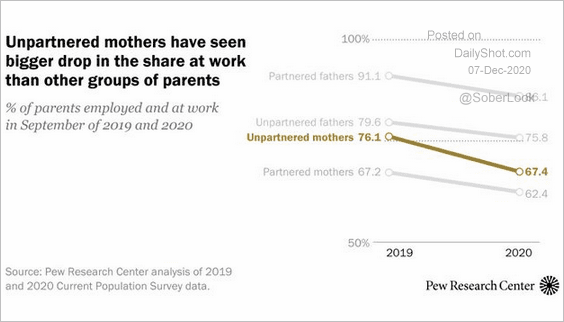 Source: @FactTank Read full article
Below is a long-term chart of labor force participation.
• The number of permanent layoffs remains elevated.
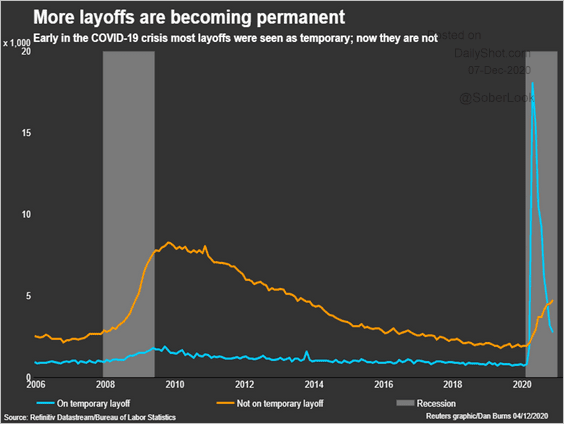 Source: Reuters Read full article
• The number of Americans who are not in the labor force but want a job climbed.
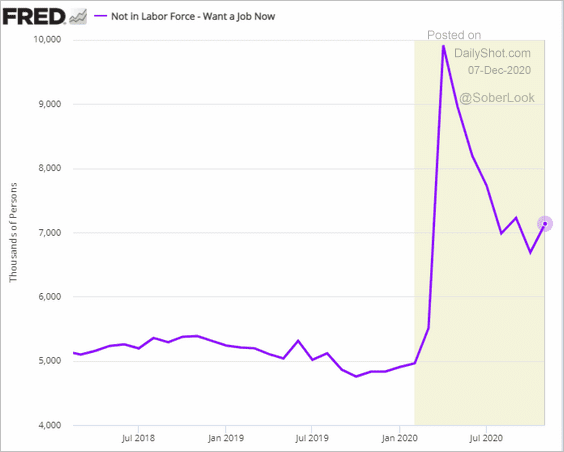
The number of discouraged workers keeps rising.
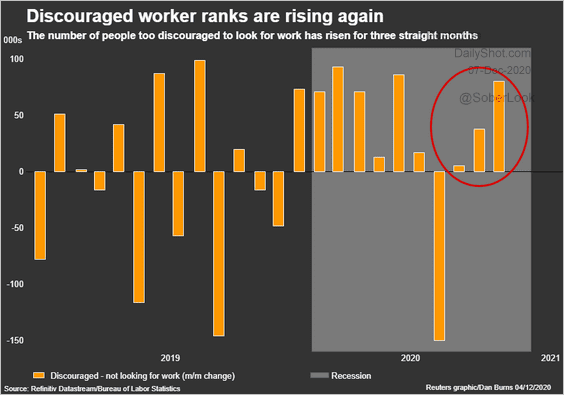 Source: Reuters Read full article
Here are a couple of other updates on the employment report.
• Someone is measuring the total number of private payrolls incorrectly. Is it ADP (the largest payroll service provider) or the government?
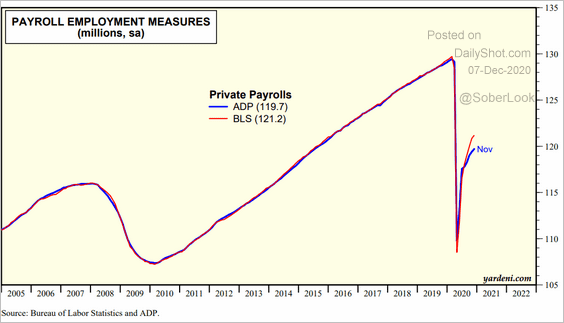 Source: Yardeni Research
• Here is the unemployment rate adjusted for the massive labor force contraction.
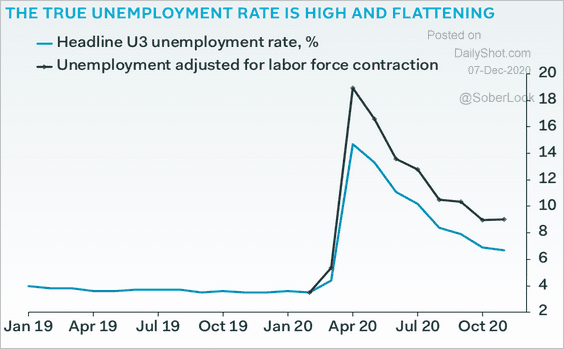 Source: Pantheon Macroeconomics
• The best- and worst-performing sectors:
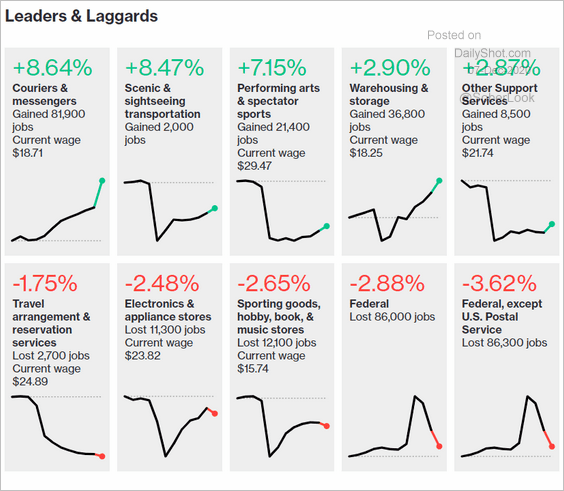 Source: @bbgvisualdata Read full article
• The participation rate by educational attainment:
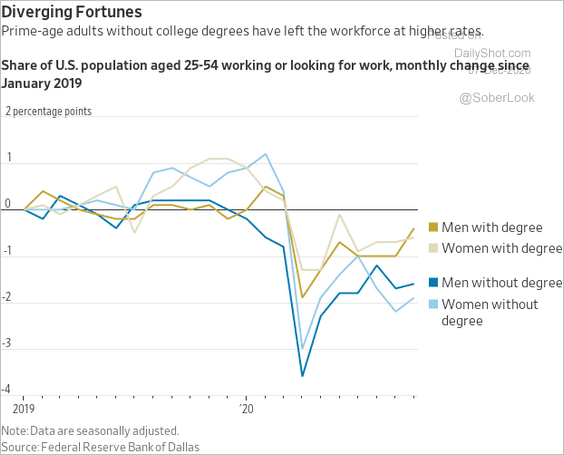 Source: @WSJ Read full article
——————–
2. US small business revenues are drifting lower.
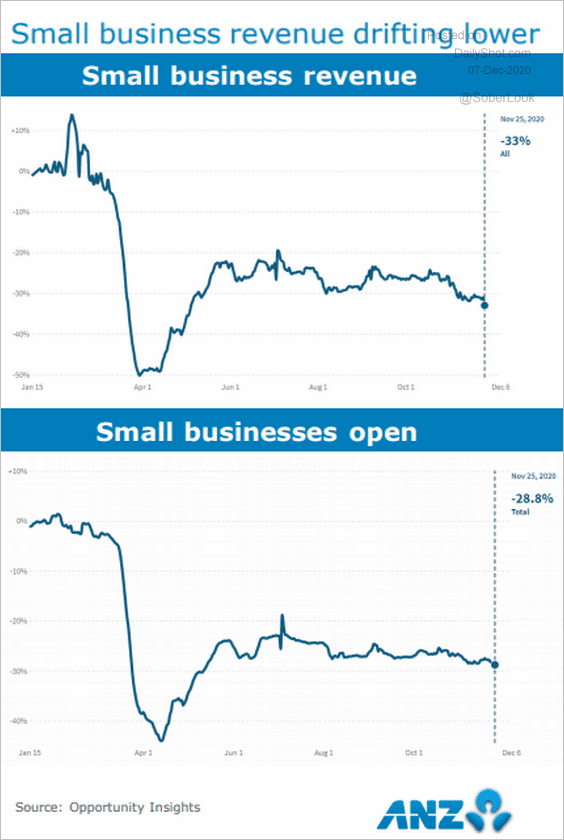 Source: ANZ Research
However, the year-over-year decline in private inventories is one of the steepest on record. Businesses will eventually have to replenish their stock if consumption returns to normal.
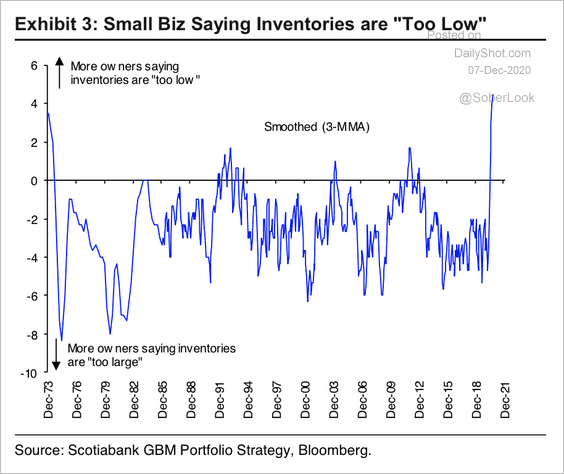 Source: Hugo Ste-Marie, Portfolio & Quantitative Strategy Global Equity Research, Scotia Capital
——————–
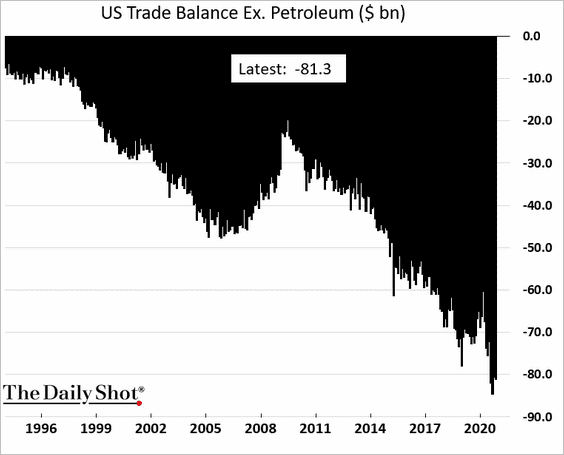
3. The trade deficit remains elevated.
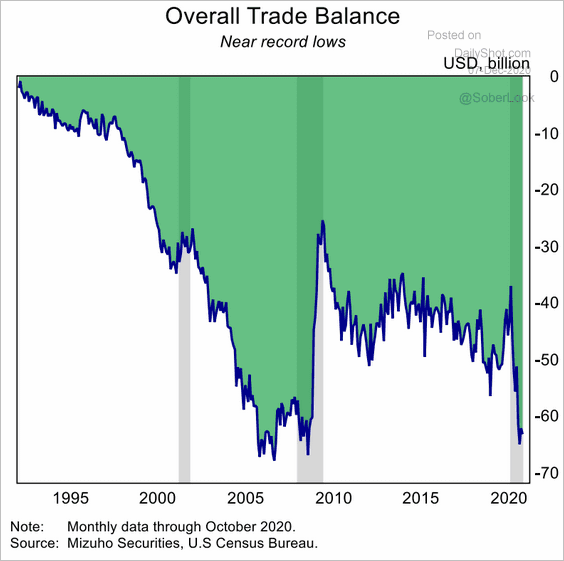 Source: Mizuho Securities USA
Excluding petroleum, the deficit is close to a record high.
Trade in goods has diverged from services.
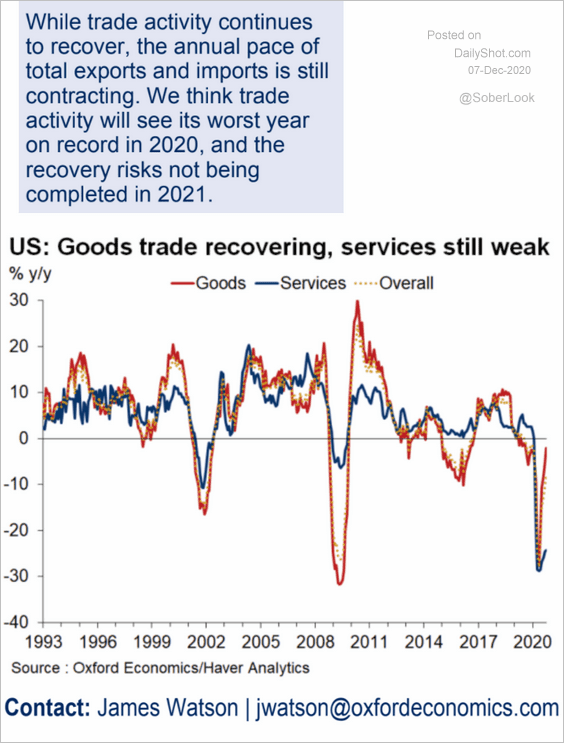 Source: Oxford Economics
——————–
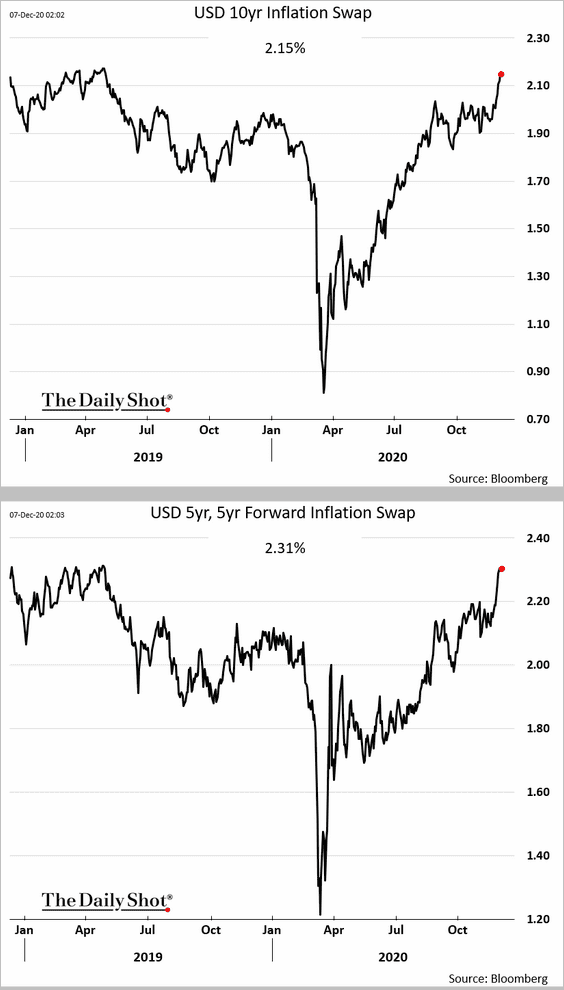
4. Long-term market-based inflation expectations are grinding higher.
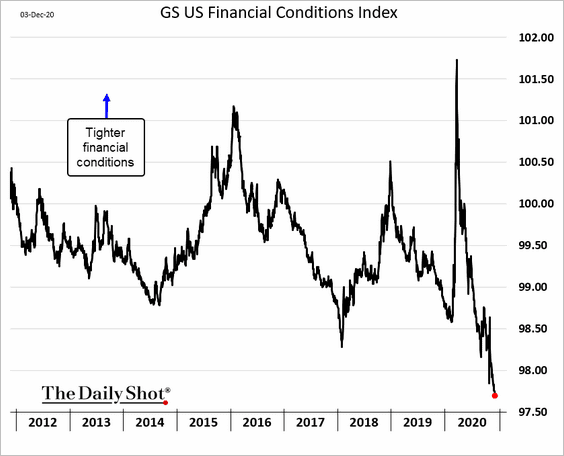
5. A roaring stock market, tighter credit spreads, and a weak US dollar continue to ease the US financial conditions.
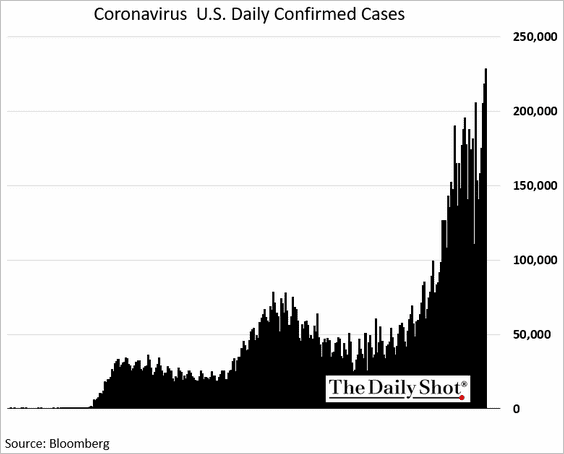
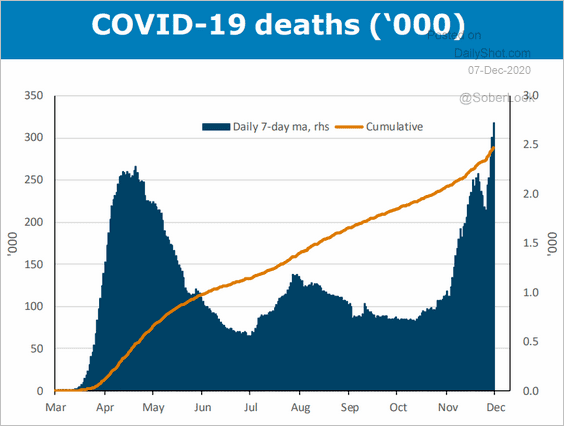
6. The COVID situation remains ugly.
• Total new cases (daily):
• COVID-related deaths (daily):
 Source: ANZ Research
Canada
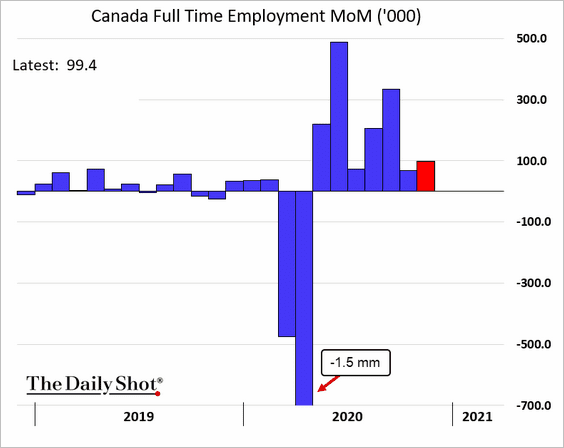
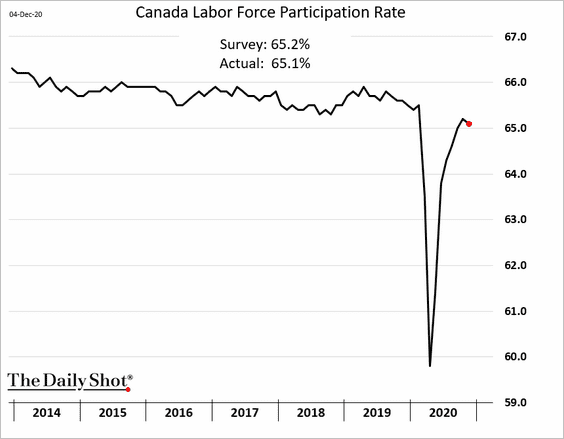
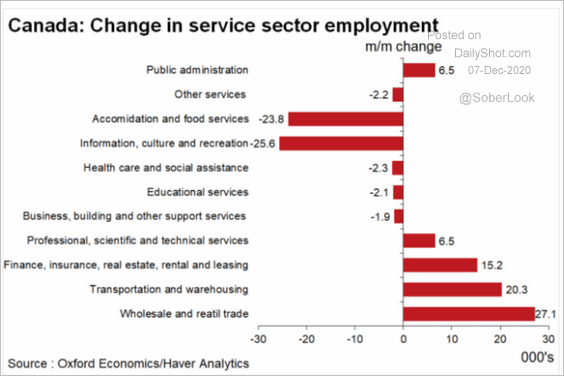
1. Canada’s employment report topped economists’ forecasts.
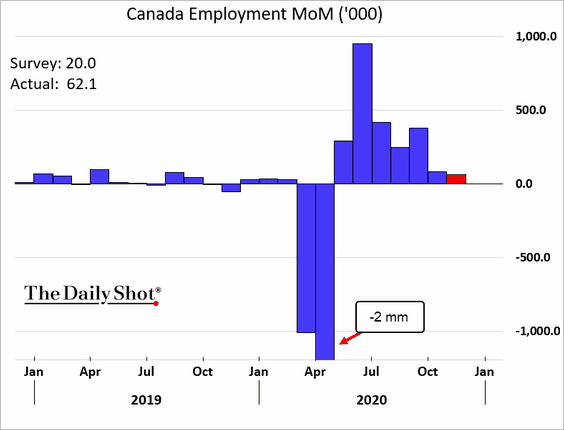
• There were nearly 100k new full-time jobs in November.
• The unemployment rate was lower than expected.
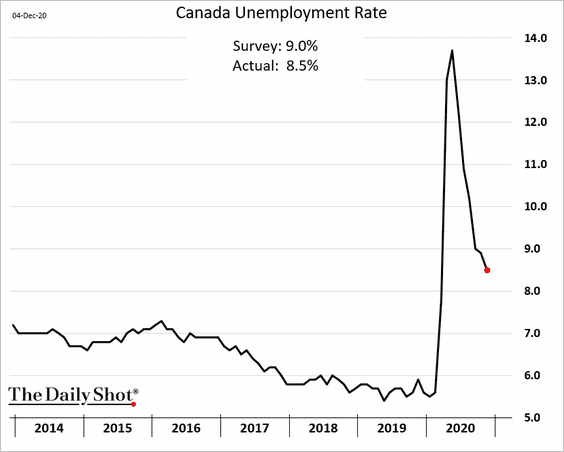
• However, the participation rate ticked down.
• Here is the sector breakdown.
 Source: Oxford Economics
——————–
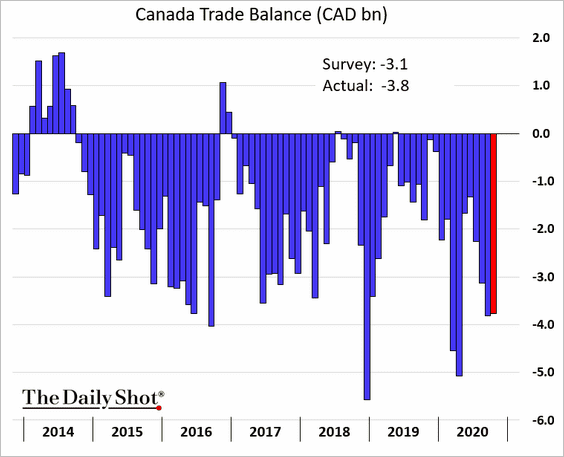
2. Canada’s trade deficit remains elevated.
3. Will Canadian equities begin to outperform US equities?
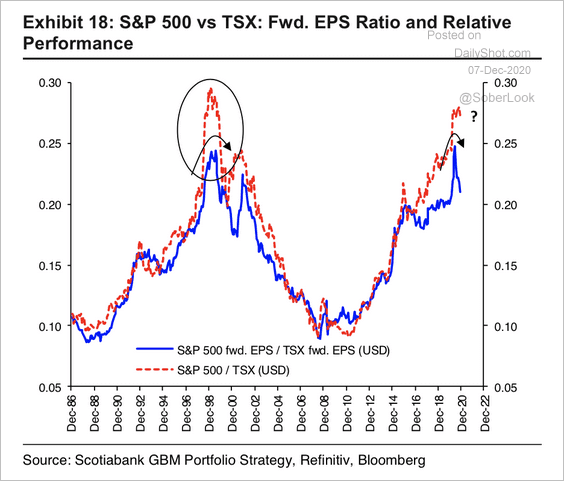 Source: Hugo Ste-Marie, Portfolio & Quantitative Strategy Global Equity Research, Scotia Capital
The MSCI Canada ETF is at resistance. Will we see a breakout?
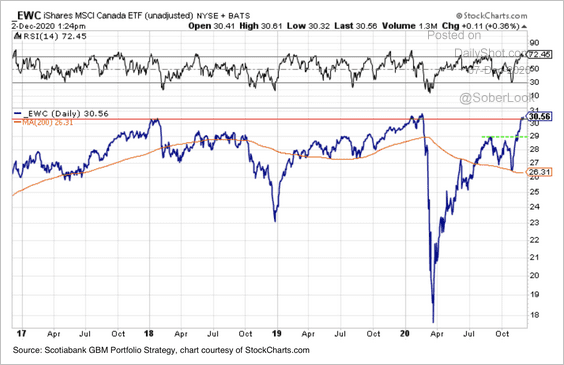 Source: Hugo Ste-Marie, Portfolio & Quantitative Strategy Global Equity Research, Scotia Capital
——————–
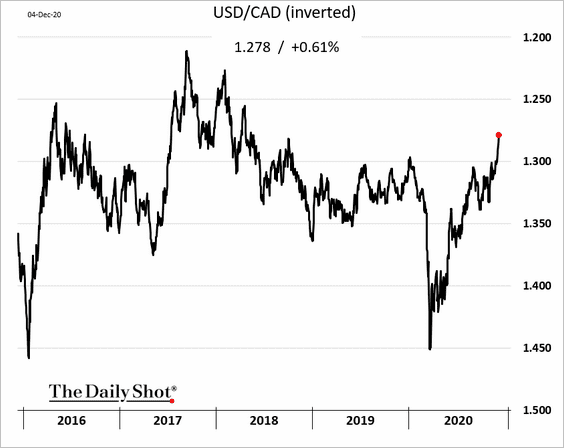
The Canadian dollar is moving higher amid firmer commodity prices.
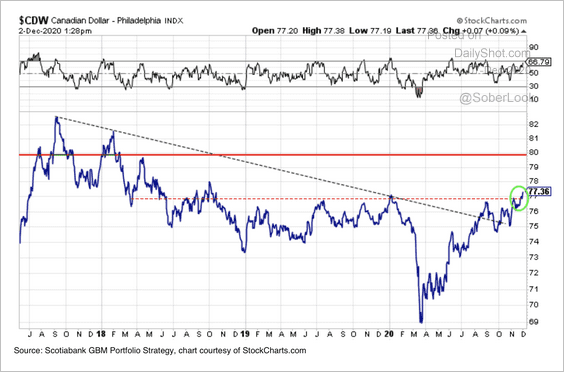 Source: Hugo Ste-Marie, Portfolio & Quantitative Strategy Global Equity Research, Scotia Capital
The United Kingdom
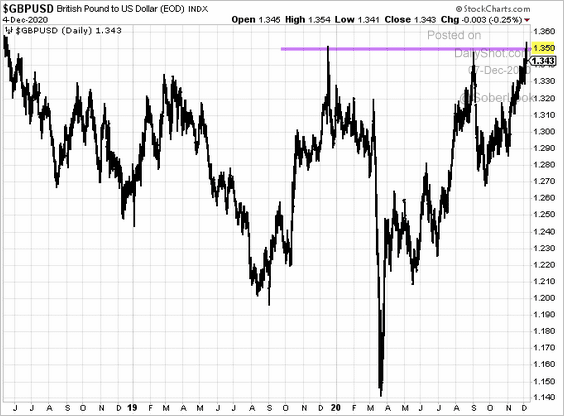
1. The pound held resistance as trade negotiations continue.
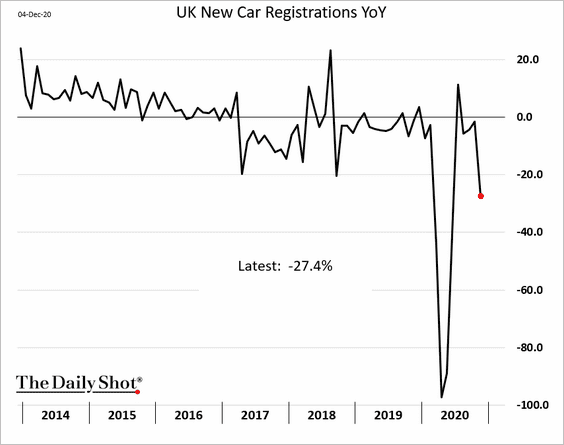
2. Car registrations weakened again.
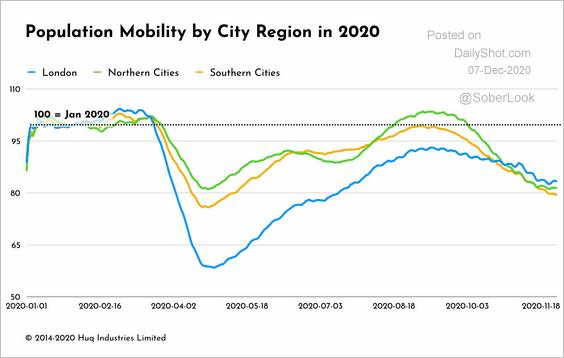
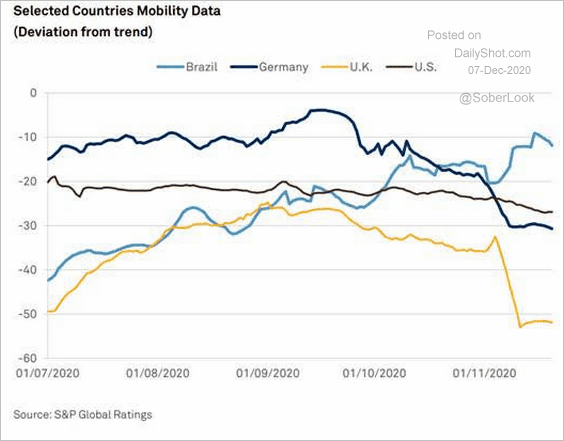
3. Mobility metrics remain soft.
 Source: Huq
 Source: S&P Global Market Intelligence
This chart shows the comfort level of returning to public spaces.
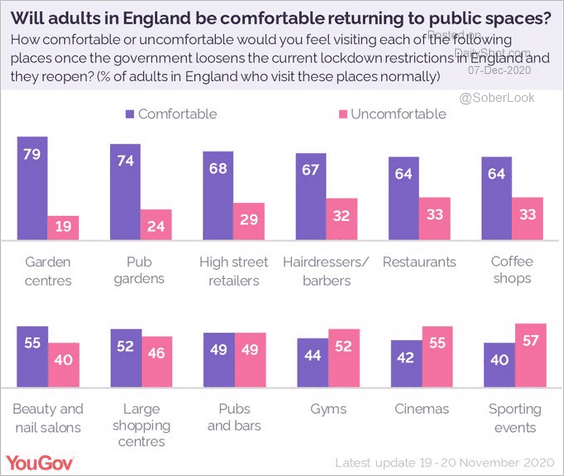 Source: @YouGov Read full article
——————–
4. The labor market faces substantial downside risks.
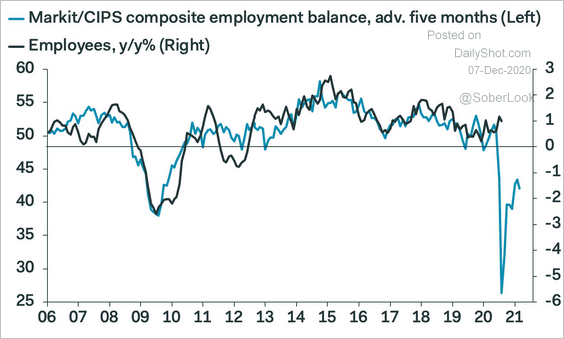 Source: Pantheon Macroeconomics
The Eurozone
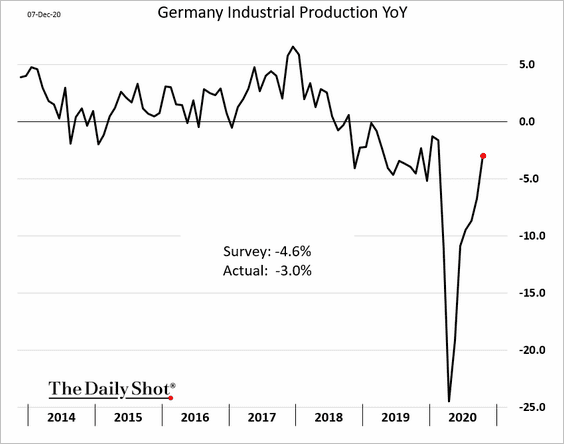
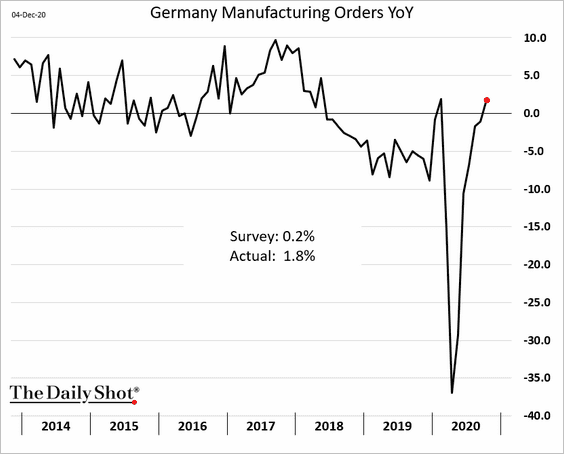
1. Let’s begin with Germany.
• Factory orders and industrial production topped market expectations.
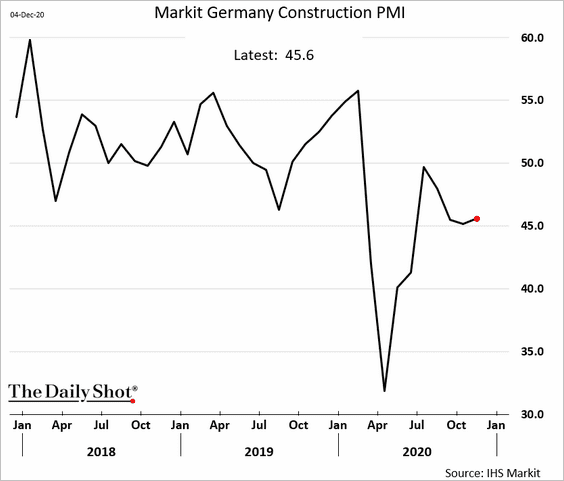
• Construction activity remains soft.
• Here is a recent survey on personal spending.
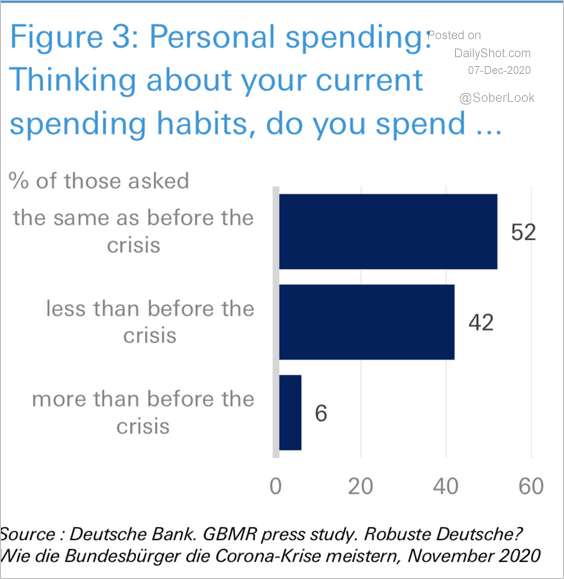 Source: Deutsche Bank Research
——————–
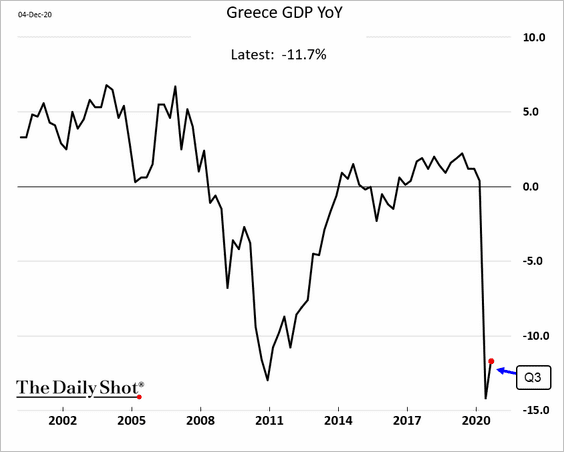
2. Greek economic recovery will take a long time.
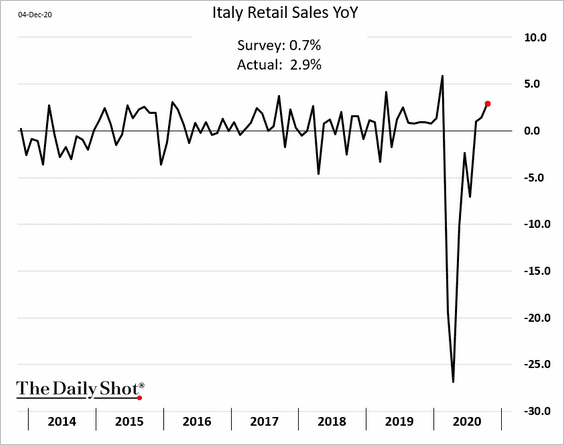
3. Italian bond spreads are near the lowest levels since 2018.
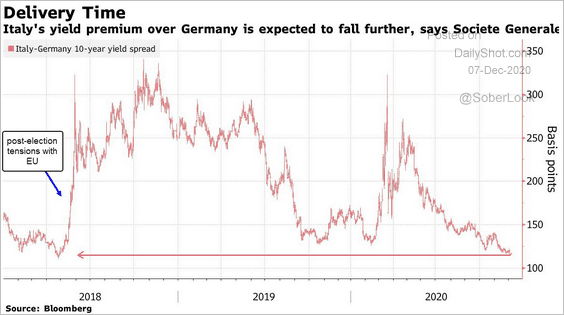 Source: @markets Read full article
Here is the V-shaped recovery in Italian retail sales.
Sweden
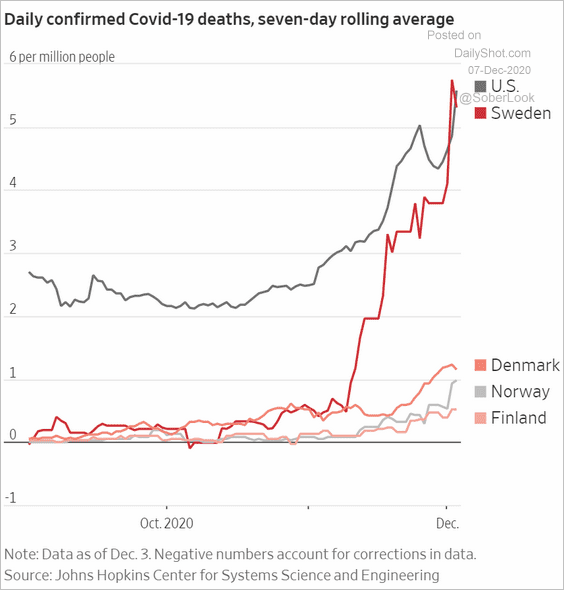
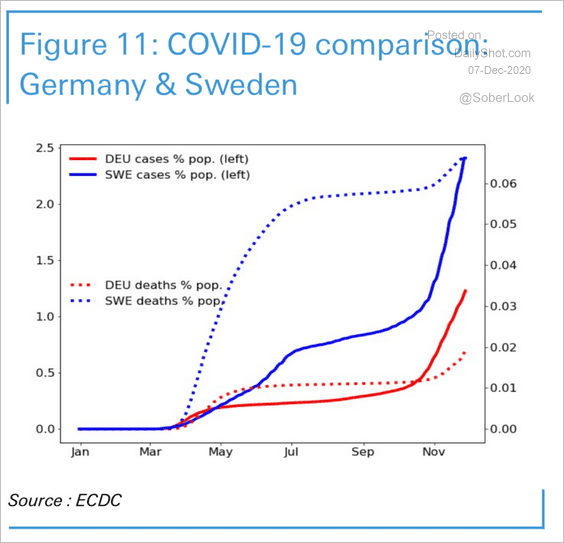
The COVID situation has deteriorated markedly.
 Source: @WSJ Read full article
 Source: Deutsche Bank Research
 Source: The Guardian Read full article
Asia – Pacific
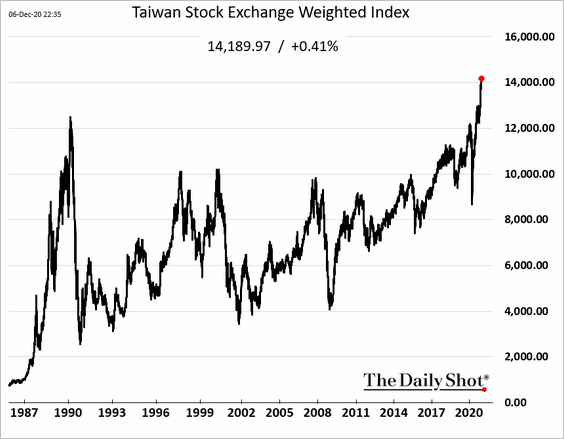
1. Taiwan’s stock market is soaring.
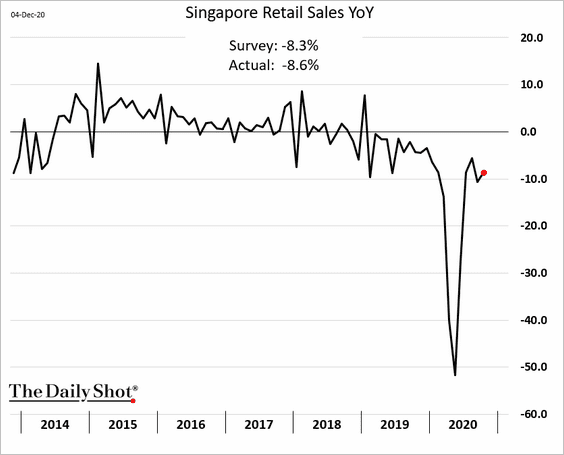
2. Singapore’s retail sales remain soft.
3. Asset managers are boosting their bets on the Kiwi dollar.
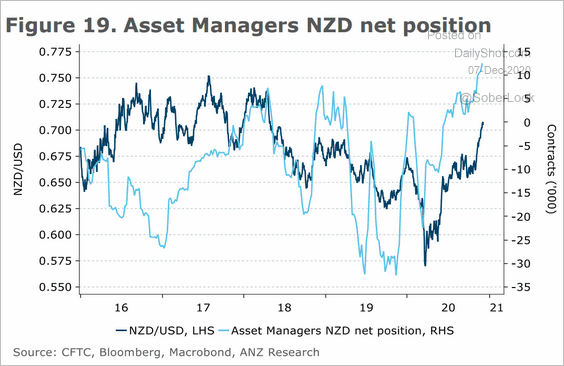 Source: ANZ Research
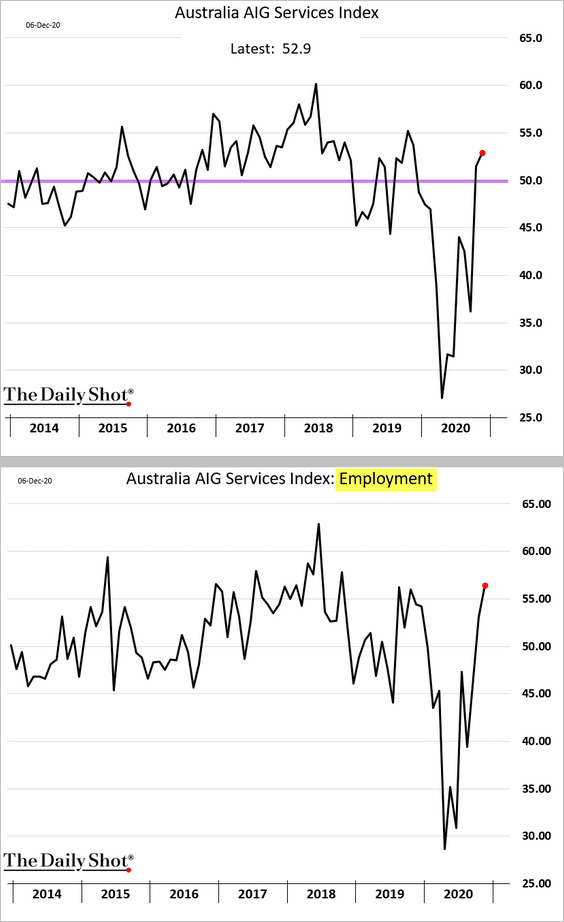
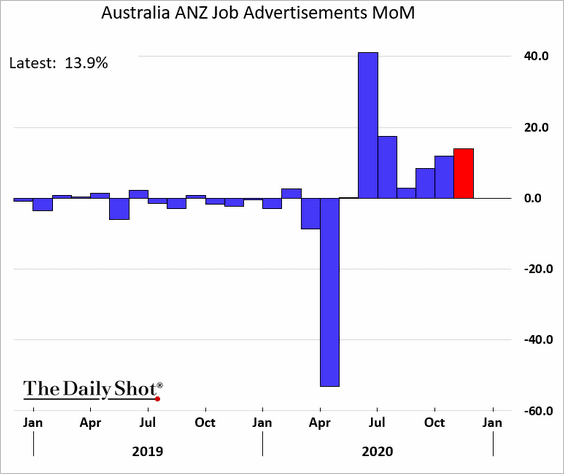
4. Next, we have some updates on Australia.
• Service-sector activity (accelerating):
• Job ads (monthly changes):
• The government’s budget balance:
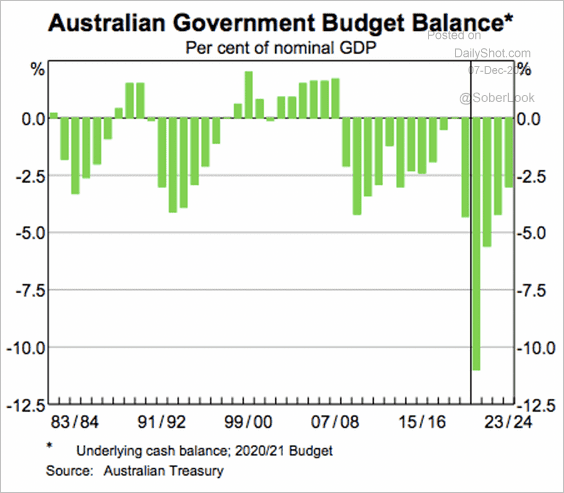 Source: RBA
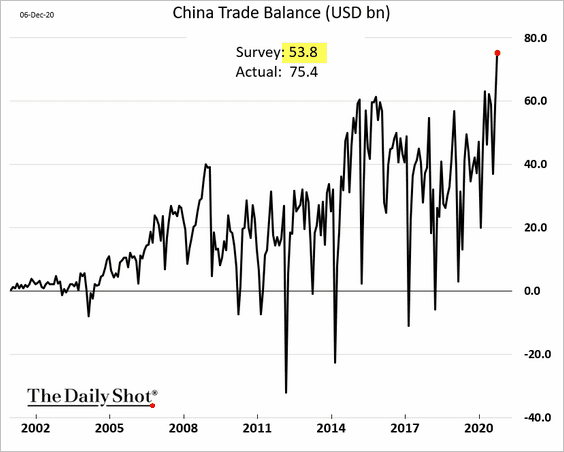
China
1. Exports accelerated last month, exceeding forecasts.
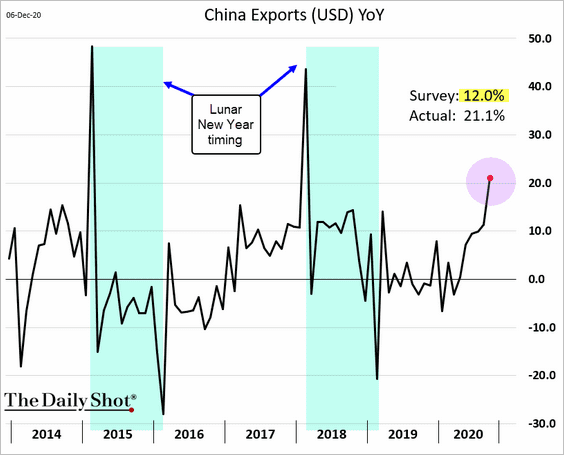
The trade surplus hit a record high.
——————–
2. Bond issuance spiked this year.
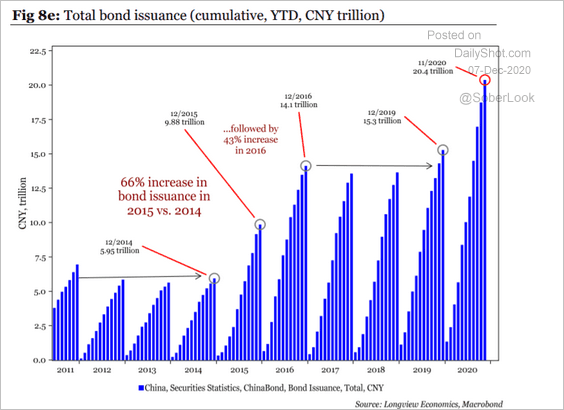 Source: Longview Economics
But corporate dollar bond sales slowed in November.
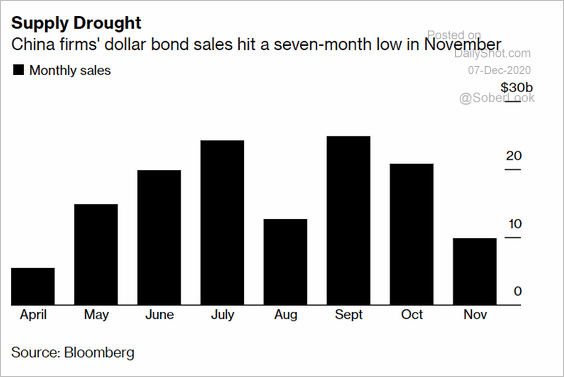 Source: @markets Read full article
——————–
3. Tighter liquidity could pressure Chinese equities relative to the EM benchmark.
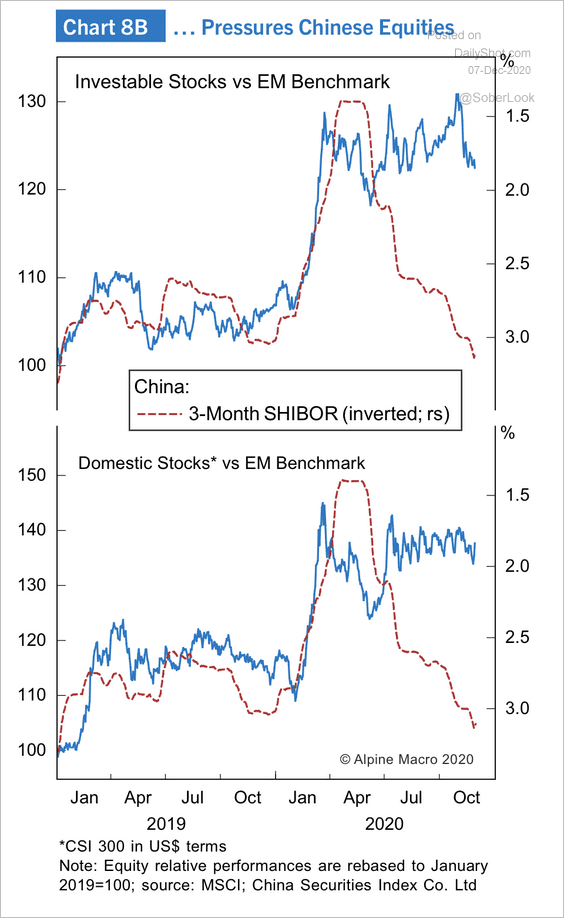 Source: Alpine Macro
Emerging Markets
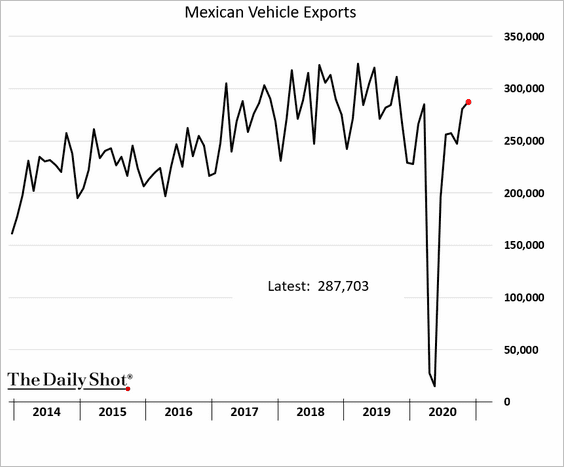
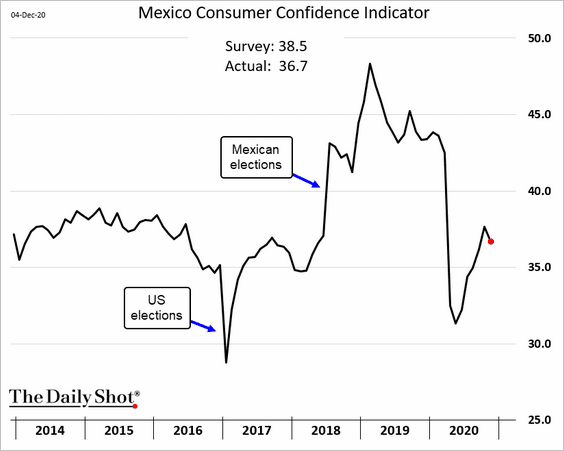
1. Let’s begin with Mexico.
• Vehicle exports have recovered (on the back of strong US demand).
• Consumer confidence turned lower in recent days.
• The peso has been outperforming.
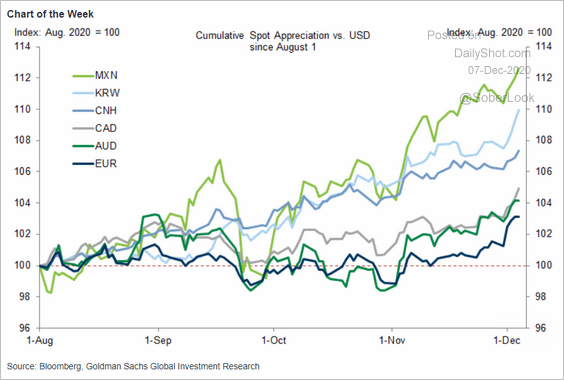 Source: Goldman Sachs
——————–
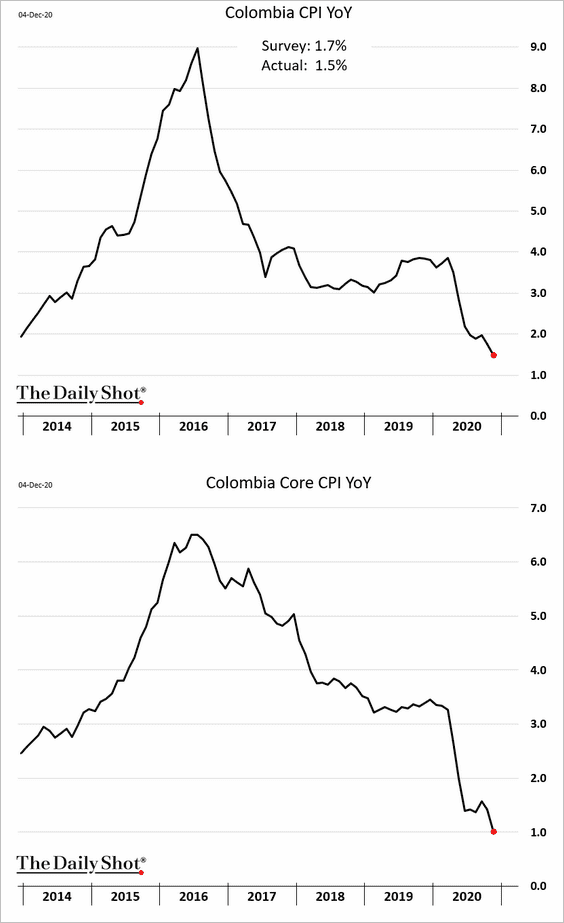
2. Colombia’s inflation continues to soften.
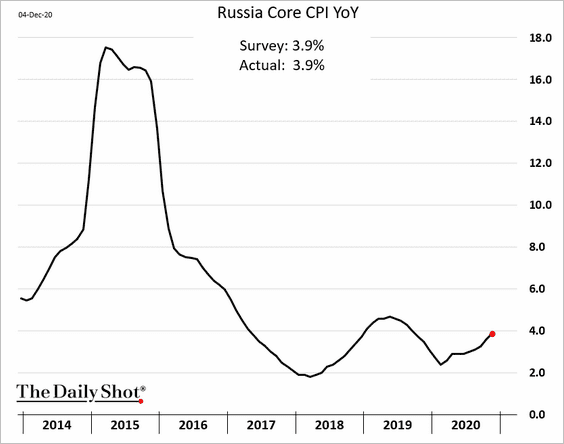
3. Russia’s inflation is grinding higher.
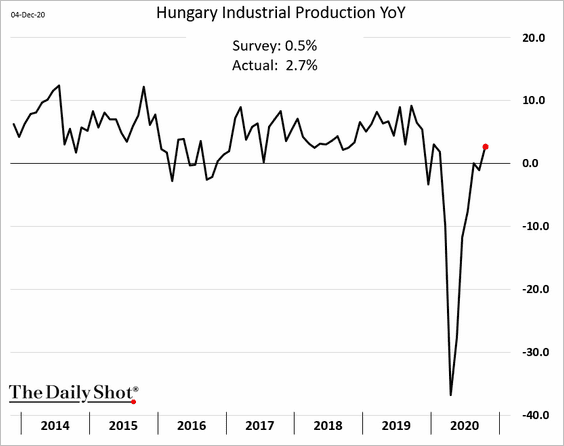
4. Hungarian industrial production surprised to the upside.
5. EM currencies continue to rally.
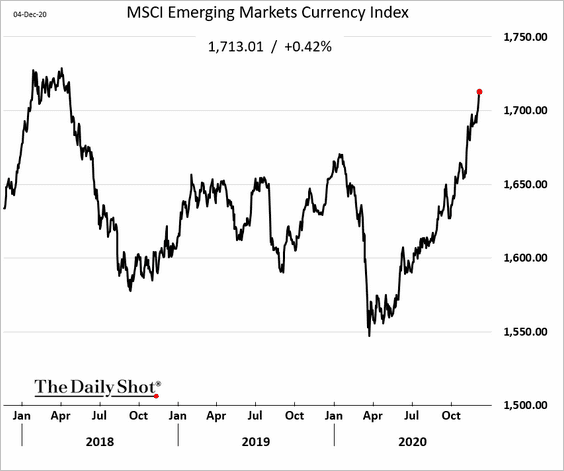
Will we see a breakout against the dollar.
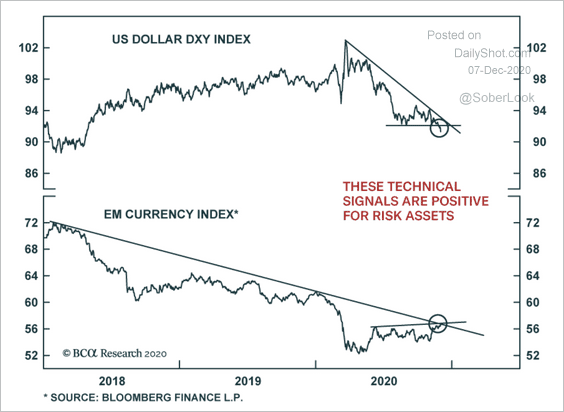 Source: BCA Research
——————–
6. EM rate-cutting cycle appears to be over for now.
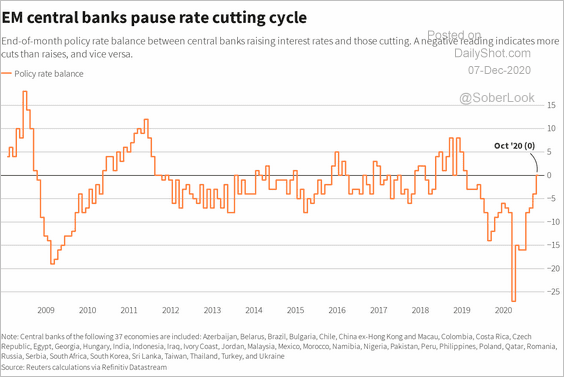 Source: Reuters Read full article
Commodities
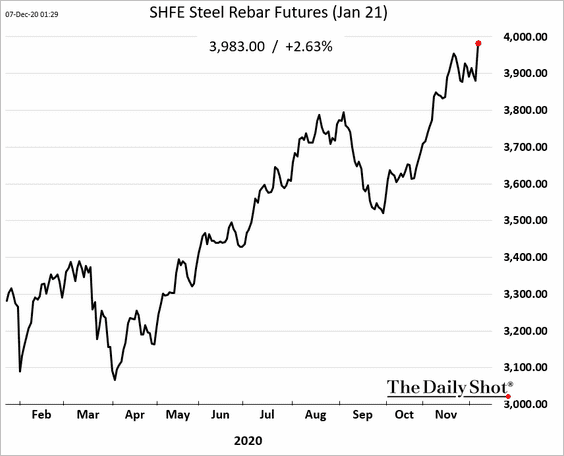
1. Iron ore is at multi-year highs.
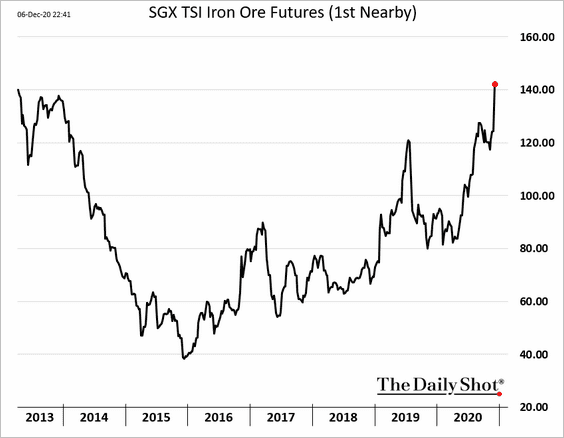 h/t Alpana Sarma
China’s steel prices continue to climb.
——————–
2. Copper prices have moved in tandem with shipping activity.
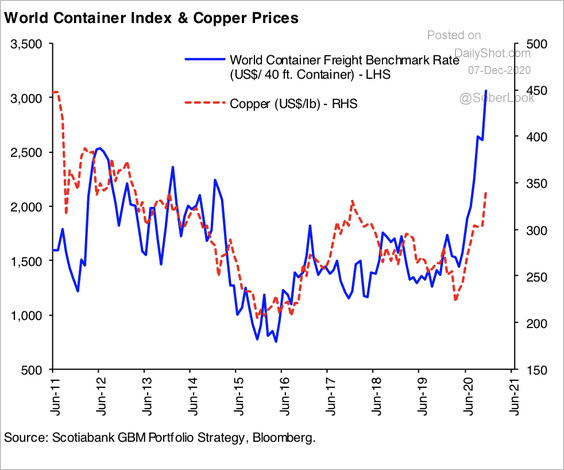 Source: Hugo Ste-Marie, Portfolio & Quantitative Strategy Global Equity Research, Scotia Capital
3. Gold outflows have been extreme.
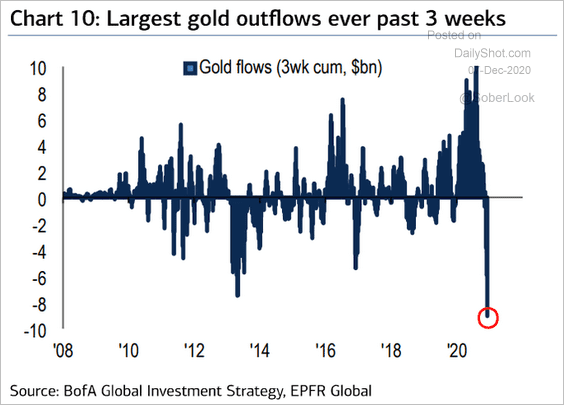 Source: @ISABELNET_SA, @BofAML
CTAs have been paring down their gold exposure.
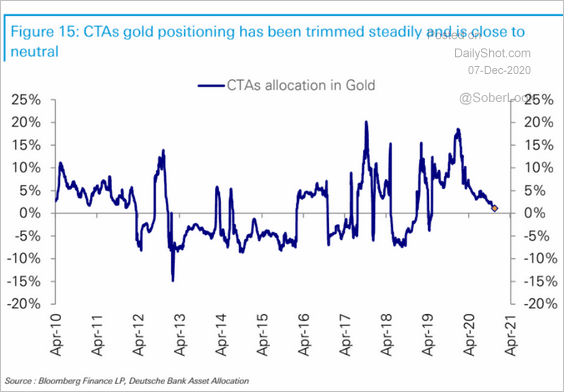 Source: Deutsche Bank Research
——————–
4. US wheat prices are lower.
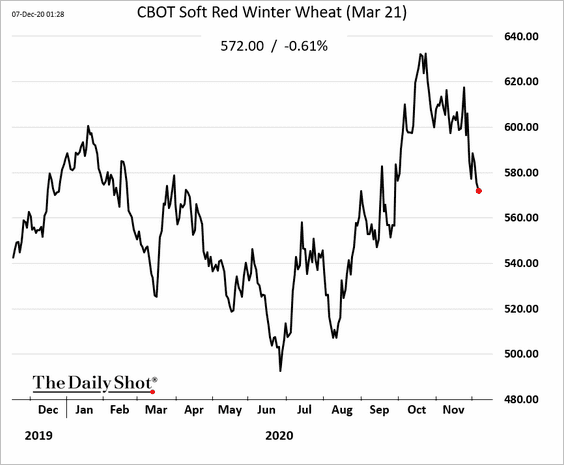
 Source: @WSJ Read full article
Energy
1. Deutsche Bank expects WTI crude oil prices to reach “fair value” at around $75/bbl next year.
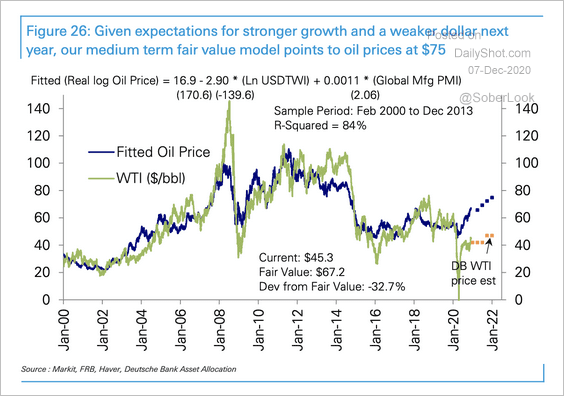 Source: Deutsche Bank Research
2. US natural gas futures continue to tumble.
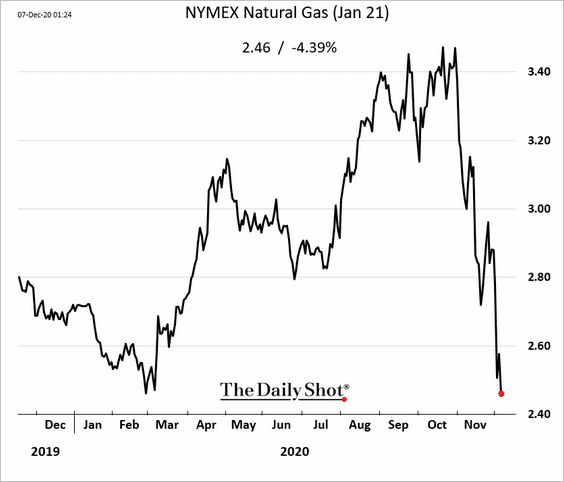
 Source: NOAA
——————–
3. Propane prices are near a 52-week high. Demand is rising as restaurants keep outdoor dining facilities warm.
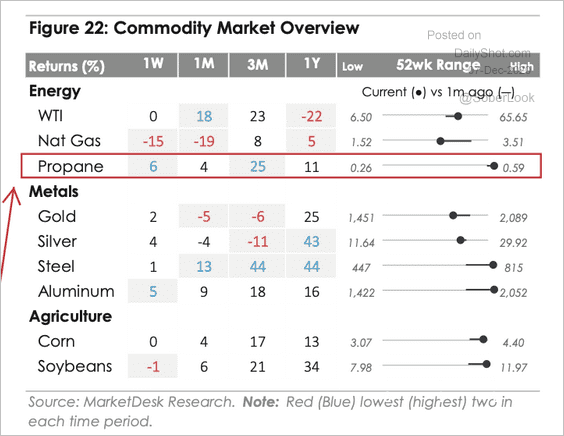 Source: MarketDesk Research
Equities
1. Speculative demand for call options remains elevated, which is supporting the overall market rally. It’s not going to be pretty on the way down.
• Call option volume:
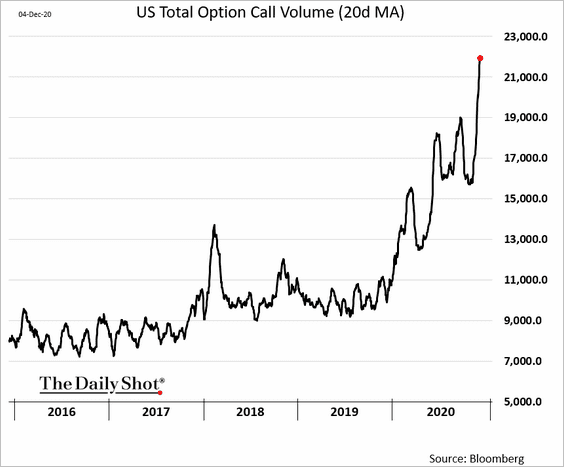
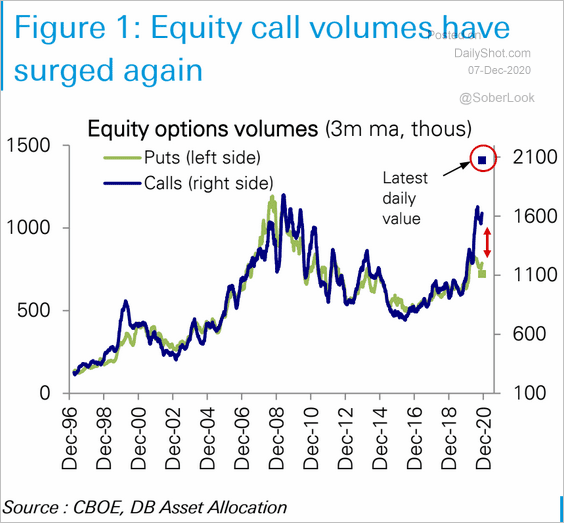 Source: Deutsche Bank Research
• Small trader volume:
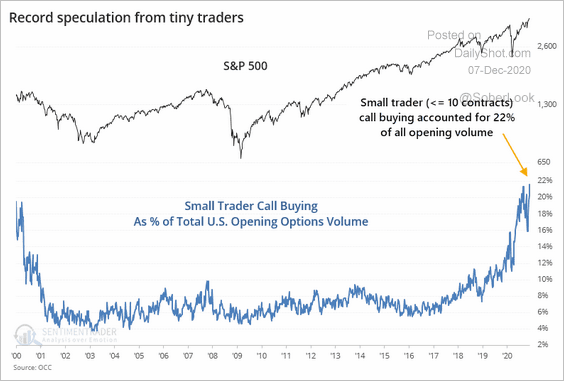 Source: @sentimentrader
• Put-call ratio:
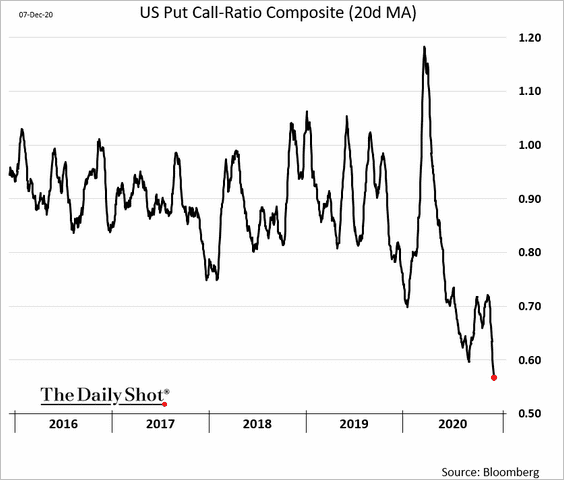
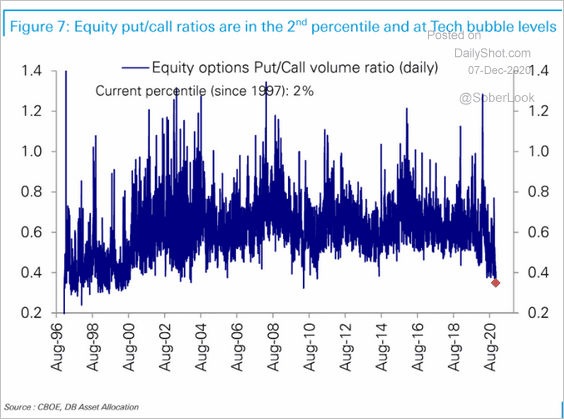 Source: Deutsche Bank Research
Single stock vs. index put-call ratio:
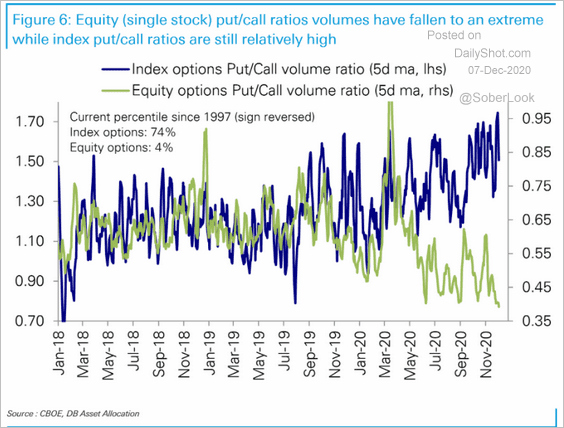 Source: Deutsche Bank Research
——————–
2. Citi’s sentiment index is deep in euphoria territory.
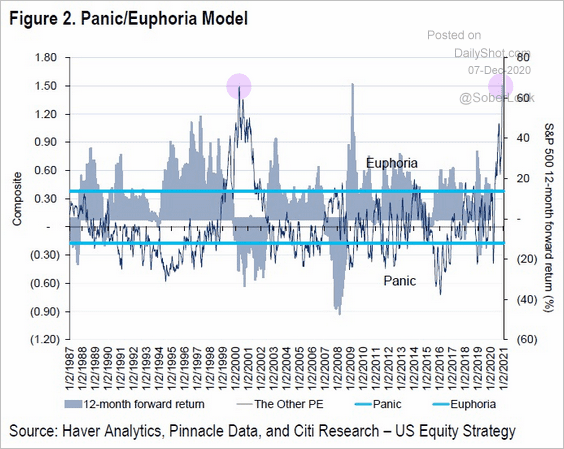 Source: Citi, @Scutty
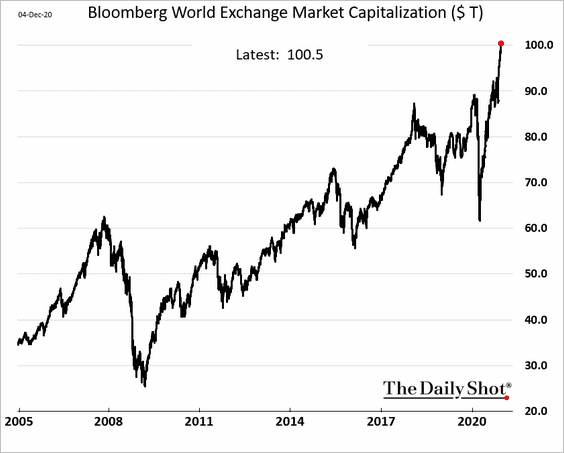
2. The global stock market capitalization is now above $100 trillion.
3. The S&P 500 is at the upper Bollinger band.
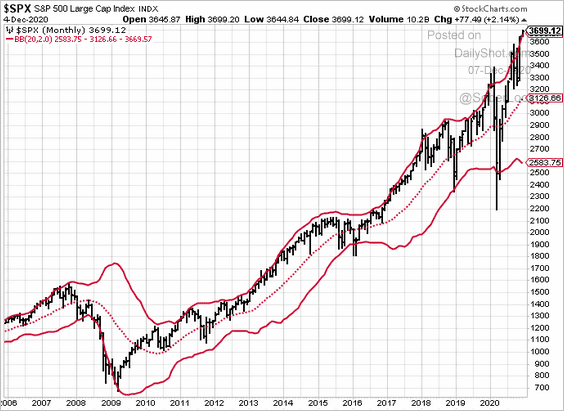 h/t Cormac Mullen
4. The Nasdaq Composite is at resistance.
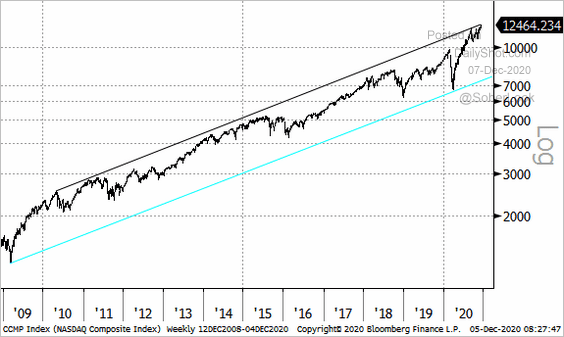 Source: @ThePainReport
Flows into QQQ (Nasdaq 100 ETF) spiked this year.
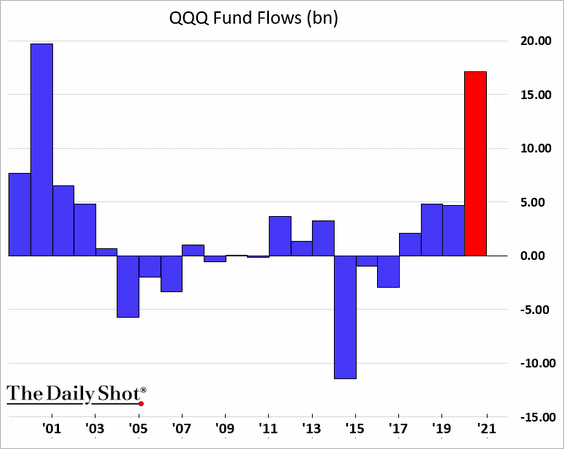 h/t @JPBarnert
——————–
5. All sectors are above their 200-day moving average.
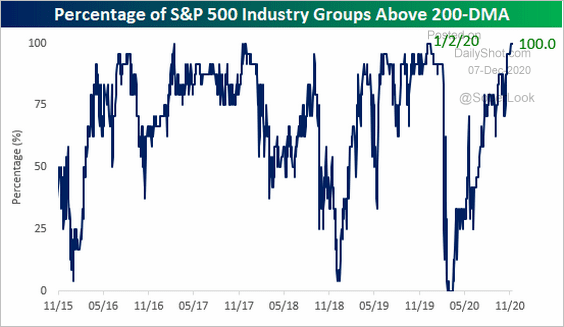 Source: @bespokeinvest Read full article
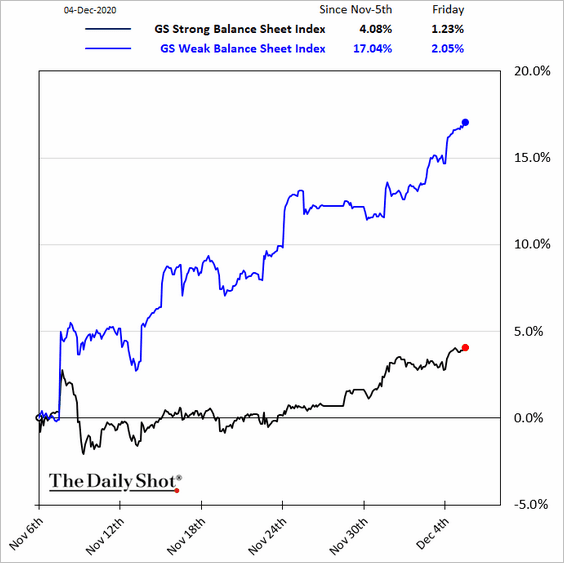
6. Companies with weak balance sheets have been outperforming.
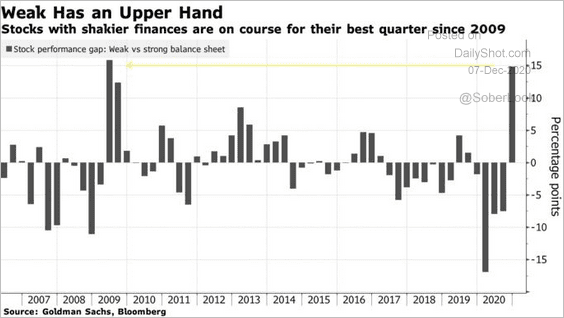 Source: @markets Read full article
——————–
7. Equity valuations still look compelling relative to bonds.
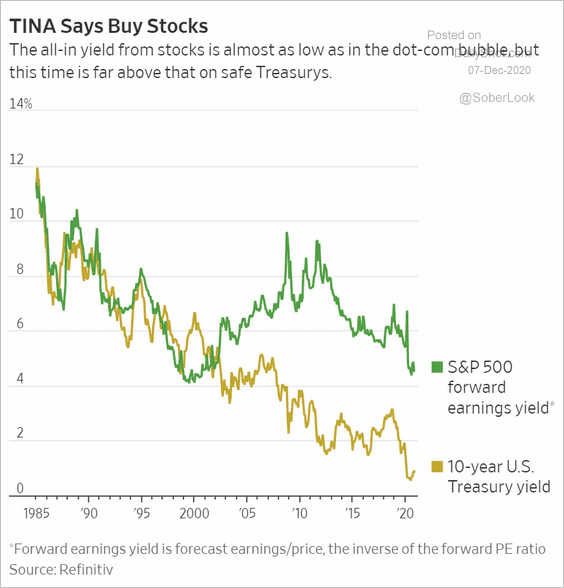 Source: @WSJ Read full article
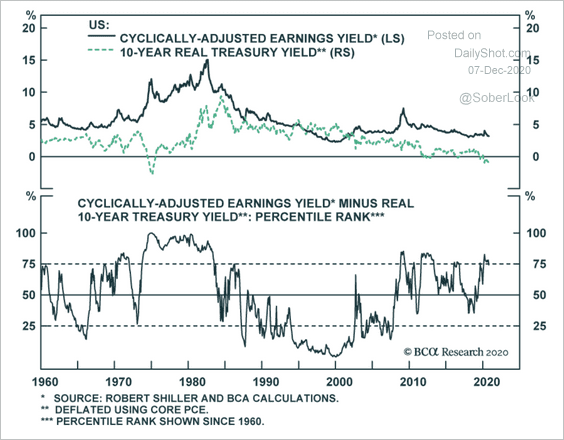 Source: BCA Research
Here is the relative performance of stocks vs. bonds (globally).
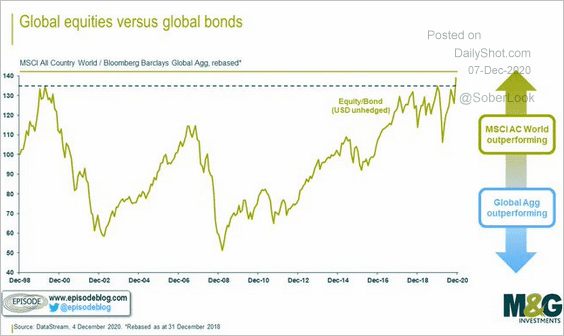 Source: @episodeblog Read full article
——————–
8. Small-cap earnings and price trends are improving relative to large-caps.
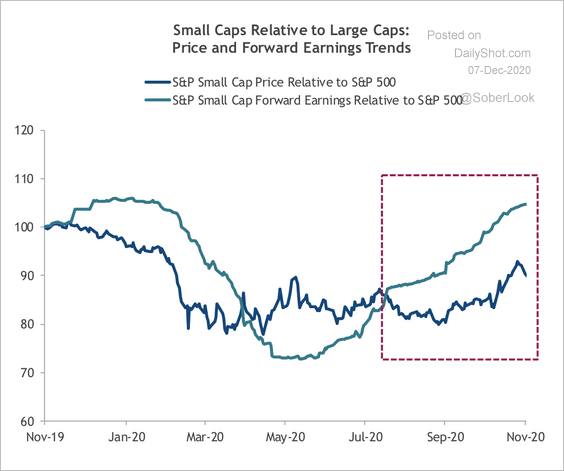 Source: SunTrust Private Wealth Management
9. Luxury stocks are outperforming consumer staples.
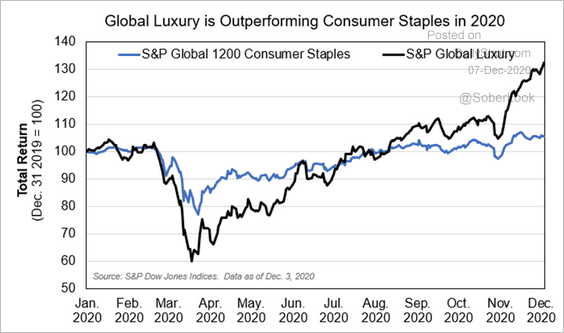 Source: S&P Global Market Intelligence
10. The rotation out of mutual funds into ETFs continues.
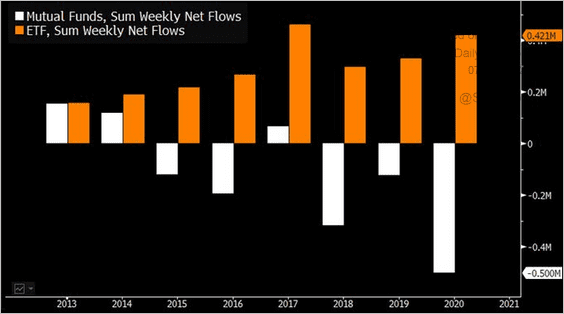 Source: @mbarna6, @EricBalchunas
11. The equal-weighted S&P 500 index is outperforming by the greatest margin since 2009.
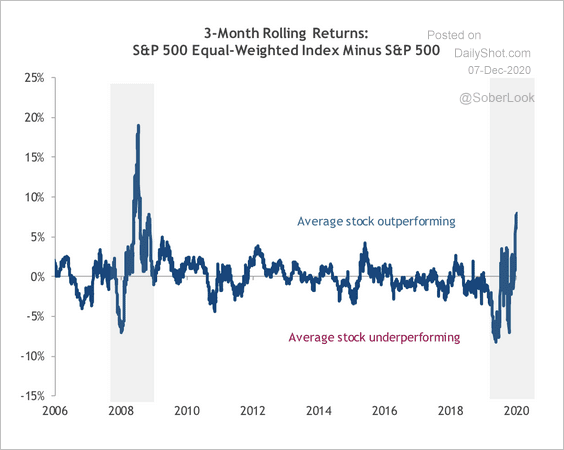 Source: SunTrust Private Wealth Management
Credit
1. US high-yield bond returns are not yet extreme versus investment-grade.
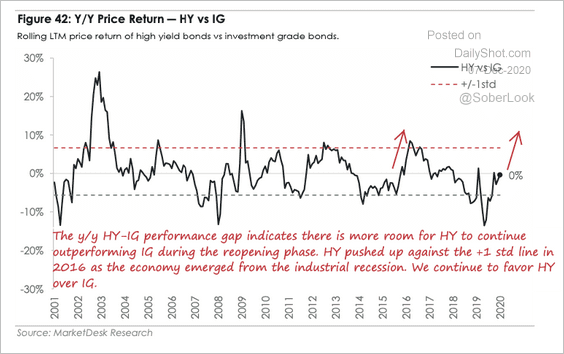 Source: MarketDesk Research
2. US securitized products on dealer balance sheets have dropped by $17 billion since March.
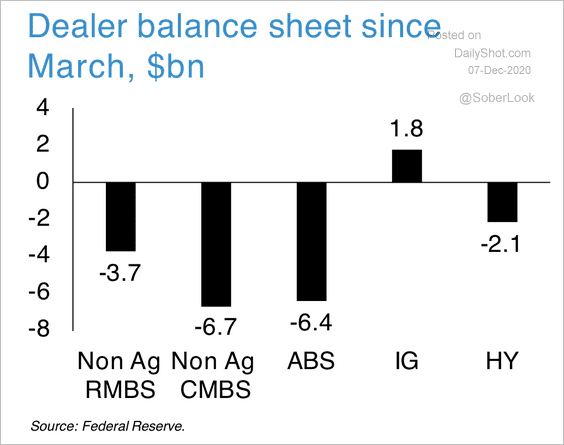 Source: Deutsche Bank Research
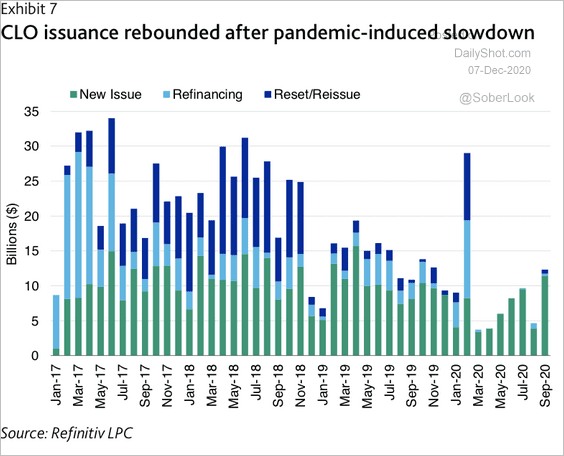
3. CLO issuance rebounded over the past few months.
 Source: Moody’s Investors Service
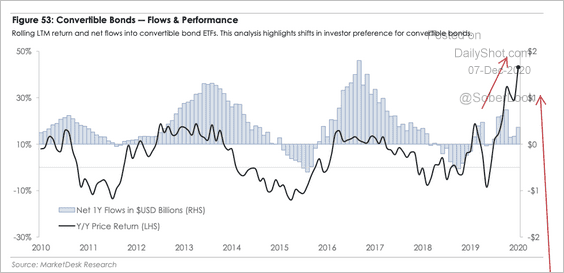
4. Convertible bonds are experiencing a resurgence as investors search for a combination of higher yields and equity market exposure, according to MarketDesk Research.
 Source: MarketDesk Research
Global Developments
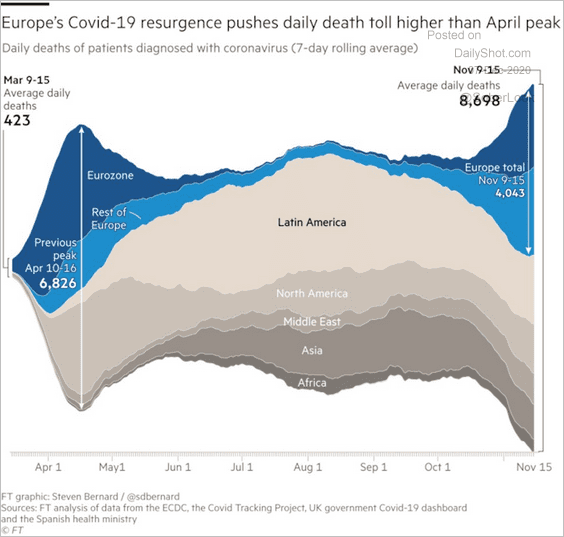
1. Here is the regional breakdown of COVID-related deaths.
 Source: @westermangroup
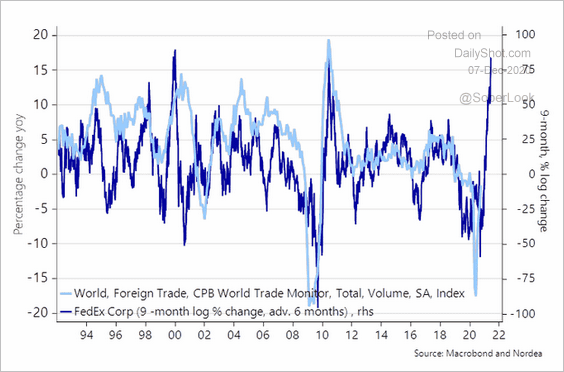
2. FedEx’s performance points to gains in trade.
 Source: @AndreasSteno
3. This chart shows how speculative accounts are positioned in currency futures.
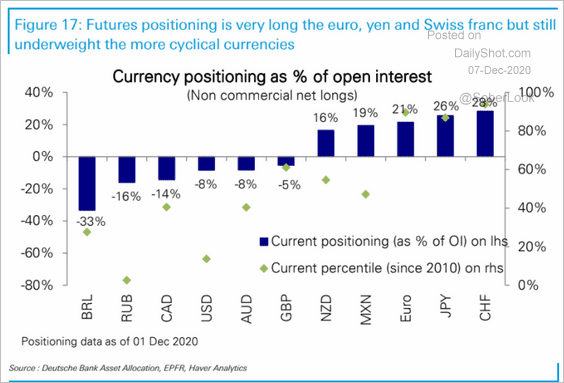 Source: Deutsche Bank Research
4. Here is a look at large-cap equity performance this year.
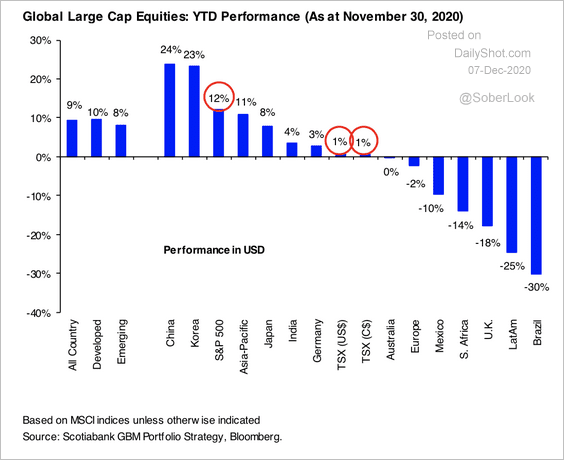 Source: Hugo Ste-Marie, Portfolio & Quantitative Strategy Global Equity Research, Scotia Capital
——————–
Food for Thought
1. Tesla’s market value vs. the next four largest automakers combined:
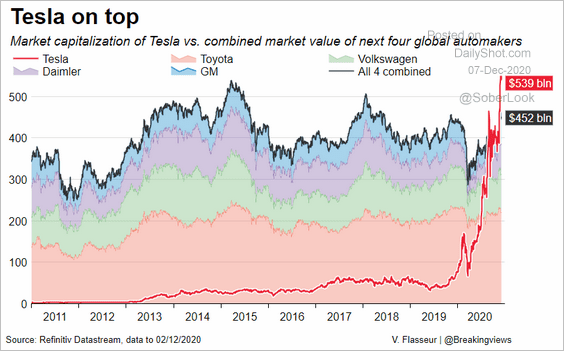 Source: @Breakingviews, @CGAThompson Read full article
2. Aircraft orders (Boeing vs. Airbus):
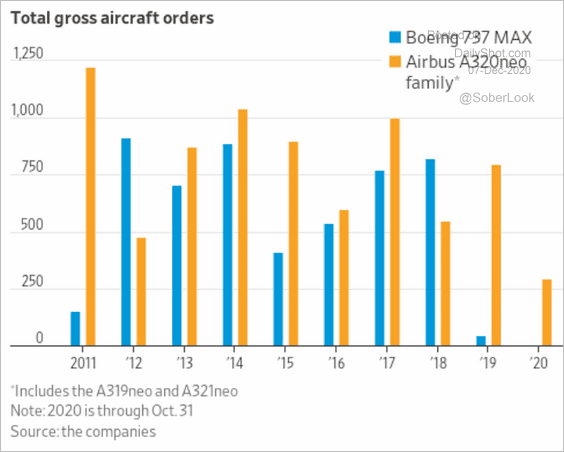 Source: @WSJ Read full article
3. Global ad spending:
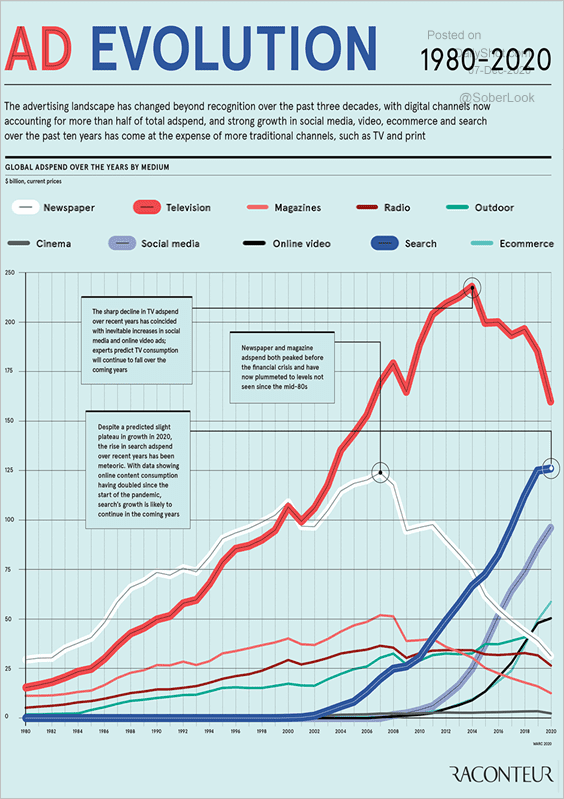 Source: Visual Capitalist Read full article
4. The largest US banks:
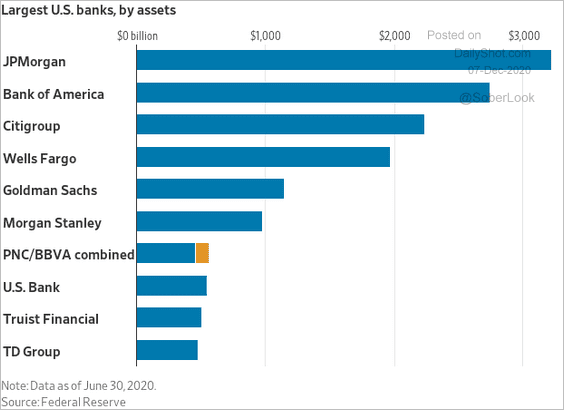 Source: @WSJ Read full article
5. The movie industry:
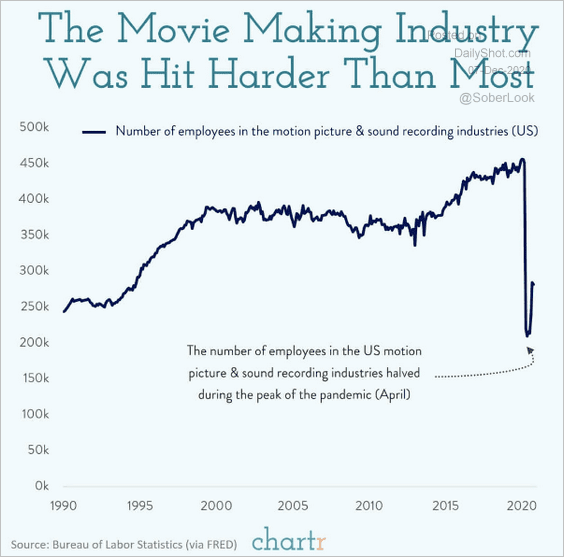 Source: @chartrdaily
6. US household debt by product and age:
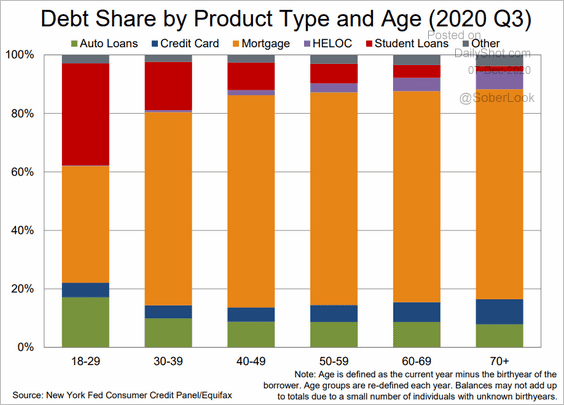 Source: Federal Reserve Bank of New York
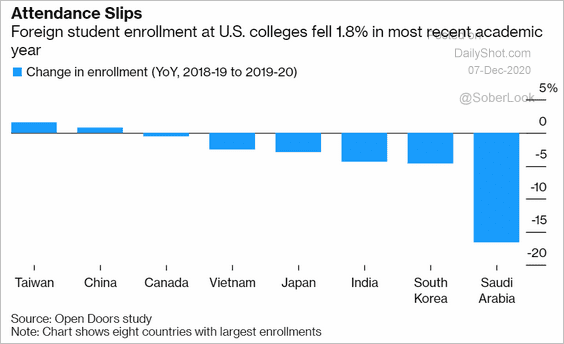
7. Foreign enrollment at US colleges:
 Source: @business Read full article
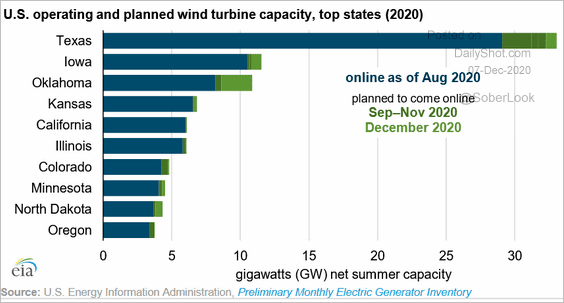
8. Wind turbine capacity:
 Source: @EIAgov Read full article
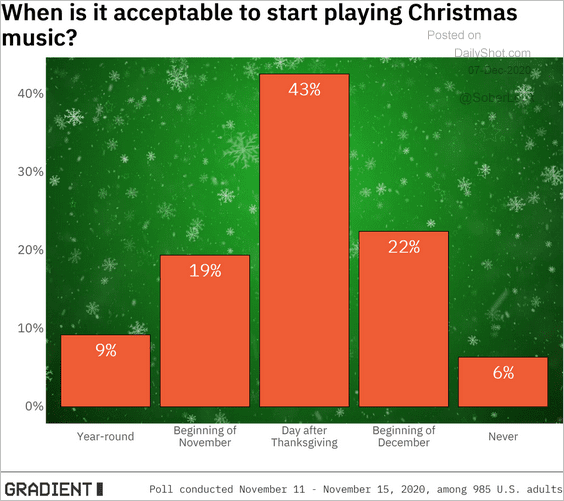
9. When is it acceptable to start playing Christmas music?
 Source: Data Is Beautiful
——————–